Economic Crosscurrents: From Eddies to Whirlpool Risk
The 2025 economy was impacted by rapid, variable, and sometimes short-lived changes to tariff policies. These resulted in large quarter-to-quarter swings in imports that had an outsized impact on quarterly real GDP growth rates throughout the year. Real GDP growth in the first quarter of 2025 was -0.6 percent, driven by a surge in imports (which decrease GDP) ahead of the implementation of tariffs that contributed -4.7 percentage points to growth in the quarter, fully offsetting growth in other sectors.
In the second quarter of 2025, year imports plunged as tariffs were implemented and imports contributed 5.0 percentage points to overall real GDP growth of 3.8 percent that quarter. In the first quarter of 2026, the Supreme Court overturned those tariffs implemented via the International Emergency Economic Powers Act and once again imports jumped, reducing real GDP growth by -2.6 percentage points.
The result has not been a smooth economic flow, but crosscurrents that create temporary distortions — economic eddies — in growth, hiring, prices, and investment.
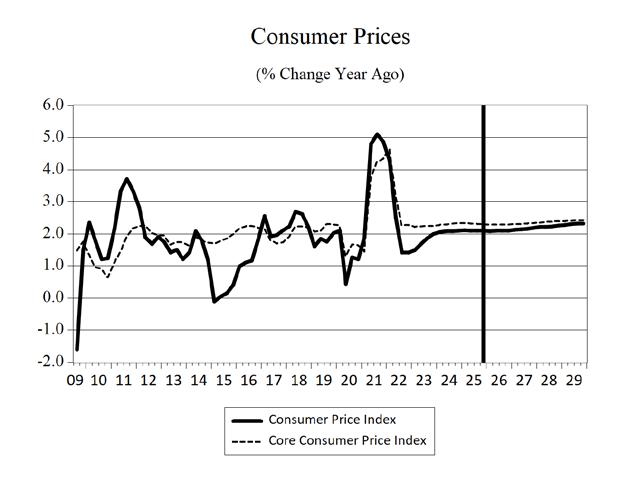
International trade is not the only economic current buffeting real GDP growth. The ongoing conflict with Iran has introduced a new energy-price shock. Oil markets now swing with each positive or negative development related to the conflict, its severity, and its potential duration. This has boosted energy prices and the consumer price index, putting strain on those households that are still coping with the COVID-era peak rate in this cost-of-living index, which hit a 40year high.
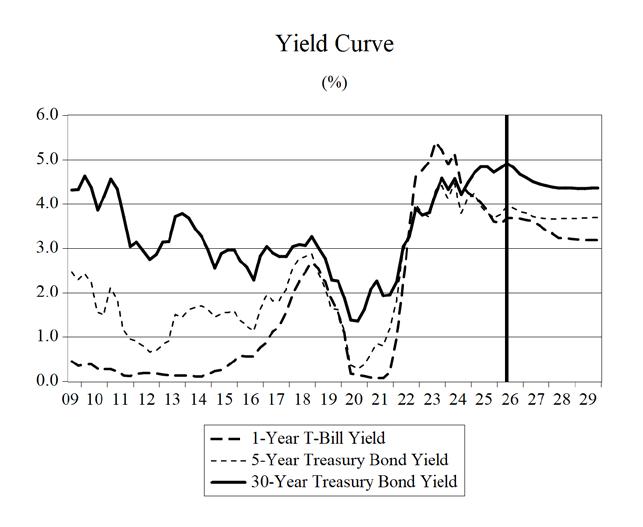
Concerns about inflation have also sent longerterm interest rates higher with the 10-year treasury bond up half a percentage point since the start of the Iran conflict and 30-year fixed-rate mortgages at the
highest rate since last summer.
There is also a change in leadership taking place at the Federal Reserve Bank. Kevin Warsh is replacing Jerome Powell as Chairman, with Powell taking the unusual step of remaining on the board of governors after his Chairmanship post has expired. Given current economic conditions and the Trump administration’s demands for interest rate cuts, the new Fed Chair is in a difficult spot with political forces and economic data pulling in opposite directions.
If all this short run turbulence were not enough, the economy is experiencing structural change and economic disruption of uncertain magnitude driven by artificial intelligence (AI.) Reminiscent of the dotcom era of the 1990’s there are currently hundreds of billions of dollars being invested into data centers, computer chips and infrastructure to support this technology and startup companies in this space. Layoffs have been happening and some companies are pointing to AI as the reason for such moves. While it is not clear that all the lost jobs are being directly replaced by AI, this has led to a shifting of resources from labor to AI investments. AI is also impacting the labor market in other ways as companies are delaying recruitment to understand how this technology could affect staffing needs. This is affecting younger and entry-level workers.
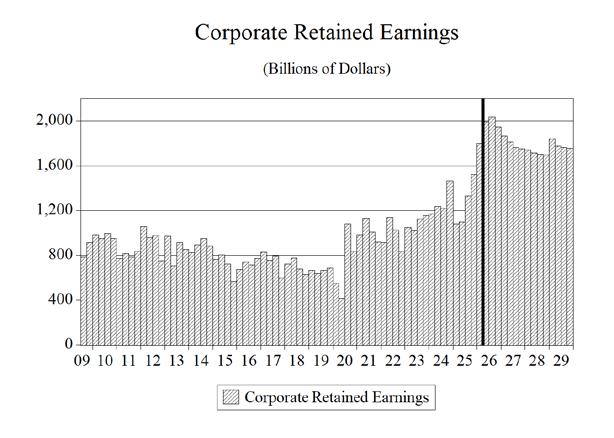
Even with all that is happening in the economy and the uncertainty that is accompanying it, stock market indices that are forward looking in their nature, have recently been setting new highs. This may be driven by expected productivity boosts from AI, ongoing strength in corporate profits, deficit spending, overall consumer spending displaying some resiliency, and the whole tariff situation being viewed as temporary in nature.
The flow of the U.S. economy has been impacted by the coming together of all these economic currents creating turbulence in economic growth from quarter to quarter as the underlying structure of the economy evolves to reflect investment and usage of AI.
Just as when rivers and streams intersect and flow over the underwater structures, these economic forces have created labor-market distortions characterized by slower hiring, delayed recruitment decisions, and a gradually rising unemployment rate. The housing market with affordability issues and higher mortgage rates is another drag. The Iran conflict and its impact on energy prices and the increasing possibility of downstream impacts on other consumer prices has middle- and lower-income households feeling the undertow as they struggle to keep up with the cost of living.
Eddies in a river are a circular flow of water generally weak and slow moving in nature, but a whirlpool is a larger, stronger, violent. and more dangerous form of an eddy that can pull objects inward and downward. The risk that the current eddies in the U.S. economy could combine or transform into a whirlpool that could pull the economy into a recession is increasing and at the center of that potential vortex might be the conflict in Iran.
ANXIOUS INDEX
Recession Fear Rises Amidst Iran Conflict
The most recent release (second quarter of 2026) of the Survey of Professional Forecasters by the Federal Reserve Bank of Philadelphia states that the forecasters surveyed for the publication put a 25.1% chance that a decline in real GDP will occur in the third quarter of 2026. This is the first increase in the anxious index following a multi-quarter decline from a tariff-inspired spike in anxiety that
occurred during the second quarter of 2025.
This increase in concern about a near-term decline in real GDP growth, though not as large as the tariffdriven rise, reflects concern about the impact of the Iran conflict on the U.S. economy.
One section of the Survey of Professional Forecasters asked panelists to estimate the probability that real GDP would decline in the quarter in which the survey is taken, as well as the probability of a decline in each of the following four quarters. The anxious index is the estimated probability of a decline in real GDP in the quarter after a survey is conducted. In the survey taken in May for the third quarter of 2026, the index stands at 25.1, meaning forecasters believe there is a 25.1% chance that real GDP will decline in the third quarter of 2026. This is up from 21.0% in the survey conducted in the first quarter of 2026 and but down from 36.1% from the index reading in third quarter of 2025.
The graph below plots the historical values of the anxious index, where the gray bars indicate periods of recession in the U.S. economy. The current level of the anxious index is slightly more than 7.3 points higher than the average level during the 2009-2020 economic recovery (13.63).
Figure 1:
GDP OUTLOOK
The high level of uncertainty in the economy with the rapid pace of tariff activity in the first year of the Trump administration, coupled with the government shutdown, caused growth to decelerate in 2025 to 2.1%. The war in Iran has introduced an entirely new layer of uncertainty to the economic outlook on top of the Supreme Court ruling on the 2025 tariffs. How impactful this uncertainty will be is a function of the length, severity, and collateral damage of America’s conflict with Iran. But at this juncture, consequences have already had an adverse impact.
Persistent large deficits at the federal level continued to fuel economic growth through the end of 2024. The size of these deficits remains high and will support slowing GDP growth despite the longer-run risk of the national debt.
The eventual end of trade-related uncertainty and hopefully an end to the Iran conflict should help carry the economic expansion through the end of our forecast horizon — albeit with slower economic growth as consumers will be tapping the brakes this year and next on spending while working at repairing their inflation-damaged balance sheets.
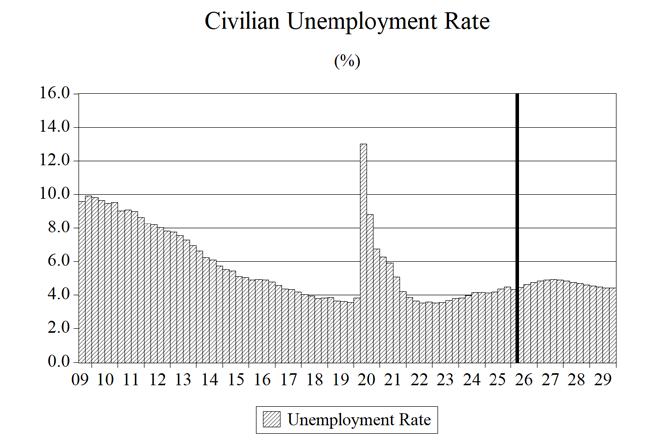
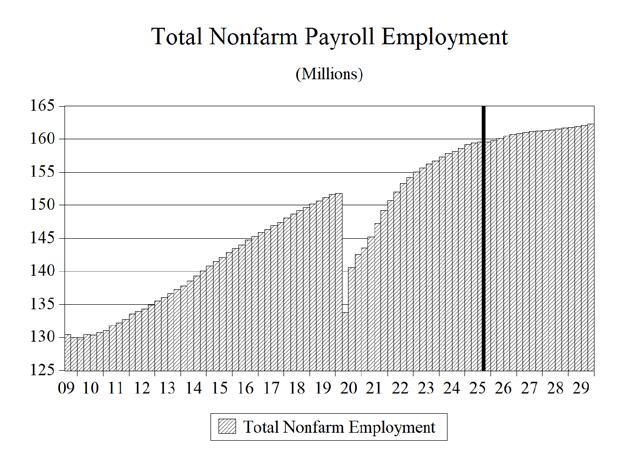
The slower GDP growth in 2025 and beyond will impact the labor market. The unemployment rate will gradually rise through 2027, before drifting down to 4.5% through 2029. Job growth is slowing to a trickle and could show a slight contraction in 2027 as the economy essentially hovers around full employment.
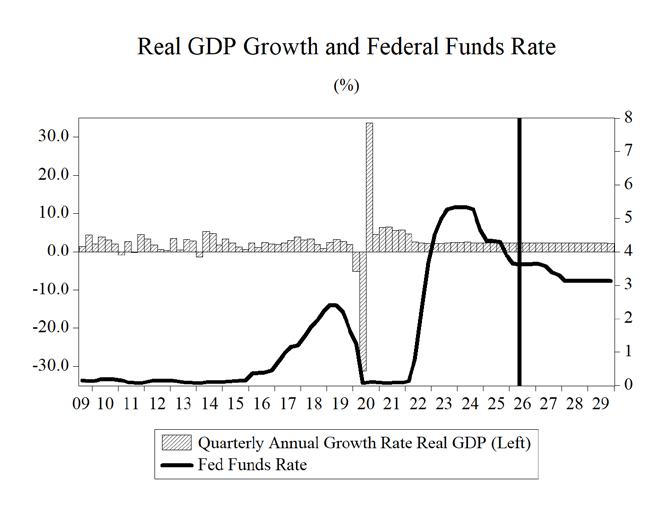
There will be another recession, and it could be borne of the uncertainty persisting in the nation’s capital and geopolitical conflict and tensions. We are not predicting that it will come to pass in the next several years. In the meantime, we are anticipating a softening of real GDP growth, falling from 2.1% in 2025 to 1.8% in 2026, slowing to 1.7% in 2027, picking up to 2.4% in 2028, and then ticking down to 2.0% in 2029.
CONSUMER SPENDING
In the COVID-policy era, U.S. consumers were hard hit by the highest inflation in 40 years, which persisted at these elevated levels for more than two years. Although wage and salary growth was occurring during this time, the rising cost of living wiped away those wage gains and even more purchasing power. Starting in the second quarter of 2021, real median weekly wage and salary growth turned negative.
This means that even though workers had more dollars in their paychecks, the amount of goods and services that they could purchase with those dollars continued to decline for more than two years. Wallets were fuller, but grocery carts were less full.
The shortfalls in consumers’ budgets were patched by savings from the COVID-lockdown era and stimulus checks, but when those ran out, by using credit card debt. However, these patches to consumers’ budgets were not a permanent solution to the loss of purchasing power and could only hold for so long before spending was impacted.
Inflation hit middle- and lower-income households hard. Roughly two thirds of consumer expenditure of these households goes to food, shelter, and transportation; all three of these categories saw outsized price increases over this two-year span.
In 2024 and 2025, thanks to a still-stable labor market and retreating inflation, growth in real wages turned positive. This enabled consumers to make some repairs to those inflation-damaged household budgets.
The Iran conflict, with the much higher energy prices that have come with it, have put a halt to this repair process.
Overall credit card debt which was drifting toward $1.0 trillion dollars in 2025. But in recent months, debt levels have begun to rise yet again closing in on $1.1 trillion. This will continue to constrain consumer spending growth over the next couple years.
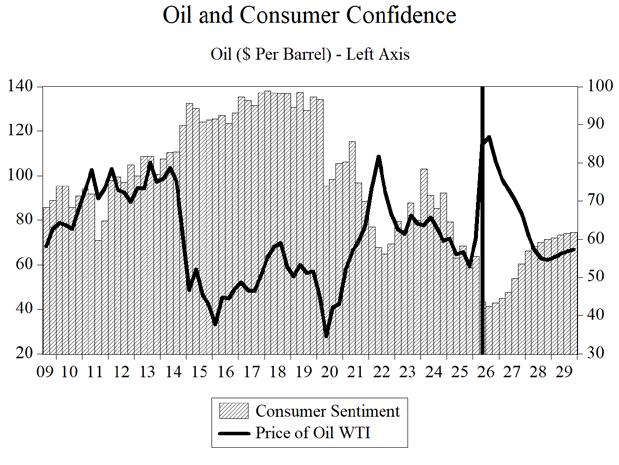
Consumer sentiment has been on a volatile path since hitting then all-time lows at the height of the COVID inflation crisis. Seeing paychecks starting to stretch further played a role in regaining confidence in households’ financial status, but the Iran crisis energy price spike has sent some measures of consumer confidence levels down to record lows, even below those of the Great Recession and COVID era.
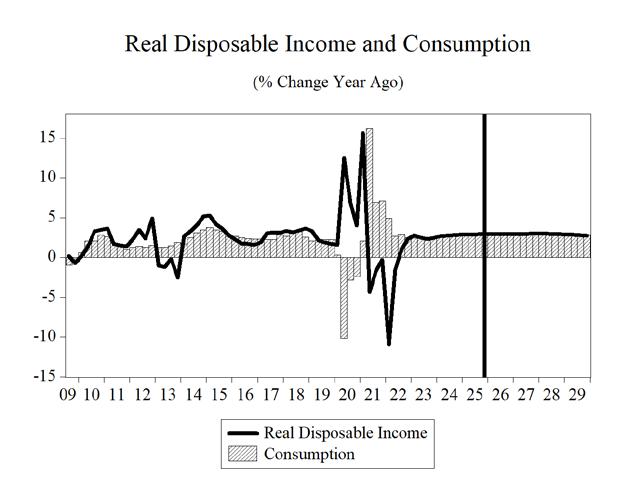
COVID-19 lockdowns caused spending growth in 2020 to contract by 2.5%. Consumption spending growth slowed from 8.8% in 2021 to 3.0% in 2022, and then to 2.6% in 2023, before ticking up to 2.9% in 2024, and then easing to 2.6% in 2025. During 2026-2029, real consumer spending growth is expected to average 2.2%. Consumer spending growth will be dampened by the economy slowing, high energy prices, and depressed consumer confidence, with consumer spending growth of 1.8% in 2026 and 1.7% in 2027, before ticking up to 2.4% in 2028 and 2.7% in 2029.
INVESTMENT
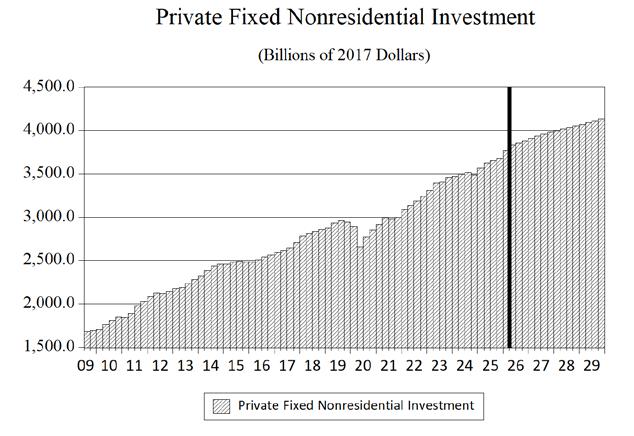
Higher interest rates and increased levels of policy uncertainty combined to slow investment spending in 2024, before it accelerated in 2025 to 4.1%. Growth will accelerate in 2026 to 5.6% fueled by massive investment in AI infrastructure before decelerating under the weight of high uncertainty, higher interest rates, and slower economic growth. The rate of growth in the final year of our forecast slips down to 2.0%. Businesses will continue to try and solve the tariff puzzle, policy changes, the Iran conflict, and, importantly, how long this environment might remain in place. This uncertainty will impact investment spending growth until answers to these questions become clearer.
In 2020, non-residential investment spending contracted by 4.6%, then rebounded to 6.2% growth in 2021 and 6.5% growth in 2022; then jumped to 7.3% in 2023 before sliding to 2.9% in 2024 and back to 4.1% in 2025. During 2026-2029, we expect average growth in non-residential investment
spending to be 3.1%, decelerating from 5.6% in 2026 to 2.0% in 2028, and slipping to 1.9% in 2029.
Spending growth on equipment and software jumped from 3.5% in 2024 to 8.3% in 2025 and will be 8.4% in 2026. Average growth in this type of investment spending is expected to be 3.2% over the 2026-2029 timeframe, after slipping to 1.0% in 2028. Subcomponents of this sector such as information processing equipment and computers and peripherals have seen outsized gains in 2025 and will again this year. The two-year average growth rates for these sectors were 22.8% and 46.4%, respectively.
In 2023, as air travel continued to grow in the postlockdown era, aircraft purchase growth surged to 21.3% in 2023 and 19.1% in 2024, before accelerating with tariff-fueled growth of 47.2% in 2025. Higher energy costs and tighter consumer budgets will dampen this spending going forward. Over the 20262029 period, spending on aircraft is expected to grow by an average of -1.9%.
Falling oil prices through 2025 have pushed the current U.S. rig count to 558, which is 43 rigs fewer than a year ago. Rig counts were over 1,000 as recently as 2019. The conflict in Iran has already sent oil prices higher, and disruptions in the Strait of Hormuz could worsen the spike. This could lead to more rigs in the U.S. if the higher prices continue to persist.
Investment in mining and petroleum equipment growth plunged to -38.7% in 2020 as oil prices crashed. Investment will average 11.1% growth per year during 2026-2029, including a surge to 30.7% in 2026 and 2027 because of regulatory restraints being eased and elevated oil prices.
Business non-residential structures investment growth contracted by 9.2% in 2020 and then accelerated to 3.5% in 2022. After growing 16.7% in 2023 and 1.1% in 2024, non-residential structures spending contracted 5.3% in 2025. It will grow at an average rate of just -0.1% during 2026-2029.
Higher interest rates slow investment spending. The Fed temporarily switched gears to go into recession-
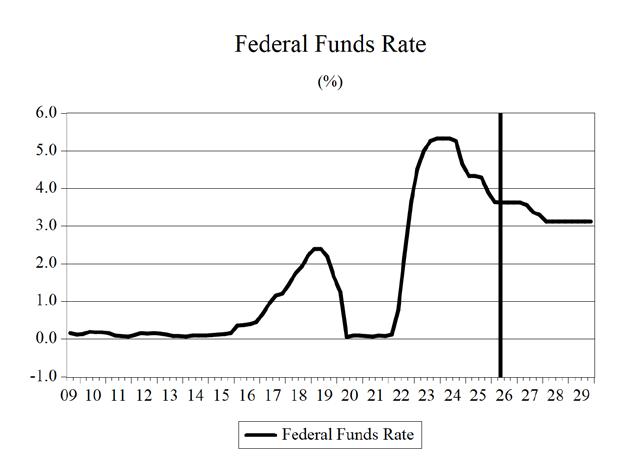
fighting mode in Fall 2024, cutting short-term rates in September. But this resulted in long-term rates to rise in response to those cuts. With inflation closer to the target level, the Fed resumed interest rate cuts in Fall 2025 and but paused again. With a change in the leadership of the Federal Reserve, inflation still above the Fed’s target rate of 2% further complicated by the conflict in Iran, the monetary policy picture is less clear. If inflation data drives the decision-making at the Fed, it seems unlikely that we will see any interest rate cuts this year and potentially not until 2027. The Fed cutting short-term interest rates before inflation is under control runs the same risk of repeating what happened in 2024.
Business spending on industrial equipment will grow at an annual average rate of 4.6% from 20262029. Investment spending growth on computers and peripherals will average 3.0% during 20262029, after 43.8% of growth in 2026 fueled by the rapid investments into artificial intelligence and 49.0% growth in spending that was accelerated to avoid higher tariffs. Spending on communications equipment is expected to grow at an average annual rate of 3.0% during 2026-2029, after spending in 2025 and 2026 expanded at 10.9% and 15.4% — also boosted by tariff avoidance and AI.
Residential fixed investment growth peaked at 10.6% in 2021. Growth will average 1.3% during 2026-2029. Higher prices combined with higher mortgage rates eroded demand and caused investment spending to contract by 8.1% in 2022 and 7.8% in 2023, before growing 3.2% in 2024 and contracting again in 2025 by 2.2%.
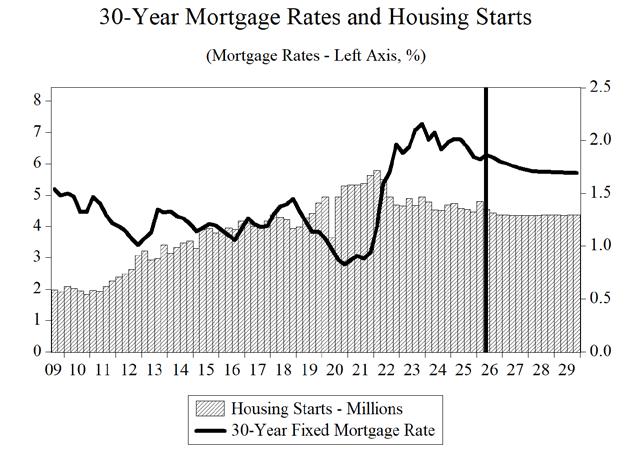
We expect housing to stabilize after a slow deceleration that commenced in 2023 and continued through 2027. After reaching 1.6 million in 2021, housing starts fell to 1.37 million in 2024 and 1.35 million in 2025 and will drift lower to 1.29 million in 2027. They will continue to hover around this level through 2029. High home prices and a slowing economy are headwinds, and the expected decline in mortgage rates as the Federal Reserve loosened
monetary policy in 2024 did not materialize, as longterm interest rates moved in the opposite direction. The conflict with Iran has put upward pressure on prices and longer-run interest rates that will dampen demand.
The ongoing shortage of housing in many parts of the country will help fight against these headwinds and provide support for home building at this slightly slower pace. Further increases in housing demand seem unlikely to occur in the near term.
GOVERNMENT SPENDING
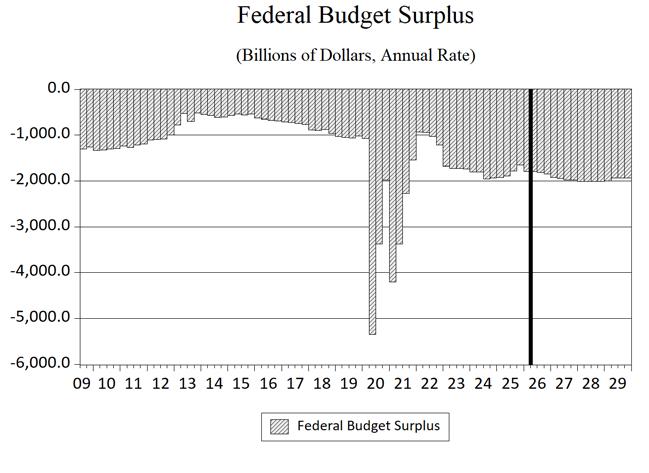
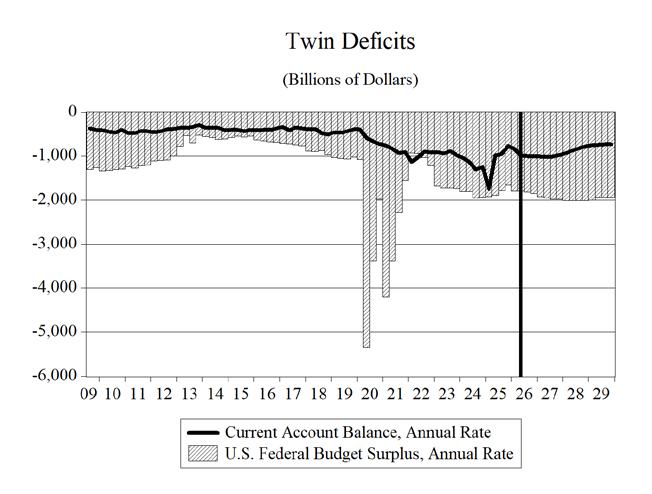
Federal government spending continues to be devoid of any policy discussions or debates about priorities, problems, objectives, or anything more than a passing reference to deficits and the national debt, let alone talk of a balanced budget. Replaced instead with series of continuing resolutions and government shutdowns or threats thereof. Unsurprisingly, public finances are still adrift, and deficits climbed back to the $1-trillion mark in 2019 even before the massive ongoing wave of deficit spending triggered by the policy response to the pandemic. The current federal budget deficit is more than $1.66 trillion.
Did the cuts made by the Department of Government Efficiency (DOGE) curb this deficit spending? Unfortunately, to date, few proposed DOGE reductions have been codified legislatively. and instead Congress has maintained the status quo of one-and-a-half-trillion-dollar deficits and higher.
Federal government spending growth was 3.8% in 2019 before jumping to 6.3% in 2020. During the 2026-2029 period, federal government spending growth will decline modestly, growing at an annual average pace of -0.2%. Over the same period, state and local governments will see spending growth at an average rate of 0.4%.
It seems unlikely that Congress will undertake the required cuts to the deficit soon, and the One, Big, Beautiful Bill Act was another delay in addressing this issue. Thus, we are still projecting deficits
through 2029 that will consistently average over $1.9 trillion. The amount that the projected deficits will add to the national debt over the next four years will be $7.7 trillion, pushing the total national debt to more than $46.8 trillion and a debt-to-GDP ratio of approximately 127%. If interest rates rise in the economy, the burden of servicing this debt will continue to rise as well. Slower-than-projected economic growth or a recession would also push projected deficits higher, though the possibility of faster-than-projected economic growth and interest rate cuts could help mitigate the growth of these deficits and the debt-to-GDP ratio.
Depending on the length and intensity of the Iran conflict, military expenditures could further widen the already large deficit as the administration has requested a $1.5 trillion dollar defense budget — a more than 50% increase from current levels.
Currently, the national debt is over $39.1 trillion and rising. This represents a debt of more than $355,963 per taxpayer and $113,930 per citizen and a 121.8% debt/GDP ratio. The unfunded liabilities of the U.S. are even more troubling. These include Social Security, Medicare Parts A, B, and D, and Federal debt held by the public and federal employee and veteran benefits, representing more than $123.2 trillion in liabilities, boils down to $354,389 per person.1
NET EXPORTS
Uncertainty regarding and the implementation of tariffs levied against U.S. trading partners riled the international sector of the U.S. economy in 2025. Last year we witnessed wild swings in the levels of imports quarter to quarter that drove swings in real GDP growth.
Some of the tariffs have now been overturned by a ruling of the U.S. Supreme Court, but there may be other legal channels through which the
administration could pursue these policies. The ruling by the Supreme Court raises additional questions and extends the shroud of uncertainty that has been hanging over trade in the economy for more than a year.
Tariffs are implemented by countries for a variety of reasons. The Trump administration is primarily using tariffs as a lever to get other countries to make changes that are to the benefit of the United States or to bring about changes to other barriers to trade that foreign countries may be using to restrict American companies access to their markets. But the Supreme Court ruling, lawsuits over tariff rebates, and the alternative legal paths the administration might pursue in the wake of this ruling ensure that the international sector of the U.S. economy will remain under this ambiguity for the near future.
A longer-run goal of this tariff policy appears to have been incentivizing U.S. firms to reshore production that had been moved overseas previously. It is not clear how successful these efforts will be, particularly after the Supreme Court ruling and the possibility that these tariffs may not be in place in the long run. This is a general problem of recent decades with the federal government implementing policies via executive orders as opposed to the legislative process.
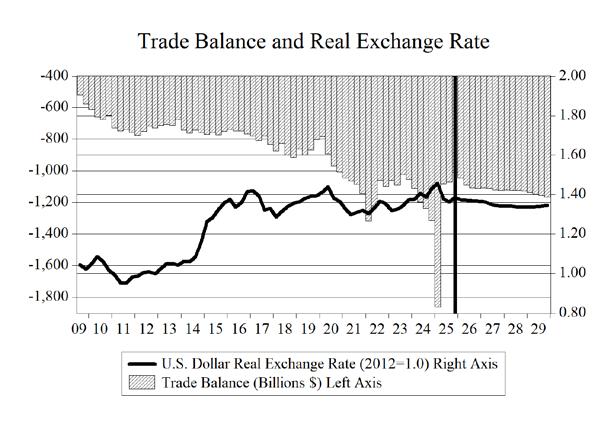
A stronger U.S. dollar boosts imports and reduces exports by making our goods and services more expensive to foreigners while at the same time making imported goods and services less expensive to U.S. consumers. This results in a worsening of the trade deficit, which is the difference between the dollar value of exports and the dollar value of imports. The opposite is true when the dollar undergoes depreciation.
However, the effects of currency changes take time to work on the actual quantity of trade flows, resulting in what is known as the J-curve effect on net exports. Because of this effect, an appreciation (depreciation) of the dollar initially decreases (increases) the trade deficit before eventually
increasing (decreasing) it. Why? Importers and exporters do not enter contracts based on the total dollar value of the transaction, but rather on the actual quantity of goods to be shipped (video game consoles, flat-screen televisions, etc.). As the exchange rate varies in the short run, the values of these shipments and, thus, net exports vary as well. Over time, however, the quantities do adjust in response to the exchange rate fluctuations, and this is what gives rise to the J-curve effect.
The shifting landscape on tariffs can overwhelm the exchange rate effects on prices for international trade and as a result, despite the expectation of a weaker dollar in the next few years, we anticipate a mild worsening in the trade balance.
Overall, real export growth has resumed, after a sharp contraction in 2020, and will continue through the end of our forecast horizon, after accelerating sharply in 2021 and 2022. The large appreciation of the dollar in 2022 caused a deceleration of this growth in 2023 and into 2024. Real import growth also experienced a strong contraction in 2020, but growth recovered before turning slightly negative again in 2023. Import growth resumed in 2024 and will accelerate in 2026 after slowing in 2025. Evolving and uncertain trade policy issues, a slowing economy, and increased geopolitical uncertainty will continue to weigh on the foreign sector. Nevertheless, real export growth from 2026-2029 will average 3.8%, while real import growth will average 3.5% over the same period.
Real net exports of goods and services will average over -$1.57 trillion during 2026-2029, with the trade balance worsening slightly in 2026 in response to tariffs after the Supreme Court ruling, before the trade deficit rises to -$1.62 trillion in 2029.
UNEMPLOYMENT
The national unemployment rate (U-3) in April 2026 stood at 4.3% — down 10.5 percentage points from the April 2020 reading of 14.8%, which was the
highest level since the Great Depression era — but up 0.1 percentage points year-over-year. The April 2026 labor force participation rate went down to 61.8% from the April 2025 rate of 62.6%. The labor force participation rate remains below pre-pandemic levels of 63.3%.
The Bureau of Labor Statistics (BLS) produces alternative measures of labor market weakness, including the broadest measure of unemployment (U6). U-6 accounts for discouraged workers (currently 475,000 workers), underemployed workers — working part-time but not by choice (currently 4.94 million workers) — and workers who are marginally attached to the labor force — those who have looked for work in the past 12 months, but are not currently looking, yet indicate a willingness to work (1.79 million workers). None of these more 7.2 million workers are accounted for in the April headline unemployment rate of 4.3%.
U-6 stands at 8.2% as of April 2026, up 0.4 points from the April 2025 level, and up 1.0 percentage point from the start of 2024. The current level of U-6 is at the level it was in November 2021. U-6 was stuck in double digits for more than seven years in the wake of the Great Recession and spent more than a year above 10% following COVID-19. It had been in single digits for 51 consecutive months, beginning in December 2015, before surging during the lockdowns in April and May of 2020, hitting 22.9% in April and 21.1% in May. The current streak of single digit U-6 now stands at 58 months.
The spread between U-6 and U-3 measures of unemployment sits at 3.9 percentage points and is 3.5 points below the peak spread of 7.4 points that took place in September 2011.
Table 1. Annual Summary of the Long-Term Forecast of the U.S.
Table 1. Summary of the Long-Term Forecast of the U.S.
Measures
Table 2. Real Gross Domestic Product