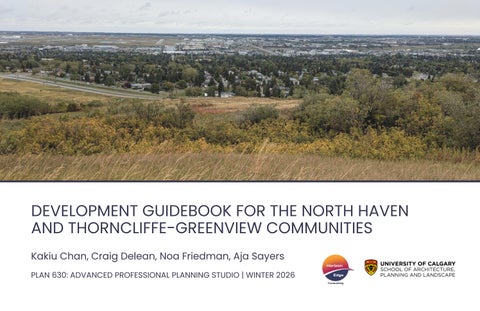
DEVELOPMENT GUIDEBOOK FOR THE NORTH HAVEN AND THORNCLIFFE-GREENVIEW COMMUNITIES Kakiu Chan, Craig Delean, Noa Friedman, Aja Sayers Horizon
PLAN 630: ADVANCED PROFESSIONAL PLANNING STUDIO | WINTER 2026
Edge Consulting
ACKNOWLEDGEMENTS TEAM KAKIU CHAN, CRAIG DELEAN, NOA FRIEDMAN, AJA SAYERS
INSTRUCTOR PROF. FRANCISCO ALANIZ URIBE | UNIVERSITY OF CALGARY
STEERING COMMITTEE MEMBERS THORNCLIFFE-GREENVIEW COMMUNITY ASSOCIATION: ALISON ABBOTT, PATRICK SAUNDERS, STACEY MCDADE NORTH HAVEN COMMUNITY ASSOCIATION: CELINA BAHARALLY, MERITT KULARATNE, KAREN BOUDEWYN CITY OF CALGARY: SCOTT THOMSON CIVICWORKS: NATAN STELFOX FEDERATION OF CALGARY COMMUNITIES: AFRAH REYES
COMMUNITIES NORTH HAVEN
THORNCLIFFE-GREENVIEW
2
TABLE OF CONTENTS INTRODUCTION
5
TEAM SITE CONTEXT BACKGROUND LEGAL FRAMEWORK INTERESTED PARTIES KEY COMMUNITY ISSUES METHODOLOGY SCHEDULE BUDGET
6 7 8 9 10 11 12 14 15
COMMUNITY ANALYSIS
16
URBAN MORPHOLOGY ENVIRONMENTAL ANALYSIS
17 22
BUILT FORM INFRASTRUCTURE
28 36
ENGAGEMENT
45
COMMUNITY WALKABOUT COMMUNITY WORKSHOP
46 48
DESIGN CONCEPTS AND POLICIES
50
LANDUSE
51 55 62 68 83
RESIDENTIAL NON-RESIDENTIAL
OPEN SPACE MOBILITY
3
OPEN HOUSE
103
REFERENCES
105
EXECUTIVE SUMMARY This project was undertaken as part of the Winter 2026 PLAN 630: Advanced Professional Planning Studio from the Master of Planning program at the University of Calgary. As an academic project, it is intended to simulate the planning process and should not be interpreted as an official City of Calgary document. The purpose of this studio project was to explore the process of community planning through
real-world application in collaboration
with the community associations of North Haven and ThorncliffeGreenview. As established communities with no recently updated local area
plan,
North
Haven
and
Thorncliffe-Greenview
present
an
opportunity to envision their development in the coming decades through the creation of a neighbourhood development and design guidebook that can inspire future interventions. This document can also serve as a basis for creation of an eventual local area plan. The development guidebook was informed by site visits, research, data analysis, and community engagement through a workshop and formal presentations to a steering committee. Feedback from the engagement and studio critiques was integrated into the final urban designs and interventions. The interventions and guidelines responded directly to identified issues and opportunities in the community, which addressed topics related to land use, open space, and mobility.
4
PART 1: INTRODUCTION
OUR TEAM Horizon Edge Consulting is a multidisciplinary urban design firm dedicated to future-focused city building approaches that emphasize sustainability, innovation, and health. We aim to bring together our passion for environmental stewardship with community well-being through strategic design approaches that address the built and social environment.
Horizon Edge Consulting
Aja Sayers
Craig DeLean
Noa Friedman
Kakiu Chan
Senior Planner
Lead Designer
Planner 1
Planner 1
Craig is an Urban Designer
With a background in health
Kakiu has a background in
science and experience in
Urban Studies and he is
the non-profit sector, Noa
passionate about sustainable
focuses on community-
development and
based initiatives and
transportation planning, with a
placemaking. Her work
strong ambition to shape more
integrates evidence-based
livable, connected, and
research with an
inclusive communities. Kakiu
understanding of social and
combines academic knowledge
health outcomes to support
with practical insights to explore
inclusive, people-centered
innovative solutions that
neighbourhood planning.
balance growth, accessibility,
Aja approach's urban planning through creative problem-solving, guided by a strong passion for sustainability and climate resilience in an increasingly dense world. At the heart of her work is a deep love for green spaces and creating places where people remain connected to nature.
with a background in Fine art and Visual Studies. With experience in material research, tactical urbanism, and public engagement, he aims to create solutions to complex communication barriers through considered and practical design principles.
and environmental
6
sustainability.
SITE CONTEXT
NW
NE
HUNTINGTON HILLS
CALGARY INTERNATIONAL 64 Ave NE
AIRPORT
NOSE HILL PARK
DEERFOOT BUSINESS CENTRE
Thorncliffe
14
St
NW
Dee
N
rfoo t Tr NE
SKYLINE
North Haven
WEST
Upper
Centre St N
4 St NW
HIGHWOOD
GREENVIEW INDUSTRIAL PARK
Jo
hn
La
ur
ie
Bl
vd
NW
McKnight Blvd NE
HIGHLAND PARK Greenview North Haven
Major Road
N
0
0.5
1Km
This project involved four adjacent established communities situated on the border
The community sits near several important destinations. One of these is Nose Hill
of the northeast and northwest quadrants of Calgary. The study area is bounded by
Park, a major naturalized area, and one of the largest urban natural parks in North
several major roadways, including 14 St NW to the west, John Laurie Blvd NW and
America. It is also adjacent to several nearby employment hubs including Skyline
McKnight Blvd NE to the south, and 64 Ave NE to the north. Two main streets, 4 St NW
West and Greenview Industrial Park, and the Calgary International Airport.
and Centre St N bisect the community from the north and south. Deerfoot Tr NE, another major city arterial road, lies not far to the east.
7
BACKGROUND Horizon Edge Consulting will focus on developing a comprehensive
North Haven emerged in the early 1960s as a residential community closely
guidebook which highlights planning frameworks that responds directly to
tied to the natural landscape at the base of Nose Hill Park. Today, residents
the priorities expressed by the community members of North Haven and
seek to accommodate Calgary’s continued expansion in a way that respects
Thorncliffe-Greenview
their strong sense of place and connection to nature, with support for gentle density alongside priorities for enhanced cycling and pedestrian safety and mature
improved access points to the park. The community is looking for solutions
landscapes, and a deep sense of community pride that must be thoughtfully
that allow for change while reinforcing the natural and social assets that
considered as the city continues to grow and change. Together, they present
define North Haven.
These
established
neighbourhoods
possess
strong
identities,
meaningful opportunities for context-sensitive planning that balances growth with the preservation of neighbourhood character and quality of life,
Both communities benefit from walking-distance access to Nose Hill Park,
with a focus on land use and development concepts, open space systems,
one of Calgary’s largest and most significant urban natural areas. This
and mobility and transportation.
proximity provides important recreational, environmental, and social benefits by supporting active transportation, outdoor recreation, and community
Early correspondence with community association members reveals unique
well-being; protecting and enhancing access to this regional green space
priorities for each community, shaped by their distinct histories and
remains a key consideration for long-term planning in both Thorncliffe-
established identities. Thorncliffe-Greenview, developed during Calgary’s
Greenview and North Haven.
post-war growth of the 1950s, has expressed a strong desire to maintain the character of their neighbourhood while thoughtfully addressing where and how future growth should occur. The community also includes parks in need of
reinvestment,
an
underutilized
industrial
area,
and
several
OUR STRATEGY
small
commercial districts that present opportunities for strategic improvement and revitalization.
Horizon Edge Consulting’s approach is grounded in collaboration, clarity, and long-term thinking. By balancing growth with preservation and aligning strategic planning with community values, this project aims to deliver a clear, implementable vision that supports Thorncliffe-Greenview and North Haven as complete, resilient, and thriving communities, now and into the future.
8
LEGAL FRAMEWORK Because Thorncliffe-Greenview and North Haven currently do not have Area Redevelopment Plans (ARPs) or Local Area Plans (LAPs), drawing on multiple strategies and policy documents is essential. Using these regional and municipal frameworks together allows us to create a new, locally grounded guidebook that addresses the challenges identified in the next section.
STATUTORY PLANS
NON-STATUTORY PLANS
The planning and redevelopment of Thorncliffe-Greenview and North Haven will
Non-statutory plans and strategies also provide guidance to ensure that
be guided by the established legal and policy framework of the City of Calgary.
community development is sustainable, resilient, and responsive to evolving city
This ensures that any recommendations and proposed strategies are aligned
priorities. These include:
with municipal objectives, statutory requirements, and best practices for sustainable community development.
Calgary Climate Strategy Pathways to 2050:
Key statutory documents that provide direction for planning in these
climate-resilient communities.
Outlines the city’s goals for reducing greenhouse gas emissions and building
communities include:
Complete Streets Guidelines: Informs mobility planning to enhance pedestrian, cycling, and transit networks.
The Municipal Development Plan (MDP): Establishes city-wide policies for land use, growth management, and urban form.
Parks and Open Space Strategies:
The Calgary Plan:
including access to regional amenities such as Nose Hill Park.
Guides the protection, enhancement, and connectivity of public green spaces,
Outlines long-term strategies for complete communities, sustainable growth, and infrastructure investment.
Community Sustainability and Urban Design Guidelines:
Land Use Bylaw:
integrating gentle density, and fostering quality public realm improvements.
Provide best-practice guidance for maintaining neighbourhood character,
Regulates zoning, permitted uses, density, and building form, providing the legal foundation for development approvals.
9
INTERESTED PARTIES The project is committed to working collaboratively with residents, community associations, and city administration to ensure diverse perspectives are heard and reflected in a shared, community driven vision for the area.
COMMUNITY MEMBERS Residents and community association representatives with a direct stake in neighbourhood change and development. North Haven Community Association Board and Development Review Committee Thorncliffe-Greenview Community Association Board Residents including homeowners, renters, seniors, families, and newcomers
PROJECT AND ACADEMIC PARTNERS Supporting the project through research, facilitation, and academic expertise to inform planning and engagement. University of Calgary School of Architecture, Planning and Landscape Federation of Calgary Communities as a facilitating organization
ADJACENT AND INTERESTED GROUPS Representing nearby communities, organizations, and businesses affected by or engaged in changes within the project area. Neighboring communities including Thorncliffe-Greenview, Cambrian Heights, Highwood, and Highland Park Nose Hill Park advocates and community garden volunteers Local businesses along Edmonton Trail, Centre Street, 4 Street, and nearby commercial and light industrial areas
10
KEY COMMUNITY ISSUES This project is committed to addressing key community issues by grounding decisions in local priorities, evidence, and equity, and by translating identified challenges into clear, actionable planning directions.
GROWTH AND HOUSING CHANGE
PUBLIC REALM AND OPEN SPACE
Both communities are responding to new forms of
Both communities see value in enhancing public
development and increased density.
spaces.
North Haven is interested in housing diversity such as
North Haven is interested in pocket parks,
accessory suites and small scale infill that supports
placemaking, tactical urbanism, and public art to
aging in place and young families while maintaining
strengthen community life.
neighbourhood character.
Thorncliffe-Greenview has a range of parks and
Thorncliffe-Greenview is seeing development types it
greenspaces that require better coordination and
has not historically experienced and is seeking clarity
long term vision.
on where increased density is appropriate.
ENVIRONMENTAL SUSTAINABILITY AND RESILIENCE
MOBILITY AND CONNECTIVITY Improving safety and access is a priority, particularly
Environmental considerations are also a growing
for vulnerable users.
priority across North Haven/Throncliffe-Greenview
North Haven highlights pedestrian and cycling safety
North Haven explicitly raises concerns about climate
near schools, community facilities, Nose Hill Park
resilience, drainage, tree canopy, and native
access points, and major barriers such as 14 Street
landscaping, reflecting its strong relationship to Nose
NW and John Laurie Boulevard, with interest in
Hill Park and natural systems.
improved connections to transit and Nose Creek
These themes are likely relevant across the broader
pathways.
study area, particularly where redevelopment
Thorncliffe-Greenview’s main streets and mixed use
pressure meets existing green infrastructure.
corridors also raise issues around traffic, walkability, and transit integration.
11
METHODOLOGY This section outlines our methodology to develop the requested urban
PHASE 2: ANALYSIS
development framework. It highlights our development approaches, procedures, important meetings, projected milestones, and deliverables that are to be
Building upon our initial research deliverables, Phase 2 aims to do extensive analysis of the open space,
achieved within 4 phases:
land use, and mobility factors that affect everyday living for residents. We will break up this phase into
1
2
3
4
Initial Research
Analysis
Design Draft
Final Design
Jan 12: Team Formation Jan 13: First Site Visit Jan 22: Walking Tour
Feb 26: Steering Committee Presentation
Feb 26: Steering Committee Presentation
Feb 5: Model Building Plan Meeting
March 6: Model Completion March 7: Community Workshop
Map Preparation
Site Analysis
Data Collection
Community Profiling
Walking Tour with community Leaders
Gap Assessment Model Building Plan
Opportunity and Gap Assessment to guide our design drafting phase. 2.1: Spatial Analysis
Apr 14: Dry Run Presentation Apr 17: Steering Committee Presentation Apr 18: Open House
A comprehensive analysis of the physical site will consider:
Apr 22: Final Report Submission
Design Conceptualization
Guidebook Completion
Model Building
Open House Preparation
Community Enagagement
three sections to analyze the physical space, the lived experience of the community, and an
Open space, green space, and pathway connections. Traffic, pedestrian scale safety, and walk-ability. Environmental analysis (topography, urban forest, ecological corridors, water systems, etc), The history and evolution of the community. Land use breakdown of current spatial community functions.
Project Report
Built form of both housing and critical infrastructure (roads, parks, lighting, solar panels, etc) A curated breakdown of relevant policies or recommendations from urban framework documents
PHASE 1: INITIAL RESEARCH
2.2: Community Profiling
Phase 1 is concerned with the development of a shared understanding of the project and its scope. This
A socio-demographic breakdown of the people and lived experience within the site will include:
can be achieved through creating a foundational toolbox to guide our project trajectory and build a comprehensive understanding of the area. This is to ensure deliverables that are representative of all parties and organizations involved.
Relevant community statistics such as census numbers, housing tenure, community incomes, etc. Social or cultural data such as spoken languages, protected groups, or immigration status. Housing mobility and living affordability.
1.1: Map Preparation and Data Collection
Food security and social programming,
To reach this understanding, we will create a foundational repository of the site’s qualities and existing data to operate from going forward. This phase’s task-list will include:
Healthcare and educational opportunities. Meeting of everyday needs such groceries and other services. 2.3: Opportunity and Gap Assessment (Completion by Feb 20th)
Base map creation.
An assessment that synthesizes all of our collected information, data, and understandings into an
Site photo inventory and curation of relevant landmarks and places. A collection of foundational urban statutory and non-statutory framework documents. This includes municipal scale plans, neighbourhood guides, reports, and interested party statements.
articulate report will identify the assets, opportunity, and gaps in urban quality of the communities. This will become a foundational guiding assessment for our design interventions as we strive to better meet the needs of those who call North Haven and Thorncliffe-Greenview home.
1.2: Community Walking Tour (Jan 22)
2.4: Model Building Plan (Feb 5)
To aid in our understating, we will attend a walking tour with community leaders. Their knowledge
Based on our community understanding and analysis, this is the best time to formulate a plan for our
regarding the area’s qualities and lived experience will inform our project’s outcome by directly
community model. As our primary community engagement tool, the model’s scale, material properties,
highlighting the area’s assets and areas of improvement.
timeline, and pricing to assure it is an effective communication device.
12
METHODOLOGY PHASE 3: DESIGN DRAFTING
PHASE 4: FINAL DESIGN
Prioritizing our Opportunity and Gap Assessment from Phase 2, we will initiate the process of
After meeting with the community and our Steering Committee, our final phase will be focused on
conceptualizing design solutions tailored for the community, paying particular attention to
finalizing and presenting a comprehensive urban development guidebook that offers actionable and
implementation scale and community context. This will take the form of either Master Plans, node
context-based solutions. This should be an evidence-based document grounded in precedent and
plans, best and highest use recommendations, and other visual maps and aids that prioritize the
community feedback, written in plain language as to be actionable and concise so developers and
topics of open space, land use, and mobility. The design process will be guided and refined through
community members can envision a shared path forward.
Steering Committee suggestions and a public engagement workshops.
4.1: Guidebook Completion (Originally set for April 13, was completed April 17)
3.1: Design Conceptualization
The completion of a guidebook to communicate our design solutions will be achieved. This guide will
Based on feedback from our interested party meetings, we will begin focusing our design interventions and urban recommendations. The design drafting process will consider:
expand on and refine the topics outlined in section 3.1, designing actionable interventions for our three main topics delivered in concise and easily legible maps, policies, and other visual aids. The final guidebook will include:
Guidance on open space connectivity and place-making measures, improving accessibility to
Land use alterations or revisions to create more functional community spaces.
increase resident usage of the natural and urban landscape for recreation, leisure, and active
Housing typology, gentle density, desired place-types, and street scale specifications.
living. This will include environmental stewardship implementations, sustaining a functional and
Commercial integration, proximity, and access.
healthy urban and natural landscape for future generations to enjoy.
Special consideration of alternative uses for the local industrial land uses.
Mobility enhancements that empowers multiple traversal options, encouraging connected
Community-building interventions to underutilized land parcels or areas.
pedestrian systems that increase transit use and create safer and healthier daily routines.
Open space connections, accessibility, and neighbourhood walk-ability. Place-making interventions and community building opportunities such as public art and tactical urbanism interventions
Land use adjustments to diversify and integrate different building types and uses, creating more compact communities that diminish car dependency, reduce GHG emissions, and encourage growth with more affordable housing options for new and existing residents.
Pedestrian scale safety measures and traffic calming solutions. Ecological urban design practices that preserves and respects the area’s connection to Nosehill Park and other natural systems or ecological corridors.
4.2: Open House (Originally set for April 14, was held on April 18) The open house provides us an opportunity to proudly present our work to the public and gauge
3.2: Model Building (Completed by March 7)
community reception. We hope to present a well-considered and impactful final product using this
The Model Building Plan created in Phase 2 will be implemented starting mid February. The model will
outlined Methodology.
be a key communication device in our Community Workshop and Public Engagement sessions on March 7th. It is integral to represent the community in a tangible and legible way.
4.3: Project Concluding Report (April 22)
3.3: Community Workshop (March 7)
We will submit a summary report that outlines the entire project’s design process. This will include
We will host a community workshop to better engage with residents and understand the area’s current
well as problems encountered in order to improve future outcomes.
resident reception and steering committee feedback, chronicling both our successes to celebrate as
functionality. This Workshop will be critical to refine our understanding of the community through inperson conversations. The model will function as a visual aid and conversation starter to encourage residents to tell stories about their everyday lives to inform our final design solutions before our Steering Committee presentation.
13
PROJECT SCHEDULE PROJECT STAGE
JANUARY W1
W2
19 20 22 23 26 27 29 30 2
FEBRUARY W3 3
5 6
W4
MARCH
W5
W6
9 10 12 13 16 17 19 20 23 24 26 27 2
Base Map Preparation Phase 1: Initial Research
Data and Site Photo Collection Legal Framework Review Community Walkabout Community Profiling Spatial Analysis
Phase 2: Community Analysis
Gap Assessment Model Planning Steering Committee Presentation Model Building
Phase 3: Design Draft
Analysis Community Workshop Design Conceptualization Steering Committee Presentation Concept Design Finalization
Phase 4: Final Design
Steering Committee Presentation Open House Final Report Preparation
Community Engagement Deliverable Deadline
14
W7 3
5
W8 6
7
APRIL W9
W10
W11
9 10 12 13 16 17 19 20 23 24 26 27 30 31 2
W12 3
6
7
W13
W14
9 10 13 14 16 17 18 20 21 22
BUDGET AJA
CRAIG
NOA
KAKIU
SENIOR PLANNER
LEAD DESIGNER
JUNIOR PLANNER
JUNIOR PLANNER
$250
$175
$120
$120
Base Map Preparation
2
4
5
5
Data and Site Photo Collection
3
5
6
6
Legal Framework Review
6
2
2
2
Community Walkabout
4
4
4
4
TOTAL HOURS
15
15
17
17
Community Profiling
30
10
30
10
Spatial Analysis
10
20
10
30
Gap Assessment
15
10
10
10
Model Planning
4
8
4
4
Steering Committee Presentation
2
2
2
2
TOTAL HOURS
51
50
56
56
Model Building
10
10
10
10
Analysis Community Workshop
4
4
4
4
Design Conceptualization
20
30
25
25
Steering Committee Presentation
2
2
2
2
TOTAL HOURS
36
46
41
41
Concept Design Finalization
20
25
20
20
Steering Committee Presentation
2
2
2
2
Open House
4
4
4
4
Final Report Preparation
30
30
35
35
TOTAL HOURS
56
61
61
61
158
172
175
175
TEAM HOURS
SUBTOTAL
GST
DISBURSEMENTS
TOTAL COST
680
$111,600
$5,580
$7,812
$124,992
HOURLY FEE
15
TOTAL FEES
$10,455
$34,940
$26,890
$39,315
PART 2: COMMUNITY ANALYSIS
COMMUNITY ANALYSIS: SITE HISTORY & URBAN MORPHOLOGY Aerial Photos from of the City of Calgary, 2026
Prior to ~1600
1953
1957
1962
Nose Hill North Look Out
Deer, Elk, and Bison Hunting
Indigenous Pre-Contact
TIMELINE
Time Immemorial
European Contact
Treaty 7 Signing
~350-150 years ago
Thorncliffe Heights Established
Post-WW2 Oil Boom Late 1940s
1877 The land was used as Elk and Deer Hunting for Indigenous settlers on the Nose Hill
European Settlement, farming, and Colonization
1956
1954 Land Agreement between the Blackfoot First Nations and the Crown
CPA Alberta, 2026
Significant urban growth by early 1950s fueled by returning veterans, European immigration, and Turner Valley
Thorncliffe begins Construction
Through land annexation Parade of Homes on Thornton Road
Greenview Established 1959
Lower Thorncliffe is built after a huge burst of development Colonel Sanders Elementary School opens
Glenbow Archives NA 56600-7784 and NA 560076259d. Accessed from Saunders, 2026.
Glenbow Archives NA-2335-2
City of Calgary, 2019
1967
1963 Opens as employment center Thorncliffe and Corpus Christi Elementary Schools open
Thorncliffe-Greenview Association Merged
North Haven Established Lower North Haven starts construction in 1962
Greenview residents joined the Thorncliffe Community Association
Calgary herald, 1956. Accessed from Saunders, 2026
As a brief history, we start our timeline with the reminder that our site rests on what is known as Treaty 7
In 1954, Thorncliffe Heights hosted a Parade of Homes in collaboration with the Calgary House builders
Land, but has always existed since time immemorial as a hunting ground for Indigenous nomads who
Association on Thornton Road as a showcase of what the future of Calgary could look like. The
would settle on the Nose Hill North Point (United Way of Canada, 2019). It is significant to note that the
Thorncliffe Heights subdivision was crucial in that it was the first to be covered by a written
Treaty 7 Land agreement between the Blackfoot First Nations and the Crown was forged through
understanding that transferred the costs of street and sidewalk construction and utilities installations
weaponizing land ownership misunderstandings. This colonization tool of owning and parceling land is
from the City to the developer. (Foran, 2009). As a new development in the peak of the modern era,
one that urban planning still uses, and it is important to acknowledge that it is part of the Genocidal
Thorncliffe Heights was pushing to position itself as a family-oriented suburban community close to
history of Canada in order to reconcile and find a way to become stewards of the land, not owners of it.
downtown without the congestion and noise, with two schools opening soon after the Parade of Homes and Greenview opening as an adjacent employment center just 3 years later.
After European contact, settlers like the Laycock Family farmed the land until the post-war oil boom caused the land to be annexed in 1954 as the city grew from the south east. This boom was caused
The second Development burst is categorized by Nose Hill. The city’s freeze development on the Nose
primarily by returning veterans, European immigration, and the upstart of Turner Valley (Saunders,
Hill following strong resident movements to preserve the land (Saunders, 2026). This paved the way for
2026).
the preservation of the landscape through a land exchange with Thorncliffe in which private developers acquired 180 acres of West Thorncliffe land from the city in exchange for 1,052 acres of Nose Hill. This
Thorncliffe, originally Thorncliffe Heights, was established in an initial burst of central development, and
culminated in 1980 with Nose Hill Municipal park and Egert’s park being formally created. This land
by the early 1960s, Greenview and North Haven were being constructed quickly at Thorncliffe’s edges.
exchange allowed for the remainder of the large undeveloped parcels on the site to be filled. These
This is when the Thorncliffe-Greenview association was established, creating the precedent of
development burst contributes to the aging housing stock today, as more than 90% of all Thorncliffe
community lines being blurry and shared as one.
homes were built prior to 1980 (City of Calgary, 2021).
17
COMMUNITY ANALYSIS: SITE HISTORY & URBAN MORPHOLOGY
Nose Hill-Thorncliffe Land Exchange
Nose Hill Urban Development Freeze
Upper North Haven begins Construction
1974
1972
City passed first resolution for urban development freezes as they look into the park’s creation
1979 1984
1975
1975
Land Exchange
14th Street is created (Huge Barrier today)
1975
Upper North Haven Established
Nose Hill and Egert’s Park Creation
1977
Developer acquires 180 acres of West Thorncliffe land from the city in exchange for 1052 acres of Nose Hill
1984
Government of Alberta, 1985
Egert’s Park
Nose Hill Park is established after Archaeological Surveying and push from residents Egert’s Park Established
Thorncliffe/Greenview separated into 3 communities
City study to capture how residents feel about their community conducted for Thorncliffe-Greenview
2021
Former Quality Inn turned into mixed market housing in collaboration with the Drop-inn Center
Calgary Drop-in Center, 2023
Nose Hill Park City of Calgary, 2017
Thorncliffe Inclusive Play Park
Nose Hill Tunnel Mural Inclusive Thorncliffe Playpark
Nose Hill tunnel Murals
A driver of this preservation was survey’s done for the planned development of the Nose Hill which
Notable projects include the participation of Thorncliffe-Greenview in the City of Calgary’s “This is My
required the removal of pre-historic and historic resources. A study was conducted to determine and
Neighborhood” project in which the city executed a study asking residents how they feel about their
inventory sites of historical significance through the 1979 Historical Resources Impact Assessment and
community. Residents’ primary associations with the community were keywords of “safe”, “active”,
Archaeological Survey. This survey was responsible for first documenting what would later be known in
“clean”, and a “strong sense of community” (City of Calgary, 2017). Another project is the Rise apartment
1984 as the Hawkwood Archaeological Site: a multi-component per-historic campsite that showed tipi
in which the former Quality Inn was turned into mixed market housing in collaboration with the Drop-inn
rings in the ground alluding to Indigenous settlement (Government of Alberta, 1985).
Center. The community has recently experienced residential infill and community investments such as the Nose Hill Tunnel Murals, play park development, and bus traps fillings.
It is in this time that the area North Haven now known as Upper North Haven is developed as part of Thorncliffe. Upper North Haven is officially established approximately 14 years later in 1991 when Thorncliffe-Greenview is officially separated into 3 communities: Upper North Haven, Thorncliffe, and Greenview. The community experienced very little development or change from early 1990s to the early 2020s, with 0-2% of all housing units on the site today being made after 2016 (City of Calgary, 2021).
18
2005
Community Investments
Rise Apartment Project 2019
2017
Central shopping center expanded
1975
“This is my Neighborhood” City Project Participation
Safeway Growth 2003
1991
1980
Though Upper North hill is not established until 1991, the neighbourhood begins construction Archaeological Assessments begin at Nose Hill sites, including the Hawkwood Site (EgPm-179)
1995
COMMUNITY ANALYSIS: SITE HISTORY & URBAN MORPHOLOGY 1975
2005
2025
THE SITE TODAY 0
0.5
1979 12 min
HUNTINGTON HILLS
Drive
N
1Km
CALGARY INTERNATIONAL 64 Ave NE
AIRPORT
NOSE HILL PARK
DEERFOOT BUSINESS CENTRE St
Dee
14
NW
rfoo
WEST
Centre St N
vd Bl ie ur hn
La
HIGHWOOD
4 St NW
McKnight Blvd NE NW
New Egert’s Play Park Residential infill
NE
Bus Traps filled Residential infill
NEW DEVELOPMENT FRAMEWORK
t Tr
Today
2025
2024
SKYLINE
GREENVIEW INDUSTRIAL
Jo
PARK HIGHLAND PARK
Bus Trap Filled
Egert’s Play Park
Major Road
School
Place of Worship
Community/ Recreation Center
Grocery
Employment
Senior Living
Center
Facility
What we see today is a community build in bursts, one that’s rooted in responding to and respecting the natural surroundings, and a community that treats borders as suggestion, taking pride in seeing each other thrive. This creates challenges with aging infrastructure, but it also resulted in a community rich in green open spaces for active living, and a desire to grow under the recognition that the community and residents are aging. This is the foundation of Horizon Edge’s understanding of the site’s history and urban morphology, and has grounded our development framework.
19
BUILT IN BURSTS
ROOTED IN NATURE
Impacts infrastructure age and housing stock
Growth respected and recognized the natural systems
DESIRE TO GROW TOGETHER The Communities are like family and take pride in seeing each other thrive
COMMUNITY ANALYSIS: DEMOGRAPHICS COMMUNITY ANALYSIS POPULATION
POPULATION #
LOW INCOME BY AGE
AGE GROUPS
Represents 21% of Site Total
7%
MEDIAN HOUSEHOLD INCOME
Calgary Median
w/ Kids
w/o Kids
34%
35%
-10%
Calgary #
Calgary: $1,720 $1,330 $1,350
+7%
Calgary #s
HOUSING TENURE
-1%
Calgary #s
-0.2
HOUSING TYPE
Own
Rented
86% SingleDetached
-$31,000
HOUSING AGE 1% 7% 15%
Apartment in building less than 5 Storeys Row House Semi-Detached
86% Single-Detached
0% 5+ Storey Apartments
0-19
85% 1980 or before
w/ Kids
w/o Kids
29%
26% -2%
Calgary #s
HOUSING TENURE
Calgary: $1,720 GV: $1,320
22% +7%
Calgary #s
GV: +8% 2025
65+
Avg. household size
GV: 28%
-0.7
Calgary: 23%
Calgary size
Rented
47% Apartment under 5 storeys
2042
% OF HOUSEHOLDS SPENDING 30% OR MORE OF INCOME ON SHELTER
HOUSING TYPE
Rent
Owned
11%
8%
18-64
45% Own
$1,330 $1,350
+58% ary: Calg
22%
1.9
55%
3% made after 2001
POP. PROJECTION
MARRIED COUPLES SINGLE PARENTS
Calgary #
MONTHLY SHELTER COSTS 4% 1960 or before 81% 1961-1980 8% 1981-1990 2% 1991-2001 1% 2001-2010 0% 2011-2015 1% 2015-2021
14%
0-17
-15%
Calgary Median
Calgary size
Calgary: 11%
Smallest
GV: $67,000
Calgary: 23%
GV: 10%
30-44
Represents 14% of Site Total
MEDIAN HOUSEHOLD INCOME
NH+NHU: 12%
LOW INCOME BY AGE
Biggest
2042
% OF HOUSEHOLDS SPENDING 30% OR MORE OF INCOME ON SHELTER
23% Rent
77%
NH+NHU: $975
2.4
Avg. household size
14%
2025
AGE GROUPS
2,100
NH+UNH: +1%
65+
MARRIED COUPLES SINGLE PARENTS
MONTHLY SHELTER COSTS
Owned
18-64
0-17
NH: $102,000 NHU: $120,000
+$8,000 approx.
HOUSING AND AFFORDABILITY
11%
Smallest
15-29
HOUSEHOLD MAKE-UP
8%
8%
POPULATION #
+58% ary: Calg
Calgary: 11%
65+ 30-44
GREENVIEW
POP. PROJECTION
GV: 14%
Biggest
2,995
NORTH HAVEN + NH UPPER
2021 CENSUS
HOUSING AGE
47% 28% 1% 16% 8%
Apartment in building less than 5 Storeys Row House Semi-Detached Single-Detached Duplex
+31% Calgary’s Apartment under 5 Storey #s
80% 1961-1990
8% 1960 or before 48% 1961-1980 32% 1981-1990 8% 1991-2001 3% 2001-2010 0% 2011-2015 0% 2016-2021
0% made after 2011
City of Calgary, 2021
As for demographics, North Haven and North Haven Upper (NHU) are comprised in part of financially
And Finally, Thorncliffe continues the demographic trend of having a high percentage of seniors while
comfortable seniors. With a well-above average median household incomes and majority home
having a smaller younger population. Though the median household income is quite lower than
owners, a community comprised of 86% low density single detached units made prior to 1980 might
Calgary’s average, the larger household size, higher housing diversity, and lower percent of residents
indicate a difficult barrier to entry for younger adults and families under 30, reflected in the plateauing
spending 30% more of income on shelter indicate less financial instability while high low-income in
population projections and low rental tenure.
youth and an aging housing stock and population indicate lack of opportunities for new families and professionals to settle.
In Greenview, with well above average low-income rates and median incomes, we see 1-2 people households of young professionals and seniors struggle with monthly costs with 28% spending 30% or
Over-all trends for these communities indicate a declining population and plateauing dwelling
more of their income on shelter. With more diversity in housing types including a majority share in
occupancy and school enrollments (City of Calgary, 2026). This indicates that schools receiving an
apartment units occupants, this suggests that additional housing supports and programs are needed
increase in enrollment since 2022 , mainly the nearby high-school of John G., are busing students into
to maintain younger demographics.
the community and are not living within the community.
20
COMMUNITY ANALYSIS: DEMOGRAPHICS COMMUNITY ANALYSIS POPULATION
POPULATION #
AGE GROUPS
LOW INCOME BY AGE
TC: 20%
Biggest
8,695
60+
Represents 65% of Site Total
11%
Smallest
12%
19-24
MEDIAN HOUSEHOLD INCOME
27%
-11%
Calgary Median
-1%
Calgary #
Calgary #s
24% +9%
Calgary #s
POPULATION AND DWELLING OCCUPATION
2025
1978: Upper North Haven and Thorncliffe construction boom
2042
-0.2
Calgary: 23%
Calgary size
City of Calgary, 2026
2000
Calgary: $1,720 TC: $1,320
$1,330 $1,350
42% Rent
58% Own
Owned
Rented
51% SingleDetached
WORK COMMUTE TIMES
John G.
1500
HOUSING TYPE
HOUSING AGE
4% 9% 9% 51% 6% 4%
Apartment in building less than 5 Storeys Row House Semi-Detached Single-Detached Duplex Apartment in building more than 5 storeys
91% 1980 or before
Most Diverse Built form
34% 1960 or before 57% 1961-1980 5% 1981-1990 3% 1991-2001 1% 2001-2010 1% 2011-2015 0% 2016-2021
0% made after 2016
13% Other 2% Bicycle 4% Walk 9% Transit 7% Car (Passenger) 74% Car (Driver)
2018
SCHOOL ENROLLMENT SINCE 2014
Plateaued Enrollment 80,000+ new Alberta students since 2022.
Sir. John A
500
St. Helena Col. Sanders Thorncliffe North Haven
0
20 14 20 15 20 16 20 17 20 18 20 19 20 20 20 21 20 22 20 23
HOUSING AND AFFORDABILITY
HOUSING TENURE
81% Drive
1000
MONTHLY SHELTER COSTS
Car-Reliance
Occupied Dwellings Plateau
% OF HOUSEHOLDS SPENDING 30% OR MORE OF INCOME ON SHELTER
GV: 24%
9% Transit
Population Decline
TC: +9%
65+
Avg. household size
TRANSPORTATION SPLIT
City of Calgary, 2026
+58% ary: Calg
12% 11%
2.4
w/o Kids
33%
-24,500
POP. PROJECTION
MARRIED COUPLES SINGLE PARENTS w/ Kids
TC: $73,500
8%
18-64
0-17
HOUSEHOLD MAKE-UP
OVERALL TRENDS ALL COMMUNITIES
THORNCLIFFE
2021 CENSUS
HOUSING CONTINUUM GAPS
Increased numbers (John G.) are likely due to busing high school students in from other communities
74% of all residents commute <30 mins Quality of life outcome from close employment centers
ALL: 51% 47% Calgary 25% 21%
22% 18% 5% 5% 5% 5%
LESS THAN 15 MINS
15 - 29 MINS
30-44 MINS
45-59 MINS
60+ MINS
City of Hamilton, 2025.
As for the housing continuum, the communities have an overabundance of low density market housing while rental options are present but lacking overall housing-type diversity. While being offered through organizations such as the Drop-in Centre, Alberta Health, and Home Space, We see gaps in supportive and non-market housing and no emergency shelter options within the community itself. Overall, we see a community of established empty-nesters in which an aging housing stock and little significant new developments over 25 years struggle to maintain population growth. The whole site’s social hubs feel fragmented despite the communities’ desire to join together, and the community risks acting out end-of-neighbourhood life-cycle trends without new investment to leverage Calgary’s anticipated population growth.
SUMMARY
Not offered in Communities
Offered, but limited
Food Box and service connections are offered, but shelter options are not currently offered.
2 Home Space Buildings for health and disability services, Rise Greenview mixed market, and 2 senior care facilities are offered as supportive housing
LONGTIME ESTABLISHED RESIDENTS
YOUNG FAMILIES & PROFESSIONALS
AGING HOUSING STOCK, LOW DENSITY, AND LOW HOUSING DIVERSITY
Has Invested in the community’s local amenities and charm
Want to invest their futures into this community too
Drives away public and private desired investments into the community
21
Creates barriers to new residential growth and declines service and infrastructure quality
Gentle Density
Offered
Offered
42% Rent
58% Own
Enhance Connections to Nature
USING CALGARY’S GROWTH TO INVITE LOCAL INVESTMENT Targeted density and new development would entice investment into the community to achieve the communities’ service and amenity goals
Maintain Community Character
Enhance Pedestrian Connections
COMMUNITY ANALYSIS: ENVIRONMENTAL Climate & Wildlife Chinook winds (warm, dry winds from the Rockies) can raise temperatures 10 to 20°C in hours
CLIMATE FACTS Hottest Month July (17 °C avg)
Black-billed Magpie
Beavers
Barred Owl
Bobcat
Coyote
Malllard Duck
Mountain air movement directly reshapes the prairie climate.
Big seasonal mood swings: cold winters, warm summers
One of Canada’s sunniest major cities Around 2,300+ hours of sunshine per year
Coldest Month January (-7 °C avg)
Wettest Month June (98.6 mm avg) Windiest Month May (28 km/h avg)
Annual precipitation 409.8 mm (per year)
Weather by CustomWeather, © 2026
Calgary’s climate is defined by its variability and seasonal extremes, with cold winters, warm summers, low annual precipitation, and over 2,300 hours of annual sunshine. A defining characteristic is the Chinook wind, a warm, dry downslope wind that can rapidly increase temperatures during winter months, often melting snow within hours. In communities such as Thorncliffe and North Haven, where open spaces and topographic exposure are prominent, these conditions influence how parks and pathways are experienced, extending winter usability while also introducing freeze-thaw cycles that affect surface conditions and accessibility.
22
Source: Canada West Foundation Source: Calgary Journal
COMMUNITY ANALYSIS: ENVIRONMENTAL
23
COMMUNITY ANALYSIS: ENVIRONMENTAL
24
COMMUNITY ANALYSIS: ENVIRONMENTAL
25
26
ENVIORNMENTAL ANALYSIS: SUMMARY
BROKEN CONNECTIONS
SLOPE ISSUES OPEN SPACE OPPORTUNITY
N
0
0.5
1Km
27
COMMUNITY ANALYSIS: BUILT FORM FIGURE GROUND
YEAR OF CONSTRUCTION
17.1% AREA BUILT
Void Built Area
Pre-1955 1955-1960 1960-1970 1970-1980
N
0
0.5
1Km
Diagramming the figure ground of the community provides an understanding of the void and fill relationship. The extensive network of open spaces and dominance of low density single-detached homes results in only 17.1% of the area being built.
1980-1990 1990-2000 2000-2010 2010-2024
N
0
0.5
1Km
The community first started to be developed in the early 1950's in Thorncliffe. This informed the warped-grid block structure we see today. Throughout the 1960's and 1970's Thorncliffe, North Haven, and Greenview continued to expand. From the 80's and 90's more multifamily housing types were added such as rowhouses and multiplexes. By the 2000's most of the community as we know it today had been built, with scattered infill developments continuing throughout.
28
COMMUNITY ANALYSIS: BUILT FORM EXISTING BUILDING TYPES The community has predominantly single-detached family homes as its primary residential building type. The other existing multifamily home types are duplexes, multiplexes, townhomes, and lowrise apartments under four storeys. For non-residential uses, there are localized neighbourhood commercial strips, and several institutional building types including schools, seniors homes, and places of worship. Overall, the relative lack of housing diversity and concentration of localized commercial presents an opportunity to introduce new building types to create a more complete community.
SHADOW STUDY
Shadow Study
JUNE 21
MAR 21
NOV 21
9 AM 12 PM Single Detached Duplex Multi-plex Townhouse Lowrise Apartment (4 Storeys)
Single Detached
Commercial Religious Institution School Retirement Community Centre
3 PM
N
0
0.5
1Km
Lowrise Apartment Duplex
Multi-plex
Townhouse
RESIDENTIAL
Neighbourhood Commercial Strip
COMMERCIAL 29
Local Commercial Strip
COMMUNITY ANALYSIS: BUILT FORM CURRENT LANDUSE
Residential Low Density Residential Medium Density Commercial Institutional Open Space DC Direct Control Industrial
CURRENT ZONING
N
0
19.3% Open Space
0.5
R-CG Grade Oriented Infill H-GO Housing Grade-Oriented M-CG Multi-Residential Contextual Ground Oriented M-C1 & 2 Multi-Residential Contextual Medium/Low Profile M-X2 Multi-Residential - Medium Profile Support Commercial
1Km
C-N2 Commercial Neighbourhood 2 C-C1 Community Commercial
2.6% Commercial
C-COR2 Commercial Corridor 2 S-SPR Special Purpose - School, Park and Community Reserve S-CS Special Purpose - Community Service S-UN Special Purpose - Urban Nature S-CI Special Purpose - Community Institution DC Direct Control S-FUD Future Urban Development
1.0% Institutional 65.7% Residential Low
10.4% Residential Medium
30
N
0
0.5
1Km
COMMUNITY ANALYSIS: BUILT FORM CURRENT BUILDING SCALE POTENTIAL The building scale potential map, shows the maximum building heights permitted by the current zoning. Due to the majority of the community being designated for groundoriented low density residential uses, most of the building scale potential allows for limited height below 12m. While there are some parcels allowing the low-modified building scale including multifamily townhomes and low-rise apartments up to 4 storeys, these are concentrated mostly along the outer edges of the community.
46 m
The 3 parcels zoned C-COR2 and DC contain height modifiers allowing for a maximum of 46m and 26m, respectively. While currently these parcels either contain low density commercial strips or are undeveloped, their zoning indicates potential to increase density in the future. Overall, with increasing demand for housing and the expected Greenline LRT along Centre St, there presents an opportunity for future development to strategically increase the building scale potential in the community to accommodate more density.
26 m
46 m
N
Limited <12m (3 Storeys) Low-Modified 12-16m (3-4 Storeys) Mid-Rise Over 16m Future Urban Development Open Space
0
0.5
1Km
46 m 26 m 16 m
12m
LIMITED
LOW-RISE
MID-RISE 31
COMMUNITY ANALYSIS: BUILT FORM PARCEL OWNERSHIP
PARCEL SIZE
17.7% PUBLICLY OWNED
City-Owned Park School Sites Private Ownership
<500 sqm 500-1000 sqm 1000-5000 sqm 5000-10,000 sqm 10,000+ sqm Open Space
N
0
0.5
1Km
N
0
0.5
1Km
Analysis of parcel size and location allows determination of future development potential. Larger parcels allow for more flexible and broader scale development opportunities, while smaller parcels may be more limited and require strategic consolidation.
The City of Calgary manages a large number of parks and greenspaces throughout the community. Since these parcels are designated as public land, they present opportunities for integration of publicly funded interventions.
32
COMMUNITY ANALYSIS: BUILT FORM CITY ASSESSED PROPERTY VALUES
HOME VALUES OVER TIME Greenview
North Haven
Thorncliffe
Calgary
700,000
AVERAGE INCREASE +161.46%
Average Home Value ($)
600,000 500,000 400,000 300,000 200,000 100,000 0
2,005
2,010
2,015
2,020
2,025 (City of Calgary, 2026)
N
$ Value per sqm <500 <1000 <2500 <5000 5000+
0
0.5
CURRENT MARKET LISTINGS (AVG):
1Km
Single/Duplex $675,759
AVERAGE PROPERTY VALUE: $669,048.69
Townhouse $340,737
Condo $209,966
$1792.22 per m sq (all parcels) $1152.81 per m sq (residential) (Remax, 2026)
33
COMMUNITY ANALYSIS: BUILT FORM NEW DEVELOPMENTS FROM LAST 25 YEARS
FUTURE OPPORTUNITIES MISSING TYPOLOGIES MIXED-USE
LANEWAY SUITE
MARDA APARTMENTS, NORR ARCHITECTS, MARDA LOOP, CALGARY
BOWLING LANEWAY, STUDIO NORTH, CRESCENT HEIGHTS, CALGARY
MID-RISE APARTMENT
LIVE-WORK UNIT
RADIUS, BUCCI DEVELOPMENTS, BRIDGELAND, CALGARY
LIVE-WORK 4PLEX GRAVITY ARCHITECTURE, SHAGANAPPI, CALGARY
SUPERMARKET
SINGLE DETACHED
N
0
0.5
1Km
DUPLEX LOWRISE APARTMENT Over the last 25 years there has been some infill development particularly concentrated around the central Thorncliffe area with the oldest housing stock. Most completed developments have continued to be existing housing types. As housing demand continues to rise, this highlights an opportunity for future development to introduce missing or limited building types to provide further diversity and accommodate a wider range of housing needs.
34
COMMUNITY ANALYSIS: BUILT FORM SUMMARY
MAJORITY LOW-DENSITY RESIDENTIAL
AGING HOUSING STOCK SCATTERED INFILL DEVELOPMENTS
LIMITED COMMERCIAL & MIXED-USE N
Single Family Detached
Commercial
Duplex
Religious Institution
Multi-plex
School
Townhouse
Retirement Home
Built Prior to 1960
Lowrise Apartment (3-4 Storey)
Community Centre
Infill Development
0
35
0.5
1Km
INFRASTRUCTURE ANALYSIS: STREET NETWORK & MOBILITY ROAD HIERARCHY 64TH AVE NW
64TH AVE NE
NW
4TH ST NW
14
ST
CENTRE ST
URBAN BOULEVARD
ARTERIAL STREET
COLLECTOR STREET MCKNIGHT BLVD NE
JO HN
LA UR IE BL VD
CENTRE ST
NW
L TON TR EDMON
MCKNIGHT BLVD NW
Urban Boulevard Pathway
Arterial Street Walkway
Alley
Collector Street
RESIDENTIAL STREET
Residential Street N
0
0.5
1 Km
PATHWAY
This map shows that the major roads in the study area are mainly arterial roads, which form the primary traffic network. This is because the site is bounded and structured by major city corridors that are designed to carry higher traffic volumes and connect the area to the wider urban network. In comparison, the internal roads are mostly lower-order streets that serve local neighbourhood access.
36
WALKWAY
INFRASTRUCTURE ANALYSIS: STREET NETWORK & MOBILITY BIKE LANES AND WALKWAYS
MULTI-USE PATHWAY
SIDEWALK
Multi-Use Pathway
Sidewalk
On-Street BIKE LANE
N
0
0.5
1 Km
This map shows that the bike lanes and walkways in the study area are somewhat disconnected, with limited continuous links between the left and right sides of the neighbourhood. Most of the pathways and sidewalks are concentrated in separate sections, while the on-street bike lanes are limited and do not form a strong east–west connection across the area. As a result, the overall active mobility network appears fragmented and may reduce convenient movement between different parts of the community.
37
ON-STREET BIKE LANE
INFRASTRUCTURE ANALYSIS: STREET NETWORK & MOBILITY TRAFFIC INCIDENTS (2016-PRESENT) INVOLVED PEDESTRIANS
1
VEHICLES ONLY
64TH AVE NE/4 TH ST NW
2
64TH AVE NE/CENTRE ST
Traffic Incident High-Risk Intersection Traffic Volume Low<->High
N
N
0
0.5
0
1 Km
INVOLVED CYCLISTS
0.5
1 Km
Incidents Occurrence Low<->High
HIGH-RISK INTERSECTIONS
1
2
3
3
64TH AVE NE/EDMONTON TR
4
4
5
INCIDENTS INVOLVED PEDESTRIANS: 45 N
0
0.5
N
1 Km
0
0.5
1 Km
5
INCIDENTS INVOLVED VEHICLES ONLY: 312
Based on the traffic incident patterns shown on the maps, five high-risk intersections were highlighted for further attention. These intersections appear to have a higher frequency of recorded incidents and are mainly located along major traffic corridors.
38
MCKNIGHT BLVD NE/CENTRE ST
INCIDENT INVOLVED CYCLISTS: 7
MCKNIGHT BLVD NE/EDMONTON TR
INFRASTRUCTURE ANALYSIS: PUBLIC TRANSPORT & ACCESSIBILITY BUS ROUTES AND FREQUENCY
5908 CENTRE ST N
GOOD BUS STOP 4832 NORQUAY DR NW , CALGARY
N
Bus Stop
0
Max Green & Core Bus Route
Primary Bus Routes
301
ON AVG: EVERY 16-25 MINS
3
ON AVG: EVERY 10-15 MINS
2
20
300
0.5
1 Km
Minor Bus Routes 4
5
32
89
414
ON AVG: EVERY 25-60 MINS
This map shows the distribution of bus routes, stops, and service frequency within and around the study area. Higher-frequency routes are mainly located along Centre Street and 4th Street NW, while lower-frequency minor routes serve the surrounding residential areas. Some existing bus stops have limited shelter, seating, or other amenities, indicating opportunities for improvement to provide a better waiting environment for transit users.
39
BAD BUS STOP
INFRASTRUCTURE ANALYSIS: PUBLIC TRANSPORT & ACCESSIBILITY SERVICE WALKSHED ANALYSIS
0
0.5
1Km
0
0.5
1Km
0
0.5
1Km
SCHOOLS
SUPERMARKETS
Pedestrian Access to Schools (400m)
Pedestrian Access to Supermarkets (400m)
Pedestrian Access to Healthcare Facilities (400m)
Pedestrian Access to Schools (650m)
Pedestrian Access to Supermarkets (650m)
Pedestrian Access to Healthcare Facilities (650m)
N
0
0.5
1 Km
Based on the 450m and 650m walking sheds, the western part and the top of the study area appear to be somewhat left out compared with the more central areas. This suggests that residents in these locations may have poorer walking access to schools, supermarkets, and healthcare facilities within the communities.
40
HEALTHCARE FACILITIES
INFRASTRUCTURE ANALYSIS: PEDESTRIAN ENVIRONMENT CURRENT PEDESTRIAN EXPERIENCE
^
^
B’
BUS TRAPS
^
CITY OF CALGARY
^
CITY OF CALGARY
A’
BUS TRAP
POOR INTERSECTION DESIGN
N 0
0.5
1 Km
CROSS SECTION A’ (MCKNIGHT BLVD NE & CENTRE ST)
2.6m 3.6m 3.6m 3.6m 3.6m 3.6m 3.6m 3.6m 2.3m
Scale 1:150
CROSS SECTION B’ (64TH AVE NE & CENTRE ST)
4.2m 3.9m 4.4m
4.1m
4.1m
4.3m 41
4.3m
4.3m 4.0m 4.0m 1.8m
Scale 1:150
INFRASTRUCTURE ANALYSIS: UTILITIES WATER PIPES
Cast Iron (CI)
Copper
Ductile Iron (DI)
Other
Unknown
DISTRIBUTION PIPES CAST IRON
TYPICAL LIFESPAN: 75–100 YEARS Risk pattern: Gradual increase in break frequency over time Common issue: External corrosion and brittleness
POLYVINYL CHLORIDE (PVC)
WATER PIPES BUILT BEFORE 1970S
Cross-Linked Polyethylene (PEX) Polyvinyl Chloride (PVC)
Copper
Ductile Iron (DI)
Other
Unknown
N
0
Cast Iron (CI)
0.5
Pipes Built Before 1970s
HOUSEHOLD PIPES
1 Km
DUCTILE IRON (DI)
TYPICAL LIFESPAN: 75–100+ YEARS Risk pattern: Gradual deterioration, low sudden failure risk Common issue: External corrosion and wall thinning over time
Cross-Linked Polyethylene (PEX) Polyvinyl Chloride (PVC) Cast Iron Pipe >50 Year-Old N
COPPER
TYPICAL LIFESPAN: 50–70 YEARS Failure mode: Pin-hole leaks from internal corrosion
CROSS-LINKED POLYETHYLENE (PEX)
TYPICAL LIFESPAN: 40–50+ YEARS Failure mode: Rare, usually installation-related
TYPICAL LIFESPAN: 50–100 YEARS Risk pattern: Generally stable Common issue: Brittleness in extreme cold over long periods
0
0.5
1 Km
96.84% PIPES ARE OLDER THAN 50 YEARS
Looking at underground infrastructure, the water pipe network in the study area shows a clear aging issue, with about 96.84 percent of pipes being more than 50 years old. Some of the pipes highlighted by yellow dots are cast iron distribution pipes built before the 1970s. These older cast iron pipes are more sensitive to temperature change and tend to become more brittle over time, making them more vulnerable to corrosion and breakage. This indicates a significant long-term infrastructure concern and suggests a need for future monitoring, maintenance, and replacement planning.
42
INFRASTRUCTURE ANALYSIS: UTILITIES TREES AND POWER LINES & POLES
GUTTERS AND POWER LINES & POLES
Gutters
Power Pole
Sidewalk
N
0
0.5
1 Km
Tree Within 5m of Power Pole
N
0
0.5
1 Km
Power poles (dots) are highly consistent and evenly spaced Gutters (lines) follow almost every street segment The network reflects a fully serviced, auto-oriented suburban fabric
ENMAX
The gutters, power lines, and poles are evenly distributed throughout the community, reflecting a fully serviced suburban layout. The regular spacing of power poles and the broad gutter coverage suggest that basic municipal infrastructure is consistently provided across the area. The analysis also identified trees located within 5 metres of power poles. Based on the ENMAX clearance guidance shown in the figure, trees that are too close to overhead power lines may create vegetation hazards, particularly during storms, making this an area that requires ongoing monitoring and maintenance.
43
INFRASTRUCTURE ANALYSIS: SUMMARY
HIGH-RISK INTERSECTIONS
LACK OF ACCESS POINTS
AGING CAST IRON PIPES
BAD INTERSECTION DESIGN
OVERHEAD POWERLINE VEGETATION HAZARD
Heavy Traffic Congestion During Peak Hours
Tree Within 5m of Power Pole
Cast Iron Pipe >50 Year-Old
High-Risk Intersection
N
0
0.5
Max Green & Core Bus Route 301
3
ON AVG: EVERY 10-15 MINS
44
1 Km
PART 3: ENGAGEMENT
COMMUNITY WALKABOUT JANUARY 22 2026 Our class met up with community representatives from the steering committee from both North Haven and ThorncliffeGreenview to conduct a guided walking tour of the neighbourhoods. Throughout the tour, the residents shared their personal experiences and knowledge of the community’s history, along with current issues and concerns. Repeatedly mentioned where traffic and pedestrian safety issues, especially around major intersections and near schools. Residents also emphasized the extensive amount of beloved parks and underutilized open spaces which they wished to see better programmed.
46
COMMUNITY WALKABOUT
47
COMMUNITY WORKSHOP MARCH 7 2026 We held a workshop at the ThorncliffeGreenview Community Centre where we met with residents to hear firsthand about their experiences living in the community. Discussions were split into two phases, where we first asked them to identify current challenges faced in the community, while the second phase focused on brainstorming future possibilities and potential interventions they would like to see. Residents came from across all four communities, as well as a few surrounding neighbourhoods. Each table contained a map, allowing residents to mark and record key concerns and locations of interest for future interventions. Community feedback across all maps was then compiled into a summary.
TODAY’S CHALLENGES
FUTURE POSSIBILITIES
Where do you walk and/or cycle? Are there any challenges?
What are the special places in the neighbourhood?
How do you stay connected and active in the winter?
Where would you like to walk/bike? What are your main concerns for walking and cycling?
What are your concerns about transit and commuting? Where do you catch transit? What are your main concerns about driving? Are there streets that would benefit from traffic calming? (for example, where there is speeding) What types of housing are missing in the community? Do you feel commercial spaces are missing within the community? What amenities or services do you feel are missing from your community?
Do you see an opportunity for more diverse housing types? (unique multifamily buildings) Are you supportive of laneway housing and secondary suites? What issues would need to be addressed for these to be successful additions to your community? What kinds of improvements would you like to see in the parks and open spaces? How can the parks and open spaces offer more to different age and interest groups? What kind of streetscape improvements do you think are necessary and where?
48
COMMUNITY WORKSHOP WHAT WE HEARD SUMMARY DESIGN SOLUTIONS AND VISION
LANDUSE
OPEN SPACE
MOBILITY
MORE ACCESS TO LOCAL SMALL BUSINESSES
UNDERUTILIZED GREEN SPACES
UNSAFE PEDESTRIAN EXPERIENCE
LACK OF SENIOR LIVING OPTIONS
DISCONNECTED PARKS
DISCONNECTED BIKE LANES
TARGETED DENSITY
RESIDENTIAL DIVERSIFICATION
AGING IN PLACE AND INTER-GENERATION LIVING
ACTIVATING HIGH ACTIVITY NODES AND CORRIDORS
POP-UP ACTIVATIONS
GREENWAY
LIGHTING INTERVENTIONS
INFRASTRUCTURE IMPROVEMENTS
EXPANDED CYCLING NETWORK
SMART TRAFFIC LIGHT
LACK OF LIGHTING
TRAFFIC CONGESTION
49
PART 4: DESIGN CONCEPTS & POLICIES
LANDUSE DESIGN RECOMMENDATIONS
LANDUSE: NEIGHBOURHOOD LANDUSE CONCEPT PROPOSED URBAN FORM
PROPOSED BUILDING SCALE
N
Neighbourhood Local Neighbourhood Connector Neighbourhood Flex Neighbourhood Commercial Active Frontage
Natural Areas Parks & Open Space Private Institutional Neighbourhood Commercial Comprehensive Planning Site
N
0
0.5
Limited <12m (Up to 3 Storeys) Low-Modified 12-16m (Up to 4 Storeys) Low-Rise (Up to 6 Storeys) Mid-Rise (Up to 12 Storeys)
1Km
0
0.5
1Km
Open Space
Local Area Plans commonly use urban form maps to identify key general land use categories. These categories guide the types of buildings and uses permitted and determine community functions. Our proposed urban form utilizes four main categories for neighbourhood residential uses, with lower activity areas permitting ground-oriented building forms, while higher activity areas along key transit corridors and collector roads allow for denser buildings with a mix of residential and commercial uses.
The building scale map is intended to be read alongside the urban form map, and identifies the maximum permitted heights and massing of buildings in a specific area. This influences both the density and experience at the street level. We propose designating higher building scale along transit corridors and key intersections along collector roads.
52
LANDUSE: URBAN FORM URBAN FORM CATEGORY
LANDUSE DISTRICTS
NEIGHBOURHOOD LOCAL
R-CG, R-C1, R-C2, M-CG
Low-density grade-oriented residential areas
Single-detached, semi-detached, multiplexes, townhouses
R-CG, H-GO, M-C1, M-C2
Higher activity residential areas along key collector roads and corridors designed to accommodate more pedestrian traffic
Single-detached, semi-detached, multiplexes, townhouses, stacked townhouses, low-rise apartments
R-CG, H-GO, MU-1
Areas along connector corridors designed to accommodate a mix of residential and commercial uses
Single-detached, semi-detached, multiplexes, townhouses, stacked townhouses, live-work units, low-rise mixed use
MU-1, MU-2, C-COR2
High activity areas along key transit corridors designed to accomdate both residential and commercial uses with active frontage at grade
Low-rise and mid-rise mixed use
S-SPR, S-CS, S-UN
Publicly-accessible green open spaces and naturalized areas designed for recreational and environmental preservation uses. Also includes school parks and community associations
Schools, community centres, recreation facilities
PRIVATE INSTITUTIONAL
S-CI
Owned by non-governmental entities that serves a broad community or institutional function including religious, private education, or long-term care
Places of worship, private school, senior’s home
COMPREHENSIVE PLANNING SITE
S-FUD, DC
Larger complex sites intended for future development that require additional planning and design
Varies, usually large-scale communal functions
NEIGHBOURHOOD CONNECTOR
NEIGHBOURHOOD FLEX
NEIGHBOURHOOD COMMERCIAL
PARKS, OPEN SPACE AND NATURAL AREAS
DESCRIPTION
53
BUILDING TYPES
LANDUSE COMMUNITY WORKSHOP FEEDBACK TODAY’S CHALLENGES
FUTURE OPPORTUNITIES
Compatible densification aligning with community character
Middle housing Targeted larger density along main streets and commercial corridors
Lack of access to local businesses & services in residential areas
Mixed-use housing typologies
Aging in place and intergenerational living
Senior-friendly built forms Purpose-built affordable housing Improved regulation and safety of secondary suites Provide senior supportive care options for living in place solutions
Thorncliffe Community Association needs to increase memberships to expand program capacity
Create a mixed use corridor along center street to anticipate the future Greenline Community center can then increase memberships and program capacity
54
LANDUSE: RESIDENTIAL PROPOSED RESIDENTIAL INTERVENTIONS
NEW HOUSING TYPES
FUTURE GREENLINE LRT Laneway Suite
Stacked Townhomes
Live-Work Units
Mixed-Use
Flexible housing type incorporating residential and commerical uses at smaller scale
Accommodate a mix of residential and commercial uses in the same building
1 Self-contained residential unit located on the same lot as primary dwelling building
2
Vertically arranged units with separate entrances Ground level units designed with seniorfriendly features
New building types should be introduced that address the increased need for housing and diverse needs of residents at different life stages, while thoughtfully integrating with the existing built form character of the community. We aim to achieve this through the use of gentle density, which means the scale of new developments will be comparable to that of the existing surrounding buildings. We propose the following general recommendations for new developments: New developments should be mindful of the adjacent property heights and built at a similar scale N Low Density Residential with Laneway (R-CG) Stacked Townhomes (H-GO) Live-Work Unit (MU-1 h12) Low-Rise Mixed-Use Up to 6 Storeys (MU-1)
0
0.5
1Km
A diversity of ground-oriented units (single-detached, semi-detached, multiplexes, townhouse, laneway suites, live-work units) are permitted in low-density areas outside key transit corridors In accordance with R-CG zoning, a maximum height of 11 m is permitted, with the exception of H-GO and MU-1 h12 live-work parcels which allow building heights up to 12 m
Mid-Rise Mixed-Use 12 Storeys Intervention Node
Other zoning adjacent to low density residential areas should allow no more than double the maximum height permitted in R-CG (22m) with discretion permitted for parcels along major transit corridors (Centre St and 4th St) Design features such as building podiums and tower setbacks should be included to maintain human scale at the street level and minimize the impact of shadowing
55
LANDUSE: RESIDENTIAL POLICY RECOMMENDATIONS LANEWAY SUITE
PRECEDENTS
Property owners on laneways are encouraged to utilize the City of Calgary Backyard Suites Incentive to construct laneway suites Can get $35,000+ with additional funding available for accessibility features and bylaw compliance Additional funding ($40,000-50,000) should be provided in the form of a forgivable loan for units that are rented at below average market rate for a minimum of 5 years Partner with CMHC for Affordable Housing Fund (low-interest and forgivable loans)
CEDARVALE LANEWAY, LANE SCAPE ARCHITECTURE, TORONTO
BOWLING LANEWAY, STUDIO NORTH, CRESCENT HEIGHTS, CALGARY
RIVERDALE LANEWAY, CAB ARCHITECTS, TORONTO
WORTHINGTON DRIVE, LANE FAB, VANCOUVER
LOOP 36 FAAS ARCHITECTURE MARDA LOOP, CALGARY
RELAX STACKED TOWNHOUSE GRAVITY ARCHITECTURE, MAHOGANY, CALGARY
3912 30 AVE SW, NEW CENTURY DESIGN, KILLARNEY, CALGARY
EMERGE, AVALON MASTER BUILDER, ARBOUR LAKE
LIVE-WORK 4PLEX GRAVITY ARCHITECTURE, SHAGANAPPI, CALGARY
GARDENIA FLOWER BOUTIQUE LEONARD DEVELOPMENT GROUP, MARDA LOOP, CALGARY
For lots with no laneway, similar funding should be provided for creation of basement suites to be rented at below average market rate for a minimum of 5 years
STACKED TOWNHOMES
Selected blocks along Centre St transit corridor will be rezoned to H-GO Developer incentives should be provided to construct ground floor units with accessibility features Use Manitoba Visitable Homes Guidelines as basis Additional Developer Incentives to encourage at least 25% of units to be purpose-built affordable housing Partner with CMHC for Affordable Housing Fund (low-interest and forgivable loans)
LIVE-WORK UNITS
Key corner lots along collector roads will be rezoned to MU-1 A height modifier of 12m (in-line with H-GO height maximum) will be added to fit with scale of surrounding low-density residential R-CG zoning We propose the following adjustments to current bylaw regulations: Remove restriction that can only be put in multifamily buildings Change live-work unit from a discretionary to permitted use in MU-1 Remove stipulation that must not exceed 50.0 per cent of the gross floor area of the dwelling unit Remove minimum parking requirements within 600m of LRT station
56
LANDUSE: RESIDENTIAL POLICY RECOMMENDATIONS
PRECEDENTS
MIXED-USE The blocks along Centre St and 4 St transit corridors to be rezoned to MU-1, allowing up to 6 storeys, and 12 storeys on selected larger parcels Commercial active frontage is encouraged at grade along high traffic areas on Centre St near Thorncliffe-Greenview Community Centre and 4th St NW 4
NW St
MARDA APARTMENTS, NORR ARCHITECTS, MARDA LOOP, CALGARY
SOUTH BANK MIXED-USE, KASIAN ARCHITECTURE, INGLEWOOD, CALGARY
Phased development will be adopted to allow a gradual transition of commercial strips into mixed-use developments
OAKRIDGE CO-OP, CALGARY. CO-OP AND ELAN CONSTRUCTION
NORTH HILL CO-OP, CALGARY. GGA ARCHITECTURE
SOCIAL PROGRAMS Alongside the built form recommendations, we also propose adoption of the following social initiatives to help address equity barriers to housing:
CANADA HOMESHARE Community-wide housing initiative pairing students with seniors Collaborate with community association to facilitate matching Establish grant program to fund home upgrades to adapt unit to sharing
HOME ADAPTATION Integrate Alberta SHARP (Seniors Home Adaptation and Repair Program) Grant Low-interest home equity loans can cover a range of home adaptations and renovations to help seniors stay in their homes longer Provides up to $40,000
57
CANADA HOMESHARE
ALBERTA SENIOR’S HOME ADAPTATION AND REPAIR (SHARP) PROGRAM
LANDUSE: RESIDENTIAL
NODE 1: SMALL SCALE RESIDENTIAL DIVERSIFICATION Bla ck th or nR dN W
N St e r nt Ce
60 Av eN E
N
58
N
LANDUSE: RESIDENTIAL BEFORE
This node shows a conceptualization of an area along Centre St where each of our gentle density housing forms has been integrated. These include: Laneway suites Stacked townhomes (shown in several possible configurations) Live-work units 6-storey mixed-use apartments with ground-level commercial With Centre Street serving as a major transit corridor and designated as the location of the future Greenline LRT, it is a prime opportunity location to integrate higher density in the community. Addition of further density and upgrading the streetscape will enhance the pedestrian experience and transform Centre St from a car-oriented roadway into a vibrant community mainstreet. To assist in street activation, we propose reducing the building setback to the property line along Centre Street in order to facilitate further interaction with the active commercial frontage along the mixed-use buildings. The adjacent sidewalk will be widened to 3.5 m and regular planting and seating added to allow for high pedestrian activity and comfort. Overall the incorporation of more diverse housing forms can provide further options for community members across a range of life stages. In particular, denser gradeoriented units are ideal for seniors looking to age in place. Additionally, more flexible built forms such as mixed-use and live-work units provide more local businesses and services to create a complete community.
AFTER
59
LANDUSE: RESIDENTIAL NODE 2: HIGHER DENSITY MIXED USE
6 2 1
1
5
2
3
A
1 1
1
2
1
4S tN W
N
4
SECTION A 60
1
12-STOREY MIXED-USE
2
6-STOREY MIXED-USE
3
BIKE LANE
4
GREENWAY
5
PLAZA
6
CURB EXTENSIONS
N
LANDUSE: RESIDENTIAL
The new design concept will also encourage improved integration with the green space west of the current Safeway. The two 12 storey mixed-use buildings will be positioned to face a pedestrian walkway leading from 4th St into a terraced plaza matching the slope difference of the park. Active commercial frontage will run along the plaza-facing portions of the podiums, creating an enclosed outdoor mall.
The second intervention demonstrates the potential to redevelop an underutilized commercial strip into a higher density mixed-use node. 4th Street being another prominent transit corridor in close proximity to the Centre Street makes it another ideal location to add density. The strip malls also sit on larger parcels which present the opportunity for development of larger 12 storey buildings without needing consolidation. Alongside our proposed mobility interventions of adding a dedicated bike lane extension and intersecting greenway, this positions 4th St as a secondary mainstreet connecting to Centre St.
This redeveloped node creates additional amenities and services, that together with its strategic location position it as a future destination around an existing community hub.
To reduce the car-oriented design and increase pedestrian appeal, the new buildings will be positioned at the property line to directly interface with a widened sidewalk along 4th St, while the parking lot will be moved behind the buildings away from the mainstreet.
61
LANDUSE: NON-RESIDENTIAL NON-RESIDENTIAL INTERVENTIONS FUTURE GREENLINE LRT
NEW BUILDING TYPES Mixed-use 4-6 Storey
2
Institutional 4-6 Storey
Commercial 2 Storey
1
N 0
0.5
1Km
Direct Control Up to 6 Storeys (DC) Low-Rise Mixed-Use Up to 6 Storeys (MU-1) Intervention Node
Mid-Rise Mixed-Use 12 Storeys Institutional Use (S-SPR and S-CI)
Zoning MU-1 allows for residential or commercial use at grade for developer flexibility Can be wood-frame construction which is cheaper to build than steel Different scales for different size lots
Publicly funded Type A and B Senior Care for complex needs Separated buildings for different types of care Uses existing drainage slope for underground parking
Activates streets and pedestrian paths Provides local diverse uses and services for residents
3 Storey Max Existing Residential Scale
Allows for gradual scaling into lower density established areas
Future Greenline LRT Station
may not be able to properly deal with. These buildings will be stepped down to 4 to better scale into residential areas that allow for a maximum of 3 storeys.
For non-residential interventions, we wanted to focus on creating publicly and privately funded aging-in-place options as well as activating streets with high density mixed-uses at key nodes and corridors in our proposals. This is particularly relevant alongside BRT routes and sites that will interface with future LRT stations to make the community ready to anticipate the Greenline LRT when it is built.
In addition, we propose using max 6 storey mixed-use buildings that interface with the street, allowing MU-1 zoning for the choice of either residential or commercial uses at grade with the exception of active frontage at TOD intersections that have BRT stops. These buildings can be stepped down to 4 storeys depending on lot sizes, as it cannot be guaranteed that all lots can be consolidated to accommodate 6 storey development. Commercial two storey buildings will be used to increase the amount of small-scale commercial units as well as better blend into certain contexts. An example of how we use private development to cater to the community context is the Aegis Senior Hub in Newcastle, Washington which prioritize Chinese-oriented businesses and programs to facilitate a cultural senior hub that responds more directly to the community’s needs.
With the demographics skewing elderly with many residents having lived in the community their entire lives, it is important to provide options for residents to continue to live in the community they love. This is why bridging the gaps of the housing continuum is so important so we provide flexible and supportive needs for all income and abilities. As residents age into disability, we strive to give them options to transition into within the community itself. This can be addressed with institutional use 4-6 storey buildings replacing part of the community center parking lot and extending into the open green field facing 56th Avenue. This land is privately operated on public land, so an agreement with the community center can be reached to develop the site for further unique and contextual services. These buildings will provide Type A and Type B senior care, which deals with dementia and other complex healthcare needs that family members
62
Finally, we propose Direct Control zoning to incentivize the market to develop a senior oriented mixed-use development. With developer benefits for renting to senior oriented businesses or offering senior housing subsidies, a market solution to agingin-place can be prioritized.
LANDUSE: NON-RESIDENTIAL POLICY RECOMMENDATIONS Mixed-use 4-6 Storey
The majority of parcel blocks along the Centre St transit corridor will be rezoned to MU-1 This will concentrate development on high capacity and high traffic areas as to not infringe on lower-density areas while introducing density at priority nodes This also gives developers flexibility on building commercial or residential at grade Max 6 storey heights should only reserved for lots that conglomerate 2 or more parcels. Max 4 storey heights should be considered for single lot development Active frontage should be mandated on where lots immediately interface the Center Street and 56th Ave intersection, BRT stops, or public realm opportunities Areas in which this takes place should explore possibilities to improve pedestrian realms including but not limited to street tree cover expansion, reducing crosswalks with curb bump-outs into parking lanes, and creating plazas and providing street furniture for resting and congregating Density bonuses and development rebates should be offered for developers who that: Provide supportive care services Prioritize medical and senior service businesses in commercial units Offer below market rent for seniors
Institutional 4-6 Storey
Commercial 2 Storey
PRECEDENTS
AEGIS GARDENS SENIOR FACILITY AND CHINESE CULTURAL HUB. NEWCASTLE, WASHINGTON. AEGIS LIVING
2101 34 AVE SW MARDA LOOP, CALGARY
MILLRISE SENIOR VILLAGE, CALGARY
WESTBROOK UNDERGROUND LRT STATION AND LIBRARY, CALGARY
Additional Developer Incentives to encourage at least 25% of units to be purpose-built affordable housing Partner with CMHC for Affordable Housing Fund (low-interest and forgivable loans) This would make projects eligible for a $50,000 Grant for pre-development costs (HIP). An agreement with the community center should be reached in order for the ThorncliffeGreenview Community Association parcel to provide publicly funded and operated senior living supports This should include Type A and Type B services or other services that provide assisted or full-time senior care This should be operated by ASH or other provincially funded staff Parking loss should be transferred into underground parking that takes advantage of the site’s slope Buildings should be separated for different intensities of care if needed Heights for buildings should scale down to 4 to remain contextually responsive to the community scale A 2 storey commercial block should be included in two specific areas of the site: Include a commercial block where the Greenway intersects with the site of Node 2 to allow for pedestrians to make active use of a tiered plaza Include a commercial block on the Node 1 site of the Thorncliffe-Greenview Community Association to activate the street front and create passive rental revenue for the facility. This will allow for the expansion of services and take advantage of the higher density and foot traffic on the street. This parcel on Node 1 should be be active frontage along the street edge where the intersection leads to the community center’s front doors. This commercial active frontage should take advantage of wide pedestrian walkways, street tree coverage, or plazas to create a pleasant pedestrian experience.
63
HAYDEN BLOCK AND HEXAGON CAFE IN KENSINGTON, CALGARY
SUNALTA COMMUNITY ASSOCIATION HUB WITH COMMERCIAL KITCHEN AND COFFEE SHOP
LANDUSE: NON-RESIDENTIAL NODE 1: HIGH ACTIVITY CORRIDOR | CENTER STREET AND 56TH AVE PLAN ISOMETRIC
CURB BUMP-OUTS INTO PARKING LANE
56th Ave
Northmount Dr.
PLAZA MAX GREEN BRT STOP
SENIOR CARE PARK
N
UNDERGROUND PARKING
Section Line
Center Street
INCREASED ROAD SEPARATION BY 2.3 METERS
SECTION
Thorncliffe-Greenview Community Association (TGCA)
20m
Residential
Commercial
Active Frontage
Commercial
Pedestrian Path BRT Lanes Parking lane
64
Institutional
Commercial 4m
6m
3.6m
N Path Buffer BRT
3.6m
3.6m
3.6m
4.6m
4.4m
Arena
LANDUSE: NON-RESIDENTIAL BEFORE
AFTER
SW VIEW OF COMMUNITY CENTER LOT
Commercial Plaza
Dedicated BRT Lanes
Indigenous Prairie Grasses
Curb Bumpouts into Parking Lane
BENEFITS NON-MARKET LIVING-IN-PLACE OPTIONS This fills in gaps in non-market housing supports for seniors identified in our analysis This kind of care can be a more affordable and reliable complex needs solution than private care for many lower-income seniors This site also integrates seniors into an established community and activity hub
INCREASE PROXIMITY AND USE OF THE TGCA This site will increases revenue for the community center through targeted density, street activation, and public realm creation More foot traffic to the facility will provide opportunity for more memberships visitors to street-oriented or interior commercial ventures Opportunity to expand programs or amenities offered
65
TOD AND GREENLINE READY DEVELOPMENT Zoning choice allows for increased developer options, which will help entice reinvestment into the community and upgrade aging buildings Site becomes TOD ready for future Greenline development with commercial frontage and improved pedetrian realm at current BRT stops and future LRT station
LANDUSE: NON-RESIDENTIAL NODE 2: MIXED-USE SENIOR VILLAGE PLAN | CENTER STREET AND 56TH AVE PLAN
ISOMETRIC
th e, 60 Av
56th Ave
MIXED USE ACTIVE FRONTAGE
N
COMMERCIAL BLOCK Nosecreek Pathway Section Line
SECTION
TIERED PLAZA
20m
RESIDENTIAL
RESIDENT PARKING Trelle Dr.
PLAZA
COMMERCIAL 4m
Pedestrian Path Parking Lane Greenway Connection
66
7m 6m
PEDESTRIAN PATH
2.6m 3.6m
2.6m
2.6m
2.6m 3.6m
PARKING LANE
7m 4.6m
4.4m
LANDUSE: NON-RESIDENTIAL BEFORE
SE VIEW OF EMPTY LOT
AFTER
SE VIEW DOWN PROPOSED ROAD AND SENIOR VILLAGE
INTER-GENERATIONAL LIVING
ACTIVE FRONTAGE
PARKING LANE
SEAMLESS PEDESTRIAN REALM
BENEFITS INTER-GENERATIONAL LIVING Our Senior Village allows more people to age in place close to loved ones This provides a privately developed solution to aging-in-place needs
EXPANDED LOCAL SHOPPING OPTIONS This site provides more flexibility for the market to create a contextually appropriate senior living development similar to the Aegis Gardens Senior facility oriented to Chinese senior needs
67
AMENITY CONNECTION TO THE NOSECREEK PATH This site connects to our Greenway intervention with a commercial block at a tiered plaza to interface with the slope This creates a desirable location that utilizes the natural landscape
EGERT’S PARK, NORTH HAVEN, CALGARY
OPEN SPACE DESIGN RECOMMENDATIONS
PARKS AND OPEN SPACE
COMMUNITY WORKSHOP FEEDBACK
TODAY’S CHALLENGES
FUTURE OPPORTUNITIES
Lots of green space, but underutilized
Local Community building
Many parks, but broken connections
Neighbourhood Greenways
Dark areas in open spaces
Lighting Interventions
69
PARKS AND OPEN SPACE
70
PARKS AND OPEN SPACE
71
PARKS AND OPEN SPACE
72
PARKS AND OPEN SPACE
73
PARKS AND OPEN SPACE
74
PARKS AND OPEN SPACE
75
PARKS AND OPEN SPACE
76
PARKS AND OPEN SPACE
77
PARKS AND OPEN SPACE
78
PARKS AND OPEN SPACE
79
PARKS AND OPEN SPACE
80
PARKS AND OPEN SPACE
81
PARKS AND OPEN SPACE
82
14 ST NW & NORTH HAVEN DR
MOBILITY DESIGN RECOMMENDATIONS
MOBILITY: STREET DESIGN CONCEPT Complete Street Design
A street design approach that supports all modes of transportation, including walking, cycling, transit, and driving, in order to create more liveable neighbourhoods and encourage active and sustainable mobility. Through our proposed designs, the goal is to advance a complete street design that is safe, accessible, and inclusive for all users. SWEDEN, STOCKHOLM
STRATHCONA COUNTY, ALBERTA
DUNSMUIR STREET, VANCOUVER
SIDEWALKS
SAFE CROSSING
VICTORIA, BC
BIKE LANES
THE BRISTOL AND BATH RAILWAY PATH, UK
SHARED-USE PATHS EGLINTON AVENUE EAST, TORONTO
DEDICATED BUS LANE
CURB EXTENSIONS
STREETS FOR HEALTH
STREETS FOR SAFETY
STREETS FOR EVERYONE
MULTI-DIMENSIONAL SPACES
SHERBOURNE STREET, TORONTO
NARROWER TRAVEL LANES 9TH AVE SE, CALGARY
SAFE & ACCESSIBLE TRANSIT STOPS 84
MOBILITY: STREET DESIGN CONCEPT COMMUNITY WORKSHOP FEEDBACK
TODAY’S CHALLENGES
FUTURE OPPORTUNITIES
Congested intersections and long wait times at signals
Implement smart traffic lights to optimize flow and reduce delays
Inconsistent traffic calming leading to speeding on neighbourhood streets
Add targeted traffic calming measures on key neighbourhood streets
Unsafe crossings for pedestrians
Improve road safety design with safer crosswalks and better visibility for pedestrians
Disconnected and incomplete bike lanes that feel unsafe to use
Connect discontinuous bike lanes into a safe, continuous cycling network
Buses delayed by mixed traffic and unreliable travel times
Introduce designated bus lanes on priority corridors for more reliable service
Uncomfortable, poorly sheltered bus stops with limited amenities
Upgrade bus stop design with shelters, lighting, seating, and clear information
85
MOBILITY: INTERVENTIONS To Solve the Issues of
Purpose of Interventions UNSAFE PEDESTRIAN EXPERIENCE
TRAFFIC CONGESTION
DISCONNECTED BIKE LANES
Transit Extended dedicated bus lane & queue jump lane
Improve transit speed, reliability, and priority Reduce Traffic Improve traffic flow and reduce delay at key conflict points
Smart traffic lights with overpass
Biking Experience Separated bike lane & connecting bike path
Create a safer, more continuous, and comfortable cycling network Pedestrian Safety
Better intersection design, traffic calming measures & school zone traffic calming
Improve crossing safety and create calmer, lower-risk street environments
86
MOBILITY: INTERVENTIONS Interventions Map
NW
64TH AVE NE
CENTRE ST
14
ST
4TH ST NW
64TH AVE NW
At a larger scale, the proposed interventions are intended to maximize overall mobility through a combination of traffic management, transit priority, active transportation improvements, and targeted safety measures. These include smart traffic lights, extended dedicated bus lanes, a queue jump lane, a separated bike lane, a connecting bike path linking existing and proposed routes, improved pedestrian safety at key intersections, and traffic calming measures in school zones.
MCKNIGHT BLVD NW
JO HN
LA UR IE BL VD
NW
Collectively, these strategies seek to improve network performance while supporting a safer and more inclusive mobility system.
Extended Dedicated Bus Lane
Queue Jump Lane
Smart Traffic Lights & Overpass
Separated Bike Lane
Traffic Calming in School Zones
New Speed Limit 40kmh
Connecting Bike Path
Traffic Calming at Major Intersections
Barrier-Free (12% Slope)
N
87
Vehicle-Triggered Phase
Safer For Pedestrian
Adaptive Signal Control
MOBILITY: TRANSIT PRIORITY Smart Traffic Light & Overpass
14
NW
Barrier-Free (12% Slope)
64TH AVE NE
Vehicle-Triggered Phase
Safer For Pedestrian
Adaptive Signal Control
CENTRE ST
ST
4TH ST NW
64TH AVE NW
A
Plan View
JO HN
LA UR IE BL VD
NW
MCKNIGHT BLVD NW
Extended Dedicated Bus Lane
Connecting Bike Path
N
Smart Traffic Lights & Overpass
6.0m
Queue-Jump Bus Lane
Separated Bike Lane
3.2m
3.2m
3.0m
3.2m
3.3m
3.3m
Cross Section A
Street View
The T-intersection at McKnight Boulevard NW, John Laurie Boulevard, and 48th Avenue NW has long been a concern for local residents, as vehicles are often delayed there for more than 10 minutes during peak hours. To address this issue, the proposed smart traffic light design would improve traffic flow in a way that is less intrusive, more budgetfriendly, and more flexible for future development than major road reconstruction. In addition, a barrier-free overpass with a 12 percent slope is proposed to provide a safe and accessible crossing for all users, allowing pedestrians, cyclists, and people with mobility needs to move through the area more freely and safely.
88
MOBILITY: TRANSIT PRIORITY Smart Traffic Light & Overpass
Avg Traffic Volume
Smart Traffic Light Concept
48thAve Eastbound (towards McKnight Blvd) ≈ 1,983 vehicles daily Situation AM peak period (7:00-9:00)≈ 193 veh/h PM peak period (15:00-18:00)≈ 122 veh/h John Laurie Southbound ≈ 20,600 vehicles daily AM peak period (7:00-9:00)≈ 1,651 veh/h PM peak period (15:00-18:00)≈ 1,530 veh/h Data from City of Calgary (2017) Calgary Traffic Counts System
Peak Hours (7:00 - 9:00) (15:00 - 18:00)
Safer For Pedestrian
Adaptive Signal Control
Off-Peak Hours
About 30s wait, 7s min green, extendable up to 10s if more cars are detected.
No car on 48 Ave NW
48 Ave stays red
John Laurie Blvd stays green by default, and 48 Ave stays red.
John Laurie Blvd
John Laurie stays green by Runs on 120s cycle, only default, 30-second off-peak changes to red when vehicles interval for responsive detected on 48 Ave operation.
Car waiting on 48 Ave NW
Single Lane Roundabout Often $2M–$6M+ Flyover Often $25M–$40M
Vehicle-Triggered Phase
Green in 120s cycle, 7s min green, can be extended to 20s max depending how many cars waiting
The Cost
Smart Traffic Light ~$350,000 ONLY
Barrier-Free (12% Slope)
Data from Ministry of Transportation of Ontario (2022) & Town of Morinville (2013)
Traffic Signal Warrant Study has never been conducted yet at the intersection 89
MOBILITY: TRANSIT PRIORITY Smart Traffic Light & Overpass Paisley Road and Silvercreek Parkway North - Guelph, ON
Precedent
Paisley Road & Silvercreek Parkway North - Guelph, ON Paisley Road is the main street and stays green by default Silvercreek Parkway North only gets a green when detectors see a vehicle or pedestrian The side‑street green on Silvercreek is at least 7 seconds and can extend if more vehicles arrive
Vehicle-Triggered Phase
Safer For Pedestrian
Adaptive Signal Control
90
MOBILITY: TRANSIT PRIORITY Extended Dedicated Bus Lane
Bus Routes and Frequency
CENTRE ST
4TH ST NW
LA UR IE BL VD
NW
NW
64TH AVE NE
Extended Dedicated Bus Lane
MCKNIGHT BLVD NW
JO HN
MCKNIGHT BLVD NW
JO HN
LA UR IE BL VD
14
ST
HIGHER BUS FREQUENCY
BYPASS QUEUE
64TH AVE NW
64TH AVE NE
CENTRE ST
ST
NW
14
4TH ST NW
64TH AVE NW
NW
MAXIMIZING MOBILITY
Queue-Jump Bus Lane
Separated Bike Lane
Smart Traffic Lights & Overpass
Connecting Bike Path
Zoomed-In Sections
N
Bus Stop
N
0
Max Green & Core Bus Route
Primary Bus Routes
301
ON AVG: EVERY 16-25 MINS
3
ON AVG: EVERY 10-15 MINS
2
20
300
0.5
1 Km
Minor Bus Routes 4
5
32
89
414
ON AVG: EVERY 25-60 MINS
The extended dedicated bus lane is intended to maximize mobility by enhancing transit priority along a key corridor in the study area. The bus routes and frequency map shows that multiple core and primary bus routes are concentrated along Centre Street and 4th Street NW, highlighting their importance within the existing transit network. Extending the dedicated bus lane along Centre Street would therefore improve transit efficiency and help support a more reliable and effective mobility system.
91
MOBILITY: TRANSIT PRIORITY Extended Dedicated Bus Lane on Centre Street Blackthorn Rd NW
WN dR nrohtkcalB
MAXIMIZING MOBILITY
BYPASS QUEUE
HIGHER BUS FREQUENCY
B
Centre Street
N
1.3m
2.3m
3.4m
4.0m
4.8m
4.0m
3.8m
Plan View
2.2m
Cross Section B
92
MOBILITY: TRANSIT PRIORITY Queue Jump Lane 64TH AVE NW
BYPASS QUEUE
HIGHER BUS FREQUENCY
4th St NW
CENTRE ST
MCKNIGHT BLVD NW
McKnight Blvd NW
JO HN
LA UR IE BL VD
NW
4TH ST NW
NW
MAXIMIZING MOBILITY
WN tS ht4
14
ST
64TH AVE NE
McKnight Blvd NW & 4th St NW
Extended Dedicated Bus Lane
Separated Bike Lane
Connecting Bike Path
Existing On-Street Bike Lane
Existing On-Street Bike Lane
Smart Traffic Lights & Overpass
N
Queue-Jump Bus Lane
The queue jump bus lane is proposed as a mobility-focused intervention to improve transit priority and reduce delay at the intersection. On the northbound side, a new lane would be added for buses to use as a queue jump lane, helping them bypass congestion more efficiently. This would not reduce sidewalk width because sufficient space is available on the government-owned land to the east. On the southbound side, the design would require minimal change, as the existing curbside lane can be repurposed as a queue jump lane without altering the current streetscape. The intersection is also an important multimodal node where the separated bike lane and the connecting bike path pass through and merge.
Plan View
93
MOBILITY: TRANSIT PRIORITY Precedent Calgary’s MAX Purple BRT
MAXIMIZING MOBILITY
BYPASS QUEUE
HIGHER BUS FREQUENCY
16 Avenue and 10 Street N.W
Google Maps
Queue Jump Lane Concept
North Crosstown Bus Rapid Transit (BRT) Map City of Calgary
BikeDurham
Queue jump lanes already have a local precedent in Calgary’s MAX rapid transit system. Calgary Transit states that MAX services use queue jumps at many signalized intersections, allowing buses to enter a dedicated lane and receive an advance green signal to bypass congestion. This makes MAX Purple a useful precedent for the proposed intervention. In contrast, current official information on MAX Green highlights transit-only lanes, improved stations, and signal upgrades, but does not clearly confirm existing queue jump lanes along the corridor. As a result, the proposed queue jump lane can be understood as a practical extension of transit priority measures already used in Calgary, while also anticipating future improvements along the MAX Green corridor. 94
MOBILITY: BIKING EXPERIENCE PRECEDENTS
Separated Bike Lane
DUNSMUIR STREET SEPARATED BIKE LANE - VANCOUVER
Collisions dropped 18% on Dunsmuir
Bike use jumped 250% overall and 50% year over year
64TH AVE NE
7TH STREET BIKE TRACK- CALGARY
CENTRE ST
NW
Created a safe link from the Adanac route into downtown
Valley Transportation Authority
MCKNIGHT BLVD NW
By Corey Morgan
JO HN
Northmount Dr NW
W N r D t n u o m htr o N
N
Separated Bike Lane on 4th St NW
0
C
Connecting Bike Path
Existing On-Street Bike Lane
0.5
1 Km
Existing On-Street Bike Lane
4th St NW
Smart Traffic Lights & Overpass 54 Ave NW
A two-way separated bike lane is proposed along 4 Street NW to improve cycling safety and connectivity within the study area. The existing sidewalk corridor appears wide enough to accommodate the facility, making the intervention spatially feasible. Through physical separation from motor vehicle traffic, the bike lane would provide a safer and more comfortable cycling experience while also supporting stronger connections to the existing biking network.
WN evA 45
Zoomed-In Sections
COMFORT & QUALITY
By Corey Morgan
N Separated Bike Lane
ENSURE SAFETY
BETTER CONNECTIVITY
LA UR IE BL VD
NW
ST
4TH ST NW
64TH AVE NW
14
TWO-WAY SEPARATED BIKE LANE ON DUNSMUIR ST
Plan View
2.8m
3.5m
3.6m
3.6m
3.5m
3.5m
3.3m
1.8m
Cross Section C
95
MOBILITY: BIKING EXPERIENCE Connecting Bike Path
ENSURE SAFETY
64TH AVE NE
4th St NW
CENTRE ST
NW
COMFORT & QUALITY
WN tS ht4
14
ST
4TH ST NW
64TH AVE NW
BETTER CONNECTIVITY
McK nigh t Blv d NW Blv d
dv l B ei r u aL n ho J
JO HN
LA UR IE BL VD
NW
Jo hn La ur ie
MCKNIGHT BLVD NW
*Dotted Lines are Proposing Connections *Solid Lines Are Existing Connections
N Separated Bike Lane Existing On-Street Bike Lane
Connecting Bike Path Existing On-Street Bike Lane
Smart Traffic Lights & Overpass
Separated Bike Lane
0
0.5
1 Km
Connecting Bike Path
Existing On-Street Bike Lane
Existing On-Street Bike Lane
N
Active Passive Hybrid Recreation
The connecting bike path is proposed as a strategic intervention to improve network continuity between existing and proposed cycling infrastructure. It links the existing biking system with major proposed elements, including the overpass and the separated bike lane, thereby creating a more coherent cycling network across the study area. In addition, the route passes through the proposed active-passive hybrid recreation, where it contributes to both transportation and recreational functions, as discussed further in the green open space section.
96
MOBILITY: PEDESTRIAN SAFETY Safer Intersection Design 64TH AVE NE
64TH AVE NW
1
NW
CENTRE ST
14
ST
4TH ST NW
2
At the intersection of 64 Avenue and 4 Street NW, the slip lane is redesigned at a sharper angle so that drivers are required to slow down and have better visibility of both pedestrians and other vehicles. At 64 Avenue and Centre Street, a more ambitious design is proposed by removing all slip lanes to maximize pedestrian safety.
4 5
In the school zones, two additional traffic calming measures are introduced, namely pinch points and median or refuge islands, in order to reduce vehicle speeds and create a safer environment for students and pedestrians.
3
JO HN
LA UR IE BL VD
NW
6
MCKNIGHT BLVD NW
The proposed interventions introduce improved pedestrian safety design at six intersections across the study area. Most of these interventions use corner radii reductions and gateway treatment traffic calming measures, which mainly work by extending the pedestrian curb to shorten crossing distances and slow turning vehicles.
Traffic Calming at Major Intersections
Traffic Calming in School Zones
New Speed Limit 40kmh
BETTER SIGHT LINES
N
97
SLOWER TRAFFIC SPEED
FEWER CONFLICT SHORTER CROSSING POINTS DISTANCE
MOBILITY: PEDESTRIAN SAFETY Safer Intersection Design
Highlighted Intersections 64TH AVE NE
64TH AVE NW
NW
3
CENTRE ST
4TH ST NW
ST
2
1
1
2
14
N
4 5 6
64TH AVE & CENTRE ST
5
MCKNIGHT BLVD & CENTRE ST
6
3
MCKNIGHT BLVD NW
JO HN
LA UR IE BL VD
NW
4
64TH AVE NW & 4TH ST
Traffic Calming at Major Intersections
Traffic Calming in School Zones
New Speed Limit 40kmh
N
NORTHMOUNT DR & 4TH ST
This map further explains the design logic behind the proposed pedestrian safety interventions and supports them with local precedents from 17 Avenue SW and 37 Street SW in Calgary. These examples show how measures such as reduced corner radii and gateway treatments can help slow turning vehicles, improve sight lines, reduce conflict points, and shorten pedestrian crossing distances. By applying similar strategies at the highlighted intersections and school-area crossings, the proposal aims to create a safer and more comfortable walking environment for students, children, and other vulnerable road users.
NORTHMOUNT CRESCENT & NORTHMOUNT DR
CORNER RADII
17TH AVE SW - CALGARY, AB
54TH AVE & THORNTON RD
BETTER SIGHT LINES
Google Maps
37TH ST SW - CALGARY, AB
SLOWER TRAFFIC SPEED
Global Design Cities Initative
GATEWAY TREATMENTS
FEWER CONFLICT POINTS
SHORTER CROSSING DISTANCE Google Maps
98
Global Design Cities Initative
AmericaWalks
MOBILITY: PEDESTRIAN SAFETY Before
After
Safer Intersection Design (64th Ave & Centre St)
14
NW
64TH AVE NE
CENTRE ST
ST
4TH ST NW
64TH AVE NW
Google Maps
Precedent
Raindrop Plaza, Dundas St. E. and Coxwell Ave, ON
Strong Towns Langleys
SpruceLab
64TH AVE & CENTRE ST
JO HN
Traffic Calming at Major Intersections
Walnut Grove Drive & 212 Street, BC
MCKNIGHT BLVD NW
LA UR IE BL VD
NW
Walnut Grove Drive & 88 Avenue, BC
Traffic Calming in School Zones
New Speed Limit 40kmh
N BETTER SIGHT LINES
N
At 64 Avenue and Centre Street, the proposed intervention adopts a bold intersection redesign by removing all slip lanes to prioritize pedestrian safety. This strategy is supported by the Walnut Grove precedent in British Columbia, which shows how pedestrian refuge islands beside slip lanes can become overcrowded during school hours and peak travel periods, resulting in unsafe conditions. Given that this intersection is located near three schools, a stronger intervention is justified to better protect students and other pedestrians. The design is also informed by the Raindrop Plaza precedent in Toronto, where slip lane removal created substantially more pedestrian space and introduced public art and landscape improvements. A similar approach at 64 Avenue and Centre Street would therefore enhance both safety and place quality, while projecting a more active and youthful image for the area.
SLOWER TRAFFIC SPEED
FEWER CONFLICT POINTS
64th Ave NW Centre St
tS ertneC
SHORTER CROSSING DISTANCE
D
6.3m
4.1m
4.1m
4.3m
4.3m
4.3m
6.8m
Cross Section D
99
MOBILITY: PEDESTRIAN SAFETY Before
After
Safer Intersection Design in School Zones (54th Ave NW & Thornton Rd NW)
14
NW
64TH AVE NE
CENTRE ST
ST
4TH ST NW
64TH AVE NW
Source: Google Maps
Riverside Drive, Manhattan
NYC Street Design Manual
NYC Street Design Manual
JO HN
54 AVE NW & THORNTON RD NW
New Speed Limit 40kmh
hT tnro R no d WN
Traffic Calming in School Zones
E
N
N
n Rd rnto Tho
Traffic Calming at Major Intersections
Grand Concourse, Bronx
MCKNIGHT BLVD NW
LA UR IE BL VD
NW
Precedent
SLOWER TRAFFIC SPEED
NW
This intervention is proposed as a school-zone traffic calming measure through the introduction of a median and refuge island design. By narrowing and organizing vehicle entry movements, the design helps reduce traffic speeds and reinforces the need for drivers to yield to pedestrians. The conversion of the right-side lane into a right-turn-only lane further limits vehicle access to a single through lane, helping to reduce potential pedestrian-vehicle conflicts. In addition to its safety function, the median can also be landscaped with planting and greenery, contributing to a greener and more attractive school-zone environment. Precedents from Grand Concourse in the Bronx and Riverside Drive in Manhattan further suggest that these types of interventions can improve pedestrian comfort and perceived safety by creating a more protected and legible crossing environment.
BETTER SIGHT LINES
54 Ave NW FEWER CONFLICT POINTS
SHORTER CROSSING DISTANCE
3.2m
1.5m
2.4m
2.4m
2.4m
2.4m
1.6m
11..0m
Cross Section E
100
MOBILITY: PEDESTRIAN SAFETY Before
After
Safer Intersection Design in School Zones (Northmount Crescent NW & Northmount Dr NW)
64TH AVE NE
CENTRE ST
NW
Thomas St , Athens
6 1/2 Avenue , New York
LA UR IE BL VD
MCKNIGHT BLVD NW Reddit User warnelldawg
Traffic Calming in School Zones
New Speed Limit 40kmh
N
NW
No rth mo unt Dr
JO HN
NORTHMOUNT CRESCENT NW & NORTHMOUNT DR NW No rth m ou nt Cr es ce nt NW
NACTO
N
WN rD t n uom htr oN
Traffic Calming at Major Intersections
Google Maps
Precedent
NW
14
ST
4TH ST NW
64TH AVE NW
This proposal represents another traffic calming intervention in the school zone, using a pinch point design to improve pedestrian safety. By narrowing the roadway, the design shortens pedestrian crossing distances, limits vehicle access to a single lane, and requires drivers to slow down and yield to pedestrians before entering. Precedents from Thomas Street in Athens and 6 1/2 Avenue in New York show how pinch points can create a more controlled and legible crossing environment by reducing vehicle speed, minimizing conflict space, and making pedestrian movement more visible and protected.
BETTER SIGHT LINES
SLOWER TRAFFIC SPEED
FEWER CONFLICT POINTS
F
2.4m
2.4m
2.4m
2.4m
2.4m
SHORTER CROSSING DISTANCE
2.4m
2.4m
2.4m
2.4m
Cross Section F
101
MOBILITY: POLICY& RECOMMENDATIONS POLICY
Adopt a complete streets approach that balances the needs of pedestrians, cyclists, transit users, and drivers. Prioritize east-west connectivity as a key mobility objective for the community. Support transit-priority improvements on major corridors to reduce delay and improve reliability. Strengthen active transportation connections between existing and proposed cycling infrastructure. Improve pedestrian safety at high-risk intersections and in school zones through context-sensitive design. Integrate mobility improvements with public realm enhancements, including planting, landscaping, and upgraded bus stops.
RECOMMENDATIONS
Implement smart traffic lights at key congested intersections to improve traffic flow and support future mobility needs. Extend the dedicated bus lane along Centre Street to improve transit efficiency on an existing high-demand corridor. Introduce queue jump lanes to give buses priority at intersections and reduce delay. Provide a barrier-free overpass to improve safe and accessible crossing for pedestrians and cyclists. Develop a separated bike lane and a connecting bike path to close existing network gaps and improve eastwest movement. Redesign key intersections using curb extensions, reduced corner radii, and gateway treatments to improve pedestrian safety. Remove or redesign slip lanes where pedestrian conflicts are high, especially near schools. Apply school-zone traffic calming measures such as refuge islands and pinch points to reduce vehicle speed and improve crossing safety. Upgrade bus stops and expand Transit Signal Priority to create a more comfortable and efficient transit corridor. Continue advocating for connections toward the industrial area to the east, as stronger external links remain an important community concern.
COMMUNITY FEEDBACK
Residents identified a lack of east-west connection within the community. Residents expressed frustration that proposals to connect toward the industrial area on the east side are often pushed back. Community feedback encouraged continued efforts to pursue stronger mobility connections in the future.
102
OPEN HOUSE: CONCLUSION APRIL 18 2026 The open house was an opportunity for our team to unveil our proposed interventions to the public at the North Haven Community Association. Using a large community model as a centerpiece and visual aid, Horizon Edge interfaced with the community to communicate our ideas and get feedback from the public. We also got the opportunity to speak with an MLA and the area’s councilor, D.J. Kelly, and discussed the importance of providing care for the aging demographic as well as finding solutions to underutilized open space or aging infrastructure to direct the future LAP for these communities. In particular, we received many positive comments regarding the mobility interventions that would facilitate a safer pedestrian experience, as well as a cost-effective traffic light solution to the “nightmare” intersection on McKnight and John Laurie Boulevard. We also received comments that our inter-generational living solutions and Senior Village concepts were gravely needed, as many residents are getting older or have family that want to live close but can’t live within the community. Residents also noted that inter-generational living is already happening on their streets, that they have seen an influx of young families living with extended older family. Another comment we received was to extend our Greenway intervention all the way to Nose Hill, as those who enjoy keeping active by biking would love an uninterrupted east-west connection. We hope that these proposed interventions will help guide future community development and attract investment back into a beloved and opportune part of Calgary.
103
OPEN HOUSE
104
REFERENCES City of Calgary. (2026). Calgary imagery app. https://maps.calgary.ca/CalgaryImagery/ City of Calgary. (2026). Historical property assessments (parcel). Open Calgary. https://data.calgary.ca/d/4ur7-wsgc/visualization City of Calgary. (2026). School enrolment by school authority timeline chart. https://data.calgary.ca/Demographics/School-Enrolment-by-School-Authority-Timeline-Char/7jum-ynic City of Calgary. (2023). Design guidelines for street lighting. https://www.calgary.ca/content/dam/www/transportation/roads/documents/traffic/traffic-signals-and-streetlights/designguidelines-for-street-lighting.pdf City of Calgary. (2021). Greenview community profile. https://www.calgary.ca/communities/profiles/greenview.html City of Calgary. (2021). North Haven community profile. https://www.calgary.ca/communities/profiles/north-haven.html City of Calgary. (2021). Thorncliffe community profile. https://www.calgary.ca/communities/profiles/thorncliffe.html City of Calgary. (2021). Upper North Haven community profile. https://www.calgary.ca/communities/profiles/north-haven-upper.html City of Calgary. (2019). Archaeology and Calgary parks. https://www.calgary.ca/content/dam/www/programs-services/parks-recreation/parks/history/archaeology-and-calgary-parks1.pdf City of Calgary. (2018). Historical community populations and dwelling counts. https://data.calgary.ca/Demographics/Historical-Community-Populations-and-Dwelling-Coun/4286-vnsg City of Calgary. (2017). Calgary Traffic Counts System. https://trafficcounts.calgary.ca/ City of Calgary. (2017). This is my neighbourhood: What we heard report (Thorncliffe/Greenview). https://www.calgary.ca/content/dam/www/engage/documents/timn/timnwhatweheard.thorncliffegreenview.pdf City of Calgary. (2017). Urban forestry strategic plan. https://www.calgary.ca/content/dam/www/programs-services/parks-recreation/parks/natural-parks-and-wetlands/urban-forestrystrategic-plan.pdf City of Calgary. (n.d.). Community grant programs. https://www.calgary.ca/communities/grant-programs.html City of Calgary. (n.d.). Highland Park redevelopment. https://www.calgary.ca/planning/projects/highland-park.html City of Calgary. (n.d.). Inspiring neighbourhoods grant. https://www.calgary.ca/social-services/funding/inspiring-neighbourhoods.html City of Calgary. (n.d.). Local area investment fund. https://www.calgary.ca/planning/local-area/local-area-investment-fund.html City of Calgary. (n.d.). Tree protection bylaw. https://www.calgary.ca/bylaws/tree-protection.html City of Calgary. (n.d.). Trees and shrubs. https://www.calgary.ca/bylaws/trees-shrubs.html City of Vancouver. (2025). Green rainwater infrastructure planting guidelines. https://vancouver.ca/files/cov/vancouver-gri-planting-guidelines.pdf City of Vancouver. (2018). Arbutus Greenway plan: Understanding the corridor today. https://vancouver.ca/files/cov/2018-493-release2.pdf DarkSky International. (2025, May 8). How DarkSky partners with the National Audubon Society to promote Lights Out for the birds. https://darksky.org/news/how-darksky-partners-withthe-national-audubon-society-to-promote-lights-out-for-the-birds/
105
REFERENCES Dwayne Kula. (2022). What is dark sky compliance and why it matters. LED Lighting Supply. https://www.ledlightingsupply.com/blog/dark-sky-compliance Federation of Calgary Communities. (n.d.). Energizing spaces LED lighting grant. https://calgarycommunities.com/energizing-spaces-led-lighting-application-form/ Government of Alberta. (1985). Hawkwood site (EgPm-179): A multi-component prehistoric campsite on Nose Hill. https://open.alberta.ca/publications/hawkwood-site-egpm-179-a-multicomponent-prehistoric-campsite-on-nose-hill Government of Canada. (n.d.). Natural infrastructure fund. https://www.infrastructure.gc.ca/nature/index-eng.html HelpAge Canada. (n.d.). Canada HomeShare. https://www.canadahomeshare.com Maple Projects. (2017). Highland Village Green outline plan and land use redesignation submission. https://www.calgary.ca/content/dam/www/pda/pd/documents/current-studies-andongoing-activities/highland-park/highland-village-green-outline-plan-and-land-use-redesignation-submission.pdf Ministry of Transportation of Ontario. (2022, December 19). Draft cost estimating guide for designers. https://tcp.mto.gov.on.ca/sites/default/files/202212/Draft%20Estimating%20Guide%20-%20Dec%2019%202022.pdf Para, L. L. M., Silver Architects, & Hilderman. (2006). Community building through visitable and adaptable housing. Manitoba Housing and Renewal Corporation. https://www.gov.mb.ca/housing/progs/pdf/visitable-housing-visitable-housing-community-building.pdf Parks Foundation Calgary. (n.d.). Building communities grant. https://www.parksfdn.com/building-communities Parks Foundation Calgary. (n.d.). Programs. https://www.parksfdn.com/programs RE/MAX. (n.d.). Calgary real estate—houses for sale in Calgary. https://www.remax.ca/ab/calgary-real-estate Saunders, P. (2026). The modern era: Thorncliffe Greenview comes to age. Unpublished manuscript. Swoop Vending. (n.d.). Sports equipment rental vending machines for clubs and facilities. https://swoopvending.com/ Town of Morinville. (2013). Highway 642 functional planning study: Appendix F – Cost estimates. https://www.morinville.ca/media/0k4npwji/highway-642-functional-planning-studyappendix-f-cost-estimates.pdf United Way of Canada. (2019). The Indigenous landscape of Calgary and area. https://calgaryunitedway.org/blog/the-indigenous-landscape-of-calgary-and-area/
106
Horizon Edge Consulting
107