
3 minute read
Agriculture Canadian canola market


Retail and foodservice sales slowly returning to pre-pandemic normal
“Canola is Canada’s number one oilseed crop, with average Canadian production of about 20 million tonnes compared to 6.5 million tonnes of soybeans,” says Neil Blue, provincial crops market analyst with the Alberta government.
Advertisement

Canola contains about 42% oil and 58% meal. Both canola products are known for high quality and have well-established markets. Canola meal is valued mainly as an animal protein feed, competitive with alternative protein sources such as soybean meal. Canola oil is known for its attractive characteristics for human consumption and is increasingly being used in the production of biodiesel.
Annual world vegetable oil production is near 210 million tonnes. Of that total, annual world rapeseed oil production, including canola oil, is estimated at 31 million tonnes. Soybean oil comprises about 60 million tonnes of the world total. The largest volume vegetable oil is palm oil at 77 million tonnes. The largest palm oil producers and exporters are Indonesia and Malaysia, with those 2 countries producing 90% of the global total.
Palm oil is used for cooking, food products, detergents, cosmetics and increasingly so for biofuel. Palm oil production per acre is high, one reason that it is usually the lowest priced vegetable oil. Although palm oil has many positive attributes, a negative is that about half of its fat content is saturated.
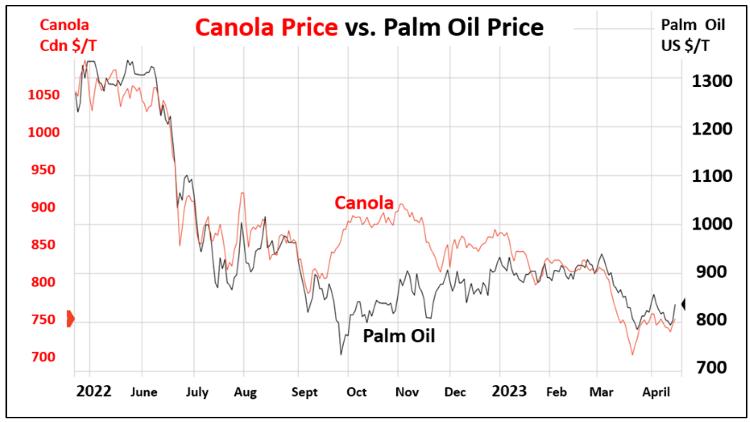
“In a competitive world market, lower price can outweigh other characteristics of a product,” explains Blue. “Although canola is shown as priced in Canadian dollars and palm oil in U.S. dollars per tonne, the message from the chart below is that the price of a competing vegetable oil like palm oil is correlated to the price of canola. There are times like last fall when canola seed had relative price strength, but overall, the price correlation has been high during the past year.”
“Higher retail food and beverage store sales reported during the pandemic in early 2020 settled down to a more consistent level by late 2022,” says Jeewani Fernando, provincial consumer market analyst with the Alberta government. “December 2022 sales value for food and beverage stores was close to $1.6 billion which is about 11% higher than the same month in 2019, pre-pandemic.” sales, after the loosening of nearly 2 years of pandemic restrictions, food service and drinking place sales have improved to about $928 million dollars in December 2022,” points out Fernando. “Total sales in December 2022 were higher than sales in December 2019. However, with food price inflation at its highest point in decades, higher prices have given a lift to total food service sales as well.”
The long-term sales trend shows that usually, sales value during the month of December is relatively higher than other months. With food price inflation at its highest point in decades, higher prices have given a lift to total food and beverage store sales figures.
The sharp move lower of canola prices in March 2023 coincided with a drop in palm oil prices, soybean oil prices and other large volume vegetable oil prices.
“Crude oil prices also dropped during that period, evidence of the increasing connection of vegetable oil to the fuel industry,” says Blue.
“Such price correlation among vegetable oils is a reminder that the Canadian canola market is not isolated and is subject to price action of competing products across the world.”
Quarterly sales trends show that food and beverage store sales were up 3.75% in the fourth quarter of 2022 compared to the third quarter of 2022. Grocery stores recorded a 4.3% sales increase with supermarkets and grocery stores reporting a 6.3% increase and convenience stores reporting a significant drop in sales (-24%). Specialty food stores recorded a 3.8% increase in sales, while beer, wine and liquor store sales increased by 1.3%.
“In terms of food service sector
For foodservice and drinking sales, drinking place sales decreased by 7.7% in the fourth quarter of 2022, compared to the third quarter of 2022. This decline can be attributed to seasonal trends. Foodservice and drinking place sales normally peak during summer (July and August) and then decrease towards the end of the year.
In terms of total value, annual quarterly sales for total foodservice and drinking places increased by 16.4% between the fourth quarter of 2021 and the fourth quarter of 2022. Special food services restaurants, drinking places (alcoholic beverages) and full-service restaurants recorded significantly higher sales with 36.4%, 26.2%, 23.9% respectively.


