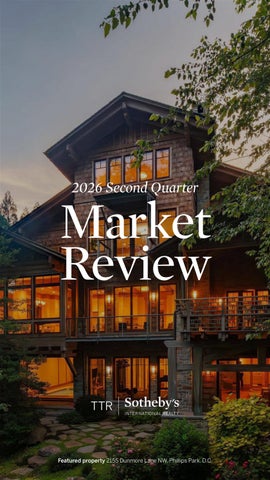
2026 Second Quarter
Market Review
Featured property 2155 Dunmore Lane NW, Phillips Park, D.C.
P R E FAC E 2 0 2 6 S EC O N D Q U A R T E R M A R K E T R E V I E W
Across the Washington Metropolitan Area, the market is rewarding a more disciplined approach. While single-family home sales surged in Washington, D.C. and in the closein suburbs of Maryland and Northern Virginia (where both unit volume and price points continued to rise) condominium sales, by contrast, slipped in every market, showing evidence of sustained sensitivity to rising condo fees, elevated interest rates, and uncertainty in the federal labor market.
P R E FAC E 2 0 2 6 S EC O N D Q U A R T E R M A R K E T R E V I E W
Marketing timelines have lengthened, reflecting today’s more measured buyer. Still, several submarkets stood apart with genuine strength. Washington, D.C’s singlefamily home market was led by Cleveland Park, where the median sale prices rose 37.5% to $2.2 million as days on market compressed by nearly 60% year-over-year.
22786 Creighton Farms Drive, Leesburg, VA
P R E FAC E 2 0 2 6 S EC O N D Q U A R T E R M A R K E T R E V I E W
3937 Military Road NW, Chevy Chase, D.C.
American University Park matched that momentum with a 16% price gain on 46% higher volume. In Northern Virginia, Alexandria delivered across-the-board strength, while McLean held its position as the region’s premier market for single-family homes at a $2.1 million median sale price.
P R E FAC E 2 0 2 6 S EC O N D Q U A R T E R M A R K E T R E V I E W
With mid-term elections approaching, the Washington Metropolitan Area’s next chapter is likely to hinge as much on federal hiring signals as on interest rates. In the meantime, the edge for both sides of the transaction are clear.
2045 Maidstone Farm Road, Annapolis, MD
P R E FAC E 2 0 2 6 S EC O N D Q U A R T E R M A R K E T R E V I E W
2610 Garfield Street NW, Woodley Park, D.C.
For sellers, preparation, positioning, and pricing to today’s values matter more than ever. For buyers navigating the upper end of the market and the broader condominium segment, we see a real window to secure exceptional properties on favorable terms.
C O N T I N U E TO T H E R E P O R T
District of Columbia Single Family Homes
3519 Lowell Street NW Cleveland Park, D.C.
K A LO R A M A
$2,662,500 11% Median Sold Price
6
14%
Homes Sold
68 28% Avg. Days on Market
C L E V E L A N D PA R K
$2,200,000 38% Median Sold Price
12
20%
Homes Sold
13 59% Avg. Days on Market
CHEVY CHASE (DC)
$1,625,000 16% Median Sold Price
45 12%
20 31%
Homes Sold
Avg. Days on Market
1863 Newton Street NW, Mount Pleasant, D.C.
F O R E ST H I L L S
$2,925,000 22% Median Sold Price
15
50%
Homes Sold
56 128% Avg. Days on Market
MOUNT PLEASANT
$1,543,000
15%
Median Sold Price
23 92%
28 87%
Homes Sold
Avg. Days on Market
A U PA R K
$1,505,000 16% Median Sold Price
32 46%
15 19%
Homes Sold
Avg. Days on Market
G EO R G E TOW N
$2,109,500
9%
Median Sold Price
36 33%
76 76%
Homes Sold
Avg. Days on Market
G LOV E R PA R K / B U R L E I T H
$1,325,000
9%
Median Sold Price
23 35%
18 26%
Homes Sold
Avg. Days on Market
S P R I N G VA L L E Y
$2,677,500
5%
Median Sold Price
18
50%
Homes Sold
40 38% Avg. Days on Market
W E S L E Y H E I G H TS
$2,650,000 4% Median Sold Price
7
0%
Homes Sold
15
83%
Avg. Days on Market
PA L I S A D E S
$1,365,000
34%
Median Sold Price
10 Homes Sold
29%
32
21%
Avg. Days on Market
LO G A N C I R C L E
$1,987,500
1%
Median Sold Price
9
29%
Homes Sold
35
4%
Avg. Days on Market
DUPONT CIRCLE
$2,100,000 32% Median Sold Price
9
10%
Homes Sold
100 61% Avg. Days on Market
S H AW
$1,100,000 25% Median Sold Price
11 Homes Sold
38%
39
23%
Avg. Days on Market
CA P I TO L H I L L
$1,150,000
0%
Median Sold Price
110 9%
32
14%
Homes Sold
Avg. Days on Market
B LO O M I N G DA L E / L E D R O I T PA R K
$917,500
8%
Median Sold Price
18 Homes Sold
13%
30 53% Avg. Days on Market 1829 5th Street NW, LeDroit Park, D.C.
S I N G L E FA M I LY H O M E S
The Most Active Markets of D.C. #1 Capitol Hill #2 Georgetown #3 Chevy Chase #4 Spring Valley #5 Kent
3939 52nd Street NW Spring Valley, D.C.
Northern Virginia Single Family Homes
7316 Old Carters Mill Road The Plains, Virginia
ALEXANDRIA CITY
$1,060,000 10% Median Sold Price
330 5%
16
1%
Homes Sold
Avg. Days on Market
A R L I N GTO N C O U N T Y
$1,294,359
5%
Median Sold Price
385
8% 22
Homes Sold
2%
Avg. Days on Market
FA L L S C H U R C H C I T Y
$1,499,736
5%
Median Sold Price
41 Homes Sold
0%
16
21%
Avg. Days on Market
FA I R FA X C O U N T Y & FA I R FA X C I T Y
$890,000
4%
Median Sold Price
3,377 10% 18 Homes Sold
5%
Avg. Days on Market
LO U D O U N C O U N T Y
$873,965
1%
Median Sold Price
1,329 4%
19
8%
Homes Sold
Avg. Days on Market
FA U Q U I E R C O U N T Y
$676,944
8%
Median Sold Price
292 13%
32
1%
Homes Sold
Avg. Days on Market
S I N G L E FA M I LY H O M E S
The Most Active Markets of Northern VA #1 Alexandria #2 Arlington #3 McLean #4 Vienna #5 Fairfax
6026 Little Falls Road, Arlington, VA
Maryland Single Family Homes
973 Main Street North Potomac, MD
M O N TG O M E R Y C O U N T Y
$765,000
1%
Median Sold Price
2,351 7%
26 25%
Homes Sold
Avg. Days on Market
ANNE ARUNDEL COUNTY
$554,790
4%
Median Sold Price
1,920 8%
28
7%
Homes Sold
Avg. Days on Market
TA L B OT C O U N T Y
$489,000
2%
Median Sold Price
163 9%
83
24%
Homes Sold
Avg. Days on Market
S I N G L E FA M I LY H O M E S
The Most Active Markets of Maryland #1 Bethesda #2 Silver Spring #3 Annapolis #4 Rockville #5 Potomac
7607 Hemlock Street, Bethesda, MD
District of Columbia Condos & Co-ops
1111 23rd Street NW, Unit 3A West End, Washington D.C.
DUPONT CIRCLE
$487,450
17%
Median Sold Price
34
19%
Units Sold
42
44%
Avg. Days on Market
LO G A N C I R C L E
$566,800
6%
Units Sold Price
30
9%
Units Sold
52
23%
Avg. Days on Market
S H AW
$777,500
21%
Median Sold Price
10 Units Sold
17%
164 104% Avg. Days on Market
131 11th Street NE, Unit PH, Capitol Hill, D.C.
CA P I TO L H I L L
$559,000
13%
Units Sold Price
33
0%
Units Sold
79
29%
Avg. Days on Market
F O G GY B OT TO M / W E ST E N D
$540,000
4%
Median Sold Price
28 Units Sold
26%
60 8% Avg. Days on Market
G EO R G E TOW N
$735,312
19%
Median Sold Price
18
10%
Units Sold
58
18%
Avg. Days on Market
K A LO R A M A
$657,500
10%
Units Sold Price
22 Units Sold
12%
51
20%
Avg. Days on Market 2516 Q Street NW, Unit Q209, Georgetown, D.C.
CONDOS & CO-OPS
The Most Active Markets of D.C. #1 Columbia Heights #2 Capitol Hill #3 Logan Circle #4 Dupont Circle #5 Georgetown
1737 Willard Street NW, Unit 7 Dupont Circle, D.C.
Northern Virginia Condos & Co-ops
7887 Jones Branch Drive, Unit #2002 McLean, VA
ALEXANDRIA CITY
$415,000
3%
Median Sold Price
333
13% 39
Units Sold
34%
Avg. Days on Market
A R L I N GTO N C O U N T Y
$498,725
10%
Units Sold Price
318 4%
34
14%
Units Sold
Avg. Days on Market
FA L L S C H U R C H C I T Y
$597,500
17%
Median Sold Price
22 Units Sold
5%
46 47% Avg. Days on Market
FA I R FA X C O U N T Y & C I T Y
$385,000
0%
Median Sold Price
788
5%
Units Sold
34
37%
Avg. Days on Market
LO U D O U N C O U N T Y
$504,900
1%
Units Sold Price
266 7%
48 27%
Units Sold
Avg. Days on Market
FA U Q U I E R C O U N T Y
$282,000
22%
Median Sold Price
17 Units Sold
31%
30 40% Avg. Days on Market
CONDOS & CO-OPS
The Most Active Markets of Northern VA #1 Alexandria #2 Arlington #3 Ashburn #4 Reston #5 Fairfax
520 John Carlyle Street, Unit #107 Alexandria, VA
Maryland Condos & Co-ops
8551 Connecticut Avenue, Unit #201 Chevy Chase, MD
M O N TG O M E R Y C O U N T Y
$335,000
2%
Median Sold Price
633 5%
47
37%
Units Sold
Avg. Days on Market
ANNE ARUNDEL COUNTY
$365,000
1%
Units Sold Price
262 5%
42
84%
Units Sold
Avg. Days on Market
TA L B OT C O U N T Y
$317,500
38%
Median Sold Price
4 Unit Sold
100% 66 41% Avg. Days on Market
CONDOS & CO-OPS
The Most Active Markets of Maryland #1 Annapolis #2 Silver Spring #3 Rockville #4 Bethesda #5 Potomac
10833 Luxberry Drive, Unit #26 Rockville, MD
Real Estate like no other
TM
explore our properties
Data courtesy of Bright MLS. 4/1/2026-6/30/2026 vs. 4/1/2025-6/30/2025. Data deemed reliable, but not guaranteed. © TTR Sotheby’s International Realty. All Rights Reserved. The Sotheby’s International Realty trademark is licensed and used with permission. Each Sotheby’s International Realty office is independently owned and operated, except those operated by Sotheby’s International Realty, Inc. TTR Sotheby’s International Realty fully supports the principles of the Fair Housing Act and the Equal Opportunity Act. All offerings are subject to errors, omissions, changes including price or withdrawal without notice.