
21 minute read
APPENDIX F: HEDS DIVERSITY AND EQUITY CAMPUS CLIMATE SURVEY

Figure 4. Sexual Orientation
SURVEY FINDINGS
The following analysis is organized by (a) overall diversity and equity findings; (b) Trinity compared to other similar institutions; (c) four overarching key indicators; and (d) emerging themes and recommendations. This report primarily focused on areas where the most significant or relevant findings arose. For additional survey details or questions, contact the Office of Institutional Research and Effectiveness or the Vice President for Student Life.
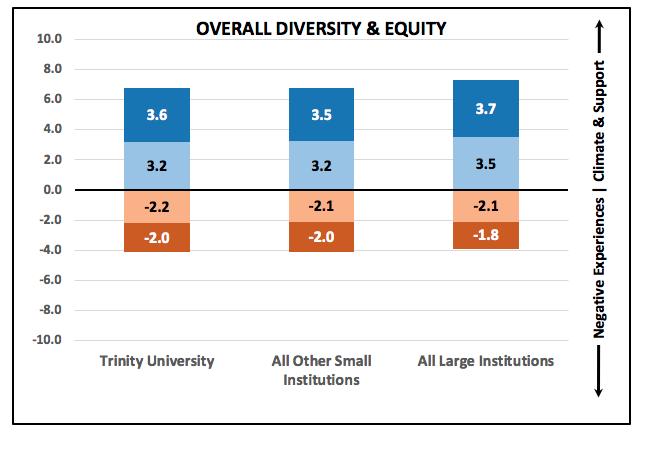
A. OVERALL DIVERSITY AND EQUITY
As previously mentioned, HEDS developed survey questions within four key indicators: campus climate for diversity and equity, institutional support for diversity and equity, insensitive or disparaging remarks, and discrimination or harassment. The survey questions were rated on a 5‐point Likert Scale. Overall, Trinity fares similarly to other institutions (small and large) in all four key indicators. When compared only to other small institutions, Trinity has slightly higher levels of satisfaction with campus climate for diversity and equity but reported higher rates of hearing disparaging or discouraging remarks.
Figure 5. Four Key Indicator Scores for DEI Note. HEDS completed an inverse scale for insensitive or disparaging remarks, and discrimination or harassment, which are reflected in orange above.
B. TRINITY UNIVERSITY (TU) COMPARED TO OTHER PARTICIPATING SMALL INSTITUTIONS (OPSI)
HEDS compared Trinity’s performance of the four key indicators--campus climate, institutional support, insensitive/disparaging remarks, and experiences of discrimination or harassment--to other small institutions. Each of the indicators was further analyzed for significant differences according to role, gender, race/ethnicity, sexual orientation, and political affiliation. See Appendices C1, D1, E1, and F1.
Strength refers to a medium or large difference, indicating a more positive experience as compared to OPSI.
Challenge refers to a medium or large difference, indicating a more negative experience as compared to OPSI.
Key Indicator 1: Campus Climate for Diversity and Equity
Strengths: Several groups scored the overall campus climate on average higher than OPSI. Of employee groups, staff and administrators; men and women; US white and US persons of color; heterosexual and LBG+ respondents; and conservative, middle of the road, and far left respondents indicated a medium or large difference in compared scores. Of student groups, international students indicated a large difference in score as compared to OPSI.
Challenges: Other groups indicated a more negative perception of the campus climate than those at OPSI. Specifically, African American/Black and South Asian and lesbian respondents indicated a medium difference compared to other institutions.
Key Indicator 2: Institutional support
Strengths: Of employee respondents, U.S. persons of color, LGB+, and conservatives all indicated a medium or high difference compared with OPSI, meaning a more positive perception of institutional support. Of student respondents, international students reported a medium difference.
Challenges: Most of the challenges in this indicator come from student groups. Female students, African American/Black, South Asian, U.S. persons of color, lesbian and liberal students all indicated a medium or high level of negative perceptions of institutional support compared with OPSI.
Key Indicator 3: Insensitive or disparaging remarks
Strengths: Administrators and employees identifying as far left and conservative were least likely to respond that they heard insensitive or disparaging remarks. When compared to OPSI, the differences were at medium or high levels.
Challenges: Among both students and employees, African American/Black, South Asian, and lesbian employees were more likely to indicate they heard such remarks at medium to high levels as compared with OPSI.
Key Indicator 4: Harassment or discrimination
Strengths: Of all respondents, Asian Americans and Latin Americans say they experience fewer incidents of harassment or discrimination as compared to OPSI.
Challenges: South Asian students and employees indicated experiencing more incidents of harassment or discrimination than peers at OPSI.
C. TRINITY RESULTS FOR KEY INDICATORS
For all indicators, perspectives varied by respondents. The following highlights for each indicator reflect items that either showed the widest differences between groups or were a notable finding from either a positive or negative perspective.
Key Indicator 1: Campus Climate for Diversity and Equity
Specific data tables can be found in Table 1, Appendix C1, and Appendix C2.
Findings by Group
Overall, of the four key indicators, campus climate for diversity and equity had the most favorable score. See Figure 5 previously illustrated.
Role. In general, students, faculty, and staff/administrators all responded favorably by indicating they were either “very satisfied” or “generally satisfied” with the overall campus climate related to diversity and equity (Table 1).
Staff/administrators respondents had more positive perspectives of campus climate for diversity and equity than undergraduate students. Faculty scores fell in the middle. Students responded least favorably to the campus experience regarding diversity. Faculty and staff/administrators rated the extent to which you feel all community members experience a sense of belonging or community lowest.
Race/ethnicity. International individuals rated campus climate for diversity and equity the highest, followed by U.S. white individuals, and U.S. persons of color. Only 18% of U.S. students of color were “very satisfied” or “generally satisfied” with the overall campus climate, compared to 32% of white students, and compared to 49% of employees of color.
Sexual orientation. Heterosexual individuals rated campus climate for diversity and equity higher than LGB+ individuals. Only 17% of LGB+ students were “very satisfied” or “generally satisfied” with the overall campus climate. However, 40% of LGB+ employees were “very satisfied” or “generally satisfied” with the overall campus climate (Appendix C1).
Gender. Women reported a less positive perception of campus climate for diversity and equity than their male peers. However, non‐binary individuals were the least satisfied of all gender groups. Only five percent of non‐ binary students were “very satisfied” or “generally satisfied” with the overall campus climate at Trinity (Appendix C2).
Political affiliation. Conservatives rated campus climate highest, followed by middle‐of‐the‐road, and then liberal respondents. Responses indicate conservatives and middle‐of‐the‐road individuals are more satisfied with the campus climate for diversity and equity than liberal individuals (Appendix C2).
Frequencies for Statements in the Campus Climate for Diversity and Equity Indicator
Students Trinity University
Faculty Staff/Administrat ors
Overall campus climate The campus experience/environment regarding diversity at Trinity University The extent to which you experience a sense of belonging or community at Trinity University The extent to which you feel all community members experience a sense of belonging or community at Trinity University Very or Generally Satisfied
Total
Very or Generally Satisfied
Total
Very or Generally Satisfied
Total
Very or Generally Satisfied n 500 672 300 673 437 673 250 672
Please indicate your level of satisfaction with the following at Trinity University. (Q1)
n 74%
100% 143
79%
100%
182 45%
100% 109
182 130 182 81 182 60%
100% n
230
268
184
65%
100%
Total
37%
100%
268
Table 1. Frequencies for Campus Climate –Key Indicator One.
71%
100%
45%
100% 205
268
164
268
Key Indicator 2: Institutional Support
Specific data tables can be found in Table 2, Appendix D1, and Appendix D2.
Findings by Group
Respondents answered more favorably on items related to campus climate for diversity and equity, but less favorably on items regarding the institutional support for campus diversity and equity. See Figure 5 previously illustrated.
Role. Concerning institutional support, respondents in all roles marked “senior leadership demonstrates a commitment to diversity and equity on this campus” more favorably than they did on the other survey questions related to institutional support. Students (42%), faculty (70%), and staff/administrators (68%) responded “strongly agree” or “agree.” (Table 2).
Undergraduate students reported much lower perceptions of institutional support than staff. Faculty scores fell in the middle (Appendix D2).
Race/ethnicity. International individuals rated institutional support for diversity and equity the highest, followed by U.S. white individuals, and U.S. persons of color. Only six percent of students of color answered "agree" or "strongly agree" for questions centered around institutional support, compared to 30% of employees of color.
Only four percent of African American/Black respondents and seven percent of South Asian respondents answered “agree” or “strongly agree” for questions centered around institutional support for diversity and equity (Appendix D1).
Sexual orientation. Heterosexual respondents had a more positive view of institutional support than LGB+ respondents (Appendix D2). When disaggregating LGB+ groups, heterosexual and gay respondents showed the highest scores (20% and 19%, respectively) for selecting “agree” or “strongly agree" related to institutional support for diversity and equity. The respondents in the Asexual, Bisexual, Queer, and Questioning categories had the lowest scores (6%, 6%, 6%, and 4%, respectively). Only six percent of LGB+ students responded “agree” or “strongly agree” to questions concerning institutional support (Appendix D1).
Gender. Women reported a less positive perception of campus climate for diversity and equity than their male peers. Similar to answers about campus climate, non‐binary individuals were the least satisfied of all gender groups (Appendix D2).
Political affiliation. Like answers about campus climate, conservatives rated institutional support the highest, followed by middle‐of‐the‐road, and then liberal individuals. Students and employees who identified as liberal perceived lower institutional support than students and employees who identify as conservative (Appendix D1).
Frequencies for Statements in the Institutional Support for Diversity and Equity Indicator
Students Trinity University
Faculty Staff/Administrat ors
The campus environment is free from tensions related to individual or group differences. Recruitment of historically marginalized students, faculty, and staff is an institutional priority. Retention of historically marginalized students, faculty, and staff is an institutional priority. Senior leadership demonstrates a commitment to diversity and equity on this campus. Strongly Agree or Agree
Total
Strongly Agree or Agree
Total
Strongly Agree or Agree
Total
Strongly Agree or Agree n 197 672 232 672 235 671 284 673 n 63 181 101 182 93 182 127 182
Please indicate your level of agreement with each of the following statements about Trinity University. (Q2)
29%
100%
n 35%
100% 128
35%
100%
268 55%
100% 144
35%
100%
268 51%
100% 137
Total
42%
100%
267
Table 2. Frequencies for Institutional Support –Key Indicator Two.
70%
100% 181
267
Key Indicator 3: Disparaging or Insensitive Remarks
Specific data tables can be found in Appendix E2‐E4.
Findings by Group
Role. Undergraduate students reported hearing disparaging remarks more often than faculty or staff/administrators. For students, other students were reported as the primary source of the insensitive or disparaging remarks made (66% responded hearing students make insensitive or disparaging remarks about other students often or very often). Faculty were more likely than staff/administrators to indicate that undergraduates were the source of insensitive or disparaging remarks. Faculty were also more likely than undergraduate students and staff/administrators to indicate that faculty were the source of insensitive or disparaging remarks. Last, faculty were less likely than undergraduate students to indicate that staff/administrators were the source of insensitive or disparaging remarks at least some of the time. (Appendix E3).
The topics of the insensitive or disparaging remarks noted most often were about ● people with a particular political affiliation (students at 55%, faculty at 27% and staff at 23%), ● an individual’s race and ethnicity (students at 21%, faculty at 4%, and staff at 4%), ● sexual orientation (students at 15%, faculty at 2%, and staff at 2%), and ● gender identity (students at 19%, faculty at 5%, and staff at 3%).
At least 75% of all role groups reported rarely or never hearing remarks regarding individuals with a disability (Appendix E3).
Race/ethnicity. International individuals reported the lowest levels of hearing insensitive or disparaging remarks, followed by US white individuals, and then US persons of color (Appendix E2). Students of color reported hearing insensitive or disparaging remarks about each of the following groups more often than white students: ● people of a particular racial and/or ethnic identity (31% compared to 12%), ● people of a particular socioeconomic background (18% compared to 12%), ● immigrants (20% compared to 9%), and ● people for whom English is not their native language (15% compared to 4%).
Faculty of color indicated that they heard more insensitive or disparaging remarks than white faculty about ● people who have a particular racial and/or ethnic identity (11% compared to 1%), ● people from a different socioeconomic background (11% compared to 2%) (Appendix E4).
Sexual orientation. Heterosexual individuals reported hearing fewer insensitive or disparaging remarks than LGB+ individuals (Appendix E2). LGB+ students reported that other students were the most common source of insensitive or disparaging remarks (76%) (Appendix E4).
Gender. Non‐binary individuals reported hearing the most insensitive or disparaging remarks, followed by women. Men were less likely than either group to report hearing such remarks (Appendix E2).
Political affiliation. Liberal individuals reported hearing insensitive or disparaging remarks more than middle of the road and conservative individuals (Appendix E2).
Key Indicator 4: Discrimination and/or Harassment Key Findings
Specific data tables can be found in Appendix F1‐F4.
Findings by Group
The following groups experienced the highest levels of discrimination and harassment (for all respondents): ● South Asian (53%), African American/Black (38%), Asian (33%), and ● Lesbian (48%), Questioning (37%), Bisexual (36%)
Role. With respect to discrimination and/or harassment, 28% of students, 26% of faculty, and 13% of staff/administrators reported “ever being discriminated against” on Trinity campus or a university affiliated facility. When asked if “the process for investigating acts of discrimination or harassment at TU is clear,” faculty (45%) and staff/administrators (56%) were more likely to respond “agree” or “strongly agree” than students (24%) (Appendix F3).
Students. Students who reported having experienced discrimination or harassment at Trinity were more likely than faculty or staff/administrators to indicate that the characteristics targeted were ● race/ethnicity (28% of undergraduates responding often or very often compared to 9% of employees), ● gender identity (17% compared to 12%), or ● political affiliation (18% compared to 8%) (Appendix F3).
The forms of discrimination or harassment most commonly reported by students include: ● being ignored (62%), ● hearing derogatory remarks (61%), and ● being stared at (58%).
Less common but more severe forms of discrimination or harassment also reported by students were ● sexual violence (27%), ● being intimidated or bullied (24%), and ● fearing for physical safety (17%).
The locations where students reported experiencing the most discrimination or harassment were ● on‐campus housing (54%), ● classrooms (49%), and ● dining halls, recreational spaces, or athletic facilities (45%).
Similar to insensitive or disparaging remarks, the most commonly reported source of discrimination or harassment for students was other students (93%), followed by faculty (35%) (Appendix F2).
Faculty. The forms of discrimination most commonly reported by faculty were ● being ignored (62%), ● being the subject of derogatory remarks (48%), and ● being intimidated/bullied (48%). As with insensitive or disparaging remarks, the most commonly reported source of discrimination or harassment for faculty was other faculty (76%), followed by students (48%) and then administrators (19%) (Appendix F2).
Staff/administrators. Staff/administrators (21%) were more likely than students (4%) or faculty (6%) to indicate that they have experienced age or generation repeated discrimination or harassment at Trinity (Appendix F3). The forms of discrimination most commonly reported by staff/administrators were ● being ignored (79%), ● derogatory remarks (53%), and ● being intimidated/bullied (37%).
The most commonly reported source of discrimination or harassment for staff/administrators was other staff (63%) and administrators (37%), followed by faculty (32%) (Appendix F2).
Gender. Non‐binary individuals (35%) reported the greatest levels of discrimination or harassment, followed by women (27%) and then men (18%) (Appendix F2).
Race/ethnicity. US white individuals (21%) reported the lowest level of discrimination or harassment, followed by international individuals (22%), and then US persons of color (28%) (Appendix F2). Students of color were more likely than white students to report ● experiences of discrimination on the basis of race/ethnicity and immigration status (15% compared to 2%), ● being stared at (18% compared to 7%), ● being singled out (8% compared to 3%), and ● being profiled (16% compared to 4%).
Students of color report that the discrimination or harassment occurred in a classroom (13%) compared to white students (6%) (Appendix F4).
Faculty of color reported a greater frequency than white faculty of discrimination or harassment based on their race/ethnicity (4% compared to 1%) and their status as an immigrant (4% compared to 0%). Staff and administrators of color (4%) were more likely than white staff/administrators (0%) to indicate that they had experienced racial or ethnic profiling (Appendix F4).
Sexual orientation. LBG+ individuals (32%) report experiencing more discrimination and harassment than heterosexual individuals (21%) (Appendix F2). LGB+ students were more likely than heterosexual students to indicate that they ● have experienced discrimination or harassment at Trinity because of their sexual orientation (6% compared to 1%), ● had been singled out (9% vs. 4%), and ● were denied service or access to resources in the last year (5% compared to 1%). LGB+ students report that the discrimination or harassment occurred in on‐campus housing (17%). LGB+ employees (2%) were more likely than heterosexual employees (0%) to indicate that they have experienced discrimination or harassment at Trinity because of their sexual orientation (Appendix F4).
Political affiliation. Conservative and liberal individuals reported similar levels of discrimination or harassment (29% of conservative and 27% of liberal individuals). Middle‐of‐the‐road individuals (15%) were least likely to report discrimination or harassment (Appendix F2).
D. EMERGING THEMES AND RECOMMENDATIONS
The following commentary includes observations that researchers had after working with the DEI survey data. These are not necessarily based on statistical tests and are simply general comments and themes that emerged to the researchers.
Groups are experiencing the diversity and equity climate at Trinity differently based on the type of role within Trinity. For instance, often, student respondents were less satisfied than employee groups. In general, the staff/administrator group responded more favorably than did students and faculty.
Similarly, individuals of color and members of the LGB+ group reported more negative experiences and/or perceptions than many other groups. This is especially true for a) students who identify as a person of color or LGB+, b) females who identify as a person of color or LGB+, and c) those who are African American/Black and/or South Asian.
For the LGB+ group, individuals who identified as gay or when the groups were collapsed into LGB+ often marked responses favorably. However, when results were disaggregated, the lesbian group often responded less favorably, indicating that members within the LGB+ population are experiencing the diversity and equity climate differently.
Last, in general, TU tended to fare better across all groups on campus climate questions but received many lower findings on items related to institutional support. This may be an indicator that while the overall campus climate is acceptable, the perceived support for diversity and equity is an area of challenge that Trinity should explore further.
Recommendations for DEI strategic indicators. The following items were identified as potential top-level metrics to monitor Trinity’s performance as it relates to diversity, equity, and inclusion on campus. These data could be disaggregated by available demographic groups.
Table 3. Percentage of Highest Level Responses by Question and Category. Indicator Responses N
Climate-Overall: Satisfaction with overall campus climate
Climate-Diversity: Satisfaction with campus experience/environment regarding diversity
Climate-Belonging: Satisfaction with extent to which you feel a sense of belonging or community
Climate-Community: Satisfaction with extent to which you feel all community members experience a sense of belonging or community
Support-Environment: Agreement with campus environment is free from tensions related to individual or group differences
Support-Recruitment: Agreement with recruitment of marginalized students, faculty, and staff is an institutional priority
Support-Retention: Agreement with retention of marginalized students, faculty, and staff is an institutional priority
Support-Commitment: Agreement with senior leadership demonstrates a commitment to diversity and equity High Level
High Level
High Level
High Level
High Level
High Level
High Level
High Level 883
599
780
500
391
482
469
606 78%
52%
69%
44%
34%
42%
41%
54%
Notes. High Level = number of 4 & 5 responses. All questions started with “please indicate your level of …”
APPENDIX G: EXECUTIVE SUMMARY OF STAND BY SYSTEMS II (SBS), INC. CAMPUS-WIDE INTERVIEWS
OVERVIEW
As part of the University’s commitment to diversity, equity, and inclusion, President Danny Anderson contracted Stand By Systems II (SBS), Inc. to conduct campus-wide interviews composed of students, staff, and faculty. From these interviews, SBS generated a report that highlighted key action areas and a sample of the experiences shared by interviewees, while maintaining their confidentiality. This report outlines questions and recommendations based on perceptions gathered during interviews and was provided to the Presidential Task Force on Diversity and to the Executive Leadership Team.
Confidentiality is essential as the University continues to gather information to assess campus climate, listen to the experiences of its students, faculty, and staff, and address next steps. In reviewing findings on the full report, it should be noted that all statements reflecting interviewee experiences are currently unverified.
A report of voices
130 interviews. 3.5 weeks. 11 areas of action.
SBS selected a sampling of employees to be interviewed - for faculty and staff this was based on the total number of employees in that department. For the student interviews, (Student Government, The Trinitonian, Student Judiciary, Greek Life, student organizations representing areas of D&I, Tigers for Liberty), several members of the campus-wide student centers of leadership were invited to select two representatives.
A wide range of departments and levels shared their appreciation of the basic services that were going well and where there were negative experiences. For many diverse groups, especially the Black students and faculty and staff of color, the apparent clashes of cultures are numerous and do not equate with the traditional experiences at Trinity University. There was an echoing sentiment from those with whom we spoke, acknowledging not knowing exactly what to do while realizing something must be done. Few were unaware of or actively resistant to or
uninterested in the need to do more to adopt diversity and inclusion on campus.
SUBJECTIVE AREAS OF ACTION
1. Recruiting Faculty, Staff, and Students
Recommendations
1. Undertake a detailed examination of existing recruiting policies and practices from the perspective of whether there are biases that block or impede diverse candidates' consideration for job opportunities. 2. Research the organizations that have created successful models that prepare diverse high school students for college. Chicago Scholars and INROADS are examples of organizations that prepare minority students for college. Potentially this could increase the pipeline for students of color who are not in the pool of candidates who consider
Trinity.
2. Creating a Safe Environment/Structures for Difficult Discussions
Recommendations
1. Create an ongoing, visible process through which each division can receive reasoned challenges to their systems and policies and identify system and policy flaws or needed changes. Through leadership and transparent communication, establish checks and balances on individual leaders or covert policies that are determined to have unintentionally or intentionally harmed staff or students, limited their freedom of speech or diminished the value of their diversity. 2. Establish and publicize at least twenty (20) different ongoing safe venues where anyone within the campus can explore over time complex issues connected with the campus and public challenges that underpin a wide variety of societal diversity including race, gender, sexual orientation and elitist behaviors. 3. Create a system within Trinity University which will ensure that each student who graduates from the university has had at least one in-depth experience of at least fifteen hours each year gaining understanding of one or more critical diversity issues while at
Trinity. 4. Design developmental systems and processes whether they are colloquia, safe small group experiences, departmental experiences or other creative activities to invite these safe developmental explorations. Create ongoing measures of the campus progress in each division toward this being an indelible strand in the beautiful weave that is Trinity education.
3. Creating an Environment at Trinity University That Invites and Reinforces Trust by All
Recommendations
1. Transform a part of the Trinity New Student Orientation Program and the beginning of each academic semester at Trinity by having knowledgeable persons working to creatively develop multifaceted activities that can be the basis for developing sincere relationships with students who have differences from each other. 2. Require each supervisor, manager, or leader to collaboratively design monthly cultural or diversity activities that promote the development of trusting relationships with persons who bring diversity differences to the campus or in our business relationships and with our alumni.
4. Communication –Listening & Transparency
Recommendations
1. Offer training on having Difficult Conversations with administrators, faculty, staff, alumni, and students together in different manageable configurations. 2. Create venues to build connections (virtual thought groups, online book/video discussions, experiences in San Antonio, etc.,) to bring alumni, students, staff, and faculty together, outside the classroom, for meaningful dialogue. 3. Compare best practices of similar universities to Trinity in response to the DACA,
PRIDE Issues, Me Too Movement, Black Lives Matter Movement and other issues of racial justice, diversity and inclusion.
5. Destroying Destructive “Isms”
Recommendations
1. Publicly recognize the existence of destructive “isms” along with a commitment to educate and work against them. 2. Increase the level of campus awareness and understanding for everyone. Continue the multiple campus venues and colloquia that have been increasingly addressing this, e.g. curriculum, speaker series, classroom dialogue groups, seminar offerings, staff meeting discussions. Add cross-racial discussion groups and experiences along with other activities using campus creativity to assist this option. 3. Invite people interested in eliminating the impact of destructive isms and microaggressions in various careers to campus to join together as change agents in this area.
6. The DI Position/Office Support
Recommendations
1. Design a comprehensive diversity and inclusion function to respond to the breadth of systemic needs at Trinity. 2. Utilize knowledgeable campus professionals and add new organizational positions and processes to ensure an integrated function. 3. Review the budgets of the cultural and organization initiatives that were actualized, such as the MLK Walk, Pride Activities, etc., as well as the initiatives that were requested and not actualized. Utilize these findings to help create a more robust support system and budget for diversity and inclusion activities for students, staff, and faculty. 4. Create shared diversity goals and objectives between divisions and Department Heads to increase the likelihood of shared accountability and systemic changes.
