56 minute read
The Lawn Institute Turfgrass Research Update


THE LAWN INSTITUTE
TURFGRASS RESEARCH UPDATE
By Casey Reynolds, PhD
The Lawn Institute (TLI) has a long-standing history of funding natural grass research at nationally and globally recognized universities. Each year, TLI sends out a call for proposals to university researchers throughout the world to be compiled and reviewed by the TLI Research Committee with funding decisions made during the TPI International Education Conference. The 2021 TLI Research Committee members listed in Table 1 are comprised of TPI members, staff, university educators, and industry personnel in order to ensure that TPI members and their interests are fully represented in the process while also leaning on university, United States Golf Association (USGA), and National Turfgrass Evaluation Program (NTEP) personnel for input on current research at other institutions.
Table 1. 2021 TLI Research Committee Members Committee Member Position Company
Duane Klundt Chair Mountain View Seeds Jim Keevan TPI Board Liaison SelecTurf, Inc. Larry Lemay TPI Board Liaison A-G Sod Farms, Inc. Steve Griffen Member Saratoga Sod Farm, Inc. Spencer Mendenhall Member Raft River Sod Sarah Nolte Member Blue Grass Enterprises, Inc. Jack Karlin Member TWCA Casey Reynolds, PhD Advisor TPI Jay McCurdy, PhD Advisor Mississippi State University Aaron Patton, PhD Advisor Purdue University John Sorochan, PhD Advisor University of Tennessee Kevin Morris Advisor NTEP
*Advisors to the committee do not vote on projects but are present to provide technical input on the quality and potential impact of proposals.
Applications for research funds can be requested on any topic, but the TLI Research Committee places priority on specific research areas that serve natural turfgrass producers and the turfgrass industry. With the help of the TLI research committee, these areas are updated each year and are listed below. Other basic guidelines of the proposals include: applicants are encouraged to adhere to all TLI forms, formats, and deadlines for full consideration of proposals; proposals for single or multiple-year projects will be considered as long as the years and funding amounts are clearly stated; funds cannot be used for faculty salaries; proposals seeking funds for capital expenditures will be reviewed on a case-by-case basis; and overhead or administrative costs shall be held to an absolute minimum, but will not exceed 16 percent.
TLI Research Focus Areas
• Cultural Impacts of Natural Grass - Research that includes, but is not limited to, societal health and well-being, fitness, athletic field safety, socioeconomics, consumer attitudes, etc. • Environmental Awareness of Natural Grass - Research that includes, but is not limited to, carbon sequestration, heat abatement, pollution entrapment, soil remediation, run-off reductions, etc. • Natural Grass Input Reductions - Research that includes, but is not limited to, drought tolerance, reduced water use, nutrient requirements, traffic tolerance, integrated pest management, etc. • Extending Harvested Shelf-Life of Natural Grass • Reducing Production Costs of Natural Grass • Natural Grass Research Communication & Education - Information that can be used to develop content on
The Lawn Institute website for educating policymakers, homeowners, and the general public on turfgrass science, management, impacts, etc. This can include literature reviews on environmental impacts, natural grass benefits, region-specific natural grass selection and management, weed/insect/disease control, and more.
Last year, the committee received seven research proposals focused on items such as soil microbial and arthropod communities in lawns, shade stress, zoysiagrass management techniques, athlete safety, environmental impacts of lawn removal, seed mixture ratios for sod production, and fine fescue sod strength. The Lawn Institute Research Committee met virtually in the spring of 2021 to review, discuss, and vote on these research proposals. The university research projects selected for funding in 2021 are listed below in Table 2 along with past projects that are still currently being funded or that were concluded in 2020. These projects represent a wide range of topics that can benefit TPI members both locally and globally.
Table 2. Research Projects Funded by The Lawn Institute in 2021.
TLI Research Project Title Principal Institution Approved Total Grant
Mapping and Monitoring Turfgrass Cooling Effects from the House to the City Scale in Inland California
Identification of Successful Nitrogen Fertilization Establishment Regimes for Fine fescue Sod Production
Using Ethylene Inhibitors and Polyamine to Extend Turf-type Tall fescue Sod Shelf Life
Determining the Impact of Post-planting Cultural Practices on Sodded Lawn Water Needs in the Cool-Humid Region
USGA/NTEP National Water-Use Trial – Warm-Season Species Marco Schiavon, PhD University of California Riverside 2018-19 $20.000
Aaron Patton, PhD, and Ross Braun Purdue University 2020 $7,437
Xunzhong Zhang, PhD and Mike Goatley, PhD Virginia Tech 2020 $10,000
Cale Bigelow, PhD Purdue University 2020-21 $20,000
Kevin Morris NTEP 2018-21 $30,000
Athlete Hydration during Physical Activity in Excessive Heat on Artificial Turf and Natural Grass
Long-term Environmental Impacts and Energy Balance of Lawn Removal and Conversion to Alternative Landscapes
Sod Strength Characteristics of 24 Fine fescue Cultivars Chase Straw, PhD, and Steven Reichman, PhD Texas A&M 2021 $5,000
Ben Wherley, PhD Texas A&M 2021-23 $30,000
Aaron Patton, PhD, and Ross Braun Purdue University 2021-23 $20,351
($20,000, 2018-19) FINAL REPORT In the last decade, due to prolonged and persisting drought conditions, California initially restricted water that can be allocated for outdoor landscape irrigation State of California, 2009, (https://water.ca.gov/Programs/WaterUse-And-Efficiency/SB-X7-7), and subsequently developed a plan to replace turf in California’s lawns by offering rebates for turf removal to homeowners. Nevertheless, the removal of turf may lead to a drastic increase of urban heat in inland areas of California, such as Riverside. The California Turf Replacement Initiative is the largest turf removal action in the State, where 50 million square feet of turf are proposed to be removed and replaced with drought-tolerant alternative landscapes. As a consequence, many homeowners installed artificial turf or xeriscape to avoid watering. Nevertheless, one of the biggest benefits of natural turfgrass is the ability to cool down the surrounding environment through evapotranspiration. Removal of actively transpiring plants in favor of Crassulacean acid metabolism (CAM) plants that leave most leaf stomata closed during the day could lead to the formation of urban heat islands at the household to the neighborhood scales, especially in the desert inland California. Even worse, heating effects could be caused by the use of synthetic grass as a turfgrass substitute. In addition, irrigation needs to be applied to cool artificial turf sport surfaces and make them playable for athletes during the summer days. The scope of this research was to quantify typical (expected) differences in temperature between natural and artificial turf in urban environments of southern California at the regional and city (Riverside, CA, 92507) scale.
Materials and Methods
Regional-scale thermal imagery 200 artificial grass sport fields, each with a neighboring (within 0.5 km) natural turf sport field across the Los Angeles metro area (i.e., selected urban areas in the Los Angeles, Orange, Riverside, and San Bernadino counties). Boundary polygons at each artificial turf field were created
in ArcMap 10.8. Boundary polygons of similar size were drawn in the neighboring natural turf fields. The selected area of interest and the locations of the 200 sport-field pairs are shown in Figure 1. Thermal imagery was acquired from NASA’s MODIS/ASTER Airborne Simulator (MASTER). All available imagery over each location were averaged and the multi-year average temperature for each selected sport field was calculated. Subsequently, the temperatures measured at the natural sport fields was subtracted to that of the corresponding neighboring artificial turf field to calculate the average temperature difference between artificial and natural turf at the 200 selected sport parks. Using a simple kriging model in ArcMap 10.5’s Geostatistical Analyst, the temperature difference information over a 2x2 km grid were interpolated to estimate a map of expected differences (i.e., for daytime temperatures in late spring-early summer months) between natural and artificial turf over the entire Los Angeles metropolitan area.
High-resolution city-scale imagery In Riverside, four areas of interest (AOIs), namely Orange Crest (OC), Moreno Valley (MV), Victoria/Eastside/ University (VEU), and Downtown/Jurupa (DJ) were selected for the aerial thermal imagery acquisition. Within these areas all the homes having artificial grass in the front and/ or backyard were identified: 52 in OC, 2 in MV, 11 in VEU, and 5 in DJ. Using Google Maps and StreetView imagery, nearby homes having natural turf and xeriscape in the front yard, in equal numbers as for the artificial grass homes were selected, as well as sport fields having both natural turf and artificial grass: 1 in OC, 1 in MV, 4 in VEU, and 2 in DJ. On July 25, 2018, August 31, 2018, and Aug 8, 2019, thermal ortho-imagery was acquired over the AOIs using a FLIR T1020 camera by Access Geographic, LLC. The camera was mounted on a plane and acquired imagery with resolution of ca. 0.3x0.3 m. Flight paths are shown in Figure 2. Ground measurements were carried out at the UC Riverside campus with the FLIR T1020 camera to calibrate/evaluate the aerial measurements. Moreover, correlation within land surface temperature (LST) of natural grass and artificial grass fields (and paired differences) and environmental and socioeconomic factors, including educational attainment, poverty, unemployment, Housing Burdened Low Income Households (HBLIH); Median Household Income (MHI), and single home price for each zip code in Riverside where images were obtained were calculated.
Results
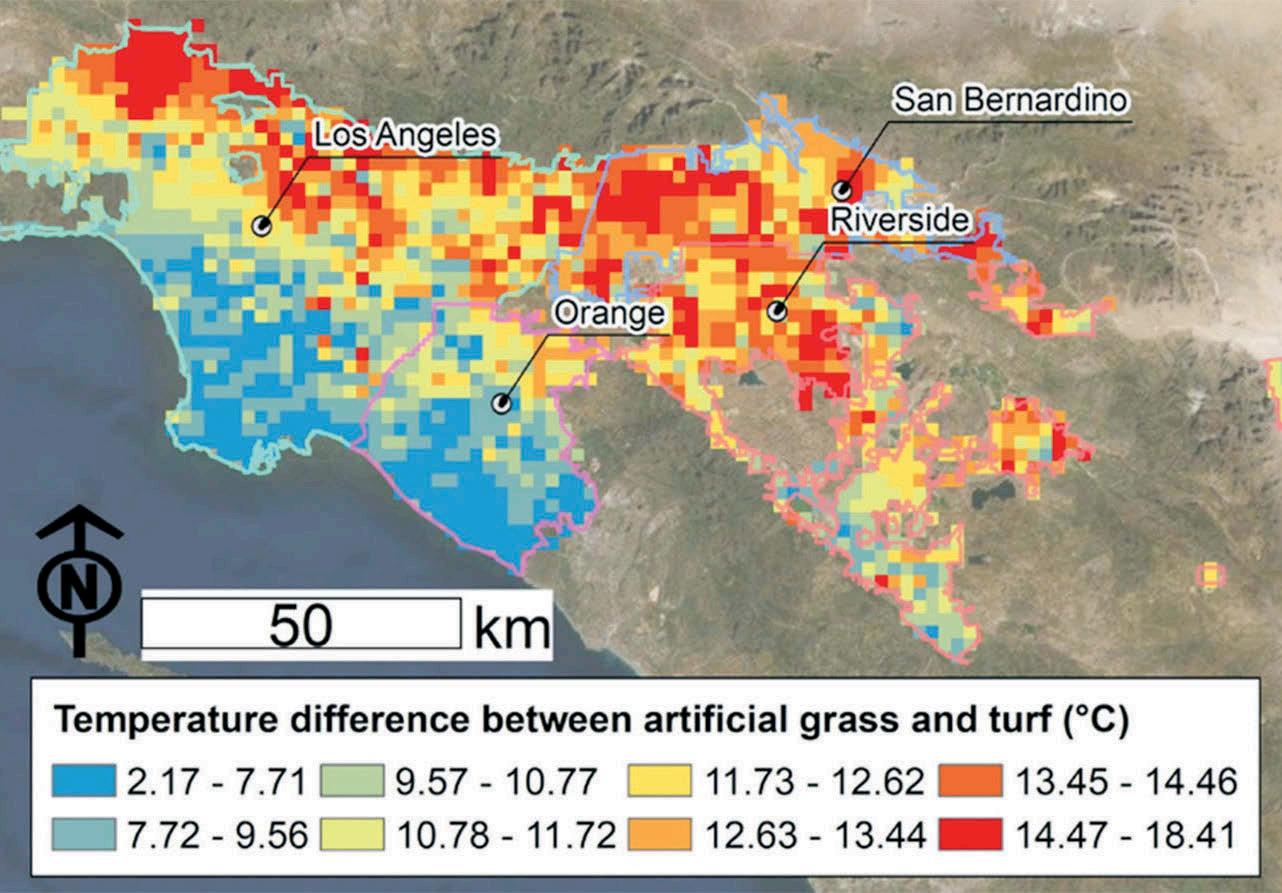
Regional-scale thermal imagery The maps created for the regional scale reveal that artificial turf is always expected to be warmer than natural turf in the region. Temperature difference between artificial turf can be as high as 20 °Celsius (68 °Fahrenheit), in Inland Empire and in San Fernando Valley where climate mitigation from the Ocean is not present. However, for Los Angeles and Orange Counties, temperature differences are milder by the oceanside than in inland areas and could be as low as 2 °C (35.6 °F) in the coastal area of Orange County.
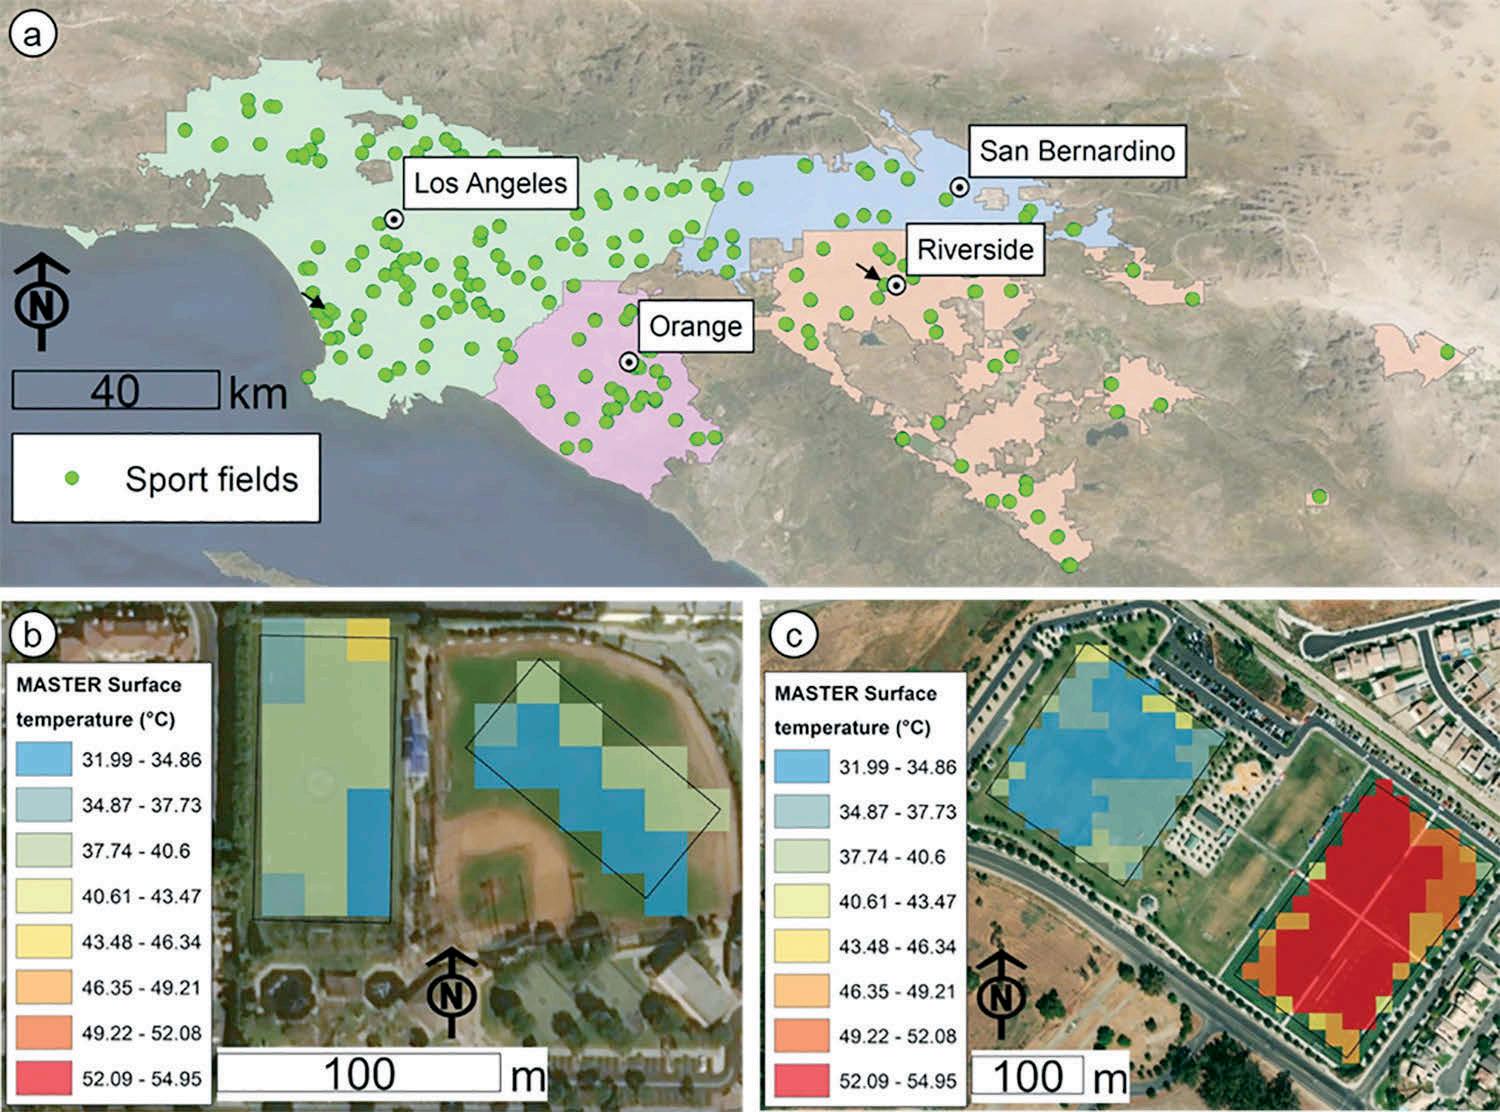
Figure 1. (a) The selected region of interest in southern California, including portions of the Los Angeles, Orange, Riverside, and Orange Counties. The location of the main cities within the four counties are shown and labeled. The 200 selected sites where turf and artificial grass surface temperature were measured are depicted with lime-green dots. Examples of selected comparison locations are shown in (b) Rancho Jurupa Regional Sports Park, Jurupa Valley, Riverside County, and (c) Marine Ave Park, Manhattan Beach, Los Angeles County. Quadrants (b) and (c) show the MODIS/ASTER Airborne Simulator (MASTER) surface temperature measured on May 22, 2013.
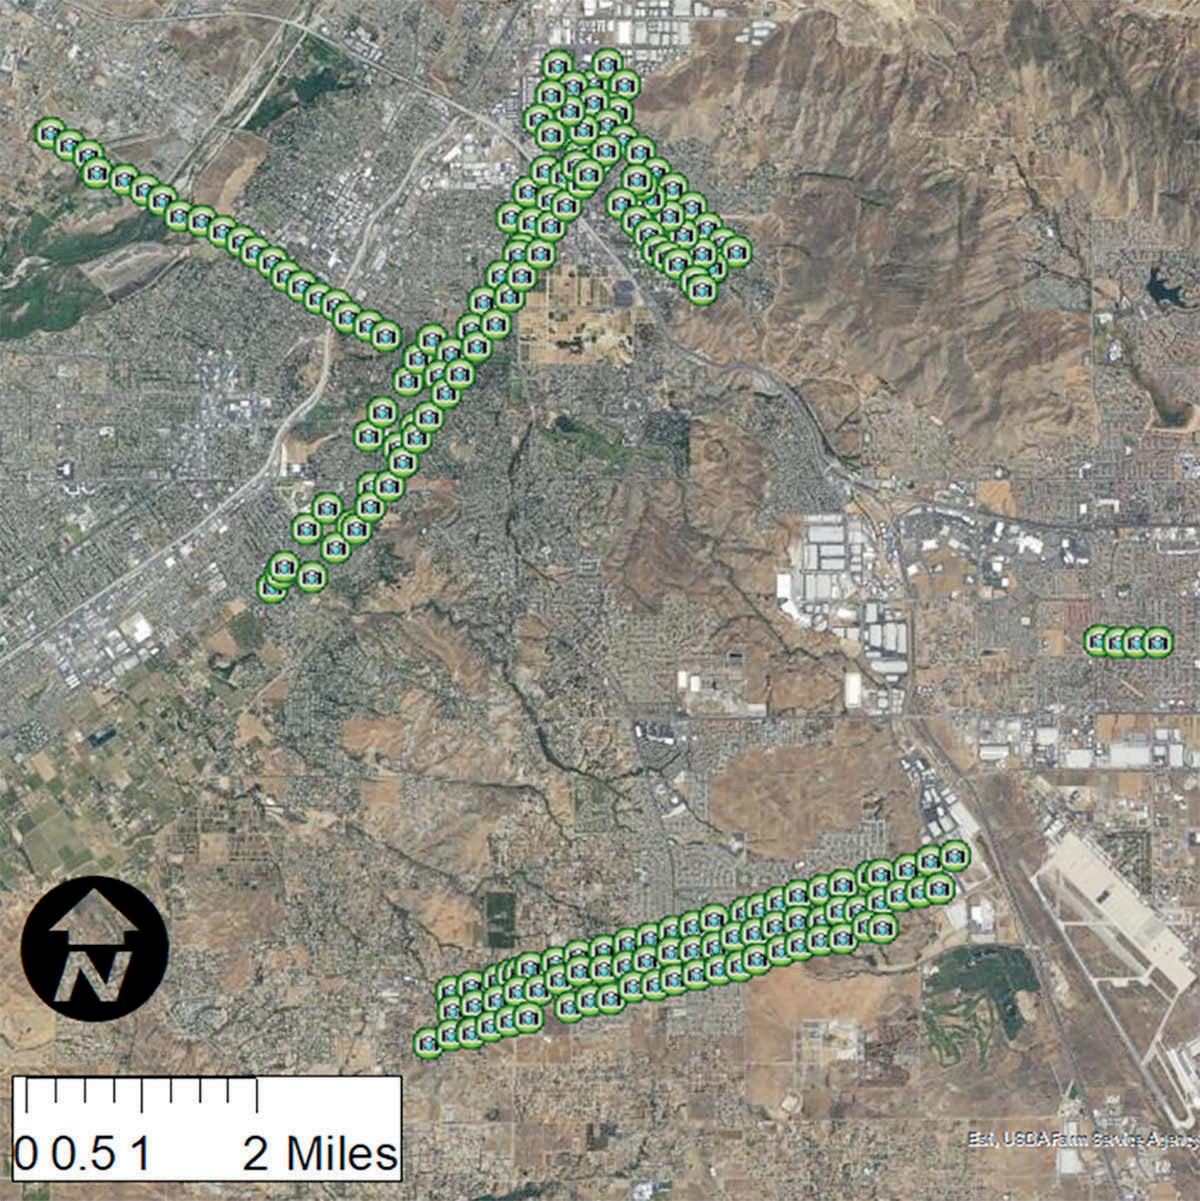
Figure 2. Flight paths for the high-resolution thermal imagery acquisition in the Riverside, CA area.
Figure 4 Charts. Surface temperature of artificial turfgrass, natural turfgrass, and xeriscape in Riverside on July 25, 2018 (air T=38.9 °C) (102.02 °F), August 31, 2018 (air T=32.2 °C) (89.86 °F), and August 31, 2019 (air T=33.9 °C) (93.02 °F). Figure 3. Maps of expected a) daytime temperature differences in late spring/early summer between natural grass and artificial turf sports fields and b) daytime temperature at artificial turf sport fields.
High-resolution city-scale imagery When comparing natural turfgrass to artificial turf and xeriscape, temperatures detected on the three flights were always significantly lower in turfgrass lawns compared to artificial and xeriscape. Turfgrass never exceeded 38.8 °C (101.8 °F), while xeriscape was at least 24 °C (75.2 °F) warmer. Even though no statistical differences were detected between xeriscape and artificial turf sites, artificial turf sites were always the warmest landscape, reaching 78.5 °C (173.3 °F) in August 2019. (Fig. 4).
No correlation could be found between socioeconomic factors and surface temperature (Table 2 featured on next page). However, overall surface temperatures were lower in the higher-income neighborhood than in the lower income one, despite landscape type, suggesting that lawns in high-income areas may be watered even when turfgrass is replaced. Further data analysis is needed to accurately characterize the temperature differences between different landscape types over the selected Riverside Area neighborhoods. Because of special reflectance of roof materials, home temperature differences could not be determined (Figure 5).
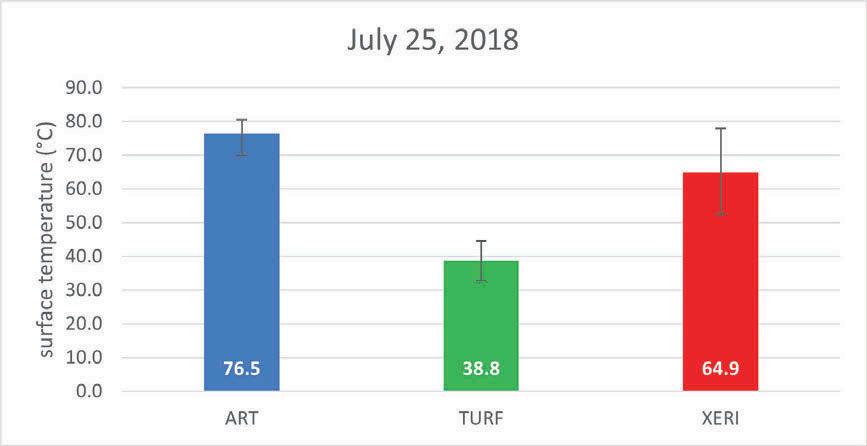
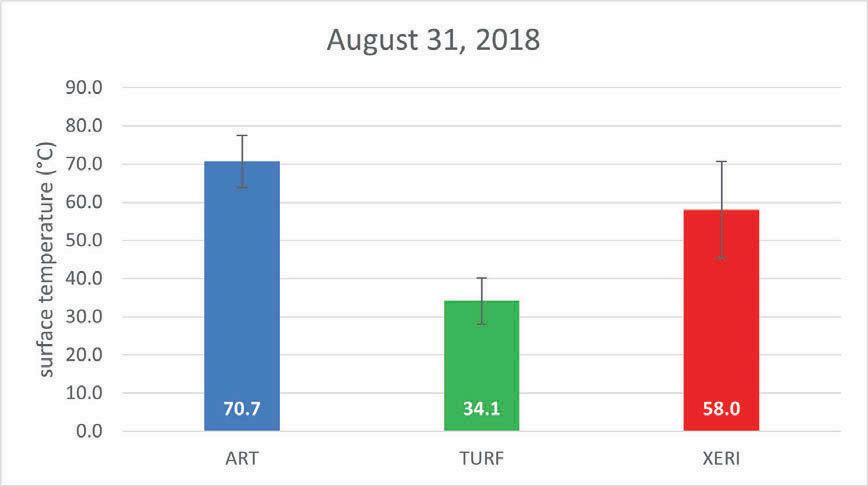
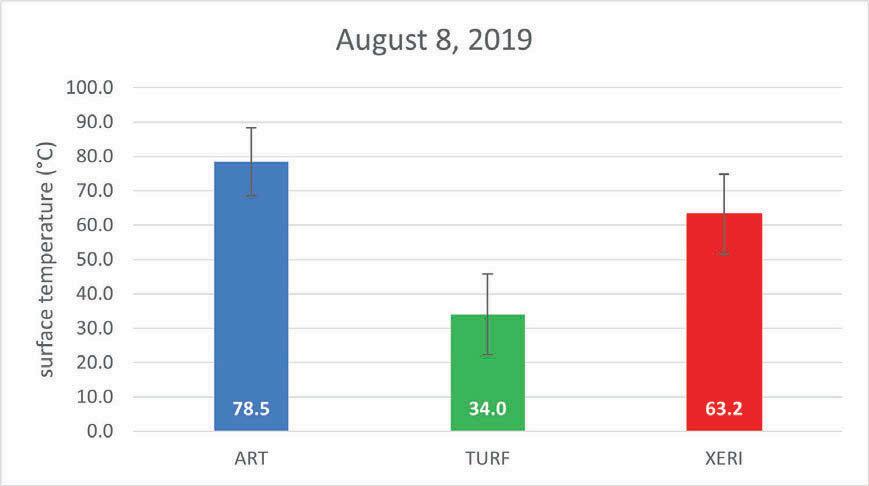

Figure 5. Example of aerial thermal raw imagery acquired on August 8, 2019, over the "University Neighborhood" in Riverside 92507. The locations of selected houses with front-lawns having xeriscape, turfgrass, and artificial turf are highlighted.
LST Turf Fields LST Artificial Fields LST Artificial TurfSOCIOECONOMIC FACTORS
Educational attainment
Poverty Unemployment HBLIH
MHI
Single Home Price
0.02 0.00 -0.01
-0.02 -0.06 -0.04
-0.08 0.03 0.07
-0.02 -0.03 -0.01
-0.11 0.06 0.12
-0.08 -0.08 -0.04
HBLIH (Housing Burdened Low Income Households); (MHI) Median Household Income.
(2020, $7,437) FINAL REPORT
Sod is an important specialty crop in the northern U.S., representing over $549 million in combined sales from the Northeast, Midwest, Plains, and Northwest regions of the U.S. in 2014 (USDA NASS, 2016), and this value is expected to increase. Demand for sod is also increasing due to new construction and changes in building and residential codes that require lawns established from sod. For example, new residential construction, which is the primary source of sod demand, is projected to increase by 17.2 percent in Indiana (McCoy, 2015). There is a clear desire for lower-input sod species from consumers in this region (Hugie et al., 2012; Yue et al., 2012). In addition, increasing concerns over the environmental impacts of soil erosion from industrial and infrastructure development are also expected to be rapidly increasing sources of demand for sod. However, despite the fact that many different turfgrass species exist, most sites today in the northern U.S. are planted as sod with Kentucky bluegrass (Poa pratensis), regardless of site management, and this is an issue directly related to information inefficiencies that affect the supply and demand of low-input species, such as fine fescues (Festuca spp.)
Kentucky bluegrass is grown on sod farms because growers are familiar with its production and consumers lack awareness of improved, low-input species. For example, in 2012 the Agricultural Census determined that 68 sod farms in Minnesota were producing 7,245 acres of turfgrass sod (USDA-NASS, 2012). Of this, 7,163 acres were grown as Kentucky bluegrass, and only 80 acres of fine fescue sod were available thanks to a Minnesota salt-tolerant sod certification program (http://www.mncia.org/sodquality-assurance), advocated for by the MN Department of Transportation. Recent genetic improvements in low-input turfgrass species now provide sod farms other options when selecting what to plant. Since the selection of turfgrasses by sod farms ultimately impacts what is planted in the landscape, decisions made by sod farmers and landscape contractors can have a tremendous impact on the environment and efforts to manage turf sustainably.
Preliminary 2019 data from collaborative research at Purdue University and the University of Minnesota investigating low-input sod production funded by USDAAMS is showing some promising results with fine fescue sod production, especially with strong creeping red fescue. The aim of this project is to continue to learn more about ways to optimize fine fescue sod production through research and education. The goal of sod producers is to generate maximum production in the shortest time period with the minimum input of resources. Decisions on sod variety selection, establishment timing, seeding rate, reestablishment following harvest, irrigation, fertilization, mowing, and pest management will all affect how soon a crop can be harvested. However, there is a lack of information on fertility practices for sod growers interested in fine fescues. More specifically, how should nitrogen fertility programs be designed to enhance fine fescue establishment and minimize production time and costs to create a high-quality sod? Our objectives are to determine optimal nitrogen fertilization programs for high quality fine fescue (Festuca spp.) sod production and also if a “bee lawn” turf mixture (fine fescue and white clover) can yield similar high-quality sod.
This field experiment was planted on 5 September 2019 and plots were harvested at 9, 11, and 12 months after planting (MAP) on 2 June, 5 August, and 16 September
in 2020, respectively, at the William H. Daniel Turfgrass Research and Diagnostic Center in West Lafayette, Indiana. The soil at the site was a silty clay loam. Four different fine fescue taxon were investigated: (i) ‘Cardinal II’ strong creeping red fescue (Festuca rubra. ssp. rubra); (ii) ‘Seamist’ slender creeping red fescue (Festuca rubra ssp. littoralis); (iii) ‘Radar’ Chewings fescue (F. rubra ssp. commutata; syn. F. rubra ssp. fallax); and (iv) ‘Beacon’ hard fescue (Festuca brevipila). Six nitrogen fertilization programs from 0 to 2.5 lb N/1000 ft2 during the first two months of establishment and two “bee lawn” turf mixtures were investigated within each fine fescue taxon (See Table 1 below). The two “bee lawn” (i.e., cover crop) program treatment levels consisted of (i) an annual clover, ‘Frosty’ Berseem clover (Trifolium alexandrinum), and (ii) a perennial clover, ‘Aberlasting’ white clover (Trifolium repens L.) × Kura clover (also known as caucasian clover) (Trifolium ambiguum) hybrid. All clover seed was inoculated and then mixed with fine fescue seed immediately prior to seeding. A starter fertilizer of triple superphosphate (0-46-0) was applied at a rate of 0.44 lb P/1000 ft2 at seeding across the entire study, and then the experiment area received frequent irrigation (i.e., daily or four to five times per week) for two weeks to promote establishment and then an average of 1.0-inch wk-1 during the growing season from either irrigation or precipitation for the remainder of the experiment. No additional fertilizer, except for fertility program treatments, were applied during the experiment and no pesticides (herbicides, fungicides, or insecticides) were applied to the study areas during the experiment.
Table 1. Nitrogen fertilization program treatment levels in this experiment.
Nontreated (0 lb N/1000 ft2) --
0.5 lb N/1000 ft2
1.0 lb N/1000 ft2
1.5 lb N/1000 ft2
2.0 lb N/1000 ft2
2.5 lb N/1000 ft2 0.5 lb N/1000 ft2 at seedinga
1.0 lb N/1000 ft2 at seedinga
0.5 lb N/1000 ft2 at seedinga + 1.0 lb N/1000 ft2 at 1 month after planting (MAP)b
1.0 lb N/1000 ft2 at seedinga + 1.0 lb N/1000 ft2 at 1 MAPb
1.0 lb N/1000 ft2 at seedinga + 1.0 lb N/1000 ft2 at 1 MAPb + 0.5 lb N/1000 ft2 at 2 MAPb
Annual clover cover crop ‘Frosty’ Berseem clover seeded at a rate of 0.23 lb/1000 ft2 at fine fescue seeding Perennial clover companion cover crop ‘Aberlasting’ White × Kura clover seeded at a rate of 0.23 lb/1000 ft2 at fine fescue seeding
aQuick-release nitrogen fertilizer (Urea; 46-0-0) was utilized for all nitrogen fertilizer treatments at seeding. bSlow-release nitrogen fertilizer (XRT N-3 Polymer-Encapsulated Urea; 44-0-0; SGN:150; KMB Technologies, LLC) was utilized for all nitrogen fertilization treatments applied at one and two months after planting (MAP).
At each sod harvest, sod was cut and tested with a sod tensile strength device (Figure 1), which provides output to measure the required work (force over distance, Newton-meters) and peak force required to tear a piece of sod (i.e., maximum tensile load, Newtons) (Friell et al., 2016). Sod handing, turf quality, and soil moisture levels were also measured at time of sod harvest (Gopinath et al., 2015).

Figure 1. Sod tensile strength device (A) and sod cut and removed from plots (B) to be tested on the sod tensile strength device (A) constructed to determine the required work (force over distance) and peak force required to tear a piece of sod in Indiana on June 2, 2020. Strong creeping red fescue (C) and slender creeping red fescue (D) held together very well and had the highest sod strength values.

Sod handling data is presented for 9, 11, and 12 MAP sod harvest timings, while only the 9 and 12 MAP sod harvest timing data is presented for the sod tensile strength device output (i.e., required work to tear sod, max tensile strength) due to data loss from the sod tensile strength device at 11 MAP (Figure 2 and 3). Preliminary results from the first sod harvest at both 9 and 12 MAP demonstrate that turfgrass species (strong creeping red fescue, slender creeping red fescue, Chewings fescue, and hard fescue) is having the largest impact on sod strength (Figure 2). More specifically, strong creeping red fescue produced the highest sod strength (i.e., required work to tear sod, max tensile strength) compared to slender creeping red fescue, Chewings fescue, and hard fescue. Output from the sod tensile strength device also indicated that fertilization program levels, including clover treatments, is having no impact on sod strength at 9 and 12 MAP (Figure 3).

Figure 2. Required work to tear sod (Newton-meter) of the turf species main effect at 9 and 12 months (Mo) after planting sod harvest timings in Indiana (a) and maximum tensile load (Newton) of required work to tear sod of the turf species main effect at 9 and 12 months (Mo) after planting sod harvest timings in Indiana. Means within a sod harvest timing with the same letter are not significantly different according to Fisher’s LSD (a < .05).

Figure 3. Required work to tear sod (Newton-meter) of fertilization program levels of six nitrogen fertilization programs from 0 to 2.5 lb N/1000 ft2 during the first two months of establishment and two “bee lawn” turf mixtures (clover treatments) at 9 and 12 months (Mo) after planting sod harvest timings in Indiana. Means within a sod harvest timing with the same letter are not significantly different according to Fisher’s LSD (a < .05).
A similar trend was evident with sod handling ratings, which is rated on a 1 to 5 scale [1= poor, complete breakage of sod during handling, inability to transport to sod tearing device (unacceptable quality); 3 = good, our suggested minimum acceptable quality for industry handling, moderate cracking of the sod may occur; and 5 = excellent, very tight, no cracking (best handling quality)] (Figure 4). The rhizomatous growth habit of strong creeping red fescue is producing the highest sod handling at all three harvest timings and at times, the highest is the other rhizomatous turfgrass, slender creeping red fescue. Meanwhile, the bunch-type growth habit of both Chewings fescue and hard fescue is producing in poor sod handling (Figure 4) and lower sod strength (Figure 2). This research is being repeated from fall 2020 to summer 2021. Overall, preliminary results indicate there are differences in sod strength and handling among the fine fescue taxon, with the highest to lowest sod strength and sod handling in the following order: strong creeping red fescue, slender creeping red fescue, Chewings fescue, and hard fescue. In addition, preliminary results also indicate that sod growers may be able to fertilize with less nitrogen, but still yield fine fescue sod with good sod strength, and a high-quality “bee lawn” mixture (fine fescue and white clover) sod is possible.
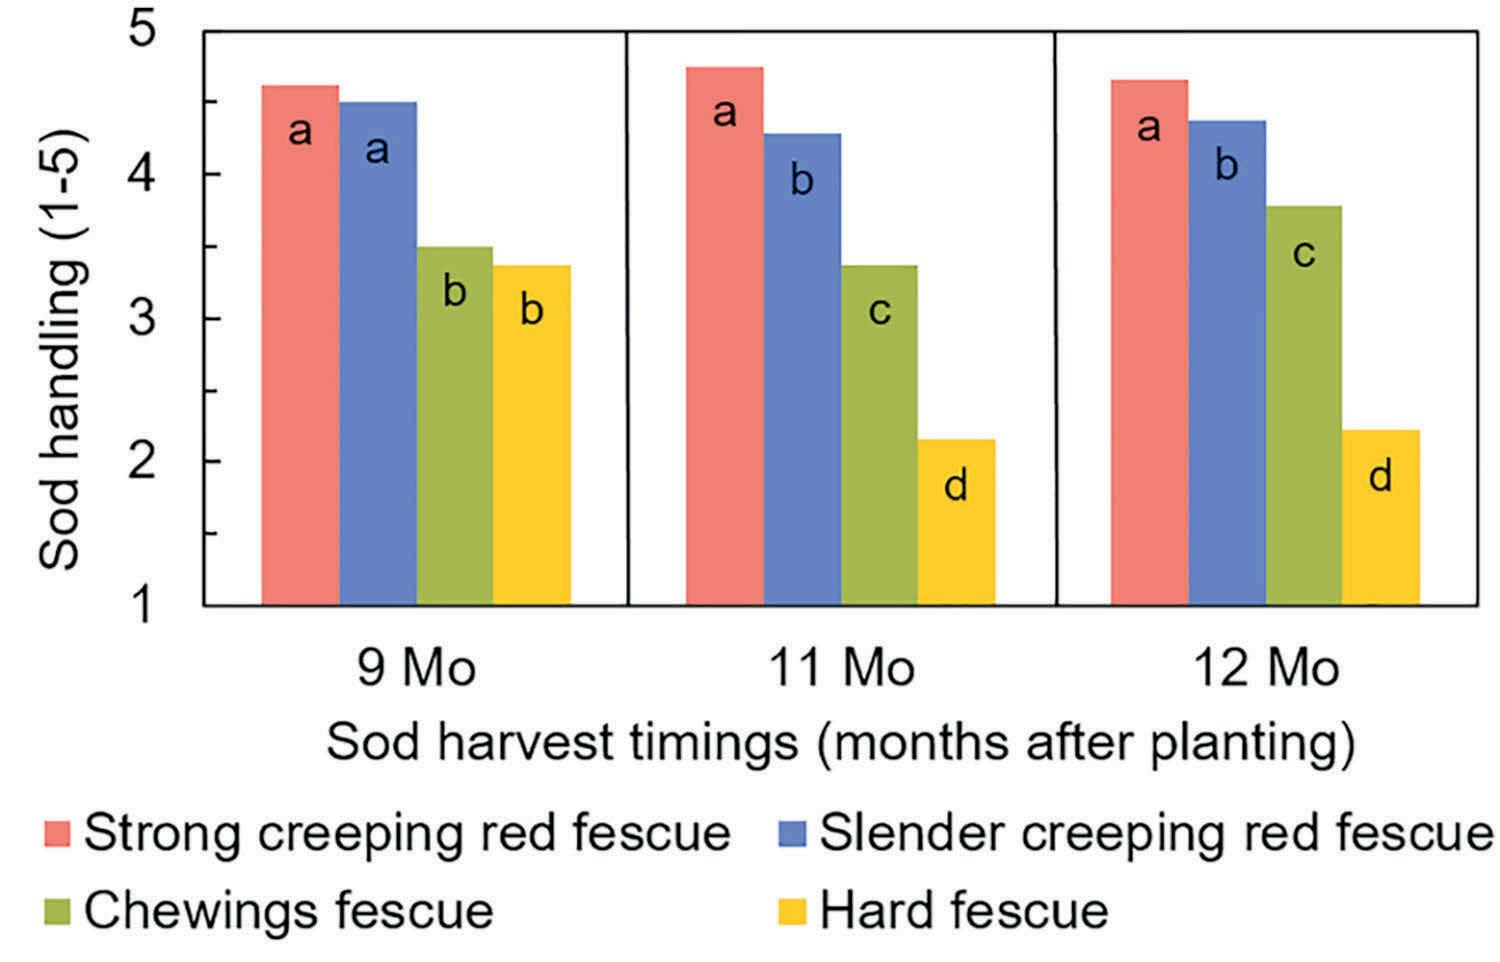
Figure 4. Sod handling (1 to 5 scale, 5=best, no breakage, strongest sod) of the turf species main effect at 9, 11, and 12 months (Mo) after planting sod harvest timings in Indiana. Means within a sod harvest timing with the same letter are not significantly different according to Fisher’s LSD (a < .05).
Using Ethylene Inhibitors and Polyamine to Extend Turf-Type Tall
Fescue Sod Shelf Life (2020, $10,000) FINAL REPORT
One of the major concerns sod growers have is sod quality decline after harvest and during transportation (Zhang et al., 2003). Heat accumulation due to respiration and ethylene production during sod storage causes sod injury and accelerates leaf senescence. Various approaches have been used to reduce heat injury and improve shelf life of turfgrass sod and other plants (Zhang et al., 2017; Zhang et al., 2003). The pioneering studies on sod heating were done by Michigan State University (King, Beard, and Rieke, 1982) where they concluded that high temperatures during shipping were more injurious than any other factor, but tall mowing heights, surface clippings, high tissue Nitrogen (N) levels, and high soil temperatures also contributed to sod decline. These factors promote excessive production of the plant regulatory hormone, ethylene, that accelerates chlorophyll loss and tissue decomposition. Facing similar post-harvest decline concerns, the floriculture industry extends the life of cut flowers and potted plants by postharvest treatment with the ethylene inhibitor 1-methycyclo-propene (1-MCP; trade name EthylBloc sachet, which contained 0.014% 1-MCP). Previous studies at Virginia Tech showed that EthyBloc reduced ethylene levels and sod pallet temperature but did not reduce injury in tall fescue sod (unpublished data). Aminoethoxyvinylglycine (AVG) can inhibit the biosynthesis of ethylene (Even-Chen, et al., 1982; Zhang et al., 2017). AVG has been reported to inhibit ethylene production in citrus bud culture and leaf explants (Goren et al., 1979; Saltveit, 2005). Polyamines delay senescence and inhibit ethylene biosynthesis in several plants (Suttle, 1980). To our knowledge, no study has been conducted to investigate the effects of 1-MCP, AVG, and polyamines, alone or in combinations, on ethylene production, heat injury, and shelf life of cool-season turfgrass sod. The objective of this study was to investigate the effects of 1-MCP, AVG, and polyamines, alone or in combinations, on ethylene production, heat injury, and shelf life of a mixed tall fescue/Kentucky bluegrass sod.
Research Procedures
A mature tall fescue sod established, maintained, and deemed suitable for commercial harvest at the Virginia Tech Turfgrass Research Center in Blacksburg was utilized for this project. Aminoethoxyvinylglycine (AVG, 25 μM, equivalent to 0.023 oz/acre) and polyamine (spermidine, SPE, 0.25 mM, equivalent to 0.21 oz/acre) and AVG+SPE were applied to the turfgrass canopy using a CO2 pressurized sprayer at approximately 1 gal per 1000 ft2 carrier volume on June 30, 2020.
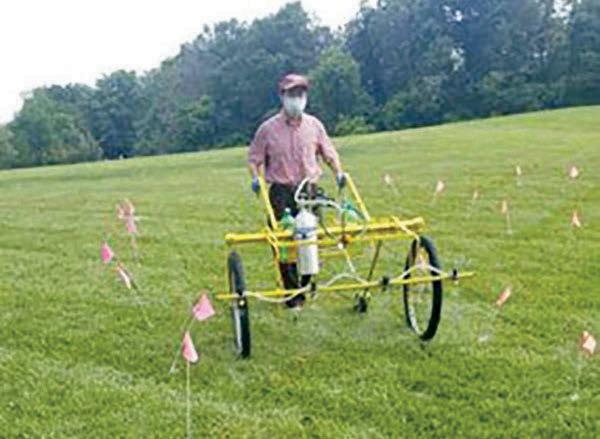
Treatment application on June 30, 2020. There were eight treatments (control, AVG, SPE, EthylBloc alone or in all possible combinations. (See Table 1 at the end of the Ethylene Inhibitors Research Report.) Foliar application of AVG or SPE alone or in combination were applied to the turf with harvests occurring on July 2 (48 hours after their treatment).
Immediately prior to harvest, all individual and combination treatments containing EthylBloc were initiated by placing 2 bags (wetted) of EthylBloc sachet (which provided 1-MCP at 0.18 oz/acre) in each piece of sod with the size of 1 ft wide and 6 ft long.
A randomized complete block design with four replications was used. The treated sod was transported to a rainout shelter. Temperature sensors and tubing for ethylene sampling were placed in the center of each 6 square foot roll at harvest and rolls were placed individually on a pallet under the rainout shelter in order to prevent unintended moisture effects on the trial.
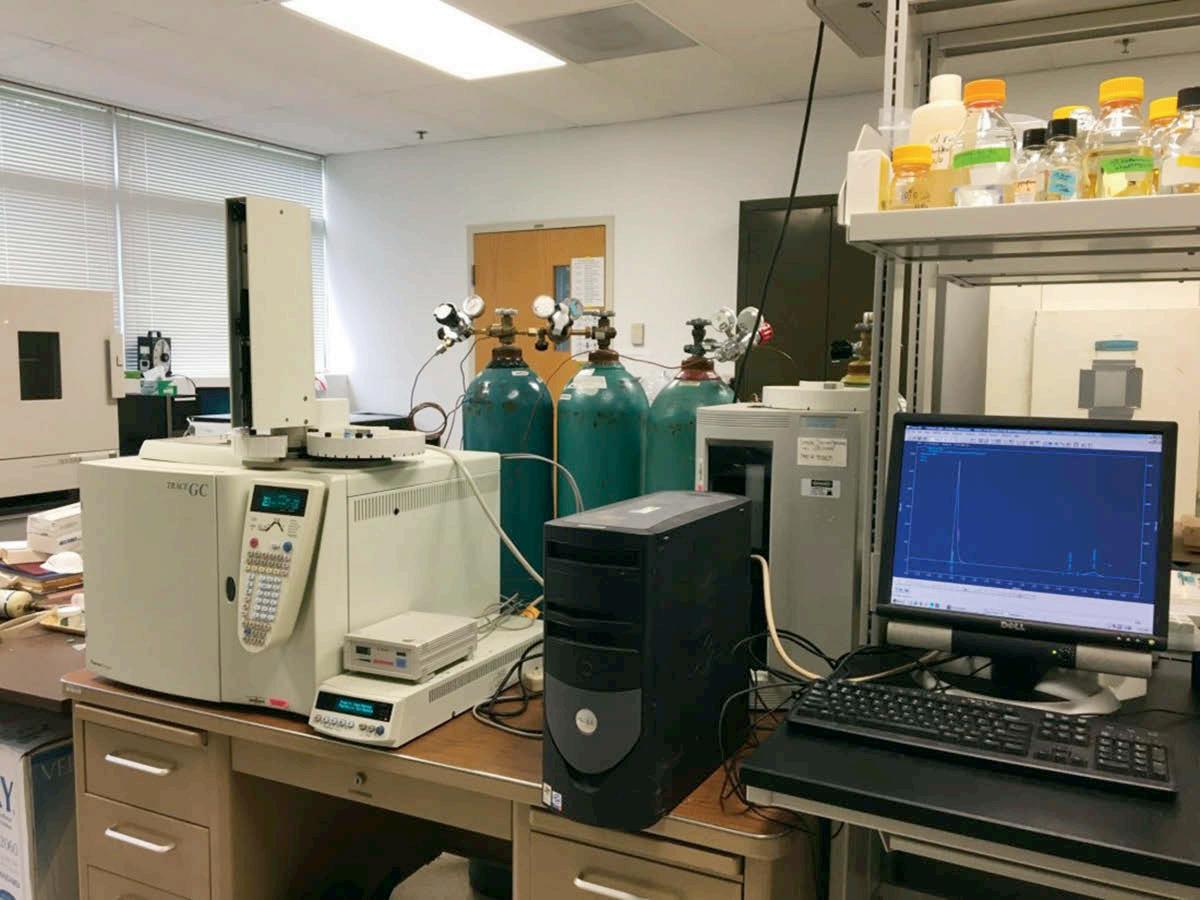
Rolls served as individual experimental units and remained under the shelter for 72 hours from July 2 through July 5, with ethylene gas levels within the roll determined at 0, 24, 48, and 72 hours after harvest by gas chromatography.
Then two pieces of sod (1 ft2 each) were cut from each roll and transplanted to the field on 1 ft2 of expanded metal frames on July 6 for future determination of sod rooting strength at 6 weeks after transplant. The 1 sq ft of center cut sod that was transplanted onto the expanded metal frames in a prepared soil was used in order to determine rooting strength on August 10 (6 weeks after transplant). The sod was irrigated daily during establishment. Turf quality/recovery and photochemical efficiency were measured on July 8, July 20, Sod pieces cut from each roll August 5, and August 10. The were transplanted into the transplanted sod lost color in the field on July 6. first week and gradually recovered and resumed growth beginning in the second week after transplanting. Root strength was determined by measuring the force (kg) required to lift the frames the week of August 10. The data were analyzed by using an analysis of variance. The mean separations were performed using Duncan’s least significance difference at 5 percent probability level.
Results and Discussion
Ethylene inhibitors effect on sod roll temperature and ethylene concentration From July 2 (1 hour) through July 5 (72 hours), we recorded the temperature hourly. Table 1 lists the average temperature for each day. The temperature ranged from 77.5 °F to 84.2 °F (25.28 °C to 29.0 °C). We did not find consistent effects of the ethylene inhibitor treatments on internal sod roll temperature in this study. We found the ethylene inhibitor treatments reduced ethylene production in the sod roll during the 72-hour period from July 2 through July 5. (See Table 1 at the end of the Ethylene Inhibitor Research Report). At the end of sod storage (July 5), all ethylene inhibitor treatments except for SPE reduced ethylene concentration. Application of AVG, EthylBloc, AVG+SPE, AVG+EthylBloc, SPE+EthylBloc, and AVG+SPE+EthylBloc reduced ethylene concentration by 21.1 percent, 32.4 percent, 21.1 percent, 29.6 percent, 32.4 percent, and 36.6 percent, respectively, relative to the control.
Ethylene inhibitors effects on turf quality and photochemical efficiency The transplanted sod experienced so called “post-transplant shock” and severe injury in the first week after transplanting and gradually recovered in the following weeks. We found all inhibitor treatments except for AVG, and AVG+SPE+EthylBloc increased turf quality during the recovery phase when compared to the control as measured on July 20 (two weeks after transplanting). (See Table 2 at the end of the Ethylene Inhibitor Research Report). On August 5, all ethylene inhibitor treatments had higher turf quality ratings than the control. On August 10, EthylBloc, AVG+EthylBloc, and SPE+EthylBloc treatments increased turf quality rating by 18.9 percent, 17.0 percent, and 18.9 percent, respectively, when compared to the control. The ethylene inhibitor treatments consistently improved PE as measured on July 20, August 5, and August 10 except for AVG on August 5 (Table 2). The application of AVG, SPE, EthylBloc, AVG+SPE, AVG+EthylBloc, SPE+EthylBloc, and AVG+SPE+EthylBloc increased PE by 8.2 percent, 12.6 percent, 14.3 percent, 10.7 percent, 12.6 percent, 16.7 percent, and 14.9 percent, respectively, when compared to the control as measured on August 10.
Ethylene inhibitors effect on root strength Application of AVG, EthylBloc, and AVG+SPE increased root strength of transplanted sod as measured on August 10 at 5 percent probability level (See Figure 1)
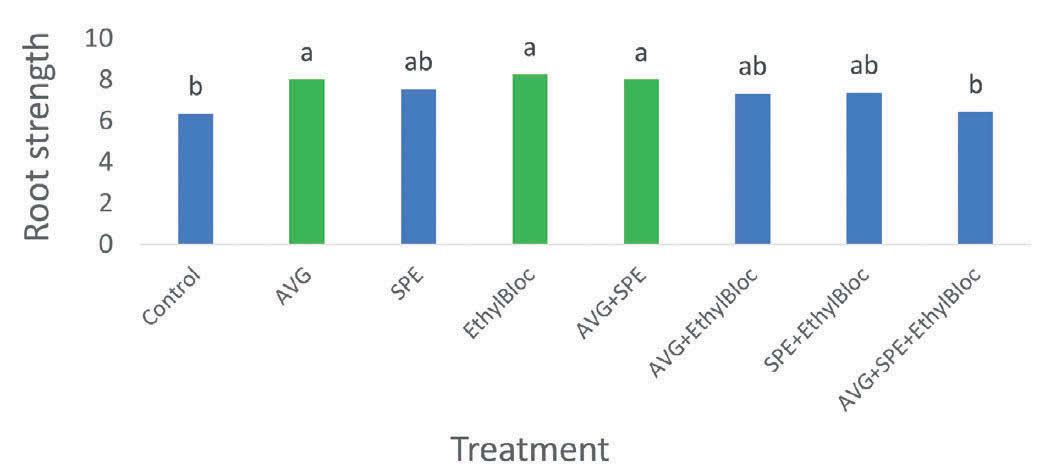
Figure 1. Root strength of transplanted sod as affected by ethylene inhibitors (August 10). Bars marked with same letters are not significantly different at P = 0.05.
Correlations of various parameters We found that visual turf quality was closely correlated with our non-subjective measurements of photochemical efficiency (PE), (P = 0.05). However, no significant correlation of root strength was found with turf quality, PE, and ethylene concentration. In summary, application of the ethylene inhibitors showed promise in reducing ethylene production in the sod roll, and promoted post-transplant recovery of sod, and root strength in tall fescue. Among the treatments, EthylBloc, AVG+EthylBloc, and SPE+EthylBloc had greater positive impact on reduction of ethylene production in the sod roll and recovery of turf quality and PE after transplanting. AVG, AVG+SPE, and EthylBloc had better effects on root strength of transplanted sod. EthylBloc alone or with AVG or SPE can be used to extend shelf life for tall fescue sod.
Acknowledgements
We would like to thank The Lawn Institute and the Virginia Agricultural Council for the support of this project. We also would like to thank Oasis Grower Solutions for providing the EthylBloc sachet for this study.
Table 2. Responses of turf quality and photochemical efficiency (PE) of post-transplanted sod of tall fescue treated with Aminoethoxyvinylglycine (AVG), spermidine (SPE), and EthylBloc alone or in combinations.
Treatment Rate 2-Jul 3-Jul 4-Jul 5-Jul
(oz/acre) Temperature (oF)
Control 0 82.0b 78.2ab 80.7ab 80.2ab AVG 0.023 82.2b 78.3ab 81.2ab 80.9ab SPE 0.21 84.7a 79.9a 83.4a 82.4a EthylBloc 0.18 81.3b 78.7ab 80.9ab 80.8ab AVG+SPE 0.023+0.21 81.4b 77.5b 80.2b 78.9b AVG+EthylBloc 0.023+0.18 82.7ab 78.9ab 81.6ab 81.2ab SPE+EthylBloc 0.21+0.18 82.5ab 78.7ab 82.0ab 81.3ab AVG+SPE+EthylBloc 0.023+0.21+0.18 81.9b 78.4ab 80.6b 79.2b Ethylene concentration (ppm) Control 0 9.6a 8.4a 6.8a 7.1a AVG 0.023 8.7ab 6.9abc 5.6ab 5.6bc SPE 0.21 7.0bc 7.7ab 4.6b 5.8ab EthylBloc 0.18 6.6bc 5.0bc 4.8b 4.8c AVG+SPE 0.023+0.21 4.6d 6.3abc 5.6ab 5.6bc AVG+EthylBloc 0.023+0.18 5.1cd 4.2c 4.2b 5.0bc SPE+EthylBloc 0.21+0.18 7.2bc 4.7c 4.5b 4.8bc AVG+SPE+EthylBloc 0.023+0.21+0.18 4.5d 4.5c 5.4ab 4.5c Means followed by same letters within same column for each data set are not significantly different at P = 0.05.
Treatment Rate 8-Jul 20-Jul 5-Aug 10-Aug
(oz/acre) Turf quality (1-9, 9 = best)
Control 0 1.5a 3.3b 4.4b 5.3b AVG 0.023 1.5a 3.8ab 5.7a 6.1ab SPE 0.21 1.5a 3.9a 5.5a 5.9ab EthylBloc 0.18 1.5a 3.9a 5.8a 6.3a AVG+SPE 0.023+0.21 1.5a 4.0a 5.8a 6.1ab AVG+EthylBloc 0.023+0.18 1.5a 4.1a 5.7a 6.2a SPE+EthylBloc 0.21+0.18 1.5a 3.9a 5.8a 6.2a AVG+SPE+EthylBloc 0.023+0.21+0.18 1.6a 3.6ab 5.5a 5.6ab PE (Fv/Fm) Control 0 0.0a 0.429b 0.621b 0.645c AVG 0.023 0.0a 0.498a 0.661ab 0.698b SPE 0.21 0.1a 0.518a 0.675a 0.726ab EthylBloc 0.18 0.0a 0.502a 0.681a 0.737ab AVG+SPE 0.023+0.21 0.0a 0.511a 0.672a 0.714ab AVG+EthylBloc 0.023+0.18 0.0a 0.498a 0.671a 0.726ab SPE+EthylBloc 0.21+0.18 0.0a 0.489a 0.675a 0.753a AVG+SPE+EthylBloc 0.023+0.21+0.18 0.1a 0.532a 0.694a 0.741a Means followed by same letters within same column for each data set are not significantly different at P = 0.05.
Determining the Impact of PostPlanting Cultural Practices on Sodded Lawn Water Needs in the Cool-Season
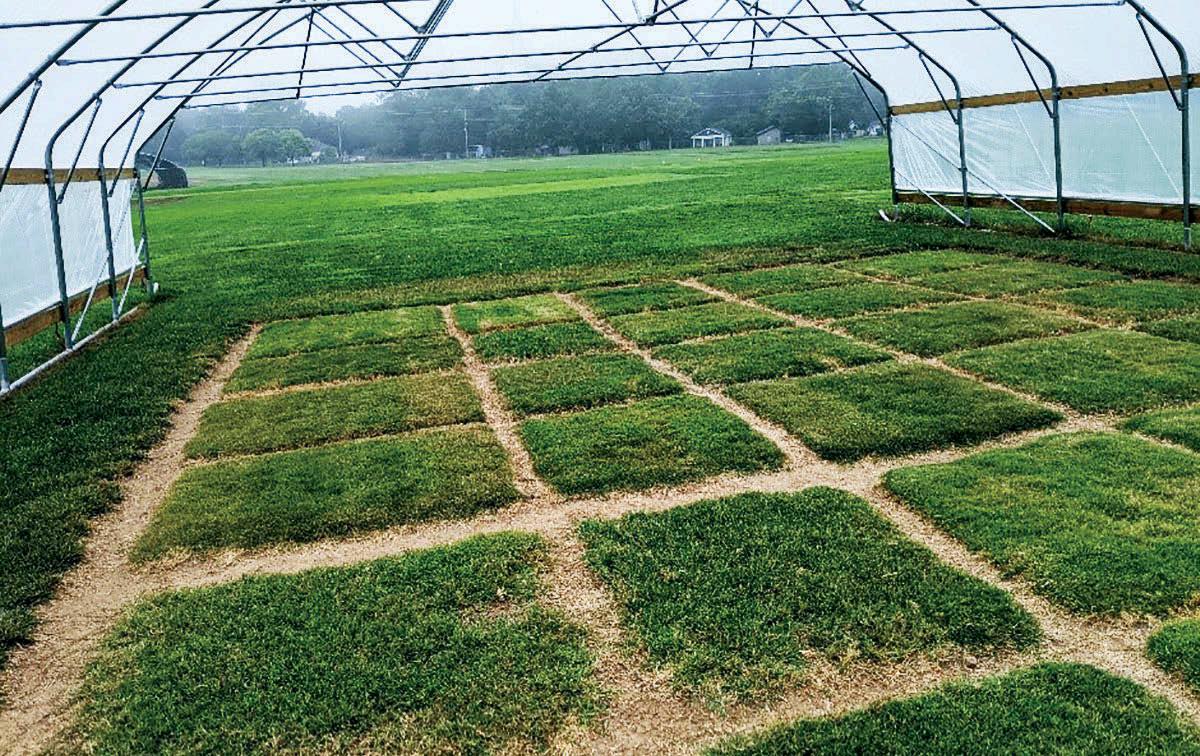
Humid Region (2020-21, $20,000) The overall goal of this project is to document the effects of various post-planting cultural management practices that could help to reduce supplemental water needs of sodded Kentucky bluegrass lawns. A locally sourced (Purdy Sod, Lafayette, IN) Kentucky bluegrass sod blend was planted in a fixed roof rain-out shelter in the fall of 2019 on a siltloam soil at the William H. Daniel Turfgrass Research Center in West Lafayette, IN. The study area was divided in the fall of 2019 to assess the effects of various post-planting cultural inputs for their effect on managing the sod layer. A factorial arrangement of four cultural practices were used and included: spring/ fall core aeration (3/4-inch tines), spring/fall compost, a liquid soil surfactant, and overseeding with turf-type tall fescue (10 lb/1000 ft2). Soil cultivation was stripped across each replication while compost, soil surfactant, and overseeding treatments were randomized within each strip with three replications of each treatment. Treatments were initiated in the fall of 2019 with core aeration and ½ ft3 compost applied on 22 October, 2019, 22 April, and 5 June, 2020, and a liquid soil surfactant applied on 25 October, 2019, and 5 June, 2020, and watered into the soil. Overseeding occurred on 24 October, 2019, using ‘Hounddog’ turf-type tall fescue blend (DLF-Pickseed, Halsey, OR). The turf was maintained at 3 inches (7.5 cm) using a rotary mower and mowed twice weekly prior to the deficit irrigation cycle and as needed during deficit irrigation to minimize any wheel tracking of stressed turf which might affect digital imaging. The area received approximately 3.0 lb of nitrogen annually from a predominantly controlled release granular fertilizer. Supplemental irrigation needs were determined using a deficit irrigation strategy based on a 70 percent green color threshold (GCT70). The deficit irrigation program began on 19 June, 2020, and ended on 4 September, 2020. Prior to the deficit irrigation period, the entire area was uniformly hydrated via overhead irrigation to maximize the soil water reservoir of this silt-loam soil. Thereafter, the center of each plot was imaged using a digital camera and light box every three to four days depending upon turf response. Images were analyzed for digital green color using a Java-based software program, Turf Analyzer (Karcher et al., 2017). Once an individual plot fell below the 70 percent green color threshold that plot received ½-inch of water from a hose equipped with a flow meter. The application was split into two ¼-inch applications approximately 30 minutes apart to prevent runoff and border effects. The GCT70 threshold was selected based on previous experience in maintaining a lawn turf at a minimally acceptable level of green color and density. Additionally, visual quality was regularly rated on a 0 to 10 scale where 0=brown, dead turf; 6=minimally acceptable lawn turf; and 10=optimal uniformity, density, and color.
Key Findings through 2020
• Supplemental irrigation needs ranged from 7.7 to 8.9 inches of water across the 75-day deficit irrigation period with only slight differences among treatments. • For this first year of the study the core aeration treatments had no effect on supplemental water needs; it is hypothesized that the effects of this practice will likely become more prominent after a second year of soil cultivation events affects the sod layer. • For seasonal turf appearance (April – October) values ranged from 5.5-7.8 with higher values associated with any treatment that received compost applications. The compost applications resulted in a visibly greener turf in early spring and autumn. During the deficit irrigation period these treatments also trended toward having a greener appearance and required slightly less supplemental irrigation. This study will continue in 2021 to determine the effects of these cultural inputs on the supplemental irrigation needs of sodded lawns.

Purdue research plots during deficit irrigation in 2020.
(Cool Season Trials, $15,000 2016-19; Warm Season Trials $30,000, 2018-21)
As discussed at previous TPI Lawn Institute Research Committee meetings, the United States Golf Association (USGA) budgeted considerable funding to conduct a national water use and drought tolerance trial, utilizing the National Turfgrass Evaluation Program (NTEP) as its evaluation organization. USGA funded the building of rainout shelters and irrigation infrastructure at several locations, and is working with NTEP in determining testing protocols, data collection methods, etc. Besides data collection on water use and drought resistance parameters, the goal of this effort is for the EPA Water Sense program to adopt these (or similar methods) and to agree to certify the first plant species with the Water Sense label. USGA has become a Water Sense partner and we have talked to the Water Sense staff about certifying grasses. EPA is very interested in the concept (they have never certified a plant or plants as water saving) as we have met with them to discuss collaborative efforts. However, EPA needs to see more about the methods and tests, as well as we believe, some successful trials. Also, they will need our help in solving some legal requirements when certifying a product (could be unique for plants, however). Because of space limitations (only around 30-35 entries can be accommodated), we limited the trial to only Kentucky bluegrass and tall fescue. We chose tall fescue over perennial ryegrass because of more interest from seed companies in submitting entries (than perennial ryegrass). Fortunately, when our deadline passed, we had received 32 entries (14 bluegrass, 18 tall fescue). We added three standards to the trial (one each of Kentucky bluegrass, tall fescue, and perennial ryegrass). Most locations planted the trial in fall 2016, while a few had to wait on infrastructure improvements (mostly irrigation), and therefore planted in spring 2017. Planting plans were developed for both Approach 1 and 2 sites. Drought treatments were initiated in 2017 on those locations with mature plots. Rainout shelters were ordered and delivered in spring 2017 to each of the five Approach 1 sites. Installation was performed by staff at each site. As a part of the grant agreement, NTEP returned a portion of the funding allocated for rainout shelter purchases back to each researcher to help with installation and other initial expenses. Approach 2 sites received $15,000 initial set-up costs for irrigation installation and/or other expenses. After the initial development of protocols, we have continued to meet with our cooperators to examine and tweak these protocols. This process is ongoing as we see what works, and what does not work, making additional changes to procedures, if necessary, in the future. The cost to run each trial location is high, and only a portion of that is covered by USGA’s donation ($250,000). Therefore, we sincerely appreciate the support received from The Lawn Institute for the initiation of this trial. Without your support, this trial would not be conducted. The warm-season version of this trial was established in summer 2018 at ten trial locations (five rain exclusion shelter, five using ETo -based deficit irrigation). This trial consists of seventeen entries: eleven bermudagrasses, five zoysiagrasses, and two buffalograsses. Due to the pandemic, we were not able to visit any sites from March 2020 – June 2021.
COOL-SEASON TRIAL
The first data from the cool-season trial was collected in 2017 at six of the ten locations. Four Approach 1 (shelter) locations collected data during a 100-day induced drought period, and in some cases, large differences were noted in the amount of water used by entries, however very little statistical differences were noted among entries. For 2018, we changed the re-watering procedures threshold to 65 percent green cover, as well as expanded our statistical analysis for all sites to include separate Kentucky bluegrass and tall fescue tables. These changes resulted in better entry separation in 2018 and 2019. In 2020, four of the ten sites completed their final year of data collection.
APPROACH 1 Rain exclusion shelters are used to simulate 100-day drought periods in higher rainfall regions. Under the rain exclusion shelters we measure the amount of water needed to maintain 65 percent green cover, rate turfgrass quality as well as evaluate recovery from drought when irrigation is resumed.
Irrigation amounts needed to maintain 65 percent green cover varied considerably among entries, and in some cases was more than double the best entry. Similar to the previous years, the Fayetteville, AR, site seasonal water data had a wide range, from 34.0 mm to 80.7 mm per entry in 2020. As in 2019, large differences were noted within Kentucky bluegrass and tall fescue entries, but the only statistical differences noted were between a few tall fescue entries, such as ‘Nonet’, ‘BarRobusto’, ‘MRSL TF15’, ‘Stetson II’ and ‘Titanium 2LS’.
Rain exclusion shelters were used for the Approach 1 water use research of both cool-season and warm-season grasses. The one shown here is in Griffin, GA.
Various factors resulted in limited data collection in 2019 at the Amherst, MA, site (Approach 1), therefore they collected 2020 data using two distinct dry-down ‘seasons.’ The first dry-down season of 2020 showed excellent entry differences under the rainout shelter with ‘NAI-13-14’ and ‘PST-K11-118’ Kentucky bluegrass requiring the least water to maintain green cover (8.7 mm). Other bluegrasses such as ‘Everest’, ‘Babe’, ‘Midnight’, and ‘NAI-13-132’ also finished in the top statistical group, surprisingly ahead of every tall fescue entry. The second dry-down season delivered very similar water use numbers, but with much less statistical significance. ‘NAI-13-14’, ‘PST-K11-118’, ‘Babe’, and ‘Everest’ needed the least water again in ‘Season 2’ but with several tall fescues performing equally well.
APPROACH 2 The drier climate ET o-based sites evaluate performance at three deficit irrigation levels for 100–120-day periods. Data recorded includes percent green cover over time, turfgrass quality, and recovery rate after complete replacement irrigation is initiated. The ETo -based locations allow us to determine the minimum level of deficit irrigation appropriate for, and thus the water savings from, each entry. It was determined that 80, 60 and 40 percent ETo replacement levels would be utilized for data collection, with the exception being St. Paul, MN (0, 25, and 75 percent ETo levels). In 2020, only Approach 2 sites, Fort Collins, CO, and Logan, UT, needed to collect their third year of data. In Logan, only one Kentucky bluegrass, ‘PST-K11-118’ reached the acceptable turfgrass quality level for a lawn (6.0) under any irrigation regime (60 percent ETo). And only a few entries achieved acceptable turfgrass quality for a low maintenance turf area (5.0). Under 40 percent ET o replacement, only ‘Dauntless’, ‘NAI-13-14’, and ‘PST-K13-137’ finished the season with an average turf quality of at least 5.0. Tall fescues again performed better overall than Kentucky bluegrass with several entries finishing the 2020 season with turfgrass quality average rating of 6.0+. Under 40 percent ETo replacement tall fescue entries such as ‘Kingdom’, ‘PST-5SDS’, and ‘Thor’ finished in the top turfgrass quality statistical group with season average turfgrass quality scores over 6.0. Surprisingly, turfgrass quality scores under 60 percent and 80 percent ETo weren’t significantly higher, and for some entries, were lower than the 40 percent ETo level. The 2020 data from Fort Collins, CO, showed small statistical significance with no entry delivering acceptable turfgrass quality scores (6.0 or above), even under the optimum 80 percent ETo replacement level. All entries struggled under 40 percent ETo replacement as tall fescues ‘DLFPS 321/3677’ and ‘PST-5SDS’ had the highest average turf quality at 4.3. The 60 percent ETo level did deliver one tall fescue entry (‘Thunderstruck’) with a minimally acceptable average score of 5.0. Several tall fescues, but no Kentucky bluegrass, finished with a minimally acceptable average quality under 80 percent ET o replacement. The best tall fescues under this level were ‘PST-5SDS’ (5.5), ‘DLFPS 321/3679’ (5.4), ‘Kingdom’ (5.4) and ‘Thor’ (5.4). Cool-season water use data from 2017-2020 can be found at this link to the NTEP website: http://www.ntep.org/csw.htm.
WARM-SEASON TRIAL
Due to slow establishment of some entries, data collection did not initiate until 2020. Deficit irrigation levels (ETo based sites - Approach 2) were set at 30, 45, and 60 percent ETo replacement. Rainout shelter sites (Approach 1) rewatered plots when percent green cover reached 65 percent. Both approaches conducted their evaluations for 120-150 days. Data from 2020 was submitted by eight of the ten locations. In year one, compared to the cool-season trial entries, much greater statistical significance was noted between these entries. For instance, at the Approach 1 site in Stillwater, OK, the amount of water needed to maintain at least 65 percent green cover over the drought period varied from 0 – 160.7 mm (0 – 6.3 inches). ‘Rio’ bermuda (0 mm), ‘Prestige’ buffalograss (8 mm), ‘Meyer’ zoysia (25 mm) and ‘Dog Tuff’ bermuda (33.7 mm) finished in the top statistical grouping. Large variations in water needed to maintain 65 percent green cover were also noted at the Approach 1 site in Mississippi State, MS. The lowest water users were all bermudagrasses, ‘ASC 118’ (25.3 mm), ‘FB 1628’ (33.7 mm), ‘ASC 119’ (42.3 mm), ‘Rio’ (84.3 mm), ‘Monaco’, (84.7 mm) and ‘TifTuf TM’ (84.7 mm), where the entry with the greatest water use needed 262.7 mm (10.34 inches).
At the Approach 1 sites in Lexington, KY, and Jay, FL, ‘TifTuf’’ required the least water of all entries (59 mm and 4.3 mm, respectively). At Lexington, the only other entry that performed statistically equal to ‘TifTuf ’ for water used
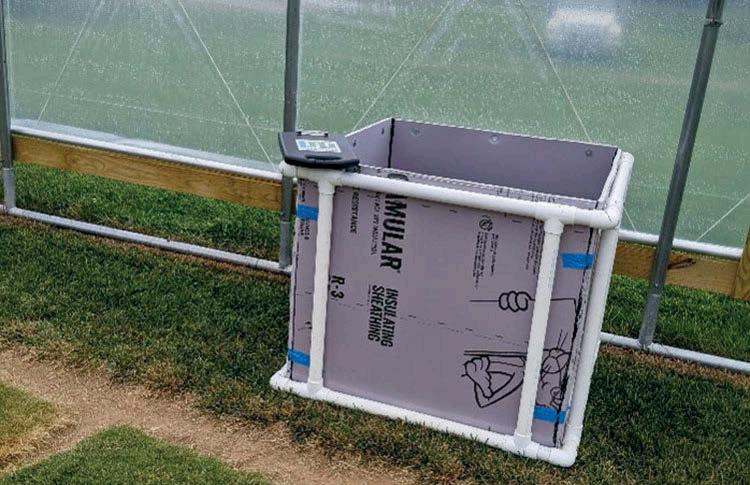
The ‘Irrigation’ Box used to restrict water applications to only a one-meter square area in the middle of the plots.
was ‘ASC 118’ bermuda. Even though water applied at Lexington ranged as high as 423.3 mm (16.6 inches), the highest turf quality ratings did not always correlate with the lowest water use. ‘Dog Tuff’ had the highest overall turfgrass quality score (6.1), but used 160.7 mm of water, which was significantly more than the best entries, and in the middle of all entries.
At Jay, FL, besides ‘TifTuf ’, zoysias ‘Stellar’ (8.3 mm) and ‘FAES 1307’ (29.7 mm), bermuda entries ‘FB 1628’ (29.7 mm), ‘Tahoma 31’ (34 mm) and ‘Tifway’ (46.3 mm), and ‘Prestige’ buffalograss (55.3 mm) finished in the top statistical group. Curiously, ‘Stellar’ was one of the lowest water using entries at Jay, FL, but one of the highest water users at Lexington, KY (339 mm).
These three photos are from the warm-season water use trial in Davie, FL, and were taken in February of 2020; L-R: 30 percent ETo, 45 percent ETo, 60 percent ETo Replacement.
As mentioned above, the Ft. Lauderdale site ran their Approach 2 trial from mid-December 2019 to the end of July 2020 (about 33 weeks). The buffalograss entries did not acclimate to the south Florida climate and died before irrigation treatments could be initiated. Besides the demise of the buffalograss, the surprising result from 2020 was how well the entries performed even at the 30 percent ETo replacement. On most turf quality rating dates, all entries had scores at or above the minimum acceptable quality level of 6 under the 30 percent ETo. This is the only Approach 2 site that saw this result, and while being totally unexpected, may require a rethinking of irrigation requirements for south Florida. Since severely reducing irrigation did not significantly affect these entries, most entries finished in the top statistical group, with ‘Tifway’ (TQ=7.0), ‘FB 1628’ (6.9), ‘Tahoma 31’ (6.8) and ‘TifTuf ’ (6.8) as the top four The Riverside, CA, Approach 2 location, 2,600 miles away and with a Mediterranean climate, posted much different results from the subtropical Ft. Lauderdale site. No entry finished with the minimum overall turf quality average of 6.0 under 30 percent ETo replacement. Several entries, however, did maintain acceptable quality for up to nine weeks into the stress period, with only ‘TifTuf ’ posting an acceptable quality rating in week 10. Over the twenty-week drought stress period, ‘FB 1628’, ‘TifTuf ’, ‘Tifway’, ‘Tahoma 31’, and ‘Dog Tuff’’ had statistically equal overall turf quality averages. At College Station, TX, the entries also performed surprisingly well under the 30 percent ETo level with several finishing at turf quality 6.0+. ‘TifTuf’, ‘Tahoma 31’, and ‘Tifway’ bermuda, along with ‘Meyer’ zoysia were the only entries in the top statistical group to maintain at least a 6.0 quality score on each rating date across the twenty-week trial period. Similarly, the Las Cruces, NM, Approach 2 data showed four entries, ‘TifTuf’, ‘FB 1628’, ‘Tifway’, and ‘Tahoma 31’, with a 6.2 or higher average turf quality rating. ‘TifTuf ’ was the only entry to maintain a minimum quality score over seventeen weeks, falling just below 6.0 on the final rating date. Warm-season water use and drought data can be found at the following link on the NTEP website: https://ntep.org/ reports/ws18w/ws18w_21-4/ws18w_21-4.htm.
Key Objectives and Deliverables
The objectives of this trial are the following:
1. Determine the 100–120-day, summer water use of coolseason and warm-season turfgrass species and cultivars.
We now have three years of data from all ten cool-season sites. We have seen large differences among some entries, but not as much statistical significance as we would like to see at the coolseason sites. It may be that a few of the sites are just too hot to get accurate estimations of cool-season water use (these sites have extreme heat tolerance which blur the line between heat and drought tolerance). For the northern cool-season sites, we have seen greater statistical significance. The warm-season trial delay, due to establishment issues, meant that the first data was collected starting in 2020. Despite Covid-19, eight sites were able to collect data and significance was noted at all sites, much more so that than the cool-season sites.
We expect this trend to continue for the next two years.
2. Determine turfgrass recovery of grasses after 30 days
and 60 days without water. Recovery has been measured but as stated in objective 1 above, not as much statistical significance with the cool-season grasses has been noted at some sites. The warm-season trial is thus far providing much greater significance and excellent water use rates.
3. Determine the percentage of ET replacement required by each entry to maintain a prescribed level of green or
quality. Similar to objective 1, for cool-season grasses, we have three years of data from all ten sites. One thing we can say is that all sites are not created equal, for example, the lowest (40 percent) and medium (60 percent) ET replacement did not deliver any acceptable entries at Riverside, CA, which means more breeding is needed for these grasses to be used with less water at an environment such as Riverside. At other sites, such as Las Cruces, NM, 60 percent ETo did show some entries with acceptable performance, probably because some summer rains occur there. Again, we do not have enough data to answer this
question definitively, but it could mean that some sites have difficulty separating heat stress from drought stress.
4. Develop requirements for water use and drought tolerance/recovery to be certified as a low-water-use
turfgrass. See the information on objectives 1 and 3. We can make determinations after three years of data collection.
5. Work with U.S. EPA WaterSense® or another organization to develop and apply a national water saving
certification to qualified turfgrasses. We are in contact with the WaterSense office, but since EPA has been struggling with funding, it has been impossible for WaterSense to move forward with turfgrass certification. However, we did help and support Congressional authorization of WaterSense, which passed in 2020. Authorization helps protect the WaterSense program from elimination while also allowing EPA to request separate WaterSense funding in their budget requests (they have never had a separate budget line item for Water Sense, which has restricted the program’s growth). We are feeling that eventually, a Water Sense turfgrass certification program may be possible.
Athlete Hydration during Physical Activity in Excessive Heat on Artificial
Turf and Natural Grass (2021, $5,000)
Third generation (3G) artificial turf sports fields were introduced in the 1990s and have since seen a continuous rise in use. The perceived durability of these fields has even led to increase usage in regions where weather conditions are favorable for growing natural turfgrass year-round. Numerous athlete health concerns have emerged surrounding 3G artificial turf (e.g., increased injury rates and skin infections, exposure to toxic or carcinogenic chemicals from crumb rubber infill), but one of the most critical issues during summer months is high surface temperatures (Cheng et al., 2014). Reports have suggested that surface temperatures on 3G artificial turf can reach up to 170 °F (76.67 °C) during hot, sunny conditions, which can be substantially higher than ambient temperatures and adjacent natural turfgrass (Jim, 2017). The black color and heat characteristics of 3G artificial turf crumb rubber infill, in addition to the inability to transpire like natural turfgrass, are the main reasons for reported temperature differences. Heat stress affects athletes’ comfort, performance, and overall safety, so some sports organizations recognize the importance for heat guidelines; however, these guidelines often do not account for the intensity of the physical activity and are based on ambient temperatures instead of the actual temperatures measured on a field (Twomey et al., 2016). This allows practices and competitions to continue on excessively hot 3G artificial turf fields in times where ambient temperatures seem “safe.” With all of this in mind, it is important that sports organizations understand how surface temperatures between 3G artificial turf and natural turfgrass fields during these hot conditions affect athlete hydration. There is currently no known scientific literature on this topic. This information would assist sports organizations, athletes, trainers, and coaches to better prepare for different field surfaces during hot weather (e.g., heat and hydration policies/guidelines) and could have implications on field selection (e.g., for individual practices/ competitions or even new construction) in warmer climates. The primary objective of this proposed research is to contrast athlete rate of dehydration during exercise interventions on a 3G artificial turf and natural turfgrass sports field in TX during summer 2021. Other athlete physiological and performance measures will be collected for comparison between the two surfaces as a secondary objective. The study will take place at the Penberthy Recreational Sports Complex in College Station, TX, on one 3G artificial turf field (2-year-old AstroTurf product with crumb rubber infill) and one adjacent natural turfgrass field (Tifway 419 hybrid bermudagrass on a 6-inch sand-capped soil). Approval from the Texas A&M University Institutional Review Board will be received prior to study initiation. Twenty male collegiate club soccer athletes will be recruited to participate. The study design will be a crossover with two treatments (3G artificial turf and natural turfgrass) and a 2-day recovery period between treatments. Participants will be split into two even groups, where each group will perform a 75-minute exercise intervention on either the 3G artificial turf or natural turfgrass field. After the recovery period, each of the groups will crossover and complete the same intervention on the other field type. Clear, sunny days with ambient temperatures ≥90 °F (32.33 °C) will be selected for each intervention (likely in August). Surface characteristics (e.g., surface hardness, infill depth, soil moisture, and turfgrass quality), as well as several additional weather variables (e.g., surface temperature, cloud cover, wind speed, humidity), will be measured prior to or during the interventions. Investigators will ensure participants are adequately hydrated prior to each intervention. Gold standard hydration measures of urine, sweat, blood, and body weight (Mettler Toldeo), as well as bioelectric impedance (InBody 770), will be obtained before, midpoint, and after interventions. Additional athlete measures include skin and core temperature, as well as comprehensive workload characterization tracked by wearable sensors (e.g., heart rate, distance and speed measurements, total workload, time in intensity zones, accelerations and decelerations). Athletes’ perceptions of heat and surface characteristics will also be determined after each intervention. Descriptive statistics will be calculated, and appropriate crossover modeling will be applied to determine treatment effects with respect to each measure of interest.
Potential Benefits and Deliverables
• Quantification of surface heat impact on athlete hydration during physical activity on 3G artificial turf versus natural turfgrass during hot weather conditions. • Information that could assist decision-makers, sports organizations, athletes, trainers, and coaches to better prepare for different field surfaces during hot weather (e.g., heat and hydration policies/guidelines; field selection/construction). • Addition of valuable information to a group of studies developing wearable hydration monitoring technology for athletes. • Peer-reviewed and popular press articles reporting the study’s findings.
Long-term Environmental Impacts and Energy Balance of Lawn Removal and Conversion to Alternative
Landscapes ($30,000, 2021-23) Lawns have long been a cultural feature of United States homes, widely preferred by homeowners as a primary residential landscape. However, as population growth in urban areas continues to rise, water conservation is becoming a key priority for many municipalities. In recent years, many municipalities have begun to offer rebate programs which incentivize removal of turfgrass areas and conversion to alternative ‘water-efficient’ landscapes, with the goal of reducing outdoor water use (Chesnutt, 2019; Pincetl et al., 2019). However, the environmental impacts and changes to ecosystem services associated with such landscape alterations are still not well understood. As a result, ‘Ecosystem Services and Impacts’ of lawns was recently identified as one of the top research priority areas through the NTF/FFAR National Turfgrass Stakeholder Summit (Morris, 2020). A 2-year The Lawn Institute(TLI)/Scotts Miracle-Gro funded research project was conducted at the Urban Landscape Runoff Research Facility at Texas A&M in 2018 and 2019. The results of this initial 2-year study highlighted many differences in rainfall capture and runoff dynamics, surface temperatures, and management requirements between natural turfgrass lawns, xeriscapes, mulched, and artificial turf landscapes. However, as these landscape treatments continue to mature, there is a need to evaluate longer-term environmental impacts/runoff dynamics, and also to characterize energy balance, greenhouse gas emissions, and soil nutrient pools. This two-year study will be conducted at the Urban Landscape Runoff Facility located at the Texas A&M University Soil and Crop Sciences Field Research Laboratory, College Station, TX. The facility consists of 24 individually irrigated 13-ft x 27-ft plots originally established in 2012 with ‘Raleigh’ St. Augustinegrass. Each plot has its own runoff collection system composed of an ISCO flow meter and sampler. This provides full documentation of the amount of water lost to runoff as well as collection of water samples for subsequent measurement of the chemical content of the runoff. The treatments to be studied include ‘Raleigh’ St. Augustinegrass (native soil and sand-capped) and various combinations of Xeriscape, Native Plants, Mulch, and Artificial Turf. This continued study was initiated in April 2021 and will conclude in June 2023 (including data analysis). During the two-year study period, the following measurements will be taken in spring, summer, fall, and winter. Runoff & Rainfall Capture Dynamics: Total runoff volumes and rainfall capture will continue to be evaluated for naturally occurring rainfall events (average values will be used for season result). Runoff water samples will be collected and analyzed for pH, electrical conductivity (EC), Nitrogen (Total N, NO3-N, NH4-N, organic N) and orthophosphate-P concentrations. Nutrient losses through denitrification and volatilization: According to Bremer (2006), most N2O emissions occur following fertilization and precipitation. Thus, greenhouse gases will be measured prior to, and within 3 days after fertilization in spring, summer, and fall. If naturally occurring rainfall does not occur following fertilization, irrigation will be used to water in fertilizer.
Energy balance: Net radiation, albedo, spectral irradiance (400 to 1100 nm), spectral reflectance, surface temperature, soil heat flux density, atmospheric humidity, and wind speed will be directly measured during the afternoon hours on clear days. Sensible heat flux density (rate of heating or cooling of air) and latent heat flux density (rate of evapotranspiration) will be estimated by energy balance theory. On October 5, 2019, we measured the midday differences between surface temperatures of the plots and air temperature to be 3, 13, 20, and 24 °F (-16.11, -10.56, -6.67, and -4.44 °C) for the natural grass, xeriscape, hardwood mulch, and artificial grass, respectively. Soil nutrient dynamics: Our approach will be similar to that of Heavenrich and Hall (2016). Soil cores (0-12” depth) will be taken from each treatment, with three from each replicated lawn and artificial turf treatments and six from water-efficient landscapes (3 under planted and 3 under unplanted areas). Soil nitrate-N, ammonium-N, and total Carbon will be analyzed on the soil cores to understand the long-term implications on soil nutrient pools.
Potential Benefits and Deliverables
The information gained from this project will contribute to a growing body of data relating to alternative landscape conversions and natural turfgrass lawns being developed from this research facility. Two publications have already been prepared from the initial 2-year project and submitted to peer-review journals focusing on urban landscape issues. Furthermore, because of information disseminated through the earlier project, we were recently contacted by decision makers focusing on improvement of water quality and supply
for Southern California. Information from this project will benefit municipalities, water purveyors, and homeowner associations as they weigh the long-term consequences and impacts of lawn removal and landscape conversion programs.
Sod Strength Characteristics of 24
Fine fescue Cultivars (2021-23, $20,351)
There is a clear desire for lower-input sod species, such as fine fescue (Festuca spp.) from consumers (Hugie et al., 2012; Yue et al., 2012). In addition, increasing concerns over the environmental impacts of soil erosion from industrial and infrastructure development are also expected to be rapidly increasing sources of demand for sod. However, despite the fact that many different turfgrass species exist, most sites today in the northern U.S. are planted as sod with the same varieties of Kentucky bluegrass (Poa pratensis), regardless of site management. Recent genetic improvements in low-input turfgrass species now provide sod farms other options when selecting what to plant (Braun et al., 2020). Since the selection of turfgrasses (either low- or high-input) by sod farms ultimately impacts the level of input required by those receiving sod installations (homeowners), decisions made by sod farmers and landscape contractors can have a tremendous impact on the environment and efforts to manage turf sustainably. Preliminary 2019-2020 data from collaborative research at Purdue University and University of Minnesota investigating low-input sod production funded by USDAAMS is showing some promising results with fine fescue sod production, especially with strong creeping red fescue (Festuca rubra ssp. rubra) because of its rhizome system. Results from this USDA funded sod research also show us that there is much variability in horizontal spread between genotypes of strong creeping red fescue. This indicates there may be potential differences among cultivars within a fine fescue species or subspecies. In addition, preliminary results from a The Lawn Institute-funded experiment in 2020 at Purdue University titled “Identification of Successful Nitrogen Fertilization Establishment Regimes for Fine Fescue Sod Production” is showing that strong creeping red fescue is producing the highest sod strength, slender creeping red fescue (F. rubra ssp. littoralis) is the next highest, and then Chewings fescue, and hard fescue (Festuca brevipila) is the lowest sod strength among fine fescues. Preliminary results from this experiment are also demonstrating that plant genetics and not nitrogen fertilization has the greatest impact on sod strength. Overall, the preliminary results from these previous experiments consistently show there are differences in sod strength among the fine fescue taxa (i.e., species and subspecies). New release of fine fescue cultivars, as well as variable cultivar performance in differing environments (NTEP, 2014, 2018), necessitates further sod strength research to continue to provide more information and options for sod producers. Therefore, the objective of this experiment is to identify the best performing cultivars of fine fescues for sod production. This field experiment will be planted in early September 2021 and again in September 2022 with harvests to occur the following year. The experiment will include 24 cultivar treatments arranged in a randomized, completeblock design with four blocks. All plots will receive the same rate of starter fertilizer at planting and the same annual Nitrogen (N) rate of 2.5 lb N/1000 sq ft per year. The cultivars in the study include nine varieties of Strong creeping red fescue, six varieties of Slender creeping red fescue, five varieties of Chewings fescue, and four varieties of Hard fescue.
Sod harvests will occur at 9, 11, and 14 months after planting (MAP). These sod harvest timings were selected based on preliminary sod harvest data timings from lowinput sod production experiments, which include various fine fescues and other cool-season turfgrass species at Purdue University at 11, 12, and 14 MAP funded by USDA-AMS. Data collection at each sod harvest timing will include measurements of sod tensile strength (maximum tensile load and work required to tear sod) per the methods of Friell et al. (2017) and a categorical characterization of sod handling per methods of Gopinath et al. (2015), as well as turf quality and soil moisture. Purdue has a tensile strength device that we are currently using to conduct other research funded by USDA-AMS. Results from this experiment will be incorporated into an extension publication on sod production, showcased at our turf field day, and also discussed at a future TPI meeting. A write-up of the project results will be published in Turf News. Further, results will be distributed via social media (Twitter, Facebook, etc.) and be shared with peers through an open-access, refereed publication, and scientific presentations.
Call for Research Proposals
The Lawn Institute will continue to release its annual Call for Research Proposals each August and work hard to fund research that is impactful to TPI members. If you have questions or comments about this process; or about specific research interests, please contact Dr. Casey Reynolds at creynolds@TurfGrassSod.org.
Casey Reynolds, PhD, is executive director of Turfgrass Producers International. rs
All photos and graphics for this article have been supplied by the research team of the research project in which they appear.