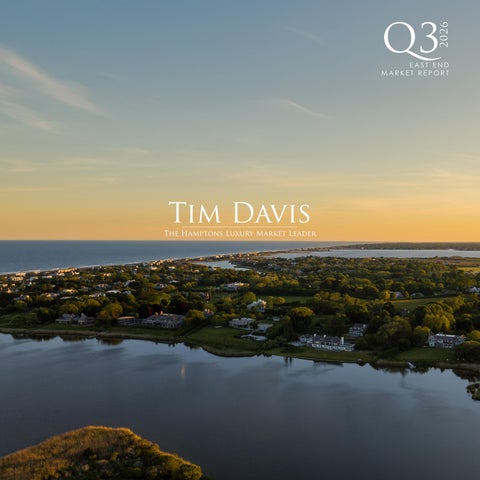
2026
Q3
EAST END MARKET REPORT
Tim Davis
The Hamptons Luxury Market Leader
2150 MEADOW LANE, SOUTHAMPTON | $29,500,000
3RD QUARTER REPORT 2026 The South Fork reported 412 single-family home sales in Third Quarter 2026, essentially unchanged from a year ago and up 16% from last quarter. This followed two consecutive quarters of double-digit annual declines. However, activity came in 20% below the ten-year third-quarter average of 518 reported sales. Nine of the 14 submarkets posted year-over-year declines in reported closings, and five posted gains. All submarkets west of the canal saw annual declines except East Quogue/ Hampton Bays, which added six sales. East of the canal, East Hampton had the largest gain, adding 27 sales to reach 93 closings. Amagansett doubled its reported closings to 16, and Montauk added 10 sales. Southampton Village reported the largest decline, down to 17 closings. Dollar volume rose 17% year-over-year to $1.630B, the highest third-quarter total since 2022. Across the region, eight submarkets posted year-over-year dollar volume gains, while six moved in the opposite direction. Montauk saw the most significant gain, with dollar volume up 155% to $129.789M. This increase was driven by five sales at or above $10M, including a newly built home on Wills Point Road that sold for $23M, whereas a year ago there was one. Median price increased 8% to $2.268M, the highest third-quarter median on record, due to a larger share of sales above $3M. Sales above $3M accounted for 38% of the market, up from 33% a year ago. Average price climbed 17% to $3.956M, second only to the record set in Fourth Quarter 2025. Average price was boosted by nine sales at or above $20M, more than double the four a year ago.
2
T I M DAV I S H AM P T O N S .CO M
71 GIN LANE, SOUTHAMPTON | $17,500,000
SINGLE FAMILY SOUTH FORK
ANNUAL CHANGE
412
$1.630B
$3.956M
$2.268M
Sales
Volume
Average Price
Median Price
0%
+17%
+17%
+8%
TI MDAVI SH AMPTO NS.C O M
3
4
T I M DAV I S H AM P T O N S .CO M
TI MDAVI SH AMPTO NS.C O M
5
6
T I M DAV I S H AM P T O N S .CO M
TI MDAVI SH AMPTO NS.C O M
7
8
T I M DAV I S H AM P T O N S .CO M
TI MDAVI SH AMPTO NS.C O M
9
10
T I M D AV I S H AM P T O NS .CO M
TI MDAVI SH AMPTO NS.C O M
11
12
T I M D AV I S H AM P T O NS .CO M
LUXURY MARKET THE RESIDENTIAL LUXURY MARKET
The luxury market is the top 10% of all home sales by price during the quarter. As various factors redefine the high-end market in any given period, price figures may exhibit more volatility than the market overall. However, because the luxury market is a fixed percentage of the overall market, its change in the number of sales will always match the overall market. In Third Quarter 2026, South Fork luxury average price jumped 29% to $15.765M. The number of transactions at or above $20M more than doubled, rising from four last year to nine this year. This increased concentration of high-end sales, combined with a smaller share of sales below $10M, pushed the South Fork luxury median price up 22% to
$13.150M. The most expensive sale of Third Quarter 2026 was an oceanfront residence on Beach Lane in Wainscott, which traded for $59M. Bridgehampton/Sagaponack had the highest number of South Fork luxury transactions, with nine closings reported during the quarter. The average luxury sale price for the North Fork rose 20% annually to $4.507M, and median price grew 21% year-over-year to $3.750M. The median increase was due to a greater share of sales at or above $4M: half of North Fork luxury sales this quarter were at or above $4M, compared with just 13% a year ago. The highest-priced North Fork sale was the former Old Field Vineyard in Southold, a property of more than 21 acres on Peconic Bay with two homes, which closed for $12.35M.
258 HORSEMILL LANE, WATER MILL | $39,500,000
495 OX PASTURE ROAD, SOUTHAMPTON | $35,000,000
LAND MARKET & INVENTORY LAND MARKET The land market is defined as the total sales of all vacant land on the East End regardless of zoning. The commercial market encompasses sales of existing buildings classified for non-residential use only. Traditionally, both Forks experience relatively few commercial transactions in any given quarter.
INVENTORY Inventory is the number of East End properties listed for sale at the end of the quarter. At the end of September, there were 1,554 active listings, down 28% annually to the lowest third quarter level on record. This figure falls 21% below the five-year third-quarter average.
TI MDAVI SH AMPTO NS.C O M
13
TimDavisHamptons.com
Methodology & Source For the purposes of the South Fork market comparison, this report contrasts the villages and hamlets from Remsenburg to Montauk, plus Shelter Island, while the North Fork encompasses the area extending from Aquebogue to Orient. The Corcoran Report uses market-wide data from Suffolk Vision Incorporated, based in Smithtown, NY and is based upon transactions reported from October through December 2024. It compares data to that reported in the same period of 2023 as well as the prior quarter. There can be a significant period between when a contract is signed, the sale is closed, and then reported publicly. As a result, many transactions in this analysis actually occurred prior to being reported.
Real estate agents affiliated with The Corcoran Group are independent contractors and are not employees of The Corcoran Group. The Corcoran Group is a licensed real estate broker located at 24 Main St., Southampton, NY 11968.. All material presented herein is intended for information purposes only and has been compiled from sources deemed reliable. Though information is believed to be correct, it is presented subject to errors, omissions, changes or withdrawal notice.