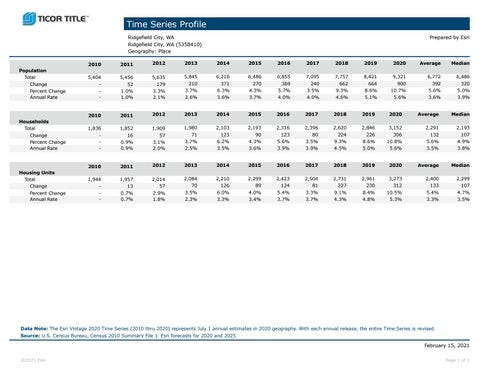
Time Series Profile Ridgefield City, WA Ridgefield City, WA (5358410) Geography: Place
Population Total Change Percent Change Annual Rate
Households Total Change Percent Change Annual Rate
Housing Units Total Change Percent Change Annual Rate
Prepared by Esri
2010
2011
2012
2013
2014
2015
2016
2017
2018
2019
2020
Average
Median
5,404
5,456
5,635
6,486
6,855
7,095
7,757
8,421
9,321
6,772
6,486
52 1.0% 1.0%
179 3.3% 2.1%
5,845 210
6,216
-
371 6.3%
270 4.3%
369 5.7%
240 3.5%
662 9.3%
664 8.6%
900 10.7%
392 5.6%
320 5.0%
3.6%
3.7%
4.0%
4.0%
4.6%
5.1%
5.6%
3.6%
3.9%
2010
2011
2012
2013
2014
2015
2016
2017
2018
2019
2020
Average
Median
1,836
1,852
1,909
-
16 0.9% 0.9%
57 3.1% 2.0%
1,980 71 3.7% 2.5%
2,103 123 6.2% 3.5%
2,193 90 4.3% 3.6%
2,316 123 5.6% 3.9%
2,396 80 3.5% 3.9%
2,620 224 9.3% 4.5%
2,846 226 8.6% 5.0%
3,152 306 10.8% 5.6%
2,291 132 5.6% 3.5%
2,193 107 4.9% 3.8%
2010
2011
2012
2013
2014
2015
2016
2017
2018
2019
2020
Average
Median
1,944 -
1,957 13
2,014 57
2,084 70
-
0.7% 0.7%
2.9% 1.8%
3.5% 2.3%
2,210 126 6.0% 3.3%
2,299 89 4.0% 3.4%
2,423 124 5.4% 3.7%
2,504 81 3.3% 3.7%
2,731 227 9.1% 4.3%
2,961 230 8.4% 4.8%
3,273 312 10.5% 5.3%
2,400 133 5.4% 3.3%
2,299 107 4.7% 3.5%
3.7% 2.6%
Data Note: The Esri Vintage 2020 Time Series (2010 thru 2020) represents July 1 annual estimates in 2020 geography. With each annual release, the entire Time Series is revised. Source: U.S. Census Bureau, Census 2010 Summary File 1. Esri forecasts for 2020 and 2025.
February 15, 2021 ©2021 Esri
Page 1 of 1