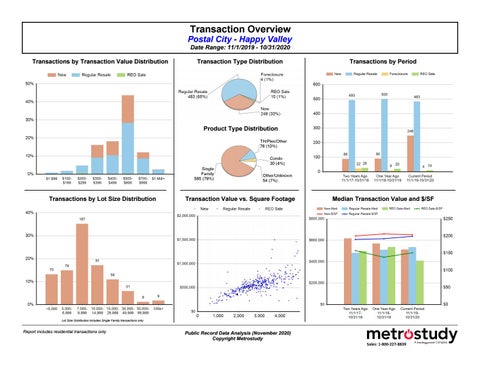
Transaction Overview Postal City - Happy Valley Date Range: 11/1/2019 - 10/31/2020 Transactions by Transaction Value Distribution
Transaction Type Distribution
Transactions by Period
Product Type Distribution
Transactions by Lot Size Distribution
Transaction Value vs. Square Footage
Lot Size Distribution includes Single Family transactions only
Report includes residential transactions only
Public Record Data Analysis (November 2020) Copyright Metrostudy
Median Transaction Value and $/SF
Spotlight on New Construction Postal City - Happy Valley Top 20 Builder Ranking 11/1/19 - 10/31/20
New Construction Activity By Year Year
New Home Closings
Rank Builder
Median Tran Value
Average Tran Value
LTV%
2009
102
$361,500
$378,463
76.3%
2010
65
$338,920
$335,500
78.3%
2011
79
$355,979
$347,214
86.5%
2012
95
$370,000
$372,482
83.6%
2013
178
$386,400
$388,542
83.2%
2014
95
$448,600
$444,052
78.9%
2015
113
$339,900
$427,899
79.6%
2016
155
$310,240
$364,605
81.3%
2017
62
$604,800
$600,593
75.0%
2018
89
$612,728
$630,879
75.4%
2019
111
$549,900
$575,890
73.2%
2020 (YTD)
217
$513,850
$535,304
81.5%
Cumulative
1 2 3 4 5 6 7 8 9 10 11 12 13 14 15 16 17 18
1,361
Report includes residential transactions only
New Home Closings
DR Horton Inc Holt Homes Inc ICHIJO USA CO Lennar Homes Stone Bridge Homes NW Toll Brothers Inc TA Liesy Homes Stone Creek Building & Development Inc GROUND BREAKERS CONST & DEV IN Richmond American Homes SCOUTERS MOUNTAIN LLC Suteki America Corp TOLL WEST COAST LLC WESTLAND INDUSTRIES INC Concept Custom Homes Inc Parker Development Northwest Inc CONNEMARA HOMES LLC ESTATES AT GLENMORRIE LLC
Public Record Data Analysis (November 2020) Copyright Metrostudy
91 35 28 25 18 17 12 7 4 2 2 1 1 1 1 1 1 1
Tran Volume
Med Tran Value
$39,119,780 $21,788,814 $13,936,025 $12,970,440 $11,337,436 $14,089,626 $5,866,515 $3,092,900 $1,519,000 $1,256,756 $1,070,765 $1,460,000 $879,495 $864,000 $824,500 $799,990 $626,062 $525,000
$389,770 $633,330 $486,060 $519,550 $632,405 $826,027 $465,310 $442,900 $381,250 $628,378 $535,383 $1,460,000 $879,495 $864,000 $824,500 $799,990 $626,062 $525,000
Avg Tran Value
$429,888 $622,538 $497,715 $518,818 $629,858 $828,802 $488,876 $441,843 $379,750 $628,378 $535,383 $1,460,000 $879,495 $864,000 $824,500 $799,990 $626,062 $525,000
Spotlight on Foreclosures Postal City - Happy Valley REO Activity By Year Year
REO Properties Acquired**
REO Properties Sold
Top 20 REO Property Holders
Net
Median REO Tran Value
2009
117
161
-44
$339,900
2010
119
95
24
$315,000
2011
137
105
32
$256,900
2012
42
133
-91
$218,181
2013
26
29
-3
$257,521
2014
19
24
-5
$357,556
2015
28
30
-2
$280,000
2016
25
25
0
$389,750
2017
25
29
-4
$445,000
2018
17
26
-9
$510,000
2019
8
16
-8
$584,500
2020 (YTD)
3
9
-6
$376,025
Current Total REO Properties: Annual REO Sales (11/1/19-10/31/20): REO Sales Monthly Rate: REO Property Months of Supply:
26 10 0.83 31.20
**Unique properties where title transferred to Lender or Guarantor; does not include foreclosures that were purchased at auction. Report includes residential transactions only
Rank
1 2 2 2 2 2 2 2 2 2 2 2 2 2 2 2 2 2 2 2
$408,450
Lender / Guarantor
STATE OF OR BANK OF NEW YORK MELLON 2005-AR8 BRIDGE ASSET MANAGEMENT LLC CITIBANK NA SERIES 2007-AR3 COLUMBIA ST BK DAY, RACHEL S DEUTSCHE BANK NATIONAL TRUST CO DR HORTON INC-PORTLAND FEDERAL HM LN MTG CORP FEDERAL NATL MTG ASSN FNMA HELM, DAVID E HOME FEDL BK IMB REO LLC JDR PROPERTY INVESTMENTS LLC PAHOMSKY, EUGENE REAC LLC S, DEUTSCHE BK TRUST CO AME 2006-QA SHEPPERD TRUST SUNTRUST MTG INC US BK NA SERIES 2006-2 Additional REO Properties not in Top 20 Current Total REO Properties
*3 additional Lender/Guarantor(s) tied for Rank No. 2
Public Record Data Analysis (November 2020) Copyright Metrostudy
Properties
4 1 1 1 1 1 1 1 1 1 1 1 1 1 1 1 1 1 1 1 3 26
Spotlight on Lender Activity Postal City - Happy Valley Loan Activity By Year
Top 20 Lender Ranking 11/1/2019 - 10/31/2020 Rank Lender / Guarantor
Median Loan Amount
Average Loan Amount
LTV%
356
299,426
299,215
79.8%
275
273,651
281,677
80.2%
2011
288
285,000
284,385
83.9%
2012
368
285,168
279,256
82.5%
2013
477
312,000
311,959
82.9%
2014
430
336,388
359,455
82.0%
2015
571
330,000
333,313
79.9%
2016
536
330,000
347,766
78.2%
2017
482
400,000
390,964
75.4%
2018
478
410,000
409,678
77.8%
2019
521
422,000
422,270
77.0%
2020 (YTD)
522
434,470
435,954
78.7%
Cumulative
5,304
Year
Loans
2009 2010
Report includes residential transactions only
1 2 3 4 5 6 7 8 9 10 11 12 13 14 15 16 17 18 19 20
DHI MORTGAGE UMPQUA BANK ONPOINT COMMUNITY CREDIT UNION CALIBER HOME LOANS US BANK GUILD MORTGAGE CO ROOT MORTGAGE UNITED WHOLESALE MORTGAGE FAIRWAY INDEPENDENT MORTGAGE CORPORATION HOMEBRIDGE FINANCIAL SERVICES INC EAGLE HOME MORTGAGE FINANCE OF AMERICA MORTGAGE WELLS FARGO HOME MORTGAGE ACADEMY MORTGAGE CORPORATION QUICKEN HOME LOANS MORTGAGE EXPRESS LLC COMMERCE HOME MORTGAGE JP MORGAN CHASE KEYBANK PRIMELENDING
Public Record Data Analysis (November 2020) Copyright Metrostudy
Loans
46 37 29 27 26 26 25 21 19 17 17 16 14 14 12 12 11 11 9 9
Loan Volume
$16,208,811 $16,423,180 $12,034,465 $12,095,159 $12,088,110 $10,431,269 $10,473,332 $9,291,723 $8,479,832 $7,252,952 $7,161,177 $6,292,319 $6,299,944 $6,219,112 $4,767,547 $4,499,751 $4,746,674 $4,526,560 $5,659,433 $4,354,733
Median Amt
Average Amt
$338,636 $424,000 $404,000 $475,250 $500,173 $416,850 $427,500 $428,416 $455,900 $423,920 $417,530 $380,000 $441,536 $456,075 $392,092 $380,512 $460,000 $390,000 $621,000 $432,250
$352,365 $443,870 $414,982 $447,969 $464,927 $401,203 $418,933 $442,463 $446,307 $426,644 $421,246 $393,270 $449,996 $444,222 $397,296 $374,979 $431,516 $411,505 $628,826 $483,859
Transactions by Price Range Postal City - Happy Valley Date Range: 11/1/2019 - 10/31/2020
Transaction Value N/A Transaction Type
#
< $149 %
#
%
$150-$199
$200-$249
$250-$299
$300-$349
$350-$399
$400-$499
$500-$699
$700-$999
#
#
#
#
#
#
#
#
%
%
%
New Regular Resale
2
REO Sale
1 10.0%
Selection Totals
3
0.4%
0.4%
12
2.5%
8
1.7%
18
12
1.6%
8
1.1%
19
3.7%
1 10.0%
Report includes residential transactions only
2.6%
13
2.7%
2 20.0% 15
2.0%
%
%
%
%
%
$1,000+ #
%
Total #
8
3.2%
43 17.3%
56 22.6%
113 45.6%
27 10.9%
1
0.4%
248
28
5.8%
39
8.1%
72 14.9%
209 43.3%
63 13.0%
19
3.9%
483
2 20.0%
2 20.0%
1 10.0%
82
11.1%
130 17.5%
324 43.7%
91 12.3%
20
2.7%
741
1 10.0% 37
5.0%
Public Record Data Analysis (November 2020) Copyright Metrostudy
10
Transactions by Lot Size Postal City - Happy Valley Date Range: 11/1/2019 - 10/31/2020
N/A Transaction Type New
#
% 54 32.0%
Regular Resale
#
%
9.2%
%
#
10,00014,999 %
#
%
21 12.4%
41 24.3%
26
54 13.4%
141 34.9%
82 20.3%
2 50.0%
1 25.0%
1 25.0%
6.4%
REO Sale 54
#
7,0009,999
44 26.0%
Foreclosure
Selection Totals
5,0006,999
< 4,999
70 12.0%
Report includes single family home transactions only
2 25.0%
4 50.0%
79 13.5%
187 32.0%
8
4.7%
15,00029,999 #
% 1
30,00049,999 #
%
50,00099,999 #
%
150,000199,999
200,000+
#
#
#
%
%
%
0.6%
56 13.9%
Total # 169
31
7.7%
6
1.5%
6
1.5%
2
0.5%
404 4
1 12.5% 91 15.6%
100,000149,999
58
9.9%
1 12.5% 31
5.3%
Public Record Data Analysis (November 2020) Copyright Metrostudy
6
1.0%
7
1.2%
8 0
0.0%
2
0.3%
585
Transactions by Time Period Postal City - Happy Valley Three Years Ago 11/1/16 - 10/31/17 Transaction Type New Regular Resale
Count
Med $ Val
$/SF
Two Years Ago 11/1/17 - 10/31/18 MedLotSF Count
Med $ Val % Chg
$/SF
One Year Ago 11/1/18 - 10/31/19 MedLotSF Count
Med $ Val % Chg
$/SF
Current Period 11/1/19 - 10/31/20 MedLotSF Count
Med $ Val % Chg Med SF
Total $/SF
MedLotSF
Count
75
$459,995
$177
4,896
88
$616,959
34.1%
$200
7,005
90
$569,162
-7.7%
$206
6,377
248
$513,510
-9.8%
2,492
$204
6,003
501
$181
9,583
493
$482,000
0.0%
$190
8,677
500
$510,000
5.8%
$192
8,646
483
$535,000
4.9%
2,864
$199
8,706
1,986
8,213
22
n/a
8,124
9
n/a
7,021
4
n/a
6,662
60
510
$482,000
Foreclosure
25
n/a
REO Sale
26
$500,000
$153
9,020
26
$499,494
-0.1%
$157
9,561
20
$536,638
7.4%
$138
7,538
10
$408,450
-23.9%
2,433
$151
8,619
82
636
$480,000
$180
9,121
629
$495,000
3.1%
$190
8,433
619
$525,580
6.2%
$194
8,206
745
$525,000
-0.1%
2,854
$199
7,955
2,629
Selection Totals
Report includes residential transactions only
Public Record Data Analysis (November 2020) Copyright Metrostudy
3,148
Transactions by Product Attributes Postal City - Happy Valley Date Range: 11/1/2019 - 10/31/2020
Bedrooms Transaction Type New
Regular Resale REO Sale Selection Totals
n/a
Bathrooms
1
2
3
4+
0.0%
0.0%
n/a
Square Footage
<2
2
2.5
3
3.5+
n/a
0.0% 100.0%
0.0%
0.0%
0.0%
0.0%
0.0% 100.0%
<1,000
1,0001,499
1,5001,999
2,0002,499
2,5002,999
3,0003,499
3,5003,999
4,000+
0.0%
0.0%
0.0%
0.0%
0.0%
0.0%
0.0%
0.0%
Attached
100.0%
0.0%
Detached
91.7%
0.0%
0.0%
3.6%
4.7%
91.7%
0.6%
0.6%
5.3%
1.2%
0.6%
91.7%
0.0%
0.0%
0.6%
4.1%
1.8%
1.2%
0.0%
0.6%
Attached
7.7%
4.6%
30.8%
53.8%
3.1%
6.2%
9.2%
23.1%
56.9%
0.0%
4.6%
0.0%
12.3%
27.7%
52.3%
7.7%
0.0%
0.0%
0.0%
0.0%
Detached
5.7%
0.0%
2.2%
35.9%
56.2%
3.2%
3.2%
10.1%
41.6%
17.8%
24.0%
3.2%
0.5%
3.2%
8.2%
15.8%
19.8%
21.3%
11.4%
16.6%
Detached
12.5%
0.0%
12.5%
37.5%
37.5%
0.0%
25.0%
0.0%
50.0%
0.0%
25.0%
0.0%
12.5%
0.0%
0.0%
50.0%
0.0%
0.0%
12.5%
25.0%
Attached
43.4%
2.8%
18.9%
33.0%
1.9%
42.5%
5.7%
14.2%
34.9%
2.8%
2.8%
38.7%
7.5%
17.0%
32.1%
4.7%
0.0%
0.0%
0.0%
0.0%
Detached
30.8%
0.0%
1.7%
26.5%
41.0%
28.9%
2.8%
7.2%
31.2%
17.2%
17.2%
28.9%
0.5%
2.2%
5.9%
12.9%
14.3%
15.1%
8.1%
12.0%
Total
32.8%
0.4%
4.4%
27.5%
34.9%
31.0%
3.2%
8.3%
31.7%
10.8%
15.0%
30.4%
1.6%
4.5%
9.9%
11.6%
12.1%
12.8%
6.8%
10.2%
Report includes attached and detached residential transactions only
Public Record Data Analysis (November 2020) Copyright Metrostudy