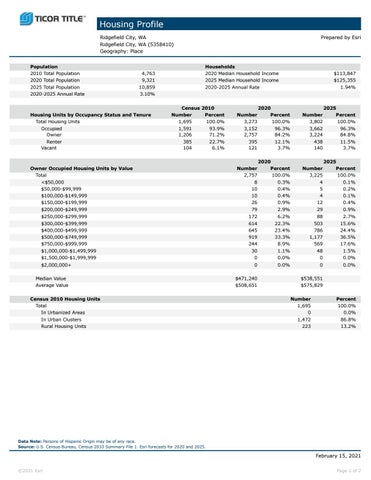
Housing Profile Ridgefield City, WA Ridgefield City, WA (5358410) Geography: Place Population 2010 Total Population 2020 Total Population 2025 Total Population 2020-2025 Annual Rate
4,763 9,321 10,859 3.10%
Housing Units by Occupancy Status and Tenure Total Housing Units Occupied Owner Renter Vacant
Prepared by Esri
Households 2020 Median Household Income 2025 Median Household Income 2020-2025 Annual Rate
Census 2010 Number Percent 1,695 100.0% 1,591 93.9% 1,206 71.2% 385 22.7% 104 6.1%
Owner Occupied Housing Units by Value Total <$50,000 $50,000-$99,999 $100,000-$149,999 $150,000-$199,999 $200,000-$249,999 $250,000-$299,999 $300,000-$399,999 $400,000-$499,999 $500,000-$749,999 $750,000-$999,999 $1,000,000-$1,499,999 $1,500,000-$1,999,999 $2,000,000+ Median Value Average Value Census 2010 Housing Units Total In Urbanized Areas In Urban Clusters Rural Housing Units
$113,847 $125,355 1.94%
Number 3,273 3,152 2,757 395 121
2020 Percent 100.0% 96.3% 84.2% 12.1% 3.7%
Number 3,802 3,662 3,224 438 140
2025 Percent 100.0% 96.3% 84.8% 11.5% 3.7%
Number 2,757 8 10 10 26 79
2020 Percent 100.0% 0.3% 0.4% 0.4% 0.9% 2.9%
Number 3,225 4 5 4 12 29
2025 Percent 100.0% 0.1% 0.2% 0.1% 0.4% 0.9%
172 614 645 919 244 30 0
6.2% 22.3% 23.4% 33.3% 8.9% 1.1% 0.0%
88 503 786 1,177 569 48 0
2.7% 15.6% 24.4% 36.5% 17.6% 1.5% 0.0%
0
0.0%
0
0.0%
$471,240 $508,651
$538,551 $575,829 Number 1,695 0 1,472 223
Percent 100.0% 0.0% 86.8% 13.2%
Data Note: Persons of Hispanic Origin may be of any race. Source: U.S. Census Bureau, Census 2010 Summary File 1. Esri forecasts for 2020 and 2025.
February 15, 2021 ©2021 Esri
Page 1 of 2