4 minute read
Solutions to Exercises in Introduction to Economic Growth

(Third Edition)
Charles I. Jones
Advertisement
Stanford GSB
Dietrich Vollrath
University of Houston
(with Chao Wei and Jesse Czelusta)
1 Introduction
No exercises.
2 The Solow Model
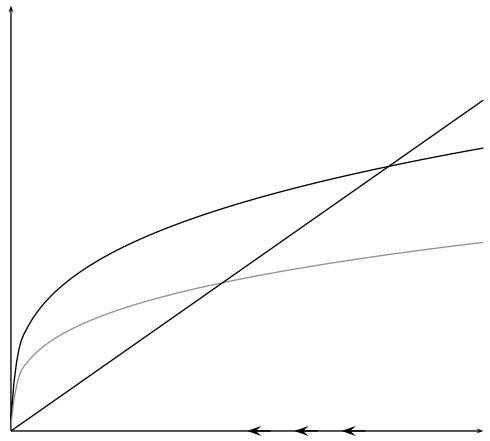
Exercise 1. A decrease in the investment rate.
A decrease in the investment rate causes the sy curve to shift down: at any given level ofk, the investment-technology ratio is lower at the new rate of saving/investment. Assuming the economy began in steady state, the capital-technology ratio is now higher than is consistent with the reduced saving rate, so it declines gradually, as shown in Figure 1.
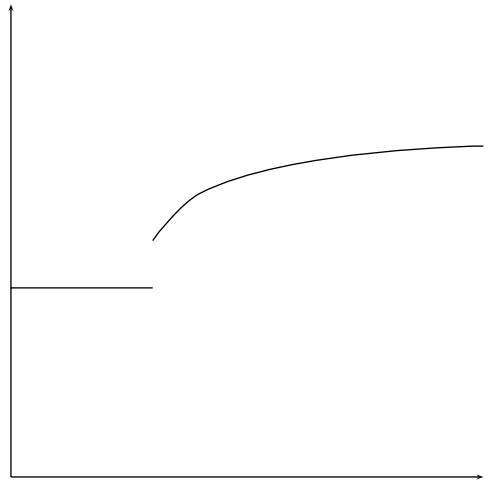
The log of output per worker y evolves as in Figure 2, and the dynamics of the growth rate are shown in Figure 3. Recall that log y = α logk and (
+ g + δ).
The policy permanently reduces the level of output per worker, but the growth rate per worker is only temporarily reduced and will return to g in the long run.
Exercise 2. An increase in the labor force.
The key to this question is to recognize that the initial outcome of a sudden increase in the labor force is to reduce the capital-labor ratio since k ≡ K/L and K is fixed at a moment in time. Assuming the economy was in steady state prior to the increase in labor force, k falls from k∗to some new level k1. Notice that this is a movement along the sy and (n + δ)k curves rather than a shift ofeither schedule: bothcurves are plotted as functions of k, so that a change in k is a movement along the curves. (For this reason, it is somewhat tricky to put this question first!)
At k1, sy > (n + δ)k1, so that k > 0, and the economy evolves according to the usual Solow dynamics, as shown in Figure 4.
In the short run, per capita output and capital drop in response to an enlarged flow of workers. Then these two variables start to grow (at a decreasing rate), until in the long run, the per capita capital returns to the original level, k∗
Exercise 3. An income tax.
Assume that the government throws away the resources it receives in taxes. This would mean that an income tax reduces the total amount available for investing and shifts the investment curve down as shown in Figure 5.
The tax policy permanently reduces the level of output per worker, but the growth rate per worker is onlytemporarilylowered. Notice that this experiment has basically the same results as that in Exercise 2.
For further thought: what happens if, instead of throwing away the resources it collects, the government uses all of its tax revenue to undertake investment?
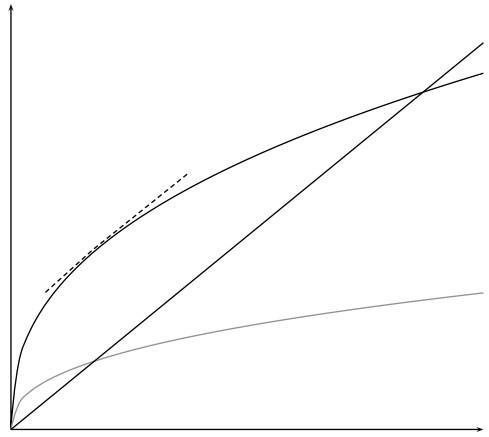
Exercise 4. Manna falls faster.
Figure
Figure 6 shows the Solow diagram for this question. It turns out, however, that it’s easier to answer this question using the transition dynamics version of the diagram, as shown in Figure 7. When g rises to g ′ , steady-state growth rate.
˜ k/k turns negative and A/A = g ′ , the new
To see what this implies about the growth rate of y, recall that
˜ y y A˙ k˜ y = y + A = αk
+g ′
In order to determine what happens to the growth rate of y at the moment of change in g, we have to determine what happens to ˜ k/k at that moment. As can be seen in Figure 7, or by algebra, this growth rate falls to g − g ′ < 0. It is the negative of the difference between the two horizontal lines.
Substituting into the equation above, we see that y/y immediately after the increase in g (suppose this occurs at time t = 0) is given by y y = α(g − g ′ ) + g ′ = (1 − α)g ′ + αg > 0. t=0
Notice that this value, which is a weighted average of g ′ and g, is strictly less than g ′ .
After time t = 0, y/y rises up to g ′ (which can be seen by looking at the dynamics implied by Figure 6). Therefore, we know that the dynamics of the growth rate of output per worker look like those shown in Figure 8.
Exercise 5. Can we save too much?
From the standard Solow model, we know that steady-state output per capita is given by y∗= (sn +δ 1 α . Steady-state consumption per worker is (1 − s)y∗or
From this expression, we see that an increase in the saving rate has two effects. First, it increases steady-state output per worker and, therefore, tends to increase consumption. Second, it reduces the amount of output that gets consumed.
To maximize c∗ , we take the derivative of this expression with respect to s and set it equal to zero:
Rearrange the equation, and we have therefore
The saving rate which maximizes the steady-state consumption equals α
Now turn to the marginal product of capital, M P K. Given the production function y = kα, the marginal product of capital is αkα−1. Evaluated at the steady-state value k∗ , MPK = α(k∗)(α−1) = α (n+δ
When the saving rate is set to maximize consumption per person, s∗ = α, the marginal product of capital is MPK∗= n + δ.
That is, the steady-state marginal product of capital equals n + δ when consumption per person is maximized. Alternatively, this expression suggests that the net marginal product of capital - i.e. the marginal product of capital net of depreciation - is equal to the population growth rate. This relationship is shown in Figure 9.
9: Can We Save Too Much?
If s > α, then steady-state consumption could be increased by reducing the saving rate. This result is related to the diminishing returns associated with capital accumulation. The higher the saving rate, the lower the marginal product of capital. The marginal product of capital is the return to investing - if you invest one unit of output, how much do you get back? The intuition is clearest if we set n = 0 for the moment. Then, the condition says that the marginal product of capital should equal the rate of depreciation, or the net return to capital should be zero. If the marginal product of capital falls below the rate of depreciation, then you are getting back less than you put in: therefore, you are investing too much.
