5 minute read
Weather-Related Insurance Claims for Special Events


Weather-Related Insurance Claims for Special Events Matthew J. Bunkers, Ph.D., CCM Northern Plains Weather Services www.npweather.com
This article presents two examples where insurance was purchased to protect against weather-related losses in attendance for fund-raising events.
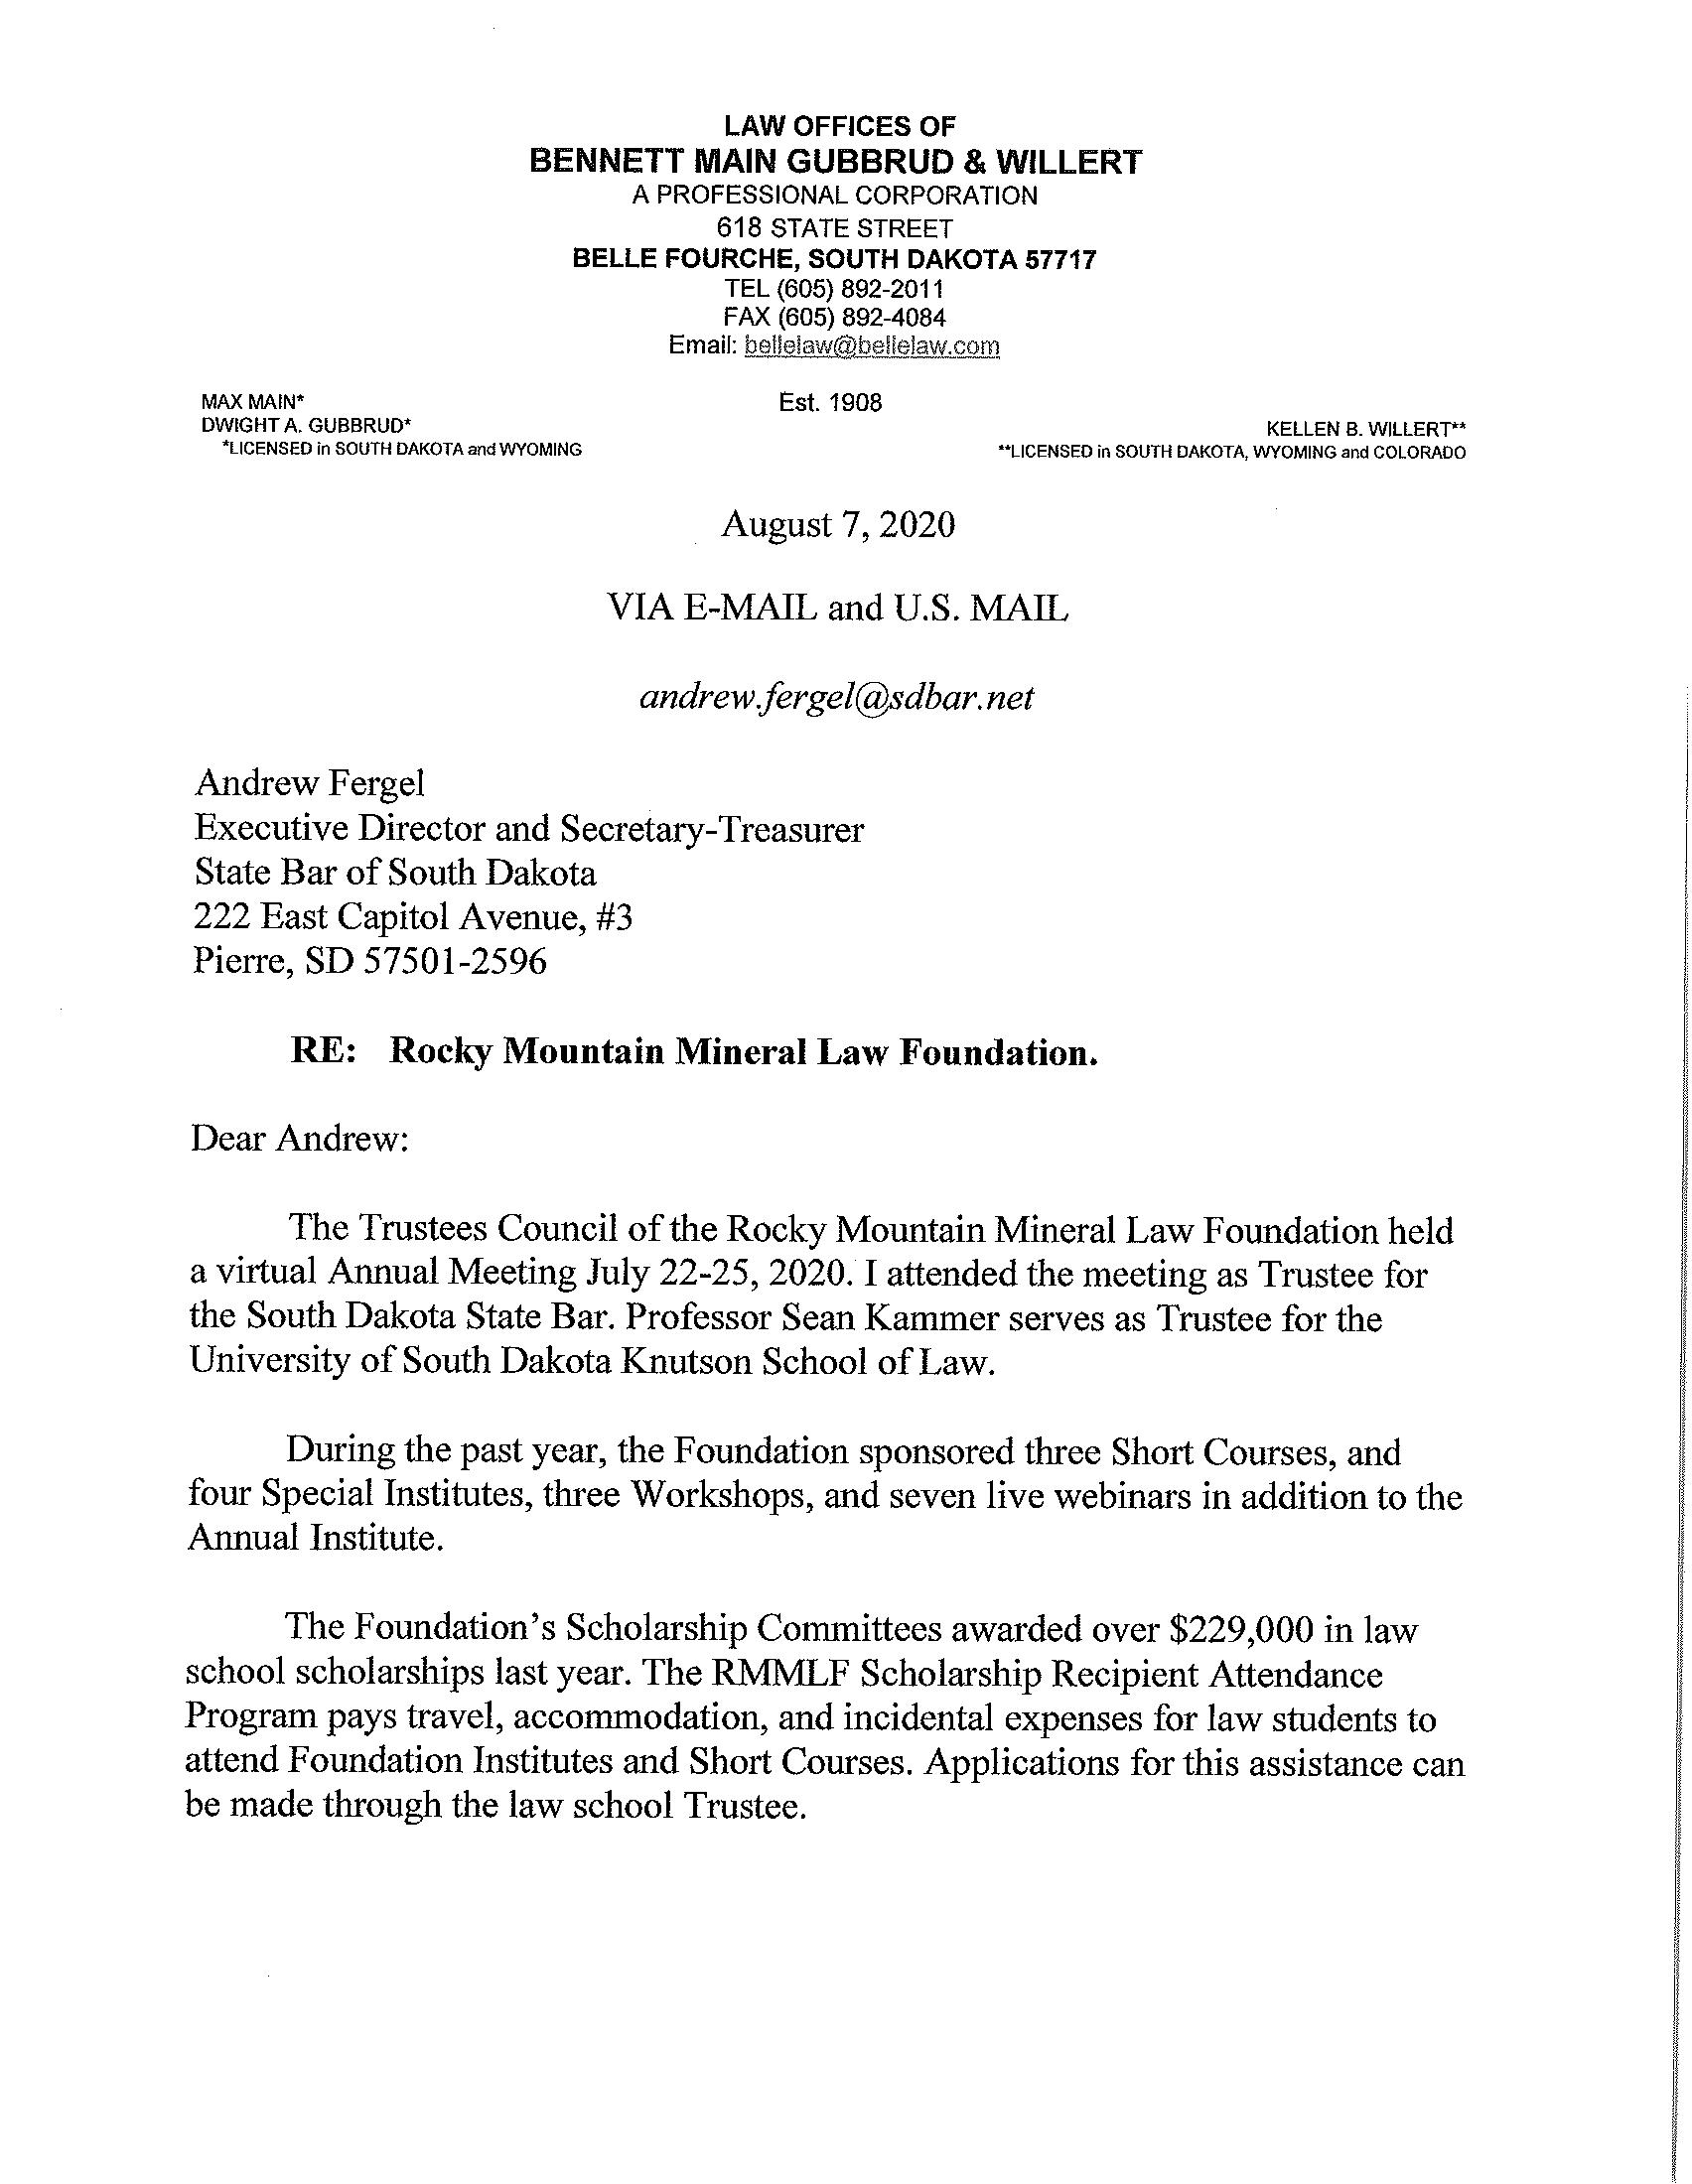
In the first example, insurance was purchased to protect against losses in attendance for a winter event. For an insurance payment to be made, at least 5 inches of snow was required to fall in a 12-hour period for a specific date during the winter of 2018–2019 near Valley City, North Dakota. The analysis by the insurance company’s meteorologists was that only 4.6 inches fell at the venue during the 12-hour period; therefore, payment of the claim was denied. Based on this decision, Northern Plains Weather Services was retained to do an independent analysis of the snowfall. The first step was to assess snowfall for the sites around Valley City (Fig. 1). The storm-total 7.5-inch snowfall report closest to the venue was the lowest of the four reports in the area. Upon further examination, this was The main challenge in this case was determining Collectively, these methods showed a 67% likelihood that snowfall was 5 inches or greater during the time of interest; accounting for the questionable public report indicated an 80% likelihood. After considering other factors such as the snow-to-liquid ratio and how that changed with time, there was very high confidence (up to at least 90%) that at least 5 inches of snow fell at the venue during the insured period. Based on this new information, the insurance company ultimately decided to pay the
a “public” report, and not from a trained observer, Figure 1. Snowfall (inches, in yellow) for the winter and thus should not be weighted as strongly as the 2018–2019 event at the four sites with available data other three reports. relatively close to the venue (red). White plus signs claim. denote the locations of the sites. how much of the snow fell in the 12-hour insurance The second example was like the first, but instead window (it snowed for a total of 16.17 hours at the the insurance was based on at least 0.25 inches of venue). In order to do this, five methods were used rain falling at the venue in a 12-hour period during to calculate the percentage of snow that fell in the an event in the summer of 2018. The insurance 12-hour window. The first method simply took the company’s meteorologists estimated that 0.14 inches percentage of time that it snowed during the 12-hour of rain fell at the venue during the 12-hour period; period compared to the total time it snowed (68%). therefore, payment of the claim was denied. Their This was multiplied by three different interpolated analysis was based on an algorithm that combines snowfall estimates at the venue, and all three radar and observer information into a 1 km x 1 km indicated snowfall of > 5 inches. The other methods gridded product, and thus can result in smoothing relied on radar-based reflectivity and precipitation of observations. 28
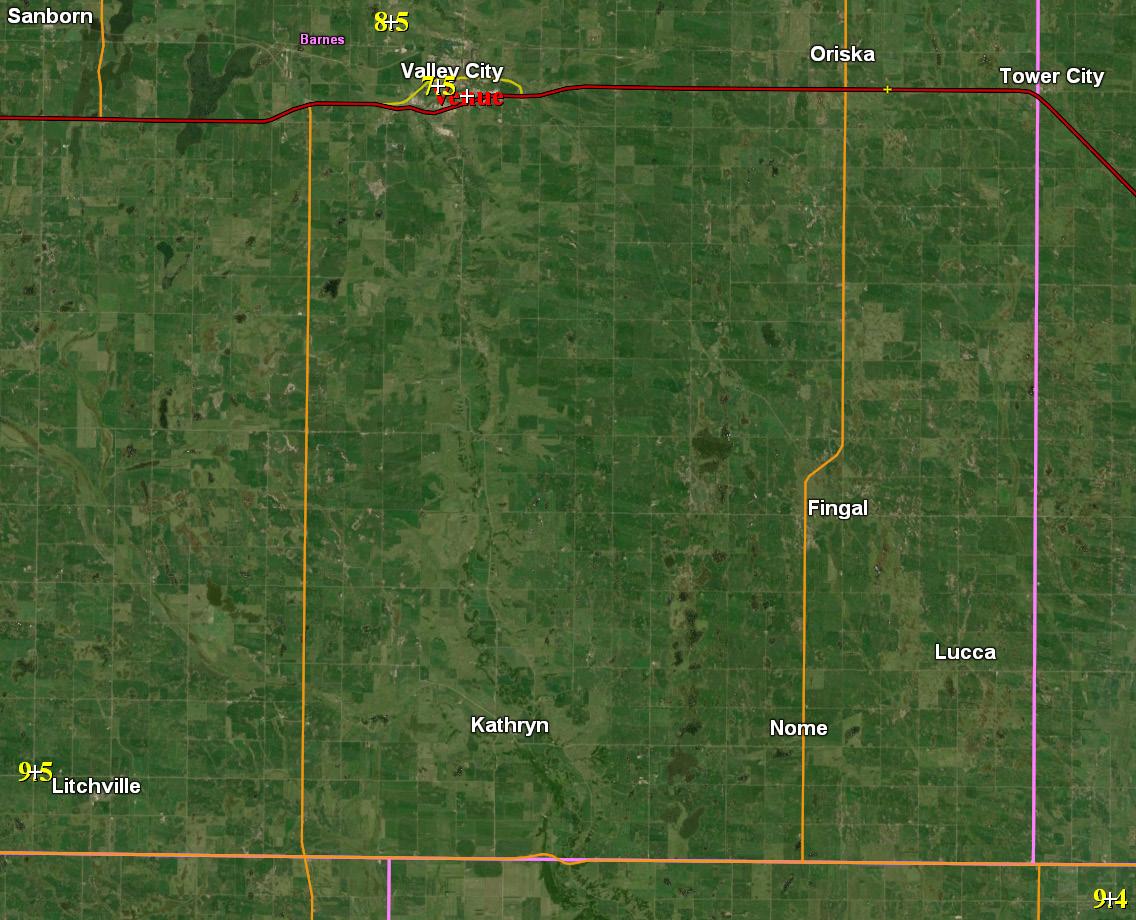
Based on this decision, Northern Plains Weather Services was retained to do an independent analysis of the rainfall. The first step was to assess the radarestimated storm-total precipitation. Fortunately, all of the rain fell within the required 12-hour window, so no estimates had to be made in that regard. However, the venue was located in-between observing stations (Fig. 2); therefore, interpolation was required to arrive at a rainfall estimate for the venue. At first glance, it is apparent that the venue was very close to the axis of heaviest rainfall (cf. yellow plus sign and red line in Fig. 2); locations along this line had at least 0.25 inches of rain, such as the Millard Airport (orange plus sign). Upon further examination of the radar as well as a comparison to the observed rainfall reports, a low bias in the analysis was inappropriately reducing the rainfall estimate at the venue based on the observed rainfall reports, and agreed that the radar analysis suggested rainfall should have been higher. Ultimately, they arrived at an estimate of 0.26 inches, and agreed to


pay the insurance claim. radar-based rainfall estimates was found for some Figure 2. One-hour precipitation estimation from of the sites, which is not uncommon at close range the Omaha, NE, National Weather Service radar to the radar (as in this case). Finally, the radar never using the dual-polarization algorithm. Values ≥ sampled the heaviest part of the storm as it moved 0.10 inches are shaded blue. The venue is indicated over the venue. The end result was 80% confidence with a yellow plus sign and the Millard Airport is that the rainfall at the venue was at least 0.25 inches. indicated with an orange plus sign (with 0.27 inches of rain). The very light green-colored numbers are The insurance company had its meteorologists Community Collaborative Rain, Hail, and Snow reevaluate the rainfall estimate based on this new (CoCoRaHS) network rainfall reports, while the information. They noted that their smoothed cyan-colored numbers are from citizen weather observers from the Weather
Dr. Matthew Bunkers of Northern Plains Weather Services is a certified Northern Plains Weather Services Underground. The red line is the axis of heaviest rainfall. consulting meteorologist (CCM) and forensic meteorologist with over 25 years of weather analysis and forecasting experience. He can provide reports, In summary, a consulting depositions, and testimony in the areas of weather and forecasting, severe summer and winter storms, rain and snow estimates, fire weather, flooding, meteorologist can dig deeper applied climatology and meteorology, agriculture meteorology, and statistics. into insurance-related claims
More information is provided at http://npweather.com nrnplnsweather@gmail.com or 605.390.7243. . Contact Matt at like these, and thus provide a better picture of the weather at the time of the event, which may reveal things that the insurance company’s weather provider did not consider.