
Hawaii, September 2023
Luxury Market Report
OAHU | HAWAII ISLAND | MAUI | KAUAI
About Corcoran Pacific Properties

Corcoran Pacific Properties, the exclusive Hawaii franchisee of The Corcoran Group, is a locally owned and operated company, founded in 2005 with a simple philosophy: treating every client as a friend, and every transaction as if it was our own.
Over the past 17+ years, honoring this philosophy, we established a culture of service and efficiency fueled by high-tech, smart investments in agents, and the tools they need to deliver world-class service while helping clients achieve their real estate goals.
By choosing only the most successful, experienced real estate professionals and dedicating every resource to support their success, we’ve grown to be the brokerage of choice serving Kauai, Oahu, Maui and Hawaii Island.
With our clients at the heart of our business, Corcoran Pacific Properties is dedicated to excellence, innovation and to continuously raising the bar when it comes to impeccable service, expert insight and a relationship-first approach.

©2020 Corcoran Pacific Properties. All rights reserved. Corcoran® and the Corcoran Logo are registered service marks owned by Corcoran Group LLC. Corcoran Pacific Properties fully supports the principles ofthe Fair Housing Act and the Equal Opportunity Act. Each franchise is independently owned and operated.
Kahala Office 4211 Waialae Ave. Suite 106 Honolulu, HI 96816 (800) 315-3898 Kailua Office 419-B Kuulei Rd. Kailua, HI 96816 (800) 315-3898 Mililani Office 95-1249 Meheula Parkway, Suite No. A-5 Mililani, HI 96789 (808) 589-2040 North Shore Office 66-590 Kamehameha Hwy, Unit 1 Haleiwa, HI 96712 (808) 589-2040 Wailea Office 34 Wailea Gateway Pl. Suite A-204 Kihei, HI 96753 (800) 315-3898 Lahaina Office 75 Kupuohi St. Suite 203 Lahaina, HI 96761 (800) 315-3898 Koloa Office 3417 Poipu Rd. Suite 110B Koloa, HI 96756 (800) 315-3898 Princeville Office 5-4280 Kuhio Hwy. Suite B-103 Princeville, HI 96722 (800) 315-3898 Hilo Office 64 Keawe St. Suite 203 Hilo, HI 96720 (800) 315-3898 Kona Office Walua Professional Bldg. 75-5905 Walua Rd. Suite 9 Kailua-Kona, HI 96740 (800) 315-3898 Mauna Lani Portfolio Mauna Lani Auberge Resort 68-1400 Mauna Lani Dr, Suite 108 Waimea, HI 96743 (800) 315-3898 Waimea Office 65-1291 Kawaihae Rd. Suite 101 C Kamuela, HI 96743 (800) 315-3898 At Corcoran Pacific Properties, we dream big. We know that luxury is not a price point, but an experience. Through our commitment to providing first-class support for our 200+ award-winning real estate professionals, we deliver a distinctive and authentic experience to our agents, employees and clients, helping people find the lifestyle they seek. Gregg Antonsen SVP, Luxury Sales gregg.antonsen@corcoranpacific.com OAHU OFFICES MAUI OFFICES KAUAI OFFICES HAWAII ISLAND OFFICES
Table of Contents
Page 5 Luxury Report Explained
Page 6 Welcome Message
Page 7 Support for Maui Wildfire Relief
Page 8-13 Oahu Market Review
Page 14-19 Island of Hawaii Market Review

Page 20-25 Maui Market Review
Page 26-31 Kauai Market Review
Page 33-36 North American Luxury Market Review
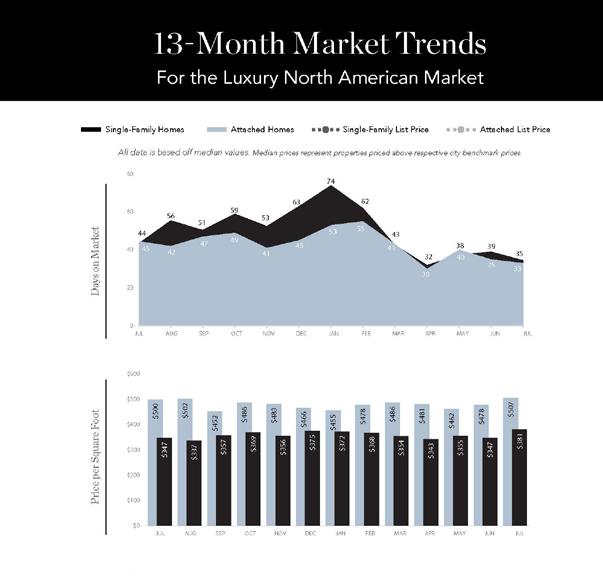
Page 37 13-Month Market Trends
Page 38 Single-Family Homes Monthly Overview
Page 39 Attached Homes Monthly Overview
Page 48 Thank You!
Luxury Report Explained
The Institute for Luxury Home Marketing has analyzed a number of metrics — including sales prices, sales volumes, number of sales, sales-price-to-list-price ratios, days on market and price-per-squarefoot – to provide you a comprehensive North American Luxury Market report.
Additionally, we have further examined all of the individual luxury markets to provide both an overview and an in-depth analysis - including, where data is sufficient, a breakdown by luxury single-family homes and luxury attached homes.
It is our intention to include additional luxury markets on a continual basis. If your market is not featured, please contact us so we can implement the necessary qualification process. More indepth reports on the luxury communities in your market are available as well.
Looking through this report, you will notice three distinct market statuses, Buyer's Market, Seller's Market, and Balanced Market. A Buyer's Market indicates that buyers have greater control over the price point. This market type is demonstrated by a substantial number of homes on the market and few sales, suggesting demand for residential properties is slow for that market and/ or price point.
By contrast, a Seller's Market gives sellers greater control over the price point. Typically, this means there are few homes on the market and a generous demand, causing competition between buyers who ultimately drive sales prices higher.
A Balanced Market indicates that neither the buyers nor the sellers control the price point at which that property will sell and that there is neither a glut nor a lack of inventory. Typically, this type of market sees a stabilization of both the list and sold price, the length of time the property is on the market as well as the expectancy amongst homeowners in their respective communities – so long as their home is priced in accordance with the current market value.
Report Glossary
REMAINING INVENTORY: The total number of homes available at the close of a month.
DAYS ON MARKET: Measures the number of days a home is available on the market before a purchase offer is accepted.
LUXURY BENCHMARK PRICE: The price point that marks the transition from traditional homes to luxury homes.
NEW LISTINGS: The number of homes that entered the market during the current month.
PRICE PER SQUARE FOOT: Measures the dollar amount of the home's price for an individual square foot.
SALES RATIO: Sales Ratio defines market speed and determines whether the market currently favors buyers or sellers. Buyer's Market = up to 14%; Balanced Market = 15 to 20%; Seller's Market = 21% plus. If >100%, sales from previous month exceed current inventory.
SP/LP RATIO: The Sales Price/List Price Ratio compares the value of the sold price to the value of the list price.
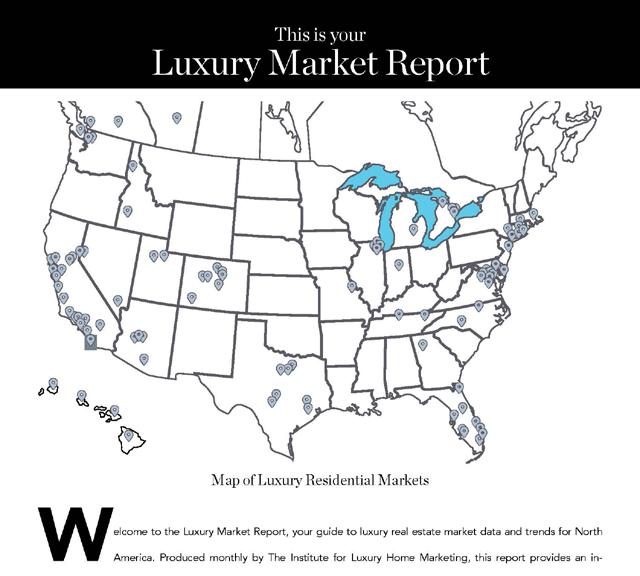
Map of Luxury Residential Markets
Welcome to the Luxury Market Report, your guide to luxury real estate market data and trends for North America. Produced monthly by The Institute for Luxury Home Marketing, this report provides an in-depth look at the top residential markets across the United States and Canada. Within the individual markets, you will find established luxury benchmark prices and detailed survey of luxury active and sold properties designed to showcase current market status and recent trends. The national report illustrates a compilation of the top North American markets to review overall standards and trends.
This is your
©
Institute
Marketing
The Luxury Market Report is a monthly analysis
Luxury
Institute. This active and sold
been
Luxury Market Report Copyright
2020
for Luxury Home
| www.luxuryhomemarketing.com | 214.485.3000
provided by The Institute for Luxury Home Marketing.
benchmark prices are determined by The
data has
compiled by various sources, including local MLS boards, local tax records and Realtor.com. Data is deemed reliable to the best of our knowledge, but is not guaranteed.
Hawaii Luxury Market Review
Corcoran Pacific Properties is pleased to present a closer look at the luxury real estate market in Hawaii, which includes detailed statistical analysis for your in-depth review on Oahu, the Island of Hawaii, Maui and Kauai for August 2023.


At first glance, affluent buyers looking to purchase a luxury property in Hawaii will find that the overall market seems to have changed very little when we compare the data year-over-year at the end of August; in terms of total sales, inventory and price point for both the single-family and attached property market.
In August 2022 there was a total of 104 sales of luxury single-family homes, and in 2023 there are 103, for attached properties there were 144 sales in 2022 and in 2023 only 7% less at 134, across all the islands.
The median price also varies little moving just 3% downwards from $2,199,375 in August 2022, to $2,133,750 in 2023 for single-family homes and its almost on par at $1,405,313 in 2022 and $1,406,875 in 2023.
Equally, inventory has only increased by 5% for single-family (490 to 516) and stayed on par for attached (556 to 557) when comparing the August statistics.
But, as always there is more to this story. When we dive into the individual islands, we find quite the disparity between islands as well as between property types.
For instance, Oahu saw a 22% (55 to 43) decline in sales for luxury single-family homes, whereas on the Big Island sales rose a massive 124% (17 to 38). The answer to why there are such diverse results is likely due to the number of listings available; Oahu’s inventory levels only climbed 2% (196 to 199), whereas listings on the Big Island grew 44% (112 to 161), thereby providing greater opportunity for buyers.
Conversely, In the attached property market, Oahu saw sales at par (85 to 84) year-over-year and only a 13% (383 to 432) increase in inventory, whereas Kauai saw a 60% (15 to 6) decline in sales and an equally large fall in inventory of 57% (42 to 18).
The variances across these individual islands, property types and price points show that while the overall luxury market in Hawaii remains balanced (where neither the seller nor the buyer has dominance over the other), that demand and supply at the local level are starting to change and having a more dynamic impact.
As in all markets, there are always opportunities and challenges for buyers and sellers for certain property locations, types and price points. It is important to work closely with a real estate expert familiar with local trends as they are the best resource to navigate the specific and varied markets found within the Hawaiian Islands.

2023 September
Oahu Hawaii
19 2 4 8 11 13 11 10 14 22 23 10 17 22 13 1 1 2 0 1 4 2 3 2 5 5 4 4 5 4 $9,500,000+ $8,500,000 - $9,499,999 $7,500,000 - $8,499,999 $6,500,000 - $7,499,999 $5,500,000 - $6,499,999 $4,700,000 - $5,499,999 $4,100,000 - $4,699,999 $3,500,000 - $4,099,999 $3,100,000 - $3,499,999 $2,700,000 - $3,099,999 $2,300,000 - $2,699,999 $2,100,000 - $2,299,999 $1,900,000 - $2,099,999 $1,800,000 - $1,899,999 $1,750,000 - $1,799,999 Square Feet3 -RangePrice -Median SoldBeds -Median SoldBaths -Median SoldSold -TotalInventory -TotalSales Ratio -Sold/Inventory0 - 2,999 $1,972,500 4 3 18 69 26% 3,000 - 3,999 $2,746,500 4 3 14 45 31% 4,000 - 4,999 $3,925,000 5 4 5 26 19% 5,000 - 5,999 $4,675,000 5 5 2 22 9% 6,000 - 6,999 NA NA NA 0 14 0% 7,000+ $7,900,000 6 5 3 21 14% OAHU Single-Family Homes Inventory Sales Luxury Inventory vs. Sales | August 2023 Luxury Benchmark Price 1: $1,750,000 Seller’s Market 199 Total Inventory: 43 Total Sales: 22% Total Sales Ratio2: 1 The luxury threshold price is set by The Institute for Luxury Home Marketing. 2Sales Ratio defines market speed and market type: Buyer's < 14.5%; Balanced >= 14.5 to < 20.5%; Seller's >= 20.5% plus. If >100% MLS® data reported previous month’s sales exceeded current inventory.
13-Month Luxury Market Trend4
Median Data Review | August
6 % $823 $870
99.86% 100.00%
Oahu Market Summary | August 2023
• The Oahu single-family luxury market is a Seller's Market with a 22% Sales Ratio
• Homes sold for a median of 100.00% of list price in August 2023.
• The most active price band is $7,500,000-$8,499,999, where the sales ratio is 50%.
• The median luxury sales price for single-family homes is $2,675,000
0
Aug. 2022 Aug. 2023 Aug. 2022 Aug. 2023 Aug. 2022 Aug. 2023 Aug. 2022 Aug. 2023 Aug. 2022 Aug. 2023 Aug. 2022 Aug. 2023 OAHU
3Square foot table does not account for listings and solds where square foot data is not disclosed. 4Data reported includes Active and Sold properties and does not include Pending properties.
Single-Family Homes
Solds Median Sales Price Inventory
Total Inventory Total Solds Sales Price Days on Market Sale to List Price Ratio Sale Price Per SqFt.
196 195 207 223 203 181 173 175 193 188 187 193 199 55 37 24 36 33 11 36 38 29 35 43 31 43 $2,200,000 $2,300,000 $2,362,500 $2,343,750 $2,285,000 $2,300,000 $2,394,000 $2,357,500 $2,150,000 $2,500,000 $2,080,000 $2,325,000 $2,675,000 Aug-22 Sep-22 Oct-22 Nov-22 Dec-22 Jan-23 Feb-23 Mar-23 Apr-23 May-23 Jun-23 Jul-23 Aug-23
VARIANCE: 2 % 196 199 VARIANCE: - 22 % 55 43 VARIANCE: 22 % $2.20m $2.68m VARIANCE:
%
VARIANCE:
• The median days on market for August 2023 was 17 days, remaining the same from August 2022. VARIANCE:
17 17
0 %
Luxury Inventory vs. Sales | August 2023
12 2 9 6 6 11 17 24 26 41 67 40 49 81 41 1 1 1 0 0 1 1 1 5 4 7 16 15 18 13 $7,000,000+ $6,000,000 - $6,999,999 $5,200,000 - $5,999,999 $4,400,000 - $5,199,999 $3,800,000 - $4,399,999 $3,200,000 - $3,799,999 $2,600,000 - $3,199,999 $2,200,000 - $2,599,999 $1,800,000 - $2,199,999 $1,500,000 - $1,799,999 $1,200,000 - $1,499,999 $1,000,000 - $1,199,999 $900,000 - $999,999 $800,000 - $899,999 $750,000 - $799,999 Square Feet3 -RangePrice -Median SoldBeds -Median SoldBaths -Median SoldSold -TotalInventory -TotalSales Ratio -Sold/Inventory0 - 999 $947,013 1 1 26 149 17% 1,000 - 1,499 $960,000 2 2 39 166 23% 1,500 - 1,999 $835,000 3 2 9 62 15% 2,000 - 2,499 $3,750,000 3 3 5 32 16% 2,500 - 2,999 $1,241,500 3 2 4 8 50% 3,000+ $12,000,000 4 4 1 15 7% OAHU
Inventory Sales Luxury Benchmark Price 1: $750,000 Balanced Market 432 Total Inventory: 84 Total Sales: 19% Total Sales Ratio2: 1 The luxury threshold price is set by The Institute for Luxury Home Marketing. 2Sales Ratio defines market speed and market type: Buyer's < 14.5%; Balanced >= 14.5 to < 20.5%; Seller's >= 20.5% plus. If >100% MLS® data reported previous month’s sales exceeded current inventory.
Attached Homes
383 432
VARIANCE: 13 %
13-Month Luxury Market Trend4
$862 $931
VARIANCE: 8 %
Median Data Review | August
85 84
VARIANCE: - 1 %
99.25% 100.00%
VARIANCE: 1 %
Oahu Market Summary | August 2023
• The Oahu attached luxury market is a Balanced Market with a 19% Sales Ratio
• Homes sold for a median of 100.00% of list price in August 2023.
$905k $965k
VARIANCE: 7 %
18 25
VARIANCE: 39 %
• The most active price band is $6,000,000-$6,999,999, where the sales ratio is 50%.
• The median luxury sales price for attached homes is $965,000
• The median days on market for August 2023 was 25 days, up from 18 in August 2022.
3Square foot table does not account for listings and solds where square foot data is not disclosed. 4Data reported includes Active and Sold properties and does not include Pending properties.
Aug. 2022 Aug. 2023 Aug. 2022 Aug. 2023 Aug. 2022 Aug. 2023 Aug. 2022 Aug. 2023 Aug. 2022 Aug. 2023 Aug. 2022 Aug. 2023 OAHU Attached Homes Total Inventory Total Solds Sales Price Days on Market Sale to List Price Ratio Sale Price Per SqFt.
Solds Median Sales Price Inventory
383 391 421 459 451 460 460 457 465 440 431 454 432 85 107 119 60 62 50 58 103 91 79 91 88 84 $905,000 $900,000 $990,000 $937,500 $915,000 $987,500 $972,500 $1,000,000 $950,000 $900,000 $938,000 $989,477 $965,000 Aug-22 Sep-22 Oct-22 Nov-22 Dec-22 Jan-23 Feb-23 Mar-23 Apr-23 May-23 Jun-23 Jul-23 Aug-23
Single-Family Attached
Sales
OAHU
Activity
Metric Year $1-2 Million $2-3 Million $3-5 Million $5 Million+ $800K$1 Million $1 Million+ Closed Sales 2017 732 108 50 13 318 660 2018 794 86 46 27 282 352 2019 775 94 37 21 261 309 2020 931 115 57 27 183 188 2021 1,710 302 132 47 464 497 2022 1,765 232 110 54 530 510 2023 YTD 816 117 42 30 223 292 Median Sales Price (in millions) 2017 $1,250,000 $2,377,500 $3,525,000 $6,388,000 $875,000 $1,777,500 2018 $1,255,000 $2,372,500 $3,662,500 $7,200,000 $888,000 $1,550,000 2019 $1,250,000 $2,300,000 $3,688,000 $5,800,000 $890,000 $1,495,000 2020 $1,265,000 $2,325,000 $3,500,000 $6,800,000 $878,000 $1,325,000 2021 $1,270,000 $2,450,000 $3,600,000 $6,700,000 $875,000 $1,350,000 2022 $1,300,000 $2,368,750 $3,600,000 $6,575,000 $870,000 $1,355,000 2023 YTD $1,275,000 $2,385,000 $3,500,000 $7,275,000 $888,000 $1,377,500 Months Supply of Inventory 2017 4.7 9.8 13.3 40.2 5.1 5.9 2018 5.6 12.1 14.8 21.6 6.8 11.7 2019 5.6 12.9 18.6 36.0 8.3 11.6 2020 3.6 8.2 11.8 26.7 7.2 20.4 2021 1.9 3.2 4.9 13.2 2.8 6.0 2022 2.5 4..4 11.8 11.0 5.8 12.1 2023 YTD 2.3 3.6 5.3 6.5 4.1 7.1
Island of Hawaii
2023 September
ISLAND OF HAWAII
Luxury Inventory vs. Sales | August 2023
15 2 1 2 6 11 10 10 11 11 21 17 15 17 12 2 1 0 0 0 1 1 4 3 2 2 8 3 5 6 $9,000,000+ $7,800,000 - $8,999,999 $6,800,000 - $7,799,999 $5,800,000 - $6,799,999 $5,000,000 - $5,799,999 $4,200,000 - $4,999,999 $3,400,000 - $4,199,999 $2,800,000 - $3,399,999 $2,400,000 - $2,799,999 $2,000,000 - $2,399,999 $1,700,000 - $1,999,999 $1,400,000 - $1,699,999 $1,300,000 - $1,399,999 $1,200,000 - $1,299,999 $1,100,000 - $1,199,999 Square Feet3 -RangePrice -Median SoldBeds -Median SoldBaths -Median SoldSold -TotalInventory -TotalSales Ratio -Sold/Inventory0 - 1,499 $1,125,000 3 2 2 12 17% 1,500 - 1,999 $1,470,000 3 2 11 26 42% 2,000 - 2,499 $1,150,000 3 3 5 33 15% 2,500 - 2,999 $1,712,500 4 4 10 24 42% 3,000 - 3,499 $2,813,500 4 3 5 10 50% 3,500+ $7,995,000 5 5 5 53 9% 1 The luxury threshold price is set by The Institute for Luxury Home Marketing. 2Sales Ratio defines market speed and market type: Buyer's < 14.5%; Balanced >= 14.5 to < 20.5%; Seller's >= 20.5% plus. If >100% MLS® data reported previous month’s sales exceeded current inventory. Inventory Sales Luxury Benchmark Price 1: $1,100,000 Seller’s Market 161 Total Inventory: 38 Total Sales: 24% Total Sales Ratio2:
Single-Family Homes
ISLAND OF HAWAII
13-Month Luxury Market Trend4
Single-Family Homes
112 161 VARIANCE: 124 %
VARIANCE: 44 %
17 38
$1.80m $1.59m
VARIANCE: - 12 %
$770 $778
VARIANCE: 1 %
95.45% 97.46%
VARIANCE: 2 %
26 34
VARIANCE: 31 %
Island of Hawaii Market Summary | August 2023
• The Island of Hawaii single-family luxury market is a Seller's Market with a 24% Sales Ratio
• Homes sold for a median of 97.46% of list price in August 2023.
• The most active price band is $1,100,000-$1,199,999, where the sales ratio is 50%.
• The median luxury sales price for single-family homes is $1,587,500
• The median days on market for August 2023 was 34 days, up from 26 in August 2022.
3Square foot table does not account for listings and solds where square foot data is not disclosed. 4Data reported includes Active and Sold properties and does not include Pending properties.
Solds Median Sales Price Inventory Sales Price Days on Market Sale to List Price Ratio Sale Price Per SqFt. Aug. 2022 Aug. 2023 Aug. 2022 Aug. 2023 Aug. 2022 Aug. 2023 Aug. 2022 Aug. 2023 Aug. 2022 Aug. 2023 Aug. 2022 Aug. 2023 Total Inventory Total Solds Median Data Review
August 112 113 120 120 135 132 127 134 119 154 145 156 161 17 20 21 20 24 18 14 24 22 33 37 26 38 $1,800,000 $1,630,000 $1,525,000 $2,325,000 $1,427,500 $1,439,000 $1,800,000 $1,512,500 $1,666,600 $1,500,000 $1,550,000 $1,512,500 $1,587,500 Aug-22 Sep-22 Oct-22 Nov-22 Dec-22 Jan-23 Feb-23 Mar-23 Apr-23 May-23 Jun-23 Jul-23 Aug-23
|
9 1 1 1 1 2 0 3 0 0 2 1 2 1 1 2 0 1 0 1 3 0 0 0 2 0 1 2 1 4 $4,500,000+ $4,000,000 - $4,499,999 $3,500,000 - $3,999,999 $3,100,000 - $3,499,999 $2,700,000 - $3,099,999 $2,400,000 - $2,699,999 $2,100,000 - $2,399,999 $1,800,000 - $2,099,999 $1,600,000 - $1,799,999 $1,400,000 - $1,599,999 $1,300,000 - $1,399,999 $1,200,000 - $1,299,999 $1,100,000 - $1,199,999 $1,000,000 - $1,099,999 $950,000 - $999,999 Square Feet3 -RangePrice -Median SoldBeds -Median SoldBaths -Median SoldSold -TotalInventory -TotalSales Ratio -Sold/Inventory0 - 999 $1,767,500 2 2 2 3 67% 1,000 - 1,499 $1,139,750 2 2 8 5 160% 1,500 - 1,999 $1,289,500 3 2 2 7 29% 2,000 - 2,499 $2,700,000 3 3 3 3 100% 2,500 - 2,999 $5,500,000 3 3 2 4 50% 3,000+ NA NA NA 0 3 0%
Benchmark Price 1: $950,000 1 The luxury threshold price is set by The Institute for Luxury Home Marketing. 2Sales Ratio defines market speed and market type: Buyer's < 14.5%; Balanced >= 14.5 to < 20.5%; Seller's >= 20.5% plus. If >100% MLS® data reported previous month’s sales exceeded current inventory.
Homes Inventory Sales Seller’s Market 25 Total Inventory: 17 Total Sales: 68% Total Sales Ratio2:
Luxury
ISLAND OF HAWAII Attached
Luxury Inventory vs. Sales | August 2023
47 25
VARIANCE: - 47 %
13-Month Luxury Market Trend4
$767 $1,051
VARIANCE: 37 %
16 17
VARIANCE: 6 %
100.00% 100.00%
VARIANCE: 0 %
$1.48m $1.48m
VARIANCE: - 1 %
8 8
VARIANCE: 0 %
Island of Hawaii Market Summary | August 2023
• The Island of Hawaii attached luxury market is a Seller's Market with a 68% Sales Ratio
• Homes sold for a median of 100.00% of list price in August 2023.
• The most active price band is $950,000-$999,999, where the sales ratio is 400%.
• The median luxury sales price for attached homes is $1,475,000
• The median days on market for August 2023 was 8 days, remaining the same from August 2022.
3Square foot table does not account for listings and solds where square foot data is not disclosed.
4Data reported includes Active and Sold properties and does not include Pending properties.
ISLAND OF HAWAII Attached Homes
Solds Median Sales Price Inventory Aug. 2022 Aug. 2023 Aug. 2022 Aug. 2023 Aug. 2022 Aug. 2023 Aug. 2022 Aug. 2023 Aug. 2022 Aug. 2023 Aug. 2022 Aug. 2023 Sales Price Days on Market Sale to List Price Ratio Sale Price Per SqFt. Total Inventory Total Solds Median Data Review | August 47 52 51 51 63 72 60 67 50 43 28 21 25 16 14 7 13 11 10 12 17 15 13 19 14 17 $1,483,750 $1,342,500 $1,535,000 $1,217,000 $1,570,000 $1,262,500 $1,251,250 $1,198,000 $1,300,000 $1,575,000 $1,300,000 $2,397,500 $1,475,000 Aug-22 Sep-22 Oct-22 Nov-22 Dec-22 Jan-23 Feb-23 Mar-23 Apr-23 May-23 Jun-23 Jul-23 Aug-23
ISLAND OF HAWAII Sales Activity
Single-Family
Attached
Metric Year $1-2 Million $2-3 Million $3-5 Million $5 Million+ $800K$1 Million $1 Million+ Closed Sales 2017 95 24 11 29 42 89 2018 104 17 17 15 41 88 2019 131 21 7 27 48 79 2020 182 31 26 33 53 126 2021 247 59 45 70 125 236 2022 247 62 30 30 75 175 2023 YTD 154 33 14 19 39 100 Median Sales Price (in millions) 2017 $1,374,000 $2,424,000 $4,100,000 $7,950,000 $899,500 $1,600,000 2018 $1,349,000 $2,495,005 $3,950,000 $7,500,000 $880,000 $1,945,000 2019 $1,295,000 $2,500,000 $3,100,000 $7,725,000 $900,000 $1,450,000 2020 $1,295,000 $2,600,000 $3,999,500 $6,950,000 $905,000 $1,700,000 2021 $1,399,000 $2,450,000 $3,950,000 $8,450,000 $877,000 $1,592,500 2022 $1,293,000 $2,300,000 $3,525,000 $9,673,750 $892,500 $1,650,000 2023 YTD $1,300,000 $2,450,000 $3,750,000 $7,500,000 $900,000 $1,524,500 Months Supply of Inventory 2017 15.8 19.9 21.3 20.7 13.5 20.4 2018 14.8 17.5 20.2 19.9 9.6 12.9 2019 14.2 18.6 23.9 17.0 11.7 14.1 2020 9.8 13.5 14.0 15.2 5.1 7.1 2021 5.1 8.3 9.1 8.6 2.7 5.1 2022 3.3 6.4 25.0 25.0 4.6 5.3 2023 YTD 2.8 3.4 8.7 9.0 1.1 1.8
Maui Hawaii

2023
September
Luxury Inventory vs. Sales | August 2023
13 4 8 16 5 11 8 7 12 4 4 7 3 6 5 0 0 0 1 0 2 0 1 4 2 0 3 1 2 1 $12,000,000+ $9,900,000 - $11,999,999 $7,900,000 - $9,899,999 $5,900,000 - $7,899,999 $4,900,000 - $5,899,999 $3,900,000 - $4,899,999 $3,400,000 - $3,899,999 $2,900,000 - $3,399,999 $2,400,000 - $2,899,999 $2,200,000 - $2,399,999 $2,000,000 - $2,199,999 $1,800,000 - $1,999,999 $1,700,000 - $1,799,999 $1,600,000 - $1,699,999 $1,500,000 - $1,599,999 Square Feet3 -RangePrice -Median SoldBeds -Median SoldBaths -Median SoldSold -TotalInventory -TotalSales Ratio -Sold/Inventory0 - 1,999 $2,112,500 3 2 4 34 12% 2,000 - 2,999 $1,865,000 4 3 7 23 30% 3,000 - 3,999 $3,987,500 4 4 4 24 17% 4,000 - 4,999 $2,400,000 4 4 1 16 6% 5,000 - 5,999 $2,752,500 5 5 1 9 11% 6,000+ NA NA NA 0 7 0% MAUI Single-Family Homes Inventory Sales Luxury Benchmark Price 1: $1,500,000 Balanced Market 113 Total Inventory: 17 Total Sales: 15% Total Sales Ratio2: 1 The luxury threshold price is set by The Institute for Luxury Home Marketing. 2Sales Ratio defines market speed and market type: Buyer's < 14.5%; Balanced >= 14.5 to < 20.5%; Seller's >= 20.5% plus. If >100% MLS® data reported previous month’s sales exceeded current inventory.
13-Month Luxury Market Trend4
137 113 VARIANCE: - 35 %
VARIANCE: - 18 %
26 17 VARIANCE: 17 %
$1.95m $2.28m
VARIANCE: - 7 % $1,027 $950
97.00% 94.74%
VARIANCE: - 2 %
81 129
VARIANCE: 59 %
• The Maui single-family luxury market is a Balanced Market with a 15% Sales Ratio
• Homes sold for a median of 94.74% of list price in August 2023.
• The most active price band is $2,200,000-$2,399,999, where the sales ratio is 50%.
• The median luxury sales price for single-family homes is $2,275,000
• The median days on market for August 2023 was 129 days, up from 81 in August 2022.
Aug. 2022 Aug. 2023 Aug. 2022 Aug. 2023 Aug. 2022 Aug. 2023 Aug. 2022 Aug. 2023 Aug. 2022 Aug. 2023 Aug. 2022 Aug. 2023 MAUI Single-Family
Homes
Solds Median Sales Price Inventory 3Square foot table does not account for listings and solds where square foot data is not disclosed. 4Data reported includes Active and Sold properties and does not include Pending properties.
Total Inventory Total Solds Sales Price Days on Market Sale to List Price Ratio Sale Price Per SqFt. Median
137 138 139 136 145 152 148 154 144 150 150 161 113 26 13 21 15 14 20 11 18 11 29 22 21 17 $1,947,500 $2,558,000 $2,550,000 $1,810,000 $2,159,500 $2,718,802 $2,495,000 $2,431,500 $2,880,000 $3,244,136 $2,162,500 $2,600,000 $2,275,000 Aug-22 Sep-22 Oct-22 Nov-22 Dec-22 Jan-23 Feb-23 Mar-23 Apr-23 May-23 Jun-23 Jul-23 Aug-23
Maui Market Summary | August 2023
Data Review | August
Luxury Inventory vs. Sales | August 2023
16 6 2 5 4 4 5 6 5 2 2 5 5 12 7 3 3 0 2 1 0 0 2 4 2 3 1 1 3 2 $4,500,000+ $3,600,000 - $4,499,999 $3,100,000 - $3,599,999 $2,600,000 - $3,099,999 $2,400,000 - $2,599,999 $2,200,000 - $2,399,999 $2,000,000 - $2,199,999 $1,900,000 - $1,999,999 $1,800,000 - $1,899,999 $1,700,000 - $1,799,999 $1,600,000 - $1,699,999 $1,500,000 - $1,599,999 $1,400,000 - $1,499,999 $1,300,000 - $1,399,999 $1,200,000 - $1,299,999 Square Feet3 -RangePrice -Median SoldBeds -Median SoldBaths -Median SoldSold -TotalInventory -TotalSales Ratio -Sold/Inventory0 - 999 $1,600,000 2 2 7 25 28% 1,000 - 1,499 $1,700,000 2 2 11 28 39% 1,500 - 1,999 $2,600,000 2 2 5 13 38% 2,000 - 2,499 $5,299,500 3 3 2 9 22% 2,500 - 2,999 NA NA NA 0 10 0% 3,000+ $11,403,500 4 5 2 1 200%
Attached Homes Inventory Sales Luxury Benchmark Price 1: $1,200,000 1 The luxury threshold price is set by The Institute for Luxury Home Marketing. 2Sales Ratio defines market speed and market type: Buyer's < 14.5%; Balanced >= 14.5 to < 20.5%; Seller's >= 20.5% plus. If >100% MLS® data reported previous month’s sales exceeded current inventory. Seller’s Market 86 Total Inventory: 27 Total Sales: 31% Total Sales Ratio2:
MAUI
13-Month Luxury Market Trend4
Median Data Review | August
VARIANCE: 13 %
76 86 VARIANCE: - 4 %
28 27 VARIANCE: 11 %
$1.67m $1.85m
98.51% 98.18% VARIANCE: 4 % $1,522 $1,576
VARIANCE: 0 %
• The Maui attached luxury market is a Seller's Market with a 31% Sales Ratio
• Homes sold for a median of 98.18% of list price in August 2023.
97 94
VARIANCE: - 3 %
• The most active price band is $1,600,000-$1,699,999, where the sales ratio is 150%.
• The median luxury sales price for attached homes is $1,850,000
• The median days on market for August 2023 was 94 days, down from 97 in August 2022.
Aug. 2022 Aug. 2023 Aug. 2022 Aug. 2023 Aug. 2022 Aug. 2023 Aug. 2022 Aug. 2023 Aug. 2022 Aug. 2023 Aug. 2022 Aug. 2023 MAUI Attached Homes
Solds Median Sales Price Inventory 3Square foot table does not account for listings and solds where square foot data is not disclosed. 4Data reported includes Active and Sold properties and does not include Pending properties.
Total Inventory Total Solds Sales Price Days on Market Sale to List Price Ratio Sale Price Per SqFt.
76 61 61 78 87 91 97 91 82 82 84 96 86 28 21 20 25 15 9 18 22 25 24 37 18 27 $1,672,500 $1,900,000 $1,487,500 $1,595,000 $1,795,000 $2,400,000 $1,982,500 $2,150,000 $1,515,000 $1,562,500 $1,550,000 $1,512,500 $1,850,000 Aug-22 Sep-22 Oct-22 Nov-22 Dec-22 Jan-23 Feb-23 Mar-23 Apr-23 May-23 Jun-23 Jul-23 Aug-23
Maui Market Summary | August 2023
Single-Family Attached
Sales
MAUI
Activity
Metric Year $1-2 Million $2-3 Million $3-5 Million $5 Million+ $800K$1 Million $1 Million+ Closed Sales 2017 168 39 32 15 99 192 2018 190 31 30 13 120 285 2019 215 47 25 13 118 247 2020 218 51 34 11 140 273 2021 404 126 79 68 292 583 2022 409 98 55 41 238 489 2023 YTD 215 38 32 27 131 234 Median Sales Price (in millions) 2017 $1,265,000 $2,400,000 $3,600,000 $8,025,444 $900,000 $1,700,000 2018 $1,328,000 $2,285,000 $3,625,000 $9,250,000 $887,450 $1,440,000 2019 $1,270,000 $2,400,000 $3,270,000 $6,500,000 $864,875 $1,495,000 2020 $1,312,500 $2,390,000 $3,575,000 $6,400,000 $862,500 $1,685,000 2021 $1,300,000 $2,467,500 $3,800,000 $7,625,000 $880,000 $1,620,000 2022 $1,277,000 $2,212,500 $3,700,000 $7,700,000 $890,000 $1,495,000 2023 YTD $1,259,000 $2,400,000 $3,675,946 $7,500,000 $886,000 $1,500,000 Months Supply of Inventory 2017 12.9 15.8 19.5 19.9 14.2 21.4 2018 13.8 16.4 16.5 21.7 14.4 24.9 2019 12.3 16.5 19.3 24.9 13.6 25.8 2020 10.4 13.5 14.8 20.4 11.8 23.4 2021 5.4 7.5 8.8 14.2 7.3 14.2 2022 3.3 9.8 16.0 24.0 2.9 5.1 2023 YTD 2.0 4.0 8.0 45.0 1.1 2.8
Kauai Hawaii

2023
September
Luxury Inventory vs. Sales | August 2023
6 3 2 1 0 1 3 4 2 6 7 3 0 3 2 1 0 0 0 0 0 0 1 0 1 1 0 0 0 1 $6,000,000+ $5,400,000 - $5,999,999 $4,900,000 - $5,399,999 $4,400,000 - $4,899,999 $3,900,000 - $4,399,999 $3,400,000 - $3,899,999 $3,000,000 - $3,399,999 $2,600,000 - $2,999,999 $2,200,000 - $2,599,999 $1,800,000 - $2,199,999 $1,600,000 - $1,799,999 $1,500,000 - $1,599,999 $1,400,000 - $1,499,999 $1,300,000 - $1,399,999 $1,200,000 - $1,299,999 Beds3 -RangePrice -Median SoldDOM -Median SoldBaths -Median SoldSold -TotalInventory -TotalSales Ratio -Sold/Inventory0-1 Bedrooms NA NA NA 0 0 NA 2 Bedrooms NA NA NA 0 1 0% 3 Bedrooms $1,822,500 103 2 4 21 19% 4 Bedrooms $7,600,000 0 4 1 11 9% 5 Bedrooms NA NA NA 0 5 0% 6+ Bedrooms NA NA NA 0 4 0% KAUAI Single-Family Homes Inventory Sales Buyer’s Market 43 Total Inventory: 5 Total Sales: 12% Total Sales Ratio2 Luxury Benchmark Price 1: $1,200,000 1 The luxury threshold price is set by The Institute for Luxury Home Marketing. 2Sales Ratio defines market speed and market type: Buyer's < 14.5%; Balanced >= 14.5 to < 20.5%; Seller's >= 20.5% plus. If >100% MLS® data reported previous month’s sales exceeded current inventory.
45 43
VARIANCE: N/A N/A N/A
13-Month Luxury Market Trend4
Median Data Review | August
90.37% 100.00%
11 %
11 52
373 %
• The Kauai single-family luxury market is a Buyer's Market with a 12% Sales Ratio
• Homes sold for a median of 100.00% of list price in August 2023.
• The most active price band is $1,200,000-$1,299,999, where the sales ratio is 50%.
• The median luxury sales price for single-family homes is $1,995,000
• The median days on market for August 2023 was 52 days, up from 11 in August 2022.
Market Summary | August 2023 KAUAI
Homes
Kauai
Single-Family
Solds Median Sales Price Inventory Sales Price Days on Market Sale to List Price Ratio Sale Price Per SqFt. Aug. 2022 Aug. 2023 Aug. 2022 Aug. 2023 Aug. 2022 Aug. 2023 Aug. 2022 Aug. 2023 Aug. 2022 Aug. 2023 Aug. 2022 Aug. 2023 Total Inventory Total Solds 3Square foot table does not account for listings and solds where square foot data is not disclosed. 4Data reported includes Active and Sold properties and does not include Pending properties.
45 51 25 54 55 52 54 51 49 73 67 74 43 6 7 5 8 6 3 6 3 10 11 14 7 5 $2,850,000 $2,100,000 $1,800,000 $1,812,500 $1,629,504 $1,775,000 $2,132,223 $1,560,000 $2,200,000 $2,175,000 $2,200,000 $2,595,000 $1,995,000 Aug-22 Sep-22 Oct-22 Nov-22 Dec-22 Jan-23 Feb-23 Mar-23 Apr-23 May-23 Jun-23 Jul-23 Aug-23
VARIANCE: - 4 %
VARIANCE: - 17 % 6 5 VARIANCE: - 30 % $2.85m $2.00m
VARIANCE:
VARIANCE:
Luxury Inventory vs. Sales | August 2023
4 1 1 1 1 0 4 1 1 0 0 0 1 0 3 0 0 0 0 0 0 0 1 0 1 1 0 2 1 0 $3,500,000+ $3,000,000 - $3,499,999 $2,500,000 - $2,999,999 $2,000,000 - $2,499,999 $1,900,000 - $1,999,999 $1,800,000 - $1,899,999 $1,700,000 - $1,799,999 $1,600,000 - $1,699,999 $1,500,000 - $1,599,999 $1,400,000 - $1,499,999 $1,300,000 - $1,399,999 $1,200,000 - $1,299,999 $1,100,000 - $1,199,999 $1,000,000 - $1,099,999 $950,000 - $999,999 Beds3 -RangePrice -Median SoldDOM -Median SoldBaths -Median SoldSold -TotalInventory -TotalSales Ratio -Sold/Inventory0-1 Bedrooms NA NA NA 0 0 NA 2 Bedrooms $1,112,500 37 3 4 8 50% 3 Bedrooms $1,540,000 12 3 2 9 22% 4 Bedrooms NA NA NA 0 1 0% 5 Bedrooms NA NA NA 0 0 NA 6+ Bedrooms NA NA NA 0 0 NA KAUAI Attached Homes Inventory Sales Seller’s Market 18 Total Inventory: 6 Total Sales: 33% Total Sales Ratio2: Luxury Benchmark Price 1: $950,000 1 The luxury threshold price is set by The Institute for Luxury Home Marketing. 2Sales Ratio defines market speed and market type: Buyer's < 14.5%; Balanced >= 14.5 to < 20.5%; Seller's >= 20.5% plus. If >100% MLS® data reported previous month’s sales exceeded current inventory.
42 18
VARIANCE: N/A N/A N/A
13-Month Luxury Market Trend4
Median Data Review | August
15 6
-
97.56% 97.26%
$1.56m $1.24m VARIANCE: 71 %
• The Kauai attached luxury market is a Seller's Market with a 33% Sales Ratio
• Homes sold for a median of 97.26% of list price in August 2023.
• The most active price band is $1,100,000-$1,199,999, where the sales ratio is 200%.
• The median luxury sales price for attached homes is $1,237,500
Kauai Market Summary | August 2023 KAUAI Attached Homes
Solds Median Sales Price Inventory Sales Price Days on Market Sale to List Price Ratio Sale Price Per SqFt. Aug. 2022 Aug. 2023 Aug. 2022 Aug. 2023 Aug. 2022 Aug. 2023 Aug. 2022 Aug. 2023 Aug. 2022 Aug. 2023 Aug. 2022 Aug. 2023 Total Inventory Total Solds 3Square foot table does not account for listings and solds where square foot data is not disclosed. 4Data reported includes Active and Sold properties and does not include Pending properties.
42 44 20 51 52 49 44 39 41 32 27 30 18 15 11 4 9 7 11 11 17 7 7 11 12 6 $1,560,000 $1,289,000 $1,240,000 $1,225,000 $1,345,000 $1,500,000 $1,100,000 $1,329,100 $1,725,000 $1,425,000 $1,150,000 $1,482,500 $1,237,500 Aug-22 Sep-22 Oct-22 Nov-22 Dec-22 Jan-23 Feb-23 Mar-23 Apr-23 May-23 Jun-23 Jul-23 Aug-23
VARIANCE:
• The median days on market for August 2023 was 24 days, up from 14 in August 2022. 60 %
VARIANCE: - 57 % VARIANCE:
- 21
%
14 24 VARIANCE: 0 %
Single-Family Attached
KAUAI Sales Activity
Metric Year $1-2 Million $2-3 Million $3-5 Million $5 Million+ $800K$1 Million $1 Million+ Closed Sales 2017 61 13 6 3 34 40 2018 66 17 7 17 51 55 2019 57 15 10 4 68 51 2020 85 17 11 12 59 41 2021 140 59 30 31 103 175 2022 247 62 30 30 75 175 2023 YTD 46 20 11 6 25 67 Median Sales Price (in millions) 2017 $1,285,000 $2,450,000 $3,800,000 $11,000,000 $868,758 $1,250,000 2018 $1,262,500 $2,500,000 $3,700,000 $8,702,400 $864,988 $1,500,000 2019 $1,395,000 $2,550,000 $3,650,000 $5,900,000 $897,129 $1,380,000 2020 $1,300,000 $2,300,000 $3,820,000 $7,700,000 $857,000 $1,350,000 2021 $1,471,500 $2,450,000 $3,500,000 $8,500,000 $895,000 $1,395,000 2022 $1,293,000 $2,300,000 $3,525,000 $9,673,750 $892,500 $1,650,000 2023 YTD $1,259,148 $2,422,500 $3,250,000 $7,050,000 $920,000 $1,415,000 Months Supply of Inventory 2017 12.6 19.9 24.8 23.9 10.5 16.0 2018 11.6 18.0 23.9 21.9 9.9 16.5 2019 10.7 16.1 16.5 21.6 9.0 17.2 2020 7.0 13.4 12.7 19.5 7.4 13.2 2021 4.8 9.3 6.7 12.4 4.9 6.6 2022 3.3 6.4 25.0 25.0 4.6 5.3 2023 YTD 5.5 8.0 4.5 26.0 4.0 2.1
Luxury
IS IN EACH DETAIL.
HUBERT DE GIVENCHY
North American Luxury Review
Trends for the Fall/Winter
In a continuation of last month’s report, we take a deeper dive into the upcoming trends for the rest of 2023 and early 2024, especially as the market has seemingly settled into a new norm.
In general, the market remains statistically favorable to sellers mainly due to the continued lack of inventory. However, buyers, especially those looking to purchase with cash, recognize that the current market does now offer more opportunity as well as some additional negotiation leverage.
Despite the significant drop of demand and sales in the latter part of 2022, the first eight months of 2023 showed an upward trajectory for both home prices as well as sales for single family homes. Attached home prices saw more variation, but the volume of sales also increased.
Month-over-month between January and June, sales increased. While they dipped in July, typically a slower month as people escape for vacation, August’s figures show an uptick in demand.
10,000 20,000 30,000 SFR Sold $1,100,000 $1,200,000 $1,300,000 $1,400,000 SFR Sold $ $700,000 $800,000 $900,000 $1,000,000 Condo Sold $2,500 5,000 7,500 Condo Sold
Although sales and prices have not returned to the same heights as the first quarter of 2022, which was probably the top of the market in terms of price and demand, the current trajectory signifies a steady demand for luxury properties. This bodes well for the upcoming fall/winter market, especially when compared to the same period in 2022.
Pricing Trends
Experts are predicting that home prices will continue to rise, at least during the rest of 2023, but notably at a considerably more moderate pace.
Pricing is still being controlled by lower-than-average inventory levels, which itself has become a major driver of the market’s status. While it’s predicted that interest rates are likely to fall, albeit not until late 2024, it still seems unlikely that prices will decline as higher demand will offset any negative increases in inventory levels.
Most analysts and economists predict, according to a report from Norada Real Estate Investments, that over the next five years, prices will remain either flat or will only experience a modest decline. Paired with more robust lending standards, no one anticipates a similar price crash to the one that occurred in 2008.
Demand Trends
The trend of luxury property pricing has always varied by location and price point. However, over the last four years, many have become accustomed to performance trends being based on national averages.
While key influencers such as interest rates, inflation, and economic uncertainty remain, other parameters of a more local significance are starting to play a role in how demand is diversifying.
Long and short-term outside influences, including but not limited to relocation, immigration, economics, supply types, buyer intentions, and local mortgage and rental rates are all variables that now need to be considered, moving forward into the last quarter of the year.
Some firmly established markets are seeing a surge in demand as their affluent buyers take advantage of softening prices, while other markets have a higher demographic percentage who are more affected by increasing mortgage rates, resulting in lower demand.
Immigration, as well as relocation, is also increasing demand in some luxury markets, especially if homes prices did not see the same upswing in value during the last four years, especially if their local economy is now flourishing.
Equally, prices continue to correct themselves in those markets that saw a tremendous upswing of demand during 2020-2022, as they also continue to adjust to match a normalizing level of demand.
The ‘Experience’ Trend
While each market will be affected by its own nuances, equally the ‘experience’ a home offers has become a significant factor in the decision-making process of the wealthy.
No matter who we talk to, savvy homeowners, luxury real estate professionals, developers, architects, and designers, they are all putting their emphasis on defining the experience as part of their luxury marketing message.
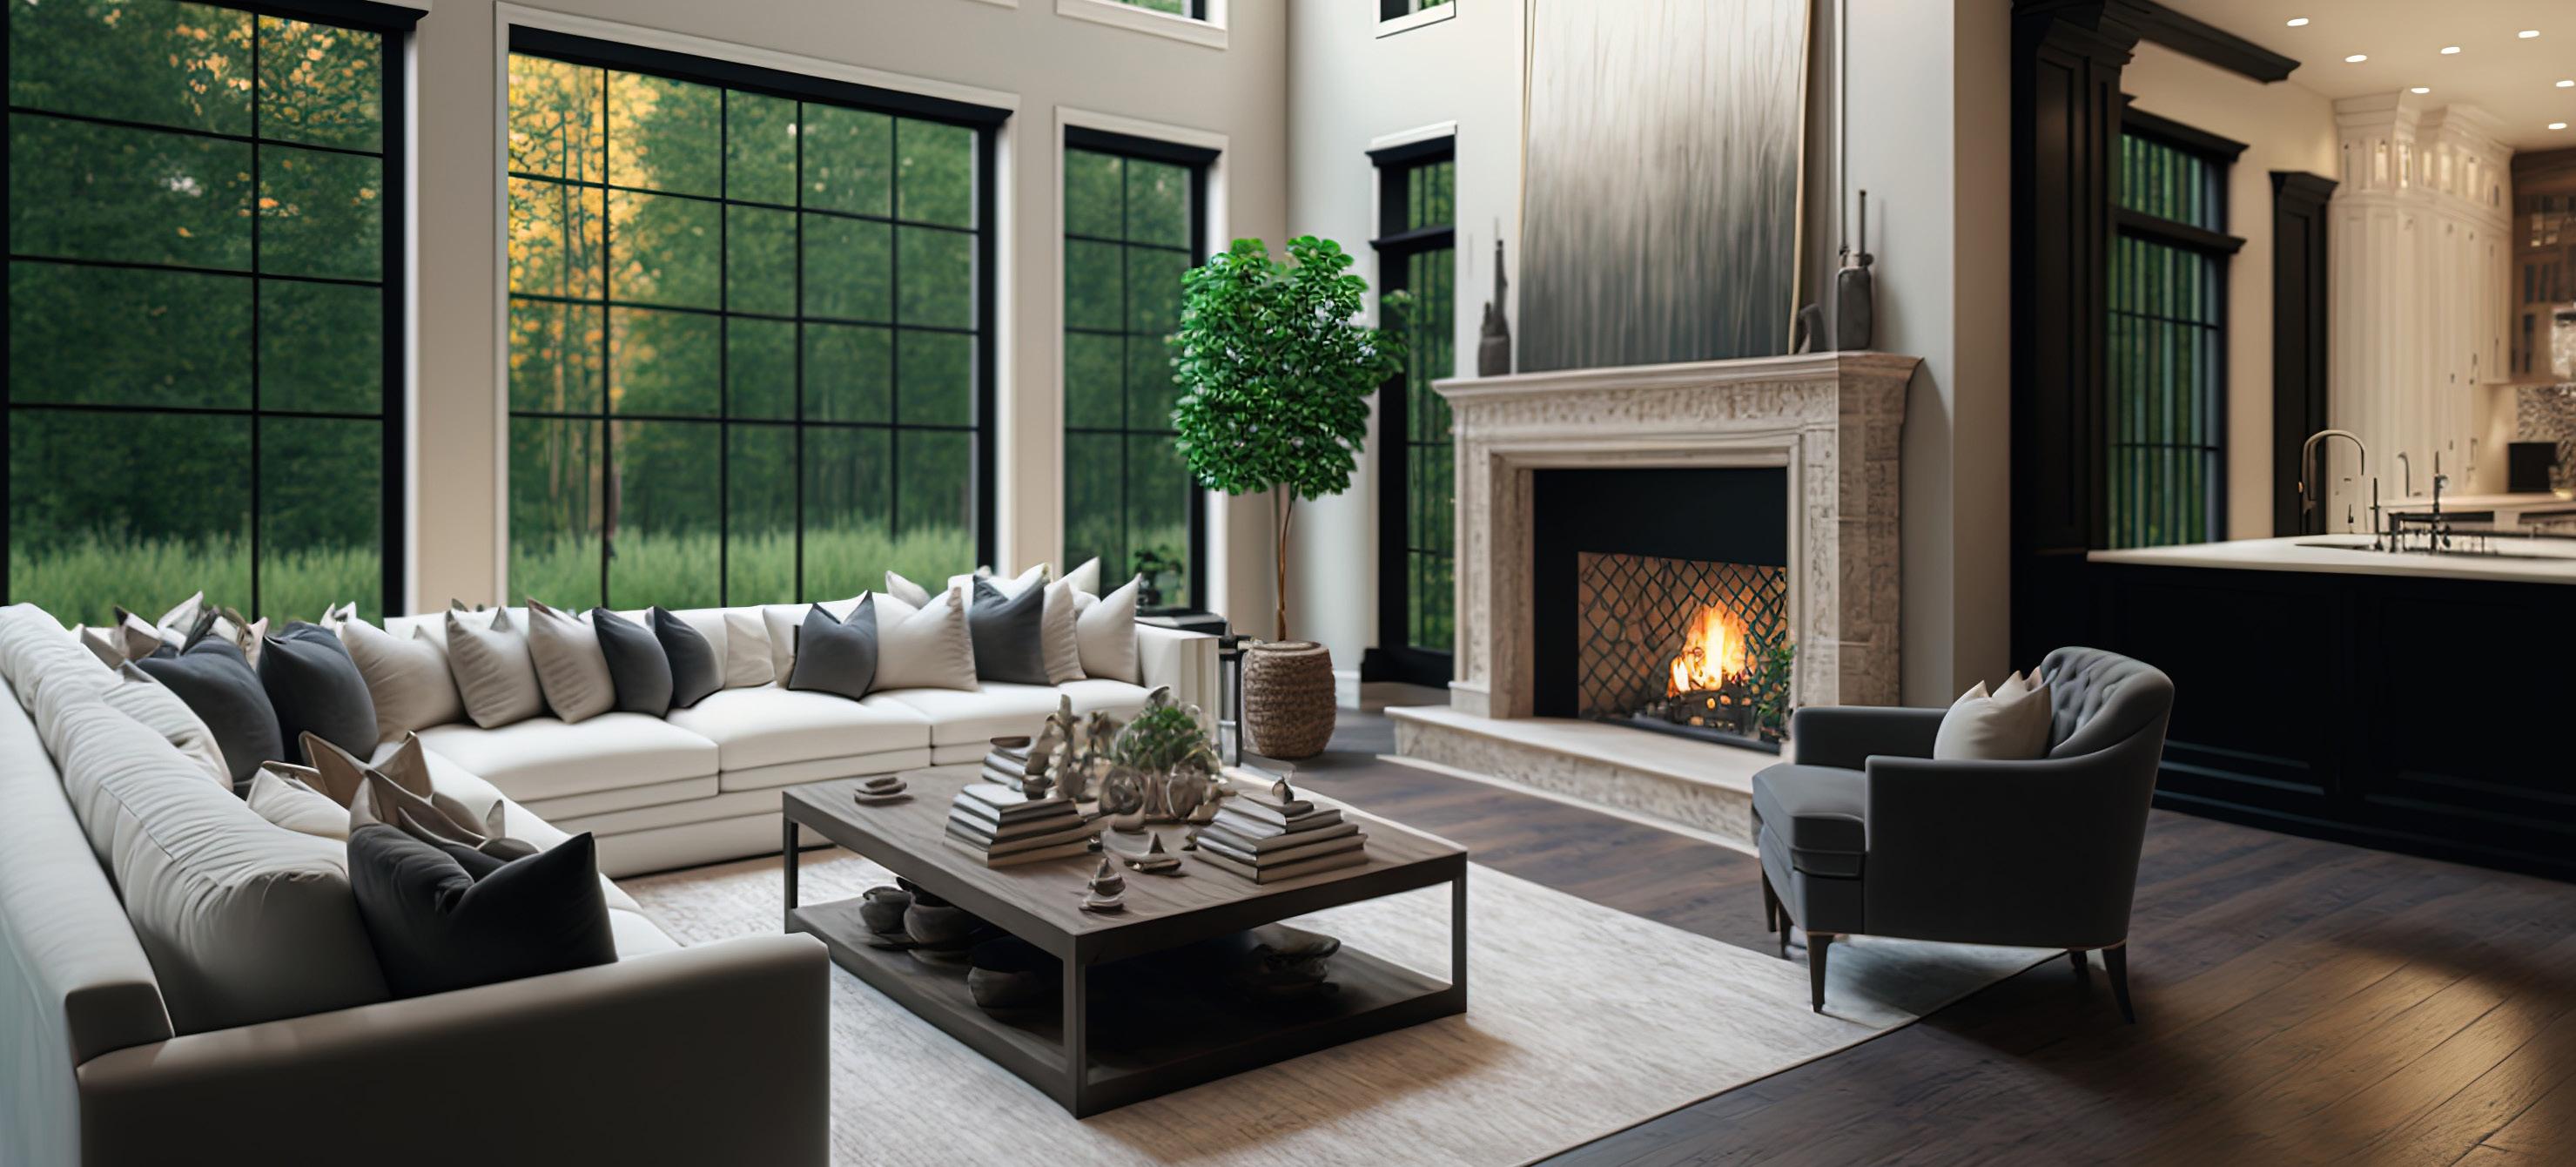
The general message is that luxury is about the design, the location of the property and the property’s ability to offer a unique experience. For instance, keeping the essence of the natural surroundings while ensuring that all aspects of their lifestyle, health, privacy, and security are part of the package.
Design Trends
In the past, luxury properties were designed primarily for functionality, even if they were mansions or estate homes. But, as we move towards 2024, expect to see more architectural emphasis on properties designed to promote wellness and well-being, including such trends as:
1. Biophilic Design: This is an approach to architecture that seeks to connect its occupants closer to nature by incorporating things like natural lighting and ventilation, natural landscape features, and other elements for creating a more productive and healthier built environment for people.
2. Passive Design: This reflects a philosophy of life and how the relationship with the environment should develop with the primary objective of using available resources and maximizing energy savings.
3. Sustainability Designs: Green architecture and environmentally conscious living are architectural trends that will prevail, offering sustainable solutions such as carbon neutral homes by using natural materials, including recycled resources.
4. Green Design: Properties with extensive green spaces, including private gardens, rooftop gardens, and outdoor relaxation areas, remain desirable for health-conscious buyers.
Interior design will continue to move in the direction of sustainability in a time when environmental awareness is crucial. To lessen the carbon footprint, the emphasis is on using recycled materials, promoting energy-efficient designs, and using locally sourced furniture and decor.
Some of the key trends in interior design for 2023/2024 include:
1. Natural Lighting and Air Quality: Design features that maximize natural light and ventilation are in demand, as they contribute to better indoor air quality and overall well-being.
2. Noise Exclusion Design: More architectural projects are focused on using materials and distributions that minimize noise inside the building, which is a critical expectation in luxury apartments.
3. Wellness Amenities: Luxury real estate developers are incorporating wellness amenities such as spa facilities, meditation gardens, yoga studios, and fitness centers within their properties.
4. Multifunctional Space: Open and integrated space that allows for multipurpose functions are not new, but new designs are creating opportunities to close and open these spaces as needed, using artistic but automated partitions as an example.
Smart Home Trends
Luxury homeowners are investing in smart home technology as it improves the quality of their lifestyle by creating healthier environments, controlling daily routines, and providing security and safety when at home or even at a distance.
Some of the key trends in smart home technology for 2023/2024 include:
1. Voice control: The use of voice assistants like Amazon Alexa and Google Assistant to control various smart devices has been growing and is expected to continue, along with improved voice recognition technology in kitchen appliances.
2. Smart appliances: More appliances, such as refrigerators, washing machines, and ovens, are becoming smart and interconnected, allowing for remote monitoring and control.
3. Energy efficiency: Smart home devices designed to increase energy efficiency, such as smart thermostats, LED lighting, and energy monitoring systems, are becoming more popular as people seek to reduce energy consumption and lower utility bills.
4. Security and surveillance: Demand for smart security systems, including video doorbells, smart locks, and home monitoring cameras, are on the rise as people prioritize home security.
5. Home automation: Integrating various smart devices into a central automation system for convenience and efficiency is a growing trend, especially by tech-savvy homeowners. This includes controlling lighting, heating, cooling, and entertainment systems through a single interface.
6. Health and wellness: Smart home technology is increasingly being used to monitor health and well-being, including fitness trackers, sleep monitors, and air quality sensors.
For homeowners looking for their next home, it is still important to recognize that although costs to purchase will be much higher currently, over the long-term, real estate offers one of the most consistent ways to see a good return. More importantly, ownership provides security and a haven for their family.
For the Luxury North American Market
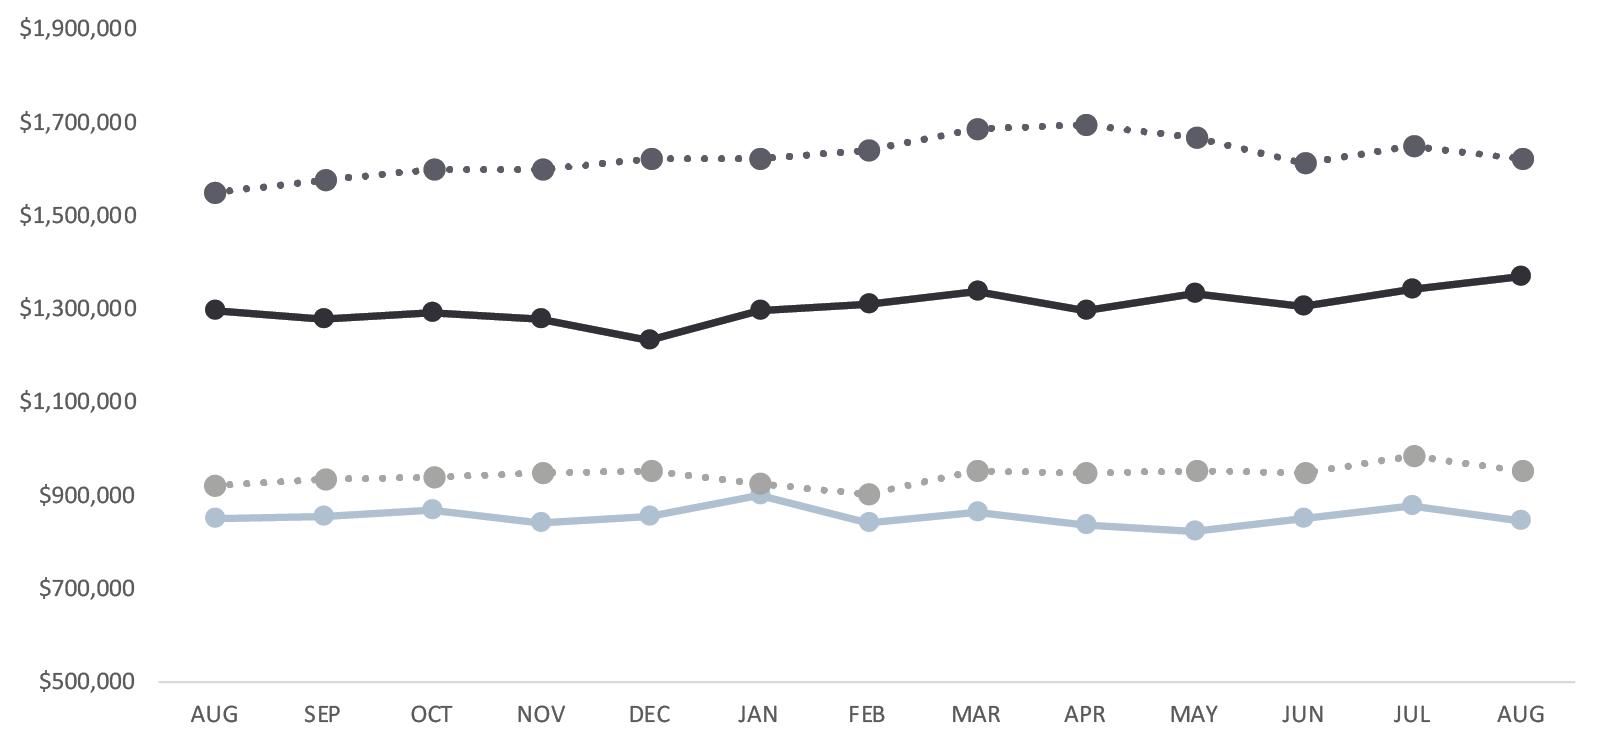
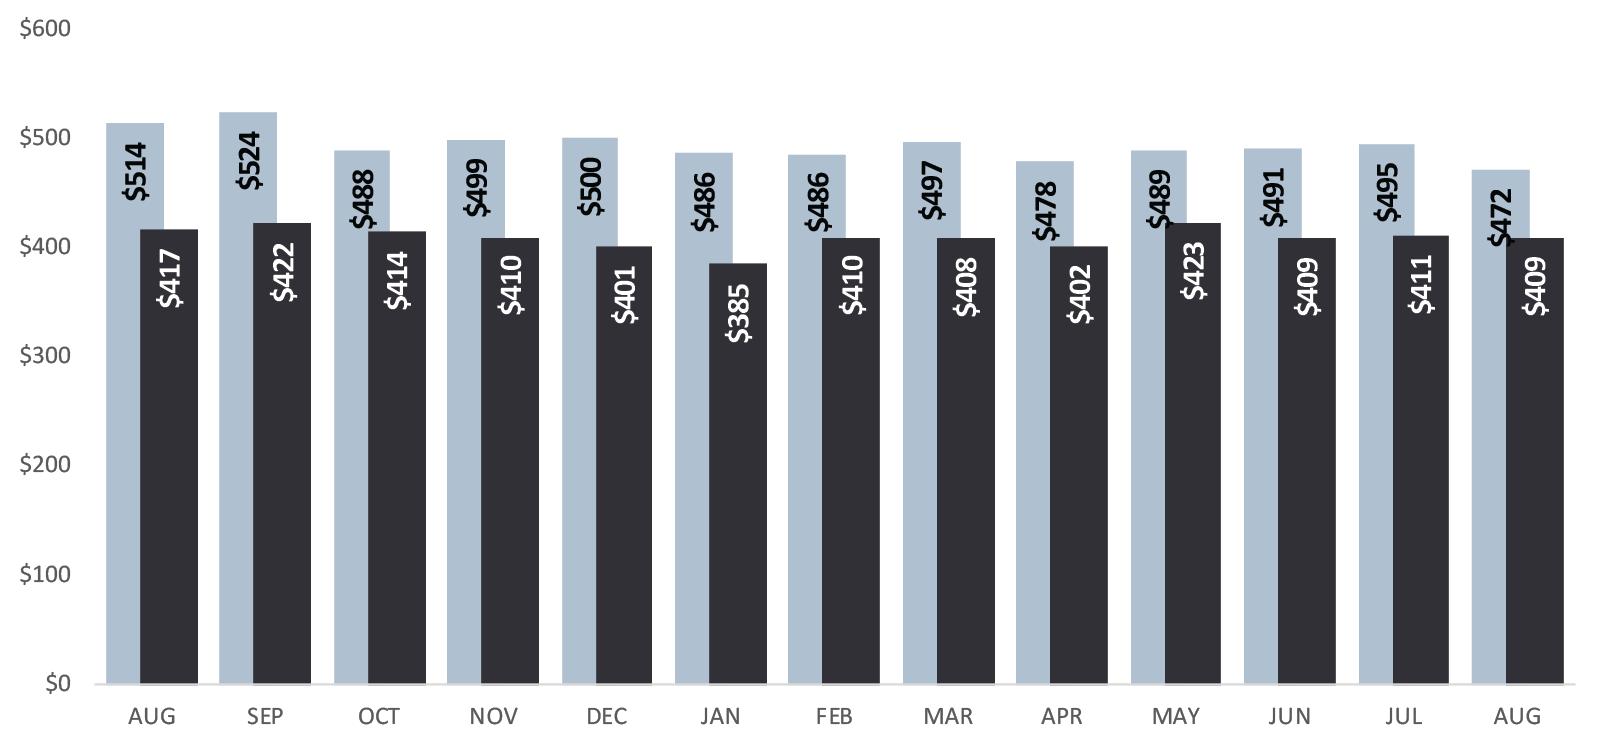
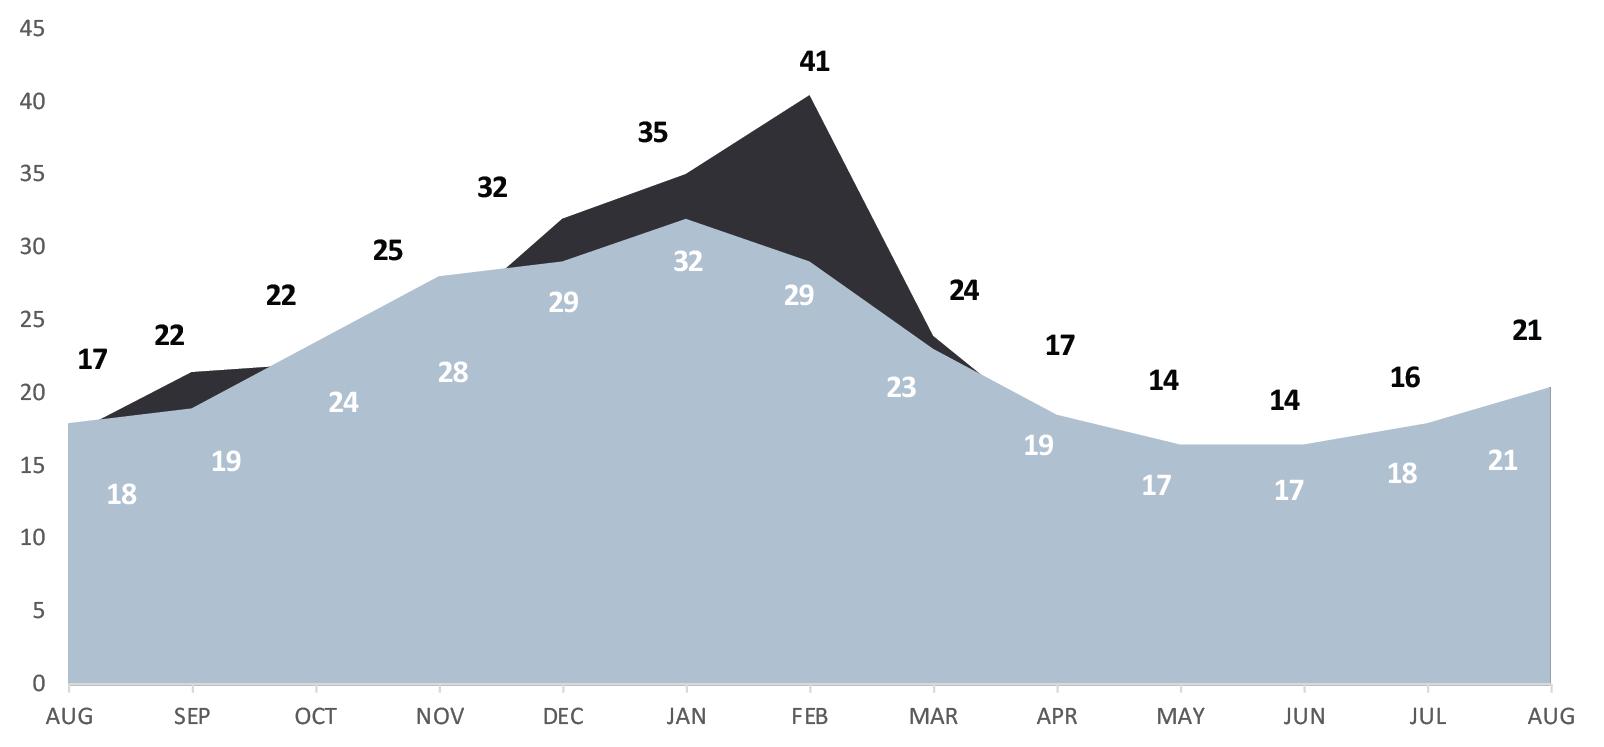
All data is based off median values. Median prices represent properties priced above respective city benchmark prices.
13-Month Market Trends
Single-Family Homes Attached Homes Single-Family List Price Attached List Price Days on Market Sales Price vs. List Price Price per Square Foot
Luxury Monthly Market Review
A Review of Key Market Differences Year over Year
August 2022 | August 2023
Single-Family Homes
1,498 764 $70,500 4 3.91%
Single-Family Homes Market Summary | August 2023
• Official Market Type: Seller's with a 31.19% Sales Ratio.1
• Homes are selling for an average of 99.08% of list price
• The median luxury threshold2 price is $900,000, and the median luxury home sales price is $1,370,000.
• Markets with the Highest Median Sales Price: Aspen ($13,400,000), Telluride ($7,500,000), Vail ($5,375,000), and Los Angeles Beach Cities ($4,608,500).
• Markets with the Highest Sales Ratio: Cleveland Suburbs (131%), Baltimore City (124%), East Bay, CA (103%), and Howard County, MD (90%).
1Sales Ratio defines market speed and market type: Buyer's < 15.5%; Balanced >= 15.5 to < 20.5%; Seller's >= 20.5% plus. If >100%, sales from previous month exceeds current inventory. 2The luxury threshold price is set by The Institute for Luxury Home Marketing.
Median List Price $1,550,000 $1,624,995 Median Sale Price $1,299,500 $1,370,000 Median SP/LP Ratio 99.58% 99.08% Total Sales Ratio 35.10% 31.19% Median Price per Sq. Ft. $417 $409 Total Inventory 52,927 57,101 New Listings 16,906 18,404 Total Sold 18,575 17,811 Median Days on Market 17 21 Average Home Size 3,215 3,179 Median prices represent properties priced above respective city benchmark prices. August 2023 August 2022 August 2023 August 2022 New Listings Total Sold Days on Market Sales Ratio Med. Sale Price
Luxury Monthly Market Review
A Review of Key Market Differences Year over Year
August 2022 |
Attached
Homes
$6,250
• Official Market Type: Seller's Market with a 27.57% Sales Ratio 1
• Attached homes are selling for an average of 99.21% of list price
• The median luxury threshold2 price is $700,000, and the median attached luxury sale price is $845,250
• Markets with the Highest Median Sales Price: Aspen ($5,250,000), Vail ($3,465,000), San Francisco ($2,472,500), and Whistler ($2,450,000).
• Markets with the Highest Sales Ratio: Howard County, MD (141%), McLean & Vienna, VA (113%), Montgomery County, MD (107%), and Fairfax County, VA (106%).
254 1,140
1Sales Ratio defines market speed and market type: Buyer's < 15.5%; Balanced >= 15.5 to < 20.5%; Seller's >= 20.5% plus. If >100%, sales from previous month exceeds current inventory. 2The luxury threshold price is set by The Institute for Luxury Home Marketing. Median List Price $922,725 $954,450 Median Sale Price $851,500 $845,250 Median SP/LP Ratio 99.01% 99.21% Total Sales Ratio 31.41% 27.57% Median Price per Sq. Ft. $514 $472 Total Inventory 15,253 18,299 New Listings 5,013 6,153 Total Sold 4,791 5,045 Median Days on Market 18 21 Average Home Size 1,853 1,892 Median prices represent properties priced above respective city benchmark prices.
August 2023 August 2022 August 2023 August 2022
3.84% Attached Homes Market Summary | August 2023
3
August
New Listings Total Sold Days on Market Sales Ratio Med. Sale Price
2023
Luxury Monthly Market Review
Single-Family Homes
Median prices represent properties priced above respective city benchmark prices. Prices shown for Canadian cites are shown in Canadian Dollars.
State Market Name Median List Price Median Sold Price Inventory New Listings Sold Days on Market Market Status AB Calgary $1,148,000 $950,000 652 370 251 18 Seller's AZ Chandler and Gilbert $1,100,000 $964,750 121 52 64 30 Seller's AZ Flagstaff $1,599,990 $1,470,000 103 34 27 47 Seller's AZ Mesa $870,445 $800,000 136 53 62 36 Seller's AZ Paradise Valley $5,950,000 $4,050,000 111 26 18 58 Balanced AZ Phoenix $899,000 $810,000 627 234 277 39 Seller's AZ Scottsdale $2,250,000 $1,650,000 567 162 167 55 Seller's AZ Tucson $695,000 $648,950 760 244 234 14 Seller's BC Mid Vancouver Island $1,696,500 $1,460,000 224 83 29 42 Buyer's BC Okanagan Valley $1,750,000 $1,515,000 1081 236 57 52 Buyer's BC Vancouver $4,188,000 $3,588,000 1110 272 59 16 Buyer's BC Victoria $2,499,000 $2,150,000 209 85 27 23 Buyer's BC Whistler $5,980,000 $3,337,000 57 17 2 13 Buyer's CA Central Coast $2,882,500 $2,210,000 258 108 64 13 Seller's CA East Bay $2,300,000 $1,950,000 312 158 321 11 Seller's CA Greater Palm Springs $1,778,000 $1,595,000 293 75 89 36 Seller's CA Lake Tahoe $2,397,000 $1,662,500 230 68 72 17 Seller's CA Los Angeles Beach Cities $5,890,000 $4,608,500 382 97 78 29 Balanced CA Los Angeles City $5,299,000 $3,500,000 629 164 110 26 Balanced CA Los Angeles The Valley $2,750,000 $2,075,000 592 201 184 32 Seller's CA Marin County $3,700,000 $3,050,000 102 22 23 30 Seller's CA Napa County $3,825,000 $2,400,000 139 21 14 25 Buyer's CA Orange County $2,950,000 $2,211,250 951 332 448 24 Seller's CA Placer County $1,198,940 $1,069,919 244 97 95 21 Seller's CA Sacramento $979,775 $900,000 612 289 304 17 Seller's CA San Diego $2,599,000 $1,820,000 830 351 413 12 Seller's CA San Francisco $4,499,500 $3,400,000 116 39 37 17 Seller's CA San Luis Obispo County $1,795,000 $1,417,500 209 57 56 43 Seller's CA Silicon Valley $4,250,000 $3,355,417 423 218 270 9 Seller's CA Sonoma County $2,495,000 $1,930,000 283 41 52 47 Balanced CA Ventura County $2,437,500 $1,850,000 266 95 93 44 Seller's CO Aspen $18,000,000 $13,400,000 93 11 9 85 Buyer's CO Boulder $2,150,000 $1,595,000 304 89 65 45 Seller's CO Colorado Springs $905,000 $881,550 503 157 131 19 Seller's CO Denver $1,695,000 $1,459,500 807 291 260 17 Seller's CO Douglas County $1,299,900 $1,075,000 415 142 118 16 Seller's CO Durango $1,390,000 $1,200,000 123 28 27 51 Seller's CO Summit County $3,250,000 $2,279,292 85 16 14 71 Balanced CO Telluride $6,600,000 $7,500,000 107 8 9 191 Buyer's
Luxury Monthly Market Review
Median prices represent properties priced above respective city benchmark prices. Prices shown for Canadian cites are shown in Canadian Dollars.
State Market Name Median List Price Median Sold Price Inventory New Listings Sold Days on Market Market Status CO Vail $5,950,000 $5,375,000 101 17 13 120 Buyer's CT Central Connecticut $697,000 $620,000 373 120 247 5 Seller's CT Coastal Connecticut $2,270,000 $1,675,000 484 111 230 24 Seller's DC Washington D.C. $4,407,500 $2,300,000 42 5 14 24 Seller's DE Sussex County Coastal $1,495,000 $1,400,000 129 28 32 33 Seller's FL Boca Raton/Delray Beach $2,850,000 $2,212,500 479 131 80 32 Balanced FL Brevard County $849,625 $800,000 406 157 121 15 Seller's FL Broward County $1,737,000 $1,445,500 654 187 113 38 Balanced FL Coastal Pinellas County $2,200,000 $2,125,000 98 25 19 33 Balanced FL Ft. Lauderdale $4,750,000 $3,790,500 171 46 16 93 Buyer's FL Jacksonville Beaches $1,299,000 $1,250,000 370 99 87 26 Seller's FL Lee County $1,399,900 $1,227,500 739 145 100 40 Buyer's FL Marco Island $2,549,000 $2,525,000 121 17 13 73 Buyer's FL Miami $1,997,000 $1,587,500 1037 272 118 52 Buyer's FL Naples $5,262,500 $3,650,000 358 52 37 71 Buyer's FL Orlando $1,249,000 $1,162,500 828 226 204 18 Seller's FL Palm Beach Towns $3,954,500 $1,724,500 258 44 21 116 Buyer's FL Sarasota & Beaches $2,850,000 $1,972,500 400 63 68 70 Balanced FL South Pinellas County $1,500,000 $1,300,000 266 86 87 19 Seller's FL South Walton $2,392,500 $2,200,000 546 111 51 61 Buyer's FL Tampa $749,990 $698,000 1198 423 471 18 Seller's GA Atlanta $1,650,000 $1,185,000 703 259 231 9 Seller's GA Duluth $1,675,000 $1,525,000 16 7 5 7 Seller's HI Island of Hawaii $1,989,000 $1,587,500 161 39 38 34 Seller's HI Kauai $2,494,000 $1,995,000 43 6 5 52 Buyer's HI Maui $3,950,000 $2,275,000 113 11 17 129 Balanced HI Oahu $2,899,000 $2,675,000 199 62 43 17 Seller's IA Greater Des Moines $658,000 $620,000 493 104 99 15 Balanced ID Ada County $783,051 $770,000 718 280 253 19 Seller's ID Northern Idaho $1,685,000 $1,475,000 545 150 73 86 Buyer's IL Chicago $1,390,000 $1,075,000 671 200 130 36 Balanced IL DuPage County $1,200,000 $1,000,000 276 121 145 9 Seller's IL Lake County $1,272,450 $905,000 296 110 151 11 Seller's IL Will County $679,000 $615,000 257 117 151 9 Seller's IN Hamilton County $865,000 $761,230 175 82 129 6 Seller's KS Johnson County $849,950 $861,250 493 76 158 6 Seller's MA Cape Cod $2,675,000 $1,850,000 167 38 30 43 Balanced MA Greater Boston $3,495,000 $2,575,000 118 27 54 22 Seller's MA South Shore $1,799,999 $1,500,000 85 25 47 20 Seller's
Single-Family Homes
Median prices represent properties priced above respective city benchmark prices. Prices shown for Canadian cites are shown in Canadian Dollars.
State Market Name Median List Price Median Sold Price Inventory New Listings Sold Days on Market Market Status MD Anne Arundel County $1,043,500 $915,000 204 87 91 6 Seller's MD Baltimore City $750,000 $785,000 17 7 21 5 Seller's MD Baltimore County $1,150,000 $975,000 145 48 49 12 Seller's MD Frederick County $885,000 $825,000 54 16 22 5 Seller's MD Howard County $1,197,500 $1,034,000 62 21 56 6 Seller's MD Montgomery County $2,000,000 $1,610,500 160 60 110 7 Seller's MD Talbot County $2,999,000 $1,601,000 43 8 11 12 Seller's MD Worcester County $1,100,000 $812,450 55 28 24 7 Seller's MI Grand Traverse $1,195,000 $885,000 85 26 18 30 Seller's MI Livingston County $750,000 $695,000 111 43 27 21 Seller's MI Monroe County $661,950 $600,000 30 9 5 23 Balanced MI Oakland County $770,000 $627,500 816 319 364 9 Seller's MI Washtenaw County $995,000 $770,000 182 79 55 15 Seller's MI Wayne County $750,000 $625,000 177 74 115 10 Seller's MN Olmsted County $829,900 $773,500 85 23 24 28 Seller's MN Twin Cities $1,199,000 $1,050,000 828 256 293 16 Seller's MO Kansas City $699,900 $670,950 1510 287 494 8 Seller's MO St. Louis $876,426 $656,000 135 55 106 5 Seller's NC Asheville $1,099,000 $907,000 283 84 79 21 Seller's NC Charlotte $1,239,900 $965,000 567 195 340 6 Seller's NC Lake Norman $1,249,000 $1,150,000 223 77 95 11 Seller's NC Raleigh-Durham $1,195,000 $942,500 475 152 240 3 Seller's NH Rockingham County $1,922,500 $1,365,000 62 22 25 12 Seller's NJ Bergen County $2,395,000 $1,700,000 247 54 97 20 Seller's NJ Hudson County $1,500,000 $1,499,500 23 9 8 21 Seller's NJ Morris County $1,599,000 $1,300,000 139 38 73 14 Seller's NJ Ocean County $975,000 $799,500 496 169 132 20 Seller's NM Taos $1,260,000 $1,115,763 81 14 8 93 Buyer's NV Lake Tahoe $3,600,000 $2,765,000 147 27 28 80 Balanced NV Las Vegas $1,795,000 $1,379,905 610 208 138 30 Seller's NV Reno $1,997,000 $1,729,500 156 40 26 73 Balanced NY Finger Lakes $1,595,000 $1,712,500 31 17 18 8 Seller's NY Nassau County $1,800,000 $1,580,000 680 179 217 25 Seller's NY Staten Island $1,199,000 $1,090,000 156 47 33 74 Seller's NY Suffolk County $1,897,000 $1,220,000 980 238 192 25 Balanced OH Cincinnati - - - - - -OH Cleveland Suburbs $829,000 $675,000 36 12 47 25 Seller's OH Columbus $874,900 $742,500 505 193 322 7 Seller's ON GTA - Durham $1,700,000 $1,585,000 281 170 56 18 Balanced
Luxury Monthly Market Review Single-Family Homes
Median prices represent properties priced above respective city benchmark prices. Prices shown for Canadian cites are shown in Canadian Dollars.
State Market Name Median List Price Median Sold Price Inventory New Listings Sold Days on Market Market Status ON GTA - York $2,489,444 $1,875,000 640 350 165 15 Seller's ON Hamilton $1,949,450 $1,520,000 254 114 27 28 Buyer's ON Mississauga $2,927,940 $2,605,000 160 75 22 39 Buyer's ON Oakville $2,880,880 $2,440,000 157 83 35 20 Seller's ON Toronto $3,864,950 $3,307,500 440 208 56 20 Buyer's ON Waterloo Region $1,399,900 $1,235,500 202 105 52 12 Seller's OR Portland $1,289,000 $1,125,000 831 258 225 17 Seller's SC Charleston $1,825,000 $1,410,000 443 151 136 16 Seller's SC Hilton Head $1,980,000 $1,575,000 246 53 63 31 Seller's SC The Grand Strand $859,500 $820,000 378 95 99 84 Seller's TN Greater Chattanooga $950,000 $849,000 238 76 50 8 Seller's TN Knoxville $950,000 $875,000 160 46 67 5 Seller's TN Nashville $1,782,500 $1,375,000 878 232 235 10 Seller's TX Austin $1,199,000 $972,000 1388 405 311 35 Seller's TX Collin County $749,498 $718,683 1392 575 589 18 Seller's TX Dallas $1,345,000 $1,075,000 511 193 167 24 Seller's TX Denton County $790,144 $735,000 1174 399 423 23 Seller's TX El Paso $619,500 $575,000 222 53 37 9 Balanced TX Fort Worth $874,900 $820,000 1041 352 378 20 Seller's TX Greater Tyler $699,000 $630,000 242 92 39 29 Balanced TX Houston $980,000 $900,000 1141 421 333 12 Seller's TX Lubbock $632,450 $726,000 178 68 29 83 Balanced TX San Angelo $630,000 $599,900 77 24 11 72 Buyer's TX San Antonio $797,235 $750,000 792 231 160 35 Balanced TX The Woodlands & Spring $850,000 $799,000 221 110 117 9 Seller's UT Park City $4,400,000 $3,720,000 244 46 27 35 Buyer's UT Salt Lake City $1,194,950 $1,027,250 534 179 164 32 Seller's VA Arlington & Alexandria $2,172,000 $1,868,750 92 38 37 22 Seller's VA Charlottesville $1,319,513 $1,135,000 118 35 55 7 Seller's VA Fairfax County $2,099,450 $1,422,705 306 106 186 8 Seller's VA McLean & Vienna $2,598,000 $1,799,450 133 43 58 9 Seller's VA Richmond $806,000 $789,406 369 116 186 8 Seller's VA Smith Mountain Lake $1,849,900 $1,130,000 41 14 7 4 Balanced WA King County $2,031,706 $1,700,000 916 397 532 7 Seller's WA Seattle $2,092,500 $1,780,000 230 87 105 7 Seller's WA Spokane $1,142,500 $1,055,500 182 61 38 16 Balanced
Luxury Monthly Market Review Single-Family Homes
Markets with dashes do not have a significant luxury market for this report. Median prices represent properties priced above respective city benchmark prices. Prices shown for Canadian cites are shown in Canadian Dollars.
State Market Name Median List Price Median Sold Price Inventory New Listings Sold Days on Market Market Status AB Calgary $795,000 $672,000 163 74 50 22 Seller's AZ Chandler and Gilbert - - - - - -AZ Flagstaff - - - - - -AZ Mesa - - - - - -AZ Paradise Valley - - - - - -AZ Phoenix - - - - - -AZ Scottsdale $837,000 $759,278 182 62 64 41 Seller's AZ Tucson - - - - - -BC Mid Vancouver Island $849,000 $799,000 77 28 17 30 Seller's BC Okanagan Valley - - - - - -BC Vancouver $1,945,000 $1,698,500 995 304 94 13 Buyer's BC Victoria $949,900 $930,000 159 74 31 16 Balanced BC Whistler $2,649,000 $2,450,000 56 10 5 15 Buyer's CA Central Coast $1,300,000 $1,287,500 49 20 16 8 Seller's CA East Bay $1,128,944 $1,100,000 116 72 114 12 Seller's CA Greater Palm Springs - - - - - -CA Lake Tahoe $1,541,500 $1,050,000 48 15 12 31 Seller's CA Los Angeles Beach Cities $1,895,000 $1,605,000 141 44 70 20 Seller's CA Los Angeles City $1,795,000 $1,550,000 383 129 79 23 Balanced CA Los Angeles The Valley $826,000 $810,000 126 65 72 26 Seller's CA Marin County $1,285,000 $1,338,000 22 7 16 16 Seller's CA Napa County - - - - - -CA Orange County $1,250,000 $1,100,000 310 160 255 15 Seller's CA Placer County - - - - - -CA Sacramento - - - - - -CA San Diego $1,284,500 $1,072,500 328 183 222 10 Seller's CA San Francisco $2,695,000 $2,472,500 98 14 12 34 Buyer's CA San Luis Obispo County - - - - - -CA Silicon Valley $1,664,000 $1,600,000 92 67 75 8 Seller's CA Sonoma County $779,995 $700,000 18 12 9 17 Seller's CA Ventura County $824,500 $757,450 98 33 52 43 Seller's CO Aspen $3,495,000 $5,250,000 45 7 7 71 Balanced CO Boulder $926,950 $895,350 88 28 33 84 Seller's CO Colorado Springs $564,995 $565,000 42 15 11 27 Seller's CO Denver $895,000 $756,250 183 58 44 22 Seller's CO Douglas County $575,000 $620,000 23 12 14 27 Seller's CO Durango $829,000 $820,000 31 6 17 60 Seller's CO Summit County $1,170,000 $1,705,000 26 9 4 39 Balanced CO Telluride $2,872,500 $1,416,000 34 10 14 68 Seller's
Luxury Monthly Market Review Attached Homes
Luxury Monthly Market Review Attached Homes
Markets with dashes do not have a significant luxury market for this report. Median prices represent properties priced above respective city benchmark prices. Prices shown for Canadian cites are shown in Canadian Dollars.
State Market Name Median List Price Median Sold Price Inventory New Listings Sold Days on Market Market Status CO Vail $4,047,500 $3,465,000 110 24 24 37 Seller's CT Central Connecticut - - - - - -CT Coastal Connecticut $1,145,000 $754,000 114 31 74 37 Seller's DC Washington D.C. $1,998,950 $1,500,000 214 60 53 19 Seller's DE Sussex County Coastal $1,064,500 $755,140 20 7 7 17 Seller's FL Boca Raton/Delray Beach $1,067,500 $675,000 326 91 77 35 Seller's FL Brevard County $739,950 $670,000 188 49 32 42 Balanced FL Broward County $699,000 $582,500 739 181 98 29 Buyer's FL Coastal Pinellas County $1,292,500 $1,020,000 158 37 26 55 Balanced FL Ft. Lauderdale $2,600,000 $1,995,000 137 16 7 23 Buyer's FL Jacksonville Beaches $1,100,000 $1,185,000 44 13 14 28 Seller's FL Lee County $849,000 $1,075,000 415 72 75 24 Balanced FL Marco Island $1,649,500 $1,905,000 50 10 8 50 Balanced FL Miami $1,464,972 $1,275,000 1401 305 116 89 Buyer's FL Naples $2,392,500 $2,025,000 220 34 32 38 Buyer's FL Orlando $553,000 $568,500 284 84 56 21 Balanced FL Palm Beach Towns $1,750,000 $1,625,750 224 50 26 18 Buyer's FL Sarasota & Beaches $1,595,000 $1,500,000 263 54 29 70 Buyer's FL South Pinellas County $1,085,000 $1,045,535 270 110 71 0 Seller's FL South Walton $1,400,000 $1,275,000 215 34 22 19 Buyer's FL Tampa $975,000 $735,000 255 84 87 7 Seller's GA Atlanta $747,432 $620,000 544 202 169 15 Seller's GA Duluth - - - - - -HI Island of Hawaii $2,800,000 $1,475,000 25 9 17 8 Seller's HI Kauai $1,787,500 $1,237,500 18 6 6 24 Seller's HI Maui $1,999,450 $1,850,000 86 16 27 94 Seller's HI Oahu $1,209,000 $965,000 432 87 84 25 Balanced IA Greater Des Moines - - - - - -ID Ada County $699,000 $615,000 69 17 17 17 Seller's ID Northern Idaho - - - - - -IL Chicago $1,199,950 $950,000 814 252 184 29 Seller's IL DuPage County $760,000 $652,069 29 15 21 6 Seller's IL Lake County - - - - - -IL Will County - - - - - -IN Hamilton County - - - - - -KS Johnson County $629,900 $681,749 156 18 26 3 Balanced MA Cape Cod $995,000 $848,000 41 17 18 16 Seller's MA Greater Boston $2,499,000 $2,250,000 368 82 73 34 Balanced MA South Shore $759,450 $842,500 20 10 13 19 Seller's
Markets with dashes do not have a significant luxury market for this report. Median prices represent properties priced above respective city benchmark prices. Prices shown for Canadian cites are shown in Canadian Dollars.
Attached
State Market Name Median List Price Median Sold Price Inventory New Listings Sold Days on Market Market Status MD Anne Arundel County $575,000 $580,000 73 40 69 5 Seller's MD Baltimore City $649,999 $650,000 88 20 24 18 Seller's MD Baltimore County $599,000 $565,000 27 12 10 7 Seller's MD Frederick County - - - - - -MD Howard County $650,000 $630,510 29 25 41 5 Seller's MD Montgomery County $797,000 $775,000 72 42 77 7 Seller's MD Talbot County - - - - - -MD Worcester County $675,000 $625,000 84 40 29 20 Seller's MI Grand Traverse - - - - - -MI Livingston County - - - - - -MI Monroe County - - - - - -MI Oakland County $659,000 $642,500 73 26 26 18 Seller's MI Washtenaw County $725,000 $645,000 47 13 7 27 Buyer's MI Wayne County $662,229 $714,900 80 14 15 36 Balanced MN Olmsted County - - - - - -MN Twin Cities - - - - - -MO Kansas City - - - - - -MO St. Louis - - - - - -NC Asheville $798,900 $632,500 52 8 8 19 Balanced NC Charlotte $649,900 $628,250 205 75 110 21 Seller's NC Lake Norman $619,950 $629,300 30 8 12 46 Seller's NC Raleigh-Durham - - - - - -NH Rockingham County $893,150 $925,000 44 14 25 6 Seller's NJ Bergen County $1,199,000 $1,146,994 159 41 37 67 Seller's NJ Hudson County $1,364,500 $1,295,000 112 37 39 12 Seller's NJ Morris County $669,500 $689,900 52 28 55 17 Seller's NJ Ocean County $959,000 $679,000 79 31 15 16 Balanced NM Taos - - - - - -NV Lake Tahoe $1,299,450 $1,200,000 22 10 11 42 Seller's NV Las Vegas - - - - - -NV Reno - - - - - -NY Finger Lakes - - - - - -NY Nassau County $1,499,000 $1,160,000 91 30 21 32 Seller's NY Staten Island $618,800 $617,500 101 34 32 33 Seller's NY Suffolk County $739,000 $615,000 126 41 75 21 Seller's OH Cincinnati - - - - - -OH Cleveland Suburbs - - - - - -OH Columbus $712,450 $689,778 114 35 36 9 Seller's ON GTA - Durham $799,900 $837,000 39 26 11 23 Seller's
Luxury Monthly Market Review
Homes
Markets with dashes do not have a significant luxury market for this report. Median prices represent properties priced above respective city benchmark prices. Prices shown for Canadian cites are shown in Canadian Dollars.
Attached Homes State Market Name Median List Price Median Sold Price Inventory New Listings Sold Days on Market Market Status ON GTA - York $799,999 $749,000 337 222 78 16 Seller's ON Hamilton $944,995 $907,500 36 19 12 17 Seller's ON Mississauga $989,000 $925,000 155 116 42 14 Seller's ON Oakville $1,381,944 $1,200,000 56 45 31 14 Seller's ON Toronto $1,199,999 $1,168,000 999 537 189 16 Balanced ON Waterloo Region $766,425 $790,000 48 29 14 13 Seller's OR Portland $699,450 $630,000 266 90 51 20 Balanced SC Charleston $1,200,000 $1,159,615 91 32 29 6 Seller's SC Hilton Head $999,500 $1,065,000 36 9 12 26 Seller's SC The Grand Strand $531,200 $520,000 228 84 75 63 Seller's TN Greater Chattanooga - - - - - -TN Knoxville - - - - - -TN Nashville $720,000 $629,900 247 69 102 5 Seller's TX Austin $849,000 $694,045 400 106 48 36 Buyer's TX Collin County - - - - - -TX Dallas $725,000 $750,000 173 57 42 23 Seller's TX Denton County - - - - - -TX El Paso - - - - - -TX Fort Worth - - - - - -TX Greater Tyler - - - - - -TX Houston $630,000 $609,000 125 64 29 9 Seller's TX Lubbock - - - - - -TX San Angelo - - - - - -TX San Antonio $725,000 $637,500 41 5 4 61 Buyer's TX The Woodlands & Spring - - - - - -UT Park City $1,895,000 $1,800,000 98 33 27 32 Seller's UT Salt Lake City $654,900 $587,500 164 69 55 29 Seller's VA Arlington & Alexandria $1,092,900 $1,015,000 79 45 53 7 Seller's VA Charlottesville $639,900 $556,130 45 15 13 1 Seller's VA Fairfax County $786,245 $714,900 146 78 155 6 Seller's VA McLean & Vienna $1,050,000 $1,085,000 23 8 26 27 Seller's VA Richmond $593,180 $567,570 84 29 34 9 Seller's VA Smith Mountain Lake - - - - - -WA King County $1,186,700 $1,119,500 296 104 106 9 Seller's WA Seattle $1,299,900 $1,387,000 145 43 35 17 Seller's WA Spokane - - - - - - -
Luxury Monthly Market Review


OAHU | HAWAII ISLAND | MAUI | KAUAI
©2020 Corcoran Pacific Properties. All rights reserved. Corcoran® and the Corcoran Logo are registered service marks owned by Corcoran Group LLC. Corcoran Pacific Properties fully supports the principles of the Fair Housing Act and the Equal Opportunity Act. Each franchise is independently owned and operated.
