CLIENT CENTERED | PERFORMANCE DRIVEN
Quar ter 3
The Most Comprehensive Jackson Hole Market Analysis
The Market Report Our team exclusively owns and maintains the valley’s oldest and most comprehensive database. Our Market Analysis is derived from the Jackson Hole Real Estate Associates’s proprietary, forty year old database (not just MLS Data) as well as decades of history and success, making this the most trusted and accurate real estate report in the region. No other real esate company or agenet has the resources available to offer this depth of expertise or insight regarding current or previous market conditions. The unmatched resources and knowledge of Jackson Hole Real Estate Associates, the largest and most dynamic real estate company in the region, combined with the largest independent affiliate networks, Christie’s International Real Estate and Leading Real Estate Companies of the World, we are able to offer the ideal balance of local expertise and global reach. As the market leader in the Jackon Hole Region, we beilieve the success of our company is based on the value that we provide for our clients, community and agents.
The NeVille Group Real Estate
The NeVille Group is a seasoned team within Jackson Hole Real Estate Associates, a Global Affiliate of the Year by Christie’s International Real Estate, 2011 and 2014. TNG has had many achievemnets from “Top Producer,” “Top Listing Agents,” “Luxury Sales Specialists,” and 2016 Team for Proessional Excellence.” As the region’s largest and most dynamic real estate company, we provide marketing and services that honor this remarkable destination. We produced more than double the number of listings and 40% more transactions than our nearest competitor in 2016. We are committed to being the leading luxy real estate brand in the Teton region. By staying on top of market trends and continuing to offer cutting edge services, we deliver extradinary experiences to clients and exceed their expectations. Please do not hesitate to contact any of our real estate professionals for a consultation or a market update in your area. * The statistics used in this report are from the Teton Multiple Listing Service (MLS) and JHREA’s internal database. * This report does not go into detail on every segment of the market, but is intended to offer an overview of general market conditions. Statistics are cumulative. * All statistics are supplied by sources that have been deemed reliable but are not guaranteed.
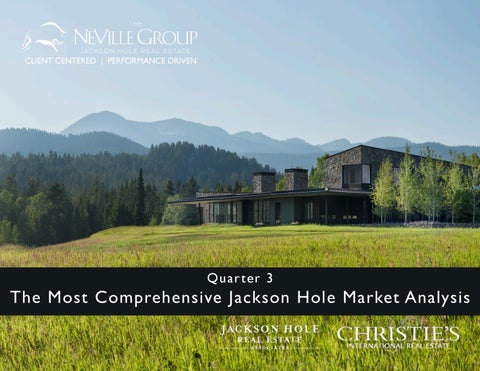
Cover Image: ASPENSONG, MLS #16-2341
M AR K E T HIGHLIGHTS
17%
AVERAGE SALE PRICE
0%
MEDIAN SALE PRICE
11%
TOTAL DOLLAR VOLUME
-1%
TOTAL TRANSACTIONS
Within this report you will find overall statistics on Jackson Hole residental, vacant land, commercial, and farm and ranch, as well as targeted information on 7 micro-markets we’ve identified: Teton Village, North of Wilson, South of Wilson, Central Valley, Northern Valley, Town of Jackson and South of Jackson.
Jackson Hole tourism numbers continue to increase as does the real estate market. As Jackson Hole continues on this growth trajectory, do not hesitate to contact a real estate professional for a market report in your area.
TETON VILLAGE (Realtor Multi-Listing Service Statistics)
Teton Village-Increase on Single Family Inventory & Overall Sales are Down 27% Single Family Homes
2016 Q3
2017 Q3
%
2016 Totals
Active
3
9
200.00%
7
Low Sale
Old Village
$3,775,000
Pending
3
5
66.67%
4
Med Sale
Old Village
$5,000,000
Units Sold
5
4
-20.00%
6
High Sale
Old Village
$7,268,000*
Avg Sold Price
$3,208,080
$4,803,250
49.72%
$3,969,233
2016 Top Sale
Old Village
$7,775,000
Median Sold Price
$3,200,000
$4,387,500
37.11%
6
9
50.00%
$3,362,500 (Realtor Multi-Listing Service Statistics) 10
2016 Q3
2017 Q3
%
2016 Totals
Active
23
18
-21.74%
25
Low Sale
SN Lodge Spa
$305,000
Pending
32
27
-15.63%
43
Med Sale
Terra II
$1,012,500
Units Sold
27
23
-14.81%
38
High Sale
Shooting Star
$4,250,000
$1,220,957
$1,488,370
21.90%
$1,288,682
2016 Top Sale
4 Seasons
$5,500,000
$845,480
$950,000
12.36%
$910,000
New Listings
30
30
0.00%
43
Building Sites
2016 Q3
2017 Q3
%
2016 Totals
Active
5
4
-20.00%
5
Low Sale
Curtis Drive
$1,250,000
Pending
7
4
-42.86%
8
Med Sale
Granite Ridge Rd
$1,925,000
Units Sold
6
3
-50.00%
9
High Sale
Shooting Star
$3,500,000
Avg Sold Price
$2,726,667
$2,225,000
-18.40%
$2,606,000
2016 Top Sale
Granite Ridge
$3,800,000
Median Sold Price
$2,700,000
$1,925,000
-28.70%
$2,700,000
3
6
100.00%
4
New Listings Multi Family Homes
Avg Sold Price Median Sold Price
New Listings
2017 Highlights
2017 Highlights
2017 Highlights
* Sales price was “undisclosed�, 92% of list price was used. *Information herein is deemed reliable but not guarenteed. Data is relative to the whole market and may not reflect every sale.
NORTH OF WILSON (EXCLUDING TETON VILLAGE, Realtor Multi-Listing Service Statistics)
Sales are down 30% North of Wilson, excluding the Village. Single Family Homes
2016 Q3
2017 Q3
%
2016 Totals
Active
35
36
2.86%
24
Low Sale
Town of Wilson
$1,105,000
Pending
29
23
-20.69%
38
Med Sale
Teton Pines Timbers
$2,650,000
Units Sold
26
20
-23.08%
35
High Sale
John Dodge
$6,850,000*
Avg Sold Price
$1,902,658
$2,871,138
50.90%
$1,999,171
2016 Top Sale
Lazy Moose Ranch
$8,735,400*
Median Sold Price
$1,522,500
$2,533,875
66.43%
$1,640,000
43
44
2.33%
2016 Q3
2017 Q3
%
2016 Totals
Active
24
11
-54.17%
3
Low Sale
Aspens
$390,000
Pending
28
19
-32.14%
35
Med Sale
Aspens
$659,000
Units Sold
23
14
-39.13%
31
High Sale
Aspens
$1,350,000
Avg Sold Price
$570,594
$689,834
20.90%
$601,596
2016 Top Sale
Teton Pines
$1,875,000
Median Sold Price
$550,000
$664,500
20.82%
$550,000
New Listings
47
30
-36.17%
Building Sites
2016 Q3
2017 Q3
%
2016 Totals
Active
12
10
-16.67%
8
Low Sale
Teton Pines / Timbers
$400,000
Pending
10
5
-50.00%
10
Med Sale
Teton Pines
$1,200,000
Units Sold
9
6
-33.33%
9
High Sale
John Dodge
$2,910,000
Avg Sold Price
$1,264,658
$1,505,250
19.02%
$1,264,278
2016 Top Sale
Wilderness Ranch
$3,496,000*
Median Sold Price
$1,200,000
$1,231,250
2.60%
$1,200,000
16
14
-12.50%
17
New Listings Multi-Family Homes
New Listings
2017 Highlights
2017 Highlights
2017 Highlights
* Sales price was “undisclosed”, 92% of list price was used. *Information herein is deemed reliable but not guarenteed. Data is relative to the whole market and may not reflect every sale.
SOUTH OF WILSON (Realtor Multi-Listing Service Statistics)
Due to inventory, South of Wilson sales are down 37% yet homesites sales are up 50%. Single Family Homes
2016 Q3
2017 Q3
%
2016 Totals
Active
26
15
-42.31%
15
Low Sale
Indian Paintbrush
$760,000
Pending
15
13
-13.33%
2016 Totals
Med Sale
Indian Paintbrush
$960,000
Units Sold
16
10
-37.50%
19
High Sale
Indian Paintbrush
$2,875,000*
Avg Sold Price
$1,798,781
$1,284,300
-28.60%
$1,898,500
2016 Top Sale
Crescent H
$7,268,000*
Median Sold Price
$1,400,000
$1,030,000
-26.43%
$1,475,000
29
23
-20.69%
32
2016 Q3
2017 Q3
%
2016 Totals
Active
0
0
0.00%
0
Low Sale
Pending
0
0
0.00%
0
Med Sale
Units Sold
0
0
0.00%
0
High Sale
Avg Sold Price
$0
$0
0.00%
$0
2016 Top Sale
Median Sold Price
$0
$0
0.00%
$0
New Listings
0
0
0.00%
0
Building Sites
2016 Q3
2017 Q3
%
2016 Totals
Active
17
18
5.88%
16
Low Sale
Pineglen
$370,000
Pending
5
7
40.00%
5
Med Sale
Indian Paintbrush
$795,000
Units Sold
4
6
50.00%
5
High Sale
Wilson Prairie
$2,300,000
Avg Sold Price
$1,352,500
$968,333
-28.40%
$3,639,600
2016 Top Sale
Fall Creek Rd
$12,788,000*
Median Sold Price
$1,077,500
$710,000
-34.11%
$1,600,000
11
16
45.45%
13
New Listings Multi-Family Homes
New Listings
2017 Highlights
2017 Highlights
2017 Highlights
* Sales price was “undisclosed�, 92% of list price was used. *Information herein is deemed reliable but not guarenteed. Data is relative to the whole market and may not reflect every sale.
CENTRAL VALLEY
(SNAKE RIVER TO THE ELK REFUGE & HWY 22 NORTH TO SAGEBRUSH, Realtor Multi-Listing Service Statistics)
Central Valley inventory is weakening with sales increasing across the board. C.V. multi family homes new listing attrition is non-existent, 83% down. Single Family Homes
2016 Q3
2017 Q3
%
2016 Totals
Active
33
24
-27.27%
19
Low Sale
Gros Ventre W
$900,000
Pending
12
12
0.00%
22
Med Sale
Skyline
$1,520,000
Units Sold
11
16
45.45%
19
High Sale
Indian Springs
$6,700,000*
Avg Sold Price
$3,974,227
$2,558,775
-35.62%
$3,970,342
2016 Top Sale
Indian Springs
$10,250,000
Median Sold Price
$3,175,000
$1,867,500
-41.18%
$2,800,000
30
4
-86.67%
2016 Q3
2017 Q3
%
2016 Totals
Active
5
2
-60.00%
4
Low Sale
Teton Shadows
$605,000
Pending
3
3
0.00%
6
Med Sale
Harvest Dance
$635,000
Units Sold
5
4
-20.00%
6
High Sale
JHG&T Cabin
$1,895,000
Avg Sold Price
$904,000
$973,125
7.65%
$879,500
2016 Top Sale
Spirit Dance
$1,900,000
Median Sold Price
$660,000
$696,250
5.49%
$748,000
New Listings
6
1
-83.33%
Building Sites
2016 Q3
2017 Q3
%
2016 Totals
Active
51
43
-15.69%
38
Low Sale
N US-89 HWY
$273,423
Pending
13
12
-7.69%
14
Med Sale
JHG&T (Old)
$535,000
Units Sold
7
11
57.14%
9
High Sale
E Gros Ventre Butte
$5,520,000*
Avg Sold Price
$2,129,286
$1,416,566
-33.47%
$1,940,333
2016 Top Sale
Bar BC East
$7,360,000*
Median Sold Price
$1,150,000
$1,100,000
-4.35%
$1,150,000
38
29
-23.68%
40
New Listings Multi Family Homes
New Listings
2017 Highlights
2017 Highlights
2017 Highlights
* Sales price was “undisclosed”, 92% of list price was used. *Information herein is deemed reliable but not guarenteed. Data is relative to the whole market and may not reflect every sale.
NORTH VALLEY
(SAGEBRUSH DRIVE NORTH TO MORAN & SNAKE RIVER EAST TO KELLY, Realtor Multi-Listing Service Statistics)
Single family inventory maintains yet sales dip 21%. Bulding sites off 49% avg sales price. Single Family Homes
2016 Q3
2017 Q3
%
2016 Totals
Active
22
24
9.09%
17
Low Sale
Kelly
$3,775,000
Pending
15
12
-20.00%
17
Med Sale
Grand Teton Circle
$5,000,000
Units Sold
14
11
-21.43%
19
High Sale
Bar B Bar
$7,268,000*
Avg Sold Price
$1,446,170
$2,036,682
40.83%
$1,727,231
2016 Top Sale
Kelly
$7,775,000*
Median Sold Price
$1,090,000
$1,219,000
11.83%
$1,280,000
25
20
-20.00%
28
2016 Q3
2017 Q3
%
2016 Totals
New Listings Multi-Family Homes Active
2017 Highlights
2017 Highlights
There are rarely any Mutli-Family units sold in this area
Pending Units Sold Avg Sold Price Median Sold Price New Listings Building Sites
2016 Q3
2017 Q3
%
2016 Totals
Active
40
33
-17.50%
30
Low Sale
Pacific Creek
$1,250,000
Pending
11
9
-18.18%
13
Med Sale
Moulton Loop
$1,925,000
Units Sold
10
8
-20.00%
11
High Sale
Owl Creek
$3,500,000
Avg Sold Price
1,580,400
$795,000
-49.70%
$1,490,364
2016 Top Sale
Grand Teton Ranch
$3,800,000*
Median Sold Price
$951,000
$837,500
-11.93%
$890,000
25
15
-40.00%
25
New Listings
2017 Highlights
* Sales price was “undisclosed”, 92% of list price was used. *Information herein is deemed reliable but not guarenteed. Data is relative to the whole market and may not reflect every sale.
TOWN OF JACKSON (Realtor Multi-Listing Service Statistics)
Town of Jackson is the most flat sub-market in the area. Single Family Homes
2016 Q3
2017 Q3
%
2016 Totals
Active
29
32
10.34%
21
Low Sale
Cottonwood
$540,000
Pending
49
43
-12.24%
63
Med Sale
Cottonwood
$984,900
Units Sold
44
43
-2.27%
62
High Sale
Gill Addition
$2,075,000*
$1,024,731
$1,062,121
3.65%
$988,488
2016 Top Sale
Keats Grove
$4,600,000
$772,500
$984,900
27.50%
$775,000
61
67
9.84%
74
2016 Q3
2017 Q3
%
2016 Totals
Active
31
30
-3.23%
19
Low Sale
Ponderosa Village
$280,000
Pending
77
81
5.19%
94
Med Sale
Coulter Ave
$530,000
Units Sold
68
65
-4.41%
93
High Sale
Pine Glades
$1,970,000
Avg Sold Price
$639,887
$620,538
-3.02%
$632,746
2016 Top Sale
Pearl at Jackson
$1,850,000
Median Sold Price
$494,150
$535,000
8.27%
$496,800
New Listings
101
105
3.96%
109
Building Sites
2016 Q3
2017 Q3
%
2016 Totals
Active
11
11
0.00%
17
Low Sale
Indian Trails
$575,000*
Pending
9
10
11.11%
11
Med Sale
Gill Addition
$657,800*
Units Sold
9
7
-22.22%
11
High Sale
Glenwood St
$2,346,000*
$1,029,444
$1,049,186
1.92%
$932,000
2016 Top Sale
Snow King Ave
$1,400,000
$885,000
$687,700
-22.29%
$635,000
12
15
25.00%
23
Avg Sold Price Median Sold Price New Listings Multi-Family Homes
Avg Sold Price Median Sold Price New Listings
2017 Highlights
2017 Highlights
2017 Highlights
* Sales price was “undisclosed�, 92% of list price was used. *Information herein is deemed reliable but not guarenteed. Data is relative to the whole market and may not reflect every sale.
SOUTH OF JACKSON (Realtor Multi-Listing Service Statistics)
South of Town multi-family and building sites are the market leaders of increasing activity. Single Family Homes
2016 Q3
2017 Q3
%
2016 Totals
Active
50
49
-2.00%
29
Low Sale
Rafter J
$600,000
Pending
40
32
-20.00%
55
Med Sale
Melody Ranch
$1,075,000
Units Sold
34
29
-14.71%
52
High Sale
3 Creek Ranch
$4,050,000
Avg Sold Price
$1,132,874
$1,383,647
22.14%
$1,393,033
2016 Top Sale
Ely Springs
$8,188,000*
Median Sold Price
$1,004,000
$1,075,000
7.07%
$1,015,000
80
77
-3.75%
84
2016 Q3
2017 Q3
%
2016 Totals
Active
5
1
-80.00%
2
Low Sale
Rafter J
$520,000
Pending
10
6
-40.00%
8
Med Sale
Rafter J
$577,500
Units Sold
5
9
80.00%
6
High Sale
Rafter J
$700,000
Avg Sold Price
$612,850
$603,611
-1.51%
$624,375
2016 Top Sale
Rafter J
$644,250
Median Sold Price
$610,000
$600,000
-1.64%
$627,125
New Listings
10
8
-20.00%
15
Building Sites
2016 Q3
2017 Q3
%
2016 Totals
Active
49
34
-30.61%
45
Low Sale
Rafter J
$300,000
Pending
12
22
83.33%
13
Med Sale
Melody Ranch
$620,000
Units Sold
8
21
400.00%
13
High Sale
3 Creek Ranch
$3,036,000*
Avg Sold Price
$843,375
$858,829
1.83%
$868,146
2016 Top Sale
SR Sport Club
$2,479,000*
Median Sold Price
$639,100
$650,000
1.71%
$653,200
35
34
-2.86%
38
New Listings Multi-Family Homes
New Listings
2017 Highlights
2017 Highlights
2017 Highlights
* Sales price was “undisclosed�, 92% of list price was used. *Information herein is deemed reliable but not guarenteed. Data is relative to the whole market and may not reflect every sale.
All Properties MLS
2016 Q3
2017 Q3
%
2016 Totals
Active
471
403
-14.44%
347
Pending
392
348
-11.22%
473
332 $1,242,480
311 $1,238,934
-6.33% -0.29%
452 $1,359,270
$850,000
$894,500
5.24%
$875,000
611
587
-3.93%
690
Units Sold Avg Sold Price Median Sold Price New Listings
* Sales price was “undisclosed�, 92% of list price was used. *Information herein is deemed reliable but not guarenteed. Data is relative to the whole market and may not reflect every sale.
ALL OF TETON COUNTY Single Family Homes
2016 Q3
2017 Q3
%
2016 Totals
Active
198
189
-4.55%
132
Low Sale
Kelly
$503,000
Pending
173
140
-19.08%
219
Med Sale
Town of Wilson
$1,250,000
Units Sold
150
133
-11.33%
211
High Sale
Teton Village
$7,268,000*
Avg Sold Price
$1,612,392
$1,794,132
11.27%
$1,753,942
2016 Top Sale
Indian Springs
$10,250,000
Median Sold Price
$1,123,161
$1,263,500
12.50%
$1,123,161
274
279
1.82%
307
New Listings
SINGLE FAMILY HOMES SOLD Q3 2017
Multi-Family Homes
2017 Highlights
96
29
8
$0 - $2M
$2M - $5M
$5M-$8M
2016 Q3
2017 Q3
%
2016 Totals
Active
88
62
-29.55%
56
Low Sale
Ponderosa Village
$280,000
Pending
154
139
-9.74%
180
Med Sale
Spring Creek
$635,000
Units Sold
2017 Highlights
129
116
-10.08%
174
High Sale
Shooting Star
$4,250,000
Avg Sold Price
$764,250
$812,372
6.30%
$778,667
2016 Top Sale
Four Seasons
$5,500,000
Median Sold Price
$570,000
$622,500
9.21%
$577,500
197
179
-9.14%
223
New Listings
MULTI FAMILY HOMES SOLD Q3 2017
Building Sites
93
16
7
$0 - $1M
$1M - $2M
$2M+
2016 Q3
2017 Q3
%
2016 Totals
Active
185
152
-17.84%
159
Low Sale
N US-89 HWY
$273,423
Pending
65
69
6.15%
74
Med Sale
Bluebell
$759,000*
Units Sold
53
62
16.98%
67
High Sale
E Gros Ventre
$5,520,000*
Avg Sold Price
$1,506,972
$1,110,297
-26.32%
$1,618,290
2016 Top Sale
Fall Creek
$12,788,000*
Median Sold Price
$1,150,000
$797,500
-30.65%
$1,100,000
140
129
New Listings BUILDING SITES SOLD Q3 2017
-7.86% 53 $0 - $2M
2017 Highlights
160
8
1
$2M - $5M
$5M+
* Sales price was “undisclosed”, 92% of list price was used. *Information herein is deemed reliable but not guarenteed. Data is relative to the whole market and may not reflect every sale.
CHRISTIE’S ART & ARCHITECTURE
Established in London more than 240 years ago by James Christie, the auction house today is a renowned international organization that conducts some of the most important auctions in the world. The Christie’s brand exudes quality and prestige, while honoring the traditional values established throughout its illustrious history. An inventive lead-generation system between Christie’s and Christie’s International Real Estate creates a mutually beneficial synergy between art and real estate, building a world-class platform for the highly targeted marketing of distinguished properties. CHRISTIES.COM
Christie’s Education is unique in being wholly owned by Christie’s Auction House, signaling the importance Christie’s places on practical experience of art through education as the key to professional success. As the only major auction house to directly offer degree and non-degree programmes, Christie’s Education continue to follow the principles of hands-on exposure to art, immersing our students in the art world from the beginning of their studies.
CHRISTIE’S EDUCATION
CHRISTIE’S INTERNATIONAL REAL ESTATE
CHRISTIES.EDU
Supported by the esteemed art auction house, Christie’s International Real Estate is a global network offering exclusive home and luxury real estate services to buyers and sellers worldwide. The Christie’s brand is instantly recognizable to clients and distinguishes your property from others. We focus exclusively on luxury residential real estate and understand how to reach and serve discerning clientele. Along with this expertise, we offer you the tailored, trusted service that our clients have depended on for 250 years, collaboration with our auction house colleagues, and referrals from our network of the world’s top brokers. CHRISTIESREALESTATE.COM
Christie’s Travel in association with Abercrombie & Kent, is dedicated to connecting clients with the most important milestone events, masterpiece works and collections, as well as undiscovered artists and trends that comprise the multi-national world of Art today. This unique travel program is made possible through the powerful combination of Christie’s 250 years’ experience in the art market, and offices in 32 countries with leading experts in over 60 Art departments.
CHRISTIE’S TRAVEL
CHRISTIES.COM/TRAVEL
M AR K E T HIGHLIGHTS SALES DISTRIBUTION BY SEGMENT
220
SINGLE FAMILY
36%
TRANSACTIONS UNDER $1 MILLION
CONDO/TOWNHOME
36%
VACANT LAND
19%
151
26
OTHER
10%
TRANSACTIONS $1-5 MILLION
SALES DISTRIBUTION BY PRICE
TRANSACTIONS $5 MILLION+
UNDER $500K
18%
37%
26%
HIGHEST SALE $53,000,000
*List Price
LOWEST SALE $273,423 (14% increase) *statistics are cumulative Q1-Q3
12%
7%
$500K-$1M
$1M-$2M
$2-$5M
OVER $5M
Q3 2017 Overall Market
When comparing the first three quarters of 2017 to the same period in 2016, the Jackson Hole real estate market remained steadfast. With inventory in short supply (down 11%), the number of transactions kept pace with last year. Nonetheless, demand for property in Jackson Hole remained very strong, which contributed to the increase in average sale price. The price segment with the most market share was the $500,000 - $1 million price segment with 37% of total transactions. The Town of Jackson had a 7% increase in transactions. The area furthest south of Jackson experienced the largest increase in transactions, up about 50% over last year. Approximately 43% of the transactions this year were cash transactions. The overall market continued to experience a lack of inventory, down 11%. New, realistically-priced properties sold the quickest. In fact, the average number of days a property was on the market dropped 28% when compared to a year ago.
463
TOTAL NUMBER OF TRANSACTIONS Q3 2017
-1% decrease
compared to Q3 2016
$1,546,025
AVERAGE SALE PRICE Q3 2017
$875,000 0% change
compared to Q3 2016
17% increase
compared to Q3 2016
MEDIAN SALE PRICE Q3 2017
-11%
DECREASE IN INVENTORY
SOLD | List Price: $2,200,000 | North of Jackson
Q3 2017 Single Family
# of Single Family Transactions 165
The number of single family home transactions dropped by about 13% when compared to the same period in 2016. However, prices continued to rise with the median home price reaching over $1,250,000. As home prices rise, buyers are looking toward comparatively priced vacant land. The majority of single family transactions (41%) were in the $1 million-$2 million price segment. The number of homes under contract was up 22% over last year.
% Change in Transactions from 2016 -13% Minimum Price Sold $503,000 Maximum Price Sold $53,000,000 Average Sale Price $2,086,799 Median Sale Price $1,252,500
-13%
NUMBER OF TRANSACTIONS
*statistics are cumulative Q1-Q3
7%
TOTAL DOLLAR VOLUME
25%
AVERAGE SALE PRICE
-1%
INVENTORY
Average Days on the Market 211 # Pending Transactions 33
*List Price
Q3 2017 Condominium & Townhome
# of Condominium/Townhome Transactions 168
Condominium/townhome transactions increased modestly from last year, up about 4%. The average sale price experienced a large increase, up about 57%, primarily due to the completion of many pre-sold “cabins” in the Shooting Star development in Teton Village. The condominium/townhome segment was unquestionably the most competitive segment of the market. The perpetually low inventory coupled with the strong demand for affordable housing drove the average number of days on market down 43%. Based on the number of active listings at the time this report was written, there was less than 3 months’ worth of inventory on the market.
% Change in Transactions from 2016 4% Minimum Price Sold $280,000 Maximum Price Sold $6,500,000 Average Sale Price $1,202,390 Median Sale Price $600,000
4%
NUMBER OF TRANSACTIONS
55%
TOTAL DOLLAR VOLUME
57%
AVERAGE SALE PRICE
-22% INVENTORY
Average Days on the Market 123 # Pending Transactions 24
SOLD | List Price: $1,012,500 | Teton Village
SOLD | List Price: $1,295,000 | North of Jackson
Q3 2017 Vacant Land
# of Vacant Land Transactions 86
The number of vacant land transactions continued to out pace the previous year, up about 13%. The average and median sale prices were both down. This was due to a shift in the price segment where transactions took place. Over 43% of the transactions took place in the $500,000-$1 million price segment, which was more than double the amount when compared to this time last year. Following suit with the overall market, the number of active listings and average number of days on the market dropped.
% Change in Transactions from 2016 13% Minimum Price Sold $273,423 Maximum Price Sold $10,000,000 Average Sale Price $1,152,313 Median Sale Price $760,000
13%
NUMBER OF TRANSACTIONS
*statistics are cumulative Q1-Q3
-6%
TOTAL DOLLAR VOLUME
-17% AVERAGE SALE PRICE
-21% INVENTORY
Average Days on the Market 409 # Pending Transactions 16
*List Price
Q3 2017 Luxury
# of Luxury Transactions 35
The luxury segment, defined as transactions over $3 million, remained steady through the first three quarters of 2017 compared to a year ago with only 1 additional transaction. While the average sale price appeared to have a 25% increase, this figure was skewed by a luxury home transaction in Wilson, Wyoming listed at $53 million. There were 6 vacant land transactions and 29 luxury home transactions. The vast majority of transactions took place in Teton Village. In contrast to other segments of the market, buyers in the luxury market overwhelmingly prefer cash transactions. Over 68% of the buyers in this segment purchased with cash. There were 12 luxury listings under contract at the time this report was written. Note: In the luxury segment, the small number of transactions affects any comparison on a percentage basis.
% Change in Transactions from 2016 3% Minimum Price Sold $3,050,000 Maximum Price Sold $53,000,000
*List Price
Average Sale Price $5,821,210 Median Sale Price $4,050,000 Average Days on the Market 345
3%
NUMBER OF TRANSACTIONS
26%
TOTAL DOLLAR VOLUME
25%
# Pending Transactions 12
AVERAGE SALE PRICE
SOLD | List Price: $3,995,000 | North of Town
The NeVille Group – Named Top Producing Sales Team of Jackson Hole Real Estate Associates, and Exclusive Affiliate of Christie’s International Real Estate, The NeVille Group is compromised of successful, dedicated and experienced professionals, backed by years of luxury sales success, global connections, and the largest real estate brokerage in the region. The NeVille Group understands the Jackson Hole market, is globally connected, and locally respected. Jackson Hole Real Estate Associates – The region’s largest and most progressing real estate brokerage in Jackson Hole and the area. The collection of properties, and expertise is unsurpassed and represents some of the most unique and soughtafter real estate in the world. Christie’s International Real Estate – A global network of top brokerages dedicated to the marketing and sale of luxury residential properties. Access covers a worldwide audience of more than 1,350 real estate offices in 47 countries and transactions resulting in over $113 billion in sales annually.
270 West Pearl Ave, Suite 101 Jackson, WY 83001
WWW.TNGJH.COM