4 minute read
What Are Our Grey Costs Per Trade In 2022?


In April / May 2022, the ValueExchange understood its second “Grey Costs per Trade” research campaign – to provide statistical clarity on what our post-trade costs look like today and to map out how those costs are changing. As a truly global initiative (run with the support of The Network Forum as well as ACSA, ASIFMA, AFME, the DTCC, Smartstream and TMX), the campaign brings together views from market participants across all stages of the investment cycle – based on both statistical surveybased data and outputs from extensive industry working sessions.
The Key Findings from this research are available to download at https://thevx.io/campaign/grey-costs-per-trade/ but, if you only have time to remember five points from our research, these would be:
1. We still don’t have a clear view of our costs per trade
In 2020, our research highlighted that half our industry was failing to track 29% of the costs of a trade. On the basis that we can’t fix what we don’t see, we are carrying a hidden, 30% margin of error in the efficiency of our cost management efforts.

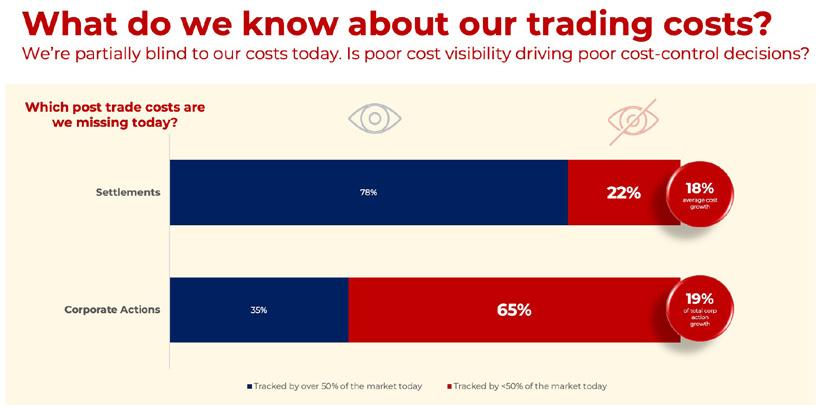
The story is a little more nuanced in 2022. Today, half of us is missing 22% of the costs of a settlement – as we continue to overlook the costs of exception handling and the cost of risk in our volumetrics. We have made huge progress in measuring our standard processing costs (our market fees, our unitised people-costs and our system spend) – but our visibility diminishes quickly when the settlement fails to match.
That cost visibility continues to diminish as we move further into the back office and into the world of asset servicing –where half the market is failing to track 65% of the cost of processing a corporate action. In the highly manual world of event processing, very few of us can even agree on which costs to even track (beyond business-as-usual staffing costs, data sourcing costs and IT spend) – making benchmarking and transparent comparisons almost impossible between teams and firms. We can’t reliably say what good looks like for corporate actions today.
2. Costs of a Settlement: Is it all about fees?

Against this backdrop of overlooked costs, it is not surprising that we consider market and custodian fees to be the largest cost that we bear in an average settlement – ranging from 26% of a settlement in North America, to 29% in Europe and 36% in Asia-Pacific. These costs are more than double the staff and treasury costs of a settlement and clearly justify significant attention – if two-fifths of the cost to an investor in a transaction is generated by the marketplace.
Mos impacted by these fees are broker dealers – for whom fees make up 47% of their settlement costs today and for whom the cost of fees are growing by 30% year-on-year. Given their transactional business model, this rapidly escalating cost base is a great cause for concern – brokers need urgently to find ways to optimise their fee structures if they are to find a sustainable path to growth.
3. The full cost of settlement discipline
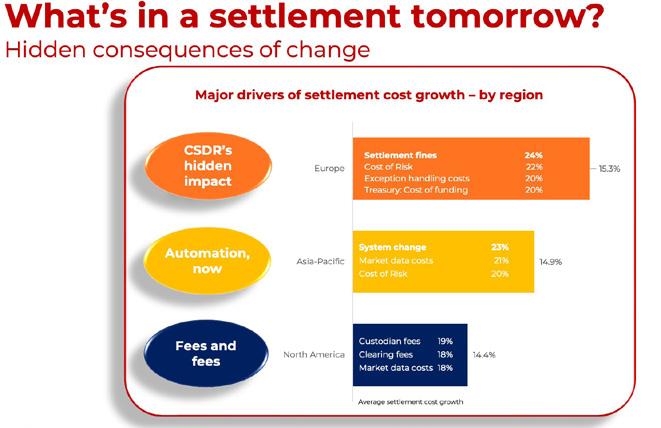
This urgency is especially acute in Europe, where the full impact of CSDR is becoming increasingly clear. For European market participants, the cost of settlement fines is the #1 driver of cost growth in 2022 – but what is important is that the associated costs of settlement fails are also rising at a rate of 20% or more. Beyond just the direct cost of the fail, Europeans face an escalating cost of risk, spiralling exception-handling costs and increasing costs of funding. There is much more to CSDR’s impact than what we see in the latest reports and – with no fails regimes being considered in Canada and other markets – we clearly need to improve our end-to-end cost tracking for fails if we are to scale in this new regulatory environment.
5. Mid-tier: a risk hot-spot
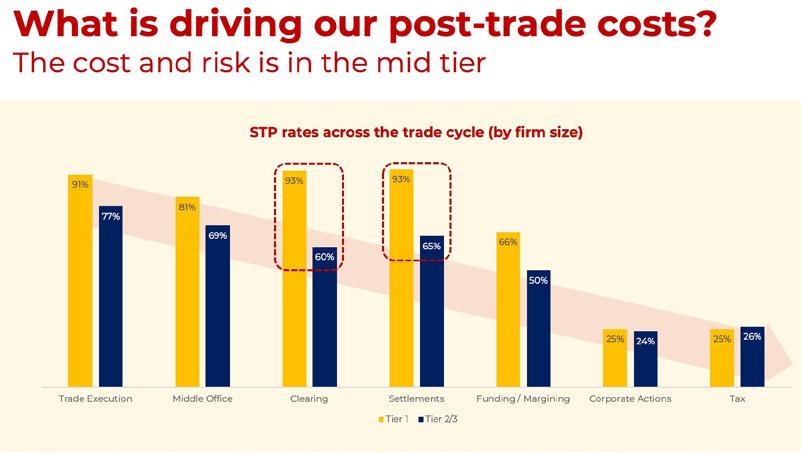
Finally, the disparity in STP rates globally between tier-one firms and mid-tier firms is a significant cause for concern – in the banking and brokerage space especially. Whilst the average STP rate for a settlement is 93% for tier one banks and brokers, their mid-tier equivalents struggle to reach levels of 65% in major markets. By the time we reach the world of asset servicing, STP rates are around 25% globally.
In an era of accelerated settlements (notably T+1), settlement discipline (CSDR), shareholder disclosure rules (SRD II) and the War for Talent, this underlying lack of automation in the mid-tier presents a major market risk. Whilst the average tier 1 organisation is able to meet these challenges by increasing technology investments into settlements by up to 10% year on year (and by over 20% in corporate actions), their smaller peers are unable to match these same spending levels and hence are likely to fall further behind in their automation and cost control. As this cost gap widens significantly in the years ahead, we look set to see continued consolidation and mutualisation.
Benchmark your own costs per trade today
Do these points resonate with your cost base today? Don’t miss the chance to benchmark your own post-trade costs with those of your peers and industry leaders. Click here to complete our online survey and to receive your own, personalised benchmarking scorecard from the ValueExchange.
4. Corporate actions – the hidden cost of people
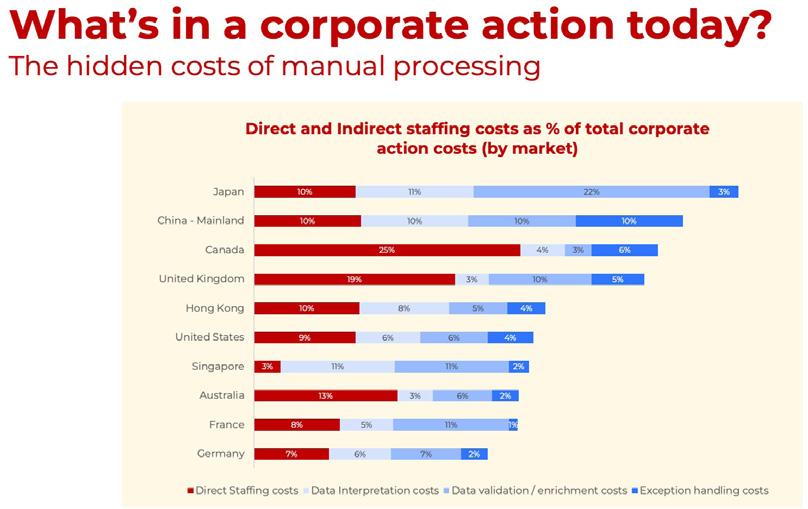
As our previous studies have highlighted, the central theme in corporate actions continues to be our under-estimation of our manual processing costs. At first glance, we believe that around 9% of the costs of a corporate action are due to direct staffing costs – but when we dig beyond the headlines we can see that a further 18% percent of corporate action costs are driven by people-based tasks (including data entry, validation and exception handling).
In truth, around a quarter of the costs of a corporate event is people-based today – and that disparity between visible and hidden staffing costs appears to be strongest in Asia-Pacific (where costs direct costs are around a quarter of the true, human costs of processing). Given that these same costs are growing by around 26% year-on-year, we need to be very careful to see past our direct headcount allocations and to measure the true, human costs of a corporate action.


