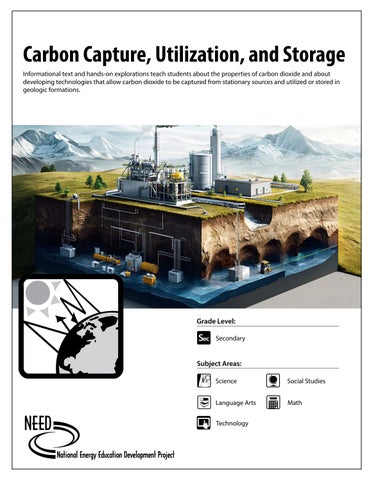
Carbon Capture, Utilization, and Storage Informational text and hands-on explorations teach students about the properties of carbon dioxide and about developing technologies that allow carbon dioxide to be captured from stationary sources and utilized or stored in geologic formations.
Pri Ele
Int
Grade Level:
Sec Secondary Subject Areas: Science
Social Studies
Language Arts
Math
Technology
NEED Mission Statement The mission of The NEED Project is to promote an energy-conscious and educated society by creating effective networks of students, educators, business, government, and community leaders to design and deliver objective, multi-sided energy education programs.
Permission to Copy NEED curriculum is available for reproduction by classroom teachers only. NEED curriculum may only be reproduced for use outside the classroom setting when express written permission is obtained in advance from The NEED Project. Permission for use can be obtained by contacting info@need.org.
Energy Data Used in NEED Materials NEED believes in providing teachers and students with the most recently reported, available, and accurate energy data. Most statistics and data contained within this guide are derived from the U.S. Energy Information Administration. Data is compiled and updated annually where available. Where annual updates are not available, the most current, complete data year available at the time of updates is accessed and printed in NEED materials. To further research energy data, visit the EIA website at www.eia.gov.
Teacher Advisory Board
Teacher Advisory Board Constance Beatty Kankakee, IL
Robert Lazar Albuquerque, NM
La’Shree Branch Highland, IN
Melissa McDonald Gaithersburg, MD
Jim M. Brown Saratoga Springs, NY
Paula Miller Philadelphia, PA
Mark Case Randleman, NC
Hallie Mills St. Peters, MO
Lisa Cephas Philadelphia, PA Nina Corley Galveston, TX Samantha Danielli Vienna, VA
1.800.875.5029 Jennifer Mitchell www.NEED.org Winterbottom Pottstown, PA © 2026
Monette Mottenon Montgomery, AL
Mollie Mukhamedov Port St. Lucie, FL In support of NEED, the national Teacher Advisory Board (TAB) is dedicated to developing, Shannon Donovanimproving, and promoting standards-based, effective energy curriculum, training, and outreach. NEED thanks these individuals forRItheir support and collaboration. Greene, Cori Nelson Winfield, IL Greg Schanne Paula Miller, M.Ed Samantha Danielli, M.Ed Adebisi Babayemi, M.Ed, NBCT Michelle Garlick Philadelphia, PAJr. Philadelphia, PALong Grove, IL Vienna, VA Bowie, MD Don Pruett Amy Schott, M.Ed, Hallie Mills, Ed.D Jennifer Davis, M.Ed La’Shree Branch Puyallup, WA NBCT Raleigh, NC Sammamish, WA Cincinnati, OH Highland, IN Michelle Gay Kristin M.Ed Jennifer Mitchell-Winterbottom, M.Ed, WT Michelle Garlick, M.Ed James M. Brown, NBCT, CEM, BOC Daphne, AL JudySlota, Reeves Yardley, PA Pottstown, PA Saratoga Springs, NY Cary, IL Lake Charles, LA Brandon Staton Nancy Gifford, M.S. Mollie Mukhamedov Karely Carlos, M.S. Nancy Gifford Port St. Lucie, FL Thomasville, NC Harwich, MA Lodi, CA Harwich, MA Libby Robertson Matthew Reis, Ph.D Jennifer Trochez Mark Case, M.S. Erin Gockel, M.Ed Chicago, IL MacLean, M.Ed, NBCT Farmington, NM Chía, ColombiaErin Gockel Los Angeles, CA Randleman, NC Scott Valenta Greg Holman Craig Richard, M.Ed Lisa Cephas, M.Ed Farmington, NM Amy Schott Winfi eld, IL NC Philadelphia, PA Paradise, CA Atkinson, NH Raleigh, Libby Robertson Nina Corley Melissa King, MLIS Robert Griegoliet Chicago, IL Galveston, TX Gaithersburg, MD Naperville, IL Tom Spencer Chesapeake, VA Eric Havel Oakland, CA Jennifer Trochez MacLean NEED teachers eventually must retire from the classroom, but many remain engaged in their communities and with NEED curriculum, training, and DaNel Hogan Los Angeles, CA outreach activities. NEED thanks these individuals for their continued support and collaboration. Tucson, AZ Constance Beatty Barbara Lazar, M.Ed Cori Nelson Judy Reeves Wayne Yonkelowitz Kankakee, IL Albuquerque, NM Hinckley, IL Holman Lake Charles, LA Greg Fayetteville, WV Paradise, CA Melinda Forist Robert Lazar Don Pruett, Jr., M.Ed Wayne Yonkelowitz, M.Ed, NBCT,
NEED TAB Emeriti
Wellfleet, MA
Albuquerque, NM
Puyallup, WA
Barbara Lazar Albuquerque, NM
2
©2026
Milken Educator Fayetteville, WV
Carbon Capture, Utilization, and Storage
www.NEED.org
Carbon Capture, Utilization, and Storage Table of Contents As the United States and the global community work toward developing technologies and methods to mitigate the release of carbon dioxide, it is important for the public to understand the processes and technologies in place to do so. Carbon Capture, Utilization, and Storage (CCUS) is one advanced method for mitigating the release of carbon dioxide into the atmosphere from fossil fuel power stations. With this curriculum module and other NEED activities, we hope to help students, teachers, and their communities understand CCUS as a mitigation strategy and how it will impact energy supply, demand, and costs. Teaching about CCUS in the classroom helps students understand energy technologies, careers in the industry, and ways to be better energy consumers and decision makers.
Standards Correlation Information
4
Materials
5
Teacher Guide
6
Web Resources
16
Dry Ice Safety Master
17
North American Oil and Gas Reservoirs Master
18
Student Informational Text
19
Carbon Dioxide and CCUS KWL Chart
32
Carbon Footprint
33
Properties of CO2
34
Modeling Combustion
35
Separating Mixtures
36
Exploring Porosity
37
Enhanced Fuel Recovery Model
38
Carbon Sequestration Projects
42
Calcium Carbonate Precipitation
44
Glossary
46
Evaluation Form
51
This guide was originally created with the support of the United States Energy Association, and the U.S. Department of Energy.
©2026
Carbon Capture, Utilization, and Storage
www.NEED.org
3
Standards Correlation Information www.NEED.org/educators/curriculum-correlations
Next Generation Science Standards This guide effectively supports many Next Generation Science Standards. This material can satisfy performance expectations, science and engineering practices, disciplinary core ideas, and crosscutting concepts within your required curriculum. For more details on these correlations, please visit NEED’s curriculum correlations website.
Common Core State Standards This guide has been correlated to the Common Core State Standards in both language arts and mathematics. These correlations are broken down by grade level and guide title, and can be downloaded as a spreadsheet from the NEED curriculum correlations website.
Individual State Science Standards This guide has been correlated to each state’s individual science standards. These correlations are broken down by grade level and guide title, and can be downloaded as a spreadsheet from the NEED website.
4
©2026
Carbon Capture, Utilization, and Storage
www.NEED.org
Materials ACTIVITY
MATERIALS NEEDED
Carbon Footprint
4 lb. Bag of charcoal briquettes 1 Tall, white kitchen trash bag
Properties of CO2
5-10 lb. of dry ice (keep in foam cooler until ready to use) Work gloves Tongs Large, clear containers Plastic trays Bottle of bubbles Bottles of water
Modeling Combustion
Molecular modeling kits
Separating Mixtures
Salt Sand Gravel Beakers
Water Balances Variety of filter materials that may include screens, cheesecloth, newspaper, etc. Safety glasses
Exploring Porosity
Small gravel Medium gravel Coarse or large gravel 100 mL Graduated cylinders
600 mL Beakers Water Food coloring Safety glasses
Enhanced Fuel Recovery Model
Clear glass jars with tight lids Water Marbles Pebbles Stones Colored vegetable oil Dry ice or effervescent tablets Mason jars with lids Pieces of 24” by ¼” tubing
Empty water bottles Dark colored food dye Drill Safety glasses Tongs Silicone sealant Tape Tissue paper (optional)
Calcium Carbonate Precipitation
Clean test tubes with caps Test tube racks Beakers Full range pH paper with color scale Small bottles with lids Sodium carbonate Calcium chloride Pencils or markers Distilled water
Graduated cylinders Safety glasses 1 mL Pasteur pipettes Paper towels Filter paper (optional) Squirt bottles (optional) Small funnels (optional) Balance (optional)
©2026
Carbon Capture, Utilization, and Storage
www.NEED.org
Rubber balloons Pipe cleaners Tea light candles Matches 8 oz. Plastic cups Safety glasses Trash bags (optional)
5
Teacher Guide Grade Level Secondary, grades 9-12
Time 6-10 Class periods
: Web Resources A list of web resources can be found on page 16. Please preview all links, files, and resources before sharing with students.
Evaluation At the close of the unit, use the Evaluation Form on page 51 to evaluate the unit with your students.
& Unit Background Carbon capture is a process designed to capture carbon dioxide (CO2) emissions produced by coal, natural gas, and petroleum-fired power plants and store or reuse the emissions to prevent them from entering the atmosphere. By isolating the CO2, it can be transported in liquid form to storage in deep geologic formations or utilized in enhanced oil and natural gas recovery, enhanced coal bed methane recovery, or calcification. The combined capture, utilization, and storage make up CCUS.
@Science Notebooks This curriculum references and refers students to use science notebooks. Experimental questions, procedures, sample data tables, and conclusion questions are provided on the worksheets. If you do not use science notebooks, students will need paper to allow space for hypotheses, additional observations, data analysis, and drawing conclusions. Or, you may make copies of the student worksheets as needed.
Activity 1: Introduction Objectives Students will be able to define CCUS and explain its importance. Students will be able to describe CO2 and identify its role in climate concerns.
Materials Student Informational Text, pages 19-22 Carbon Dioxide and CCUS KWL Chart, page 32
Preparation Make a copy of the worksheet and text for each student.
Procedure
6
1.
Ask students to fill out what they know and questions they currently have about CO2. Ask students to identify what they think CCUS is and list it on their KWL chart.
2.
Have students read the informational text introduction and keep track of questions and new pieces of information they've learned through their reading.
3.
Discuss the information with the class and ask students to share what they learned.
4.
Decide if you will ask students to read the remaining text on their own or as a class, and if you would like them to read the text in chunks with their activities or all at once. Describe and assign how they will tackle this in the remaining lessons.
©2026
Carbon Capture, Utilization, and Storage
www.NEED.org
Activity 2: Carbon Footprint & Background This activity is an excellent way to use to set the stage for students as they begin to try to understand how much CO2 emissions are involved with everyday tasks. This activity can also be conducted later in the unit but may help students to understand the "why" of CCUS sooner.
Objective Students will be able to quantify and describe their individual carbon footprints.
Materials 4 lb. Bag of charcoal briquettes 1 Tall, white kitchen trash bag Carbon Footprint worksheet, page 33
2 Preparation Prior to the start of the activity, have students research uses for CO2 as homework. Encourage students to find ways CO2 is used in residential, industry, and medical settings. Students should make a list and bring the list with them to class. Gather the materials and cover the table where you will do the demonstration with the white trash bag.
Procedure 1.
Break students into small groups to brainstorm a list of uses for CO2 based on their findings from the homework assignment.
2.
Explain or review with students that CO2 is released into the atmosphere during fossil fuel combustion. This includes combustion from fossil fuel power plants generating electricity, from manufacturing processes, and from the burning of fossil fuels in vehicles.
3.
Explain that CO2 is usually found in its gaseous state. It is colorless and transparent. Even though we know CO2 impacts the environment, we do not always think about it because we cannot see it. Show students the bag of charcoal briquettes. The briquettes are made almost completely of carbon, so the briquettes will represent the amount of CO2 or carbon in one gallon of gas. The average gallon of gasoline contains about 5.5 pounds of carbon. There are about 75 briquettes in a four-pound bag. Dividing four pounds of carbon by 75 briquettes shows that one briquette represents about 0.05 pounds of carbon.
4.
Pass out the Carbon Footprint worksheet. Work through the sample problems as a class. Then, have students complete the rest of the worksheet individually, calculating their transportation carbon footprint. Note: If students do not know the fuel economy of their vehicles, use the website, www.fueleconomy.gov.
5.
Students should next calculate their household emissions using the Environmental Protection Agency’s Emissions Calculator at www3. epa.gov/carbon-footprint-calculator. It will be most accurate if students have an energy bill they can reference from their residence or a sample you provide.
6.
Facilitate a class discussion in which students identify items that might raise or lower their footprints and what challenges exist in doing so. Students should also reflect on why it is important to understand their carbon footprint and why it matters.
©2026
Carbon Capture, Utilization, and Storage
www.NEED.org
7
Activity 3: Properties of CO2 & Background This activity engages students in observing the behavior of CO2 in order to develop an understanding of its role in our climate system.
Objective Students will be able to list and describe properties of carbon dioxide.
Materials FOR A DEMONSTRATION OR FOR EACH GROUP Dry ice "cube" or chunk (keep in foam cooler until ready to use) Work gloves Tongs Large, clear container Plastic tray Bottle of bubbles Bottle of water Balloon Pipe cleaner
Tea light candle Matches 8 oz. Plastic cup Safety glasses Trash bag (optional) Dry Ice Safety, page 17 Properties of CO2 worksheet, page 34
2 Preparation Cover work surfaces with plastic trash bags or table coverings, if needed. Prepare a copy of Dry Ice Safety master to project for the class. Review the safety recommendations before handling any dry ice. Prepare a physical or digital copy of the worksheet for students. You may conduct this activity as a demonstration or gather enough containers, gloves, and tongs to allow small groups to work with the dry ice directly. If conducting the activity with students in groups, each group will need a piece of dry ice about the size of a large ice cube.
Procedure
8
1.
Project and discuss the safety instructions for working with dry ice.
2.
Place some dry ice on a plastic tray and place the tray of dry ice in the large, clear container.
3.
Explain that carbon dioxide (CO2) is usually found in its gaseous form. However, it also can be found in solid and liquid forms. Dry ice is frozen CO2, or CO2 in solid form. Review phase changes if helpful.
4.
Ask students, “What happens when frozen water warms up?” (It melts and turns into a liquid.) Next ask, “What do you think happens when frozen CO2 warms up?” Have students record or verbalize their predictions. Have students observe the dry ice for a few minutes. Students should record observations using pictures and words in their science notebooks or on the worksheet. Ask students to explain what they are seeing. Point out that CO2 does not exist as a liquid at atmospheric pressure. As solid CO2 thaws it transforms directly into a gas, or sublimes. CO2 exists as a liquid only under great pressure.
5.
Pour water onto the dry ice to produce enough CO2 gas to fill the container.
6.
Blow bubbles into the container. Have students record their observations and explain what is happening. After students have had time to write down their thoughts, explain that CO2 is more dense than air. Since the bubbles are filled with air—air is 78% nitrogen (N2) —they float on top of the CO2 gas collected in the container. As a challenge, you could also have them consult the periodic table and calculate the molecular mass of CO2 and N2.
7.
Light a tea candle. Using the plastic cup, collect some CO2 gas and pour it over the candle. Students should record what happens and explain what they saw. Explain that CO2 displaces the lighter oxygen. The CO2 is more dense than air (which contains 21% oxygen) and pushes the air away. The fire needs oxygen to continue burning so the fire is extinguished. This is why CO2 is used in fire extinguishers.
8.
Drop an ice cube-sized piece of dry ice into a bottle of water. Place a balloon over the mouth of the water bottle. Use a pipe cleaner as a twist tie around the balloon. Students should record observations and explain what happened. ©2026
Carbon Capture, Utilization, and Storage
www.NEED.org
Activity 4: Modeling Combustion & Background This activity is excellent for chemistry students, reinforcing chemical reactions, molecular modeling, and the combustion process. Students will also visualize the shape of carbon dioxide, which is important for understanding its behavior in the atmosphere.
Objectives Students will be able to draw the molecular structure of CO2. Students will be able to correctly write a chemical formula for the combustion of fossil fuels.
Materials FOR EACH GROUP Molecular modeling kit Modeling Combustion worksheet, page 35
Note If molecular modeling kits are not accessible, toothpicks and spherical objects of different colors and/or sizes can be a suitable substitute.
2 Preparation Make a copy of the worksheet for each student.
Procedure 1.
Remind students that energy in fossil fuels is stored in the form of hydrocarbons. A hydrocarbon is a compound containing only carbon and hydrogen atoms. For example, methane (CH4) is the simplest hydrocarbon molecule made of four hydrogen atoms and one carbon atom.
2.
Ask students how energy is released from hydrocarbons. (We burn them.) Combustion requires a fuel source, oxygen, and heat.
3.
Give students the Modeling Combustion worksheet. Let students work in groups to model hydrogen, oxygen, methane, and the products of combustion.
+ Combustion Formula of Methane CH4 + 2O2
©2026
CO2 + 2H2O
Carbon Capture, Utilization, and Storage
www.NEED.org
9
Activity 5: Separating Mixtures & Background In this inquiry-driven activity, students will use physical properties to model the separation of gases exiting a flue or stack in the flue stream of a power plant in carbon capture processes. In this simulation, a mixture of salt, sand, and gravel is used to represent mixed gases after combustion. Provide various sizes of beakers and types of filter materials and allow them to design their own experiment to separate the mixture.
Objective Students will be able to use physical properties to separate mixtures into individual parts.
Materials FOR EACH GROUP Salt/sand/gravel mixture Water Beakers (various sizes) Balance
A variety of filter materials that may include screens, cheesecloth, newspaper, etc. Safety glasses Separating Mixtures worksheet, page 36
2 Preparation Create a mixture of salt, sand, and gravel so that each group in your classroom will receive approximately 100g of material. About 40g should be sand. Make a copy of the worksheet for each student.
Procedurex 1.
Review the properties of carbon dioxide that students observed in the previous investigations. Explain how scientists use the physical and chemical properties of CO2 to separate it from other gases (nitrogen, water vapor, carbon monoxide, nitrogen oxides, and sulfur oxides) in a power plant’s flue stream or stack system.
2.
In the previous activities, students observed how carbon dioxide is more dense than air. It is also more dense than nitrogen or pure oxygen. It is less dense than sulfur dioxide. Other physical properties of CO2 include: • Relative to other gases (sulfur dioxide, oxygen, nitrogen, nitrous oxide), CO2 has a higher melting point, and will become a solid at –78 degrees Celsius at standard pressure (water vapor freezes at zero). • CO2 will not form a liquid at standard pressure such as other gases will do. (For example, water vapor can become liquid water.) It will deposit from a gas to a solid instantly when it reaches its freezing point.
3.
Divide the class into small groups. Give each group 100 g of the salt/sand/gravel mixture. Tell students that the mixture represents the gases found in the flue stream of a fossil fuel power plant. CO2 is represented by the sand. Show students the various items you have available for separating mixtures. Students will need to develop a technique to separate the sand from the other components of the mixture using the physical properties of the materials.
4.
After students have separated out the sand, inform the group how much sand was originally in their mixture. Students should weigh the sand, calculate their recovery of the sand, and compare it to the known amount. If students have used water, they will need to let the sand dry before they complete the calculation.
5.
After students have finished the activity, discuss as a class what methods were used to isolate the sand and how successful their methods were. Do students feel confident that they separated out all of the sand? Why or why not?
6.
Discuss and evaluate this model for how it compares to separating gases in carbon capture. What challenges might exist in the actual process? How could they model this more accurately?
Extension Provide students with additional combinations of materials, such as iron filings, salt, and sand, to explore other physical properties used to separate out mixtures.
10
©2026
Carbon Capture, Utilization, and Storage
www.NEED.org
Activity 6: Exploring Porosity & Background In this activity, students will explore storage of CO2 and the properties necessary when considering geologic formations for the storage of CO2.
Objective Students will be able to explain how porosity influences a material's ability to store CO2.
Materials FOR EACH GROUP 350 cm3 Small gravel 350 cm3 Medium gravel 350 cm3 Large gravel 100 mL Graduated cylinder 600 mL Beakers (3) Water Food coloring Safety glasses Exploring Porosity worksheet, page 37
2 Preparation Gather materials and separate the proper amounts of each size gravel for students. If desired, dye the water students will use ahead of time. It needs to be dark enough that it is easily visible to students; however, the activity can be done without food coloring, if necessary. Make a copy of the worksheet for each student.
Procedure 1. Review with students that porosity is the measure of the amount pores, or tiny openings, between grains in rock or sediment. Permeability describes how well a rock or sediment allows a fluid to pass through its pores. Explain that this activity will model porosity using the spaces between individual rocks for visual purposes. 2. Divide the class into groups of three to four students. 3. Pass out the Exploring Porosity worksheet and review the procedure with the class. 4. After students have completed the investigation, compare and discuss the results. Evaluate the model and ask students what might be needed if choosing a rock formation for the storage of CO2. Review the section of the Student Informational Text on geologic storage and pinpoint locations that might be targeted for CCS, given the maps within this section of text.
©2026
Carbon Capture, Utilization, and Storage
www.NEED.org
11
Activity 7: Enhanced Fuel Recovery Model OPTION A: DRY ICE AND OPTION B: EFFERVESCENT TABLETS Objective Students will model how CO2 can be used to retrieve additional oil from a reservoir.
Materials FOR DEMONSTRATION Clear glass jar with tight lid Water Marbles Pebbles Stones 150 mL Colored vegetable oil
YouTube Demonstration of Activity
OPTION A: FOR EACH SMALL GROUP 2 Mason jars with lids 2 Pieces of 24” by ¼” tubing 150 mL Vegetable oil 350 mL Water 1 Empty water bottle 1 Dark colored food dye 1 Piece of dry ice, about the size of an ice cube Assorted rocks, sand, and marbles Drill Tongs Silicon sealant Safety glasses Tape Enhanced Fuel Recovery Model worksheets, pages 38-39 North American Oil and Gas Reservoirs map master, page 18
OPTION B: FOR EACH SMALL GROUP 2 Mason jars with lids 2 Pieces of 24” by ¼” tubing 150 mL Vegetable oil 350 mL Water 1 Empty water bottle 1 Dark colored food dye 6 Effervescent tablets Assorted rocks, sand, and marbles Drill Tongs Silicone sealant Safety glasses Piece of tissue paper Tape Enhanced Fuel Recovery Model worksheets, pages 40-41 North American Oil and Gas Reservoirs map master, page 18
2 Preparation FOR THE DEMONSTRATION Fill the jar with marbles, stones, and pebbles. Add 150 mL of vegetable oil. This represents crude oil. Fill the rest of the jar with water. Put the lid on and secure tightly.
2 Preparation FOR THE STUDENT LAB Prepare a copy of the map master to project for the class. Preview the activity setup and procedure on NEED's YouTube page, using the QR code link above. It may be helpful to share with students as well. Drill ¼” holes in the lids to the mason jars. Each small group will need one jar with two holes in the lid, and one jar with one hole in the lid. You can adjust as needed to fit the tubing available. Use silicon sealant to seal the holes as needed. Choose option A or B to complete the activity. Option A calls for a piece of dry ice to generate CO2 to force liquids from the reservoir containing the sand, pebbles, marbles, water, and oil. If dry ice is not available, effervescent tablets can be substituted in option B. Choose option A or B to complete the activity based on your preference and access to the materials. Make a copy of the worksheets for the correct option, so each student or small group has a copy.
Procedure 1. Show the class the demonstration jar you have made. Tell the students that this is a model of an oil reservoir, magnified many times over. Oil is trapped within the pore space of rocks. 2. Gently shake the jar and show students how the oil trapped among the rocks. Pass the jar around and direct the class to the map of North American Oil and Gas Reservoirs to show where oil may be trapped.
12
CONTINUED ON NEXT PAGE ©2026
Carbon Capture, Utilization, and Storage
www.NEED.org
3. Review the section of text titled "Utilization and Geologic Storage" in the Student Informational Text. Explain to students that they are going to build their own model of an enhanced fuel recovery system like those used for resource recovery at an oil or natural gas reservoir. 4. Divide students into small groups. Pass out the Enhanced Fuel Recovery Model worksheets and go over the assignment. Remind students of the safety rules for handling dry ice, if necessary. Circulate around the room and assist students as needed. NOTE: This is a model of the enhanced fuel recovery process. Students are using CO2 in a gas form to pump out the oil in their model reservoir. In actual practice, CO2 is pressurized and injected into the reservoir as a liquid. Geologic pressure keeps the CO2 in liquid form. Other enhanced fuel recovery methods include steam injection and polymer injection, though this method is generally too costly.
Extension Ask students to evaluate and redesign the model to retrieve the fuel using different materials and optimize recovery. As a precursor, watch a demonstration or encourage students to build a carbon storage reservoir prior to practicing recovery. A great example can be viewed on YouTube courtesy of Dr. Paul Hand at Rice University. https://www.youtube.com/watch?v=cCBBXYFk5so
Activity 8: Carbon Sequestration in Action Objective Students will be able to describe current CCUS projects and technologies in North America.
Materials Computer with internet access Carbon Sequestration Projects worksheets, pages 42-43
2 Preparation Review the carbon sequestration regional partnerships and projects listed on page 16. Alternatively, create a free account and download the latest version or the CCUS Project database linked here: www.iea.org/data-and-statistics/data-product/ccus-projects-database and share with students. Make a copy of the worksheets for each student.
Procedure 1. Divide the class into several small groups. Assign each group to a different carbon sequestration project located in North America from the list or database, or let teams select one from North America that they find interesting. Pass out the worksheets. If students are making their own selections, have them share their selected project so other teams don't duplicate this effort. 2. Each group should research their assigned project and create a multimedia presentation. In their presentations, groups should answer the following: What project are you highlighting? Where is it located? Is the project in development or in operation? If in operation, how long has the project been operating? If not in operation, describe its status. What is the source of the CO2 that is being sequestered? How is the CO2 being captured? Is the CO2 being utilized? If so, for what purpose? Is the CO2 is being stored? If so, how? How much CO2 has been stored to date? If the facility is not yet operational, how much CO2 of the developer's project will be stored? 3. Have students present their multimedia projects to the class. As presentations are made, the other students should take notes.
Writing Extension Ask each student to pick a project different from the one they originally researched and write a compare and contrast paper.
©2026
Carbon Capture, Utilization, and Storage
www.NEED.org
13
Activity 9: Calcium Carbonate Precipitation & Background Conventional cement manufacturing uses an enormous amount of energy and produces a huge amount of CO2. This is in part due to the process of preparing and treating limestone, an essential raw material in cement manufacturing. Once the extensive treatment process with the limestone is complete, the product, calcium carbonate (CaCO3), is fed into the process of making cement. To avoid some of the energy use from these steps, scientists have developed a process that uses CO2 from onsite flue gases and recycled concrete to generate CaCO3 feedstock for cement manufacturing rather than from treated limestone. This process eliminates the need for mining, transporting, and processing limestone, and generates valuable hydrogen gas as a byproduct. CO2 is slightly soluble in water. An equilibrium occurs as some CO2 reacts with water to form carbonic acid (H2CO3):
CO2(aq)+ H2O(l) ⇌ H2CO3(aq)
When a weak acid is in an aqueous solution, some of the units dissociate to yield hydrogen ions (H+) and its conjugate base. Carbonic acid is a weak acid, so some units of H2CO3 dissociate into hydrogen ions (H+ ) and hydrogen carbonate ions (HCO3 −)
H2CO3(aq) ⇌ H+(aq) +HCO3−(aq)
Hydrogen carbonate ions (HCO3−) also behave as a weak acid, so some units of HCO3− dissociate in aqueous solution yielding hydrogen ions (H+) and carbonate ions (CO32-)
H CO3-(aq) ⇌ H+(aq) + CO32−(aq)
When dealing with equilibrium reactions, we can push the reactions in one direction or another by removing or adding a component of the system. As explained by Le Chatelier’s Principle, if a system is changed by increasing the concentration of one of the reacting species, the reaction that consumes that species is favored. If a product is removed, this also shifts the equilibrium toward generating more of that product to reestablish balance. In this system, scientists drive the equilibrium to the right by removing carbonate ions (CO32-) from the system. The system is now out of balance, with the left side overloaded. The substances on the left of the equilibrium will dissociate until equilibrium is reached again. The more carbonate ions (CO32-) removed from the system at the end of the reaction series, the more carbon dioxide (CO2) we can feed into the process. When calcium ions (Ca2+) encounter carbonate ions (CO32-) in solution they will usually form solid calcium carbonate (CaCO3) and precipitate from the solution. As carbonate ions are removed from the system by the precipitation of calcium carbonate, more carbon dioxide can be captured by feeding it into this series of equilibrium reactions. In this experiment students will investigate how pH of the solution affects the solubility of CaCO3.
Objective Students will be able to describe the impact of pH on the solubility of calcium carbonate.
Concepts Calcium carbonate is less soluble at high pH. Equilibrium can shift by changing the concentrations of ionic species involved. Precipitation of a calcium carbonate removes carbonate ions (CO32-) from the solution and causes additional hydrogen carbonate (HCO3−) to dissociate: H CO3-(aq) ⇌ H+(aq) + CO32−(aq)
Removing more hydrogen carbonate (HCO3−) from the system will cause more carbon dioxide to interact with water to form carbonic acid (H2CO3). CO2(aq)+ H2O(l) ⇌ H2CO3(aq)
This simple experiment helps us better understand the role of calcium in cement production and the connection to removing carbon dioxide from a system. Cement is a binding agent made from limestone and clay; whereas concrete is a building material created through the proper mixing of cement, water, sand, and rock.
14
CONTINUED ON NEXT PAGE ©2026
Carbon Capture, Utilization, and Storage
www.NEED.org
FOR EXTENSION/PREPARATION
Materials FOR 6 STATIONS 18 Test tubes with caps 6 Test tube racks 6 Beakers (for waste) 6 1 mL Pasteur pipette 6 packets of pH paper with color scale attached Paper towels
6 10 mL Graduated cylinders 3 Small bottles of CaCI2 (three pH levels) 1 Small bottle of Na2CO3 Pencils or markers Safety glasses Student worksheets, pages 44-45
6 Balances 18 Pieces of filter paper 6 Squirt bottles 18 Small funnels Distilled water Na2CO3 Graduated cylinders
CaCI HCI and NaOH solution
2 Preparation Gather materials and set up lab stations. Follow the preparations below for making the solutions. Preview the activity procedure and results by watching the video from the QR code to the right. Prepare copies of the worksheets for students.
Watch a video of the procedure for this activity on NEED's YouTube Page
50 mL of 0.5M sodium carbonate Pour approximately 40 mL of distilled water into a small beaker. Add 2.65g of sodium carbonate to the beaker and stir until dissolved. Pour solution into graduated cylinder and add more distilled water until the quantity is sufficient to reach 50 mL (task of bringing up final volume referred to as QS). Mix final solution once more and distribute into small bottles for each student station. 100 mL, 1M calcium chloride, low pH Pour approximately 70 mL of distilled water into a small beaker. Add 11.1g calcium chloride to the beaker and stir until dissolved. Check pH and add HCl solution until pH is approximately 4. Pour solution into graduated cylinder and QS to 100 mL with distilled water. Mix final solution once more and place in labeled bottle for each student station. 100 mL, 1M calcium chloride, near-neutral pH Pour approximately 70 mL of distilled water into a small beaker. Add 11.1g calcium chloride to the beaker and stir until dissolved. Check pH and adjust with HCl solution or NaOH solution until pH is approximately 7.0. Pour solution into graduated cylinder and QS to 100 mL with distilled water. Mix final solution once more and place in labeled bottle for each student station. 100 mL, 1M calcium chloride, high pH Pour approximately 70 mL of distilled water into a small beaker. Add 11.1g calcium chloride to the beaker and stir until dissolved. Check pH and adjust with NaOH solution until pH is approximately 10.0. Pour solution into graduated cylinder and QS to 100 mL with distilled water. Mix final solution once more and place in labeled bottle for each student station.
Procedure 1. Divide the class into six small groups. 2. Point out the locations in the lab where students will access different solutions. 3. Remind students to wear safety glasses. 4. Direct students to follow the procedure on their worksheets. Discuss the results and conclusions as a class.
Writing Extension The basic experiment yields qualitative results. To get quantitative results, the resulting mixtures are filtered. Mass of filter paper is recorded before filtering. Filter paper is left to dry overnight. Final mass is determined, and the mass of the solid product is calculated. ©2026
Carbon Capture, Utilization, and Storage
www.NEED.org
15
Web Resources General CCUS Resources International Energy Agency (IEA) www.iea.org CCUS Projects Explorer www.iea.org/data-and-statistics/data-product/ ccus-projects-database U.S. Department of Energy (DOE) www.energy.gov Carbon Capture, Utilization, and Storage www.energy.gov/carbon-capture-utilizationstorage Carbon Capture, Use, Transport, and Storage www.energy.gov/sites/default/files/2025-03/ Carbon%20Capture%2C%20Use%2C%20 Transport%2C%20and%20Storage%20Fact%20 Sheet_1.pdf
U.S. Energy Association https://usea.org U.S. Environmental Protection Agency (EPA) www.epa.gov Supply, underground injection, and geologic sequestion of Carbon Dioxide www.epa.gov/ghgreporting/supplyunderground-injection-and-geologicsequestration-carbon-dioxide U.S. Geological Survey www.usgs.gov
U.S. Department of Energy, National Energy Technology Laboratory (NETL) www.netl.doe.gov NATCARB Viewer https://arcgis.netl.doe.gov/portal/apps/ experiencebuilder/experience/?id=ea8e3add7d68 44ba8768af930e5e7f2a
Partnerships & Projects Bayou Bend: https://bayoubend.com
Project Tundra: www.projecttundrand.com
Big Sky Carbon Sequestration Partnership: www.bigskyco2.org
SEDAC Hub: www.sseb.org/programs/sedac_hub
Carbon Terra Vault: www.crc.com/carbon-terravault/Vaults/default.aspx
Snowy River: https://eplanning.blm.gov/eplanning-ui/ project/2026556/510
Clean Air Task Force, Interactive Map of CCUS Projects in Development in the U.S.: www.catf.us/2020/07/ccus-interactive-map
Summit Carbon Solutions: https://summitcarbonsolutions.com
Longleaf CCS Hub: https://longleafccs.com
Southeast Regional Carbon Sequestration Partnership: https://www.sseb.org/programs/secarb
Midwest Regional Carbon Initiative: www.midwestccus.org/our-projects
Southwest Partnership: www.southwestcarbonpartnership.org
Plains CO2 Reduction Partnership: https://pcor.undeerc.org
Tri-State CCS Hub: https://tristateccs.com
16
©2026 Carbon Capture, Utilization, and Storage
www.NEED.org
MASTER
Dry Ice Safety What is Dry Ice? Dry ice is frozen carbon dioxide. Unlike most solids, it does not melt into a liquid, but instead changes directly into a gas. This process is called sublimation. The temperature of dry ice is around -109°F or -78.3°C! It sublimates very quickly so if you need dry ice for an experiment or project, buy it as close as possible to the time you need it.
Dry Ice Safety Rules 1. Students should never use dry ice without adult supervision. Dry ice can cause serious injury if not used carefully! 2. Never store dry ice in an airtight container. As the dry ice sublimates from a solid directly into a gas, the gas will build up in the container until it bursts. Sharp pieces of container will go flying all over the place. Make sure your container is ventilated. The best place to store dry ice is in a foam chest with a loose fitting lid. 3. Do not touch dry ice with your skin! Use tongs, insulated (thick) gloves or an oven mitt. Since the temperature of dry ice is so cold, it can cause severe frostbite almost immediately. If you suspect you have frostbite, seek medical help immediately. 4. Never eat or swallow dry ice! Again, the temperature of dry ice is very, very cold. If you swallow dry ice, seek medical help immediately. 5. Never lie down in, or place small children or pets in, homemade clouds. The clouds are made of carbon dioxide gas. People and pets could suffocate if they breathe in too much gas. 6. Never place dry ice in an unventilated room or car. If you are traveling with dry ice in the car, crack a window open. Same rule applies if you are in a small room, crack a window open. You do not want too much carbon dioxide gas to build up around you. 7. Always wear safety goggles when doing experiments with dry ice. 8. Do not place dry ice directly on counter tops. The cold temperature could cause the surface to crack. 9. Leave the area immediately if you start to pant or have difficulty catching your breath. This is a sign that you have breathed in too much carbon dioxide gas. 10. Do not store dry ice in your freezer. It will cause your freezer to become too cold and your freezer may shut off. However, if you lose power for an extended period of time, dry ice is the best way to keep things cold.
Disposing of Dry Ice To dispose of dry ice, place in a well ventilated container and take it outside where small children and pets cannot reach it. Simply let it sublimate away.
Data: NOAA and NWS ©2026
Carbon Capture, Utilization, and Storage
www.NEED.org
17
MASTER
North American Oil and Gas Reservoirs
North American Oil and Natural Gas Reservoirs
Data: U.S. Department of Energy’s National Energy Technology Laboratory 18
©2026 Carbon Capture, Utilization, and Storage
www.NEED.org
Carbon Capture, Utilization, & Storage Introduction
Early Uses of Fossil Fuels
Most people in the United States use electricity on a daily basis. Electricity is not a primary source of energy because it has to be generated. Rather, electricity is a secondary source of energy, or an energy carrier. We generate electricity from fossil fuels (coal, natural gas, oil), nuclear fuel, and renewable energy resources (hydropower, biomass, solar, wind, and geothermal). All of these resources are needed to meet our electricity demand.
Humans have been using coal and petroleum for thousands of years. Ancient Egyptians gathered crude oil that had seeped to the surface as a medicine for wounds, and oil in lamps to provide light. Native Americans skimmed oil off the surface of lakes and streams to use as medicine and to water-proof canoes. The Chinese were the first to use coal found at or near land surfaces to smelt copper over 3,000 years ago. In the second century, Romans in Britain used coal to heat public and private baths. The Aztecs used coal as a heat source for cooking, and for ornaments. Hopi Indians used coal to bake pottery made from clay.
Fossil fuels are the sources behind roughly 60 percent of electricity generated in the United States. While fossil fuels provide affordable and reliable energy, there is great concern about the relationship between carbon dioxide emissions produced by fossil fuel-powered technologies and facilities and global climate change. Scientists have developed new technologies and processes that allow for the capture and storage of carbon dioxide (CO2). These technological advances could reduce the amount of CO2 emissions.
However, it was not until the Industrial Revolution in the late 18th century that we began using these sources in large quantities. Engineers had invented new tools and machines that made accessing and using the energy in fossil fuels much easier. Thomas Edison’s invention of a long-lasting incandescent light bulb also opened a new market for the use of fossil fuels—electric power-generating stations.
Origins of Fossil Fuels
OCEAN OCEAN Tiny Plants and Animals
SAND 300
AND
SILT
to 40
0 MI Early life LLIO N YE began in vast Plant and Animal Remains ARS seas and inland lakes AGO that covered large portions of How and 50 to the Earth. As the Petroleum abundant population 100 of marine plant and animal life died, their MILL Natural Gas Were Formed ION remains were buried rapidly and preserved in the YEAR Tinyfiltered plantsdown and to animals died andThe mud sediment that the ocean floor. S AG O and seawater protected the material from further decay. As more were buried on the sea floor. Over and more layers organic andby sediment accumulated time, of they werematerial covered layers of and time passed, the weight of the overlying sediments exerted sediment rock. great pressure on the layers below, eventually forming sedimentary Over millions of years hundreds of millions rocks. The tremendous pressure andto chemical reactions caused of the formation years, of coal,the crude oil, and were natural gas. deeper and deeper. The remains buried Today, natural gas and heat oil remain in turned the foldsthem of rockinto layers enormous and trapped pressure oil and gas. around the world.
SAND
AND
SILT
Trapped gas
Trapped oil
TOD AY Note: not to scale
Today, we drill down through layers of sedimentary rock to reach the rock formations that contain oil and gas deposits.
©2026
Carbon Capture, Utilization, and Storage
www.NEED.org
19
Electricity Electricity has greatly improved our quality of life over the last century and beyond. Because of electricity, we easily have light at any hour. We are healthier because food is preserved through refrigeration and freezing. We can maintain comfortable temperatures in our homes, schools, and work places in any season. We are entertained by television and movies, and we are able to keep our cell phones and tablet batteries charged. People can even use electricity to power their vehicles.
Fossil FuelFuel Consumption BybySector, Fossil Consumption Sector,2025 2025 SECTOR Industrial Transportation Electricity
While plugging in an appliance or flipping a light switch makes it easy for us to use electricity, it is not easy to produce electricity. There is a tremendous amount of work and energy involved in generating electricity and moving electricity from the power plant to your home and school.
Generating Electricity
Almost all electricity produced in the United States is generated by large, central power plants. Coal and natural gas plants are common because there is a plentiful domestic supply of these sources. In fact, the United States has the largest recoverable reserves of coal in the world. The fuel is relatively inexpensive, and the plants are less expensive to build compared to other power plants. Fossil fuel plants that use coal and natural gas are important sources for meeting the electricity demand in the United States.
Residential Commercial 0%
20%
40%
60%
80%
100%
Data: Energy Information Administration * Values do not add to 100% due to use of sources that are not fossil fuels.
How a Thermal Power Plant Works Thermal Power Plant FUEL BURNING
3
STEAM LINE BOILER
2 FUEL SUPPLY
1
ELECTRICITY GENERATION
ELECTRICITY TRANSMISSION
GENERATOR TURBINE
4
5
SWITCHYARD
FEED WATER CONDENSER
6 DETAIL
Coal power plants are considered baseload power plants because they supply electricity 24 hours a day, seven days a week, usually at a constant rate. The only time these plants do not operate is when they must be taken offline for maintenance. Bringing a coal power plant offline takes time, and when it goes back online it requires time to build up to its full generating capacity. For the most part, coal power plants are producing a constant amount of electricity and sending it out onto the electric grid.
SOURCE Coal Petroleum Natural Gas
Natural gas power plants are commonly used as baseload plants and also as peak demand plants. During certain times of the day (the afternoon), and certain periods of the year (hot summer days), there is a larger demand for electricity. This is referred to as peak demand. Baseload power alone cannot meet the demand, so peak load power plants are brought online. Natural gas plants are good peaking facilities because they can easily be turned on to help meet the electricity demands and turned off when they are not needed.
1. Fuel is fed into a boiler, where it is burned to release thermal energy.
Coal and natural gas are both used as fuel in thermal power plants. The fuel is fed into a furnace where it is burned to release thermal energy. The released thermal energy superheats pure water changing it into steam in a boiler. The very high-pressure steam (75 to 100 times normal atmospheric pressure) is piped to a turbine where it spins the blades of the turbine. The blades are connected to a shaft, which is a part of the generator. Inside the generator, the rotating shaft has coils of copper wire connected to it. The shaft and coils of wire are surrounded by large, strong magnets.
5. Inside the generator, the shaft spins coils of copper wire inside a ring of magnets. This creates an electric field, producing electricity.
The shaft spins the copper coils rapidly through the magnetic field of the magnets. This induces a current inside the copper coils of wire. Electrons move through the wire to a transformer, which steps up the voltage to send the electricity onto the electric grid.
2. Water is piped into the boiler and heated, turning it into steam. 3. The steam travels at high pressure through a steam line. 4. The high pressure steam turns a turbine, which spins a shaft.
MAGNETS COPPER COILS ROTATING SHAFT
GENERATOR
6. Electricity is sent to a switchyard, where a transformer increases the voltage, allowing it to travel through the electric grid.
Not all power plants use thermal energy to generate electricity. Hydropower plants and wind farms use motion energy to turn turbines, turning a generator, which produces electricity. Photovoltaic plants use radiant energy to generate electricity directly.
The steam does not stop once it reaches the turbine blades. From the turbine blades, it continues traveling through pipes to a condenser where it is cooled into liquid water by passing it through pipes circulating over a large body of water or cooling towers. The water then returns to the boiler to be used again.
20
©2026 Carbon Capture, Utilization, and Storage
www.NEED.org
Atmospheric Impacts There are many advantages and societal benefits of burning relatively cheap coal and natural gas for electricity, heating and cooling, and even transportation. However, there are also environmental impacts associated with burning fossil fuels, including the release of emissions through flue gas. Nitrogen oxides (NOx), sulfur dioxide (SO2), carbon dioxide (CO2), particulate matter (PM), and water vapor are all products of fossil fuel combustion. Regulations require power plants to reduce NOx, SO2, and PM through the use of scrubbers and flue gas desulfurization. Naturally found in the atmosphere, CO2 itself is not considered a pollutant. The CO2 being released from burning fossil fuels was part of the atmosphere millions of years ago before being captured by plants and sea organisms. Carbon atoms naturally cycle through living organisms, the atmosphere, the oceans, and the Earth’s crust through a process known as the carbon cycle. In the carbon cycle, carbon is exchanged at differing rates among different reservoirs.
Carbon Emissions by Sector, U.S. C02Dioxide Emissions By Sector, 20252025 ELECTRICITY 23.24% TRANSPORTATION
RESIDENTIAL 13.87%
29.33%
INDUSTRIAL
Fossil fuels, like coal and natural gas for example, act as a carbon sink for absorption of carbon as it is released from different parts of the cycle. Burning these fossil fuels, however, adds carbon to the atmosphere faster than it can be removed naturally. The balance of the flows or exchanges between sources of carbon (emissions, respiration) and sinks (fossil fuels, sediments, ocean), is referred to as the carbon budget or carbon flux. There is a concern about the buildup of CO2 concentrations in the atmosphere. CO2 is a greenhouse gas, which helps to trap heat in the atmosphere through the greenhouse effect. International scientific consensus has concluded that the increase of CO2 in the atmosphere is one of the causes of global climate change.
Carbon Capture, Utilization, and Storage In 2024, about 38 billion metric tons of CO2 were emitted worldwide related to fossil fuel energy consumption. Increasing levels of CO2 is not an issue for just the United States, it is a global issue. Research and developmental projects are now underway around the world to find affordable and sustainable ways to capture CO2 before it enters the atmosphere, then to use it, and/or store it deep underground where it cannot escape. The term used to describe this process is carbon capture, utilization, and storage (also known as carbon sequestration), or CCUS. The goal of CCUS is to mitigate the levels of CO2 entering the atmosphere.
COMMERCIAL 12.57%
21.00%
Data: Energy Information Administration *Total does not equal 100% due to independent rounding.
Global Carbon Cycle FOSSIL FUEL COMBUSTION AND INDUSTRIAL PROCESSES
PHOTOSYNTHESIS AND RESPIRATION LAND-USE CHANGES
OCEAN-ATMOSPHERE EXCHANGE
VEGETATION OCEAN
LITHOSPHERE SINKING PARTICLES
The transport of carbon between different reservoirs on Earth. ©2026
Carbon Capture, Utilization, and Storage
www.NEED.org
21
While the transportation sector is responsible for about one-third of the country’s CO2 emissions, scientists believe the best use of CCUS technologies will be to focus on large stationary sources of CO2 emissions. Capturing emissions from individual mobile sources would be very challenging. Mitigating the transportation sector’s role in climate change is happening in other ways, including efficiency measures, fuel switching, and terrestrial sequestration. Electric power plants and large industrial plants, such as cement factories, oil refineries, and steel works, are stationary sources identified as potential sources to use CCUS technologies.
CENOVUS OIL PIPELINE
What Is Carbon Capture, Utilization, and Storage? CCUS is a process for reducing greenhouse gas emissions into the atmosphere by capturing CO2 from stationary sources and using the CO2 in new applications or storing the CO2 in underground storage sites.
Image courtesy of Petroleum Technology Research Centre
This pipeline at a Cenovus oil field in Weyburn, Saskatchewan, Canada, has transported CO2 330 km from Beulah, ND. The CO2 will be used for enhanced oil recovery, and ultimately stored underground in the depleted oil reservoir.
CCUS Systems CCUS can be broken down into three main stages: First CO2 gas is captured before or after fossil fuels are burned and compressed into a liquid form. Second, liquid CO2 is transported via pipeline to a utilization or CAPTURE geologic storage site. At utilization sites, CO2 is transformed into usable materials. Some uses also result in storage. The vast TRANSPORT majority of captured CO 2 is transported to locations where UTILIZATION STORAGE it can be pumped underground for permanent storage.
All parts of the CCUS system—CO2 capture, transport, utilization, and storage—were initially done on a small scale during research and development. Now that these technologies have proven to be effective and safe, several companies are working to develop these practices on a much larger scale. When implemented on a large scale, CCUS could potentially capture and store up to 90 percent of the CO2 emitted into the atmosphere from stationary fossil fuel plants.
U.S. GREENHOUSE GAS EMISSIONS, 2022
SOURCES CARBON DIOXIDE
79.7%
TRANSPORTATION 34.7%
ELECTRICITY INDUSTRIAL 30.3% 16%
RESIDENTIAL & COMMERCIAL OTHER 12.7% 7%
METHANE
MANMADE EMISSIONS
11.1%
ENERGY 40.2%
AGRICULTURAL WASTE MANAGEMENT 20.4% 39.4%
OTHER 0.01%
NITROUS OXIDE
6.1%
AGRICULTURAL 79.0%
ENERGY USE 10.9%
WASTE 6.2%
INDUSTRIAL 4.3%
F-GASES
3.1%
OZONE-DEPLETING SUBSTANCES HCFC-22 PRODUCTION 89.9% Data: U.S. Environmental Protection Agency 4.2% *F-gases include HCFCs, PFCs, and SF6, which are used in many different industrial applications, including refrigerants, propellants, and tracer chemicals. **Totals may not equal 100% due to independent rounding. ***2022 is the most recently updated aggregate data for this information at the time of publication.
22
POWER TRANSMISSION ELECTRONICS METALS INDUSTRY PRODUCTION 2.6% 2.2% 0.9%
©2026 Carbon Capture, Utilization, and Storage
www.NEED.org
The CO2 Capture System
Post-Combustion Capture Post-Combustion Capture
Steam
Biomass
Decomposition
Fuel
Air
Gasification
Combustion
Syngas
Boiler
Turbine/Generator
Particulate Removal
Electricity
Combusted Gas
Ash separation
Combined cycle power turbines
Ash Exhausted Gas
CO2
CO2 Storage
Gas-out
Desorber
Rich out
BIGCC CCS DAC
Solvent
Absorber
Cooler
Solvent Recovery
CO2 Rich Sorbent
CO2
Desorption unit
Sulfur Removal
Sorption unit
CO2 lean Sorbent
Carbon Dioxide Absorption
Remaining Flue Gas
Air
Carbon Dioxide Stripping
Heat
Step One: CO2 Capture
Carbon Dioxide Compression
There are several different CO2 capture technologies available. The capture techniques implemented at any given site will be determined based on the fuel source and whether a plant is being retrofitted with capture technology or if it is a new plant with capture technologies built into the original design.
Carbon Dioxide Stored
JAMES M. BARRY ELECTRIC GENERATING PLANT
POST-COMBUSTION CAPTURE In the post-combustion capture method, the power plant front-end operations remain unchanged. Fuel is fed into a furnace where it is burned to heat water to steam. In a conventional fossil fuel plant, fuel combusts in the presence of air that is 21 percent oxygen and 78 percent nitrogen. The remaining one percent is a combination of eight gases including carbon dioxide, argon, methane, and helium. When oxygen and fuel are combined, the main products formed are CO2 and H2O. The gas created by the burning of fossil fuels in a power plant is called flue gas. The majority of flue gas is atmospheric nitrogen and water vapor, with CO2 making up only 4-15 percent of the end product. Before entering the atmosphere, flue gas is treated by scrubber and flue gas desulfurization technologies, which remove impurities regulated by the Environmental Protection Agency. In post-combustion capture, the flue gas would continue on, passing through a vessel containing a chemical solution such as aqueous amines (nitrogen containing organic compounds) or chilled ammonia (NH3). The CO2 bonds with the chemicals and concentrates the CO2. The solution is then heated to release the CO2, and the absorbing chemicals are regenerated and recycled back to the beginning of the process. A benefit of this capture technique is that it has been used in other industries, and relies on well-understood technologies. The natural gas industry is using this technology already. The food and beverage industry uses this method to provide CO2 for liquid and food preservation. Fertilizer manufacturing uses CO2 as a raw material in their processes. The construction industry uses CO2 for cement manufacturing.
Image courtesy of Southeast Regional Carbon Sequestration Partnership
The photo above shows the CO2 capture unit at Alabama Power's Plant Barry. Operation began in 2012 to test the amine-based process to capture approximately 550 tons of CO2 per day. Using a post-combustion capture process developed by Mitsubishi Heavy Industries, CO2 was captured and then transported through 12 miles of pipeline to the injection site called the Paluxy Formation. The Gulf Coast region contains the largest capacity saline sinks in the United States (see map on page 29). The Southeast Regional Carbon Sequestration Partnership tested and monitored CO2 injection and storage into the Paluxy Formation. The CO2 capture technology tested at Plant Barry is now being implemented at a commercial scale.
Because there is a large financial investment in electricity generation from coal and other fossil fuels, it is important to find solutions that preserve these investments as well as take advantage of an abundant, inexpensive, domestic fuel source. ©2026
Carbon Capture, Utilization, and Storage
www.NEED.org
23
Pre-Combustion Pre-CombustionCapture Capture Air
Fuel
Air Oxygen Separation
Gasifier
Steam
Particulate Removal Shift Reactor
Water Carbon Dioxide Stripping
Sulfur Removal Carbon Dioxide Absorption
Carbon Dioxide Compression
Turbine and Generator
Electricity
Carbon Dioxide Stored
Oxy-FuelCombustion Combustion Capture Oxy-fuel Capture Fuel
Air Air Separation
Boiler
Turbine/Generator
Particulate Removal
Electricity
Cooling and Condensing
Water
Oxygen
Sulfur Removal Cooling and Condensing
Water
Carbon Dioxide Compression Carbon Dioxide Stored
Existing C02 Pipelines CO2 Pipelines
UT
MT
ND
WY
SD CO
NE
AZ
OK NM TX
Data: U.S. Department of Energy, NETL
24
Edwardsport, IN, is home to a 618 MW gasification plant that came online in 2013. Pushing the syngas equilibrium to the right and adding steam, known as natural gas reforming, is done routinely by the chemical and fertilizer industries to obtain hydrogen. However, these facilities do not include technology for capturing and sequestering carbon dioxide, as this was not their initial design goal. This technology has not been widely deployed for electricity generation due to the cost; the Edwardsport plant greatly exceeded its initial $2 billion budget. Unless it is required by law, most power generation companies will not take on the added expense of coal gasification and will just burn natural gas. As government regulations require generation with lower CO2 emissions, more power plants will incorporate pre-combustion technology and carbon capture, and the cost will come down because of economies of scale. Rather than using air for combustion, researchers are looking at using pure oxygen. Burning fossil fuels with pure oxygen produces an exhaust composed only of concentrated CO2 and water vapor. Concentrations of CO2 could be greater than 80 percent and much easier to separate.
KS
CO2 PIPELINES
PRE-COMBUSTION CAPTURE Capturing CO2 with pre-combustion methods also uses existing technology. The fuel is treated before it is burned in a process called gasification. Gasification converts a solid, carbon-rich fuel into a mixture of gases called synthesis gas or syngas. Syngas is typically a mixture of methane, water vapor, carbon monoxide, and hydrogen. The chemical reaction CH4 + H2O ⇌ CO + 3H2 is in equilibrium. This means that changing reaction conditions or concentrations of the substances on the right or left can push the reaction toward the more desired products. Pre-combustion carbon capture will gasify a solid fuel with the reaction conditions that favor carbon monoxide and hydrogen. High-temperature steam is added to the syngas which reacts with carbon monoxide to produce carbon dioxide and more hydrogen. By gasifying solid, carbon-rich fuels and then reacting the gas with steam, the carbon dioxide concentration in the mixture is about 35-45 percent, which makes capturing the CO2 easier than in other methods. The hydrogen goes on to be used as the fuel to generate electricity. Burning hydrogen produces thermal energy and water vapor, generating carbon emission-free electricity.
OXY-FUEL COMBUSTION CAPTURE
To Canada
ID
The world's first commercial, post-combustion, coal-fired carbon capture project to be used for more than testing came online in the fall of 2014. The Boundary Dam CCS Project in Saskatchewan, Canada, repurposed a coal-fired generation unit to include carbon capture technology. This low-emission power generation facility generates 120 megawatts of electricity and has captured over 6 million tons of CO2 since it began capture in 2014. Captured CO2 is piped to oil fields nearby for use in enhanced oil recovery, or stored in an Aquistore well deep underground. The Aquistore Project is the largest field laboratory in the world studying CO2 storage.
AR LA
MS
AL
Extracting oxygen from air is expensive, and this process itself consumes energy. Another challenge is that in conventional, pulverized coal plants, combustion occurs at temperatures from 1,300-1,700 degrees Celsius (2,300-3,000° Fahrenheit). Pure oxygen combustion occurs at much higher temperatures, around 3,500°C (6,332°F). This temperature is too high for typical power plant materials to withstand. In the future, this may prove to be a good option for retrofitting existing power plants. This process is being tested in several pilot plants around ©2026 Carbon Capture, Utilization, and Storage
www.NEED.org
the world, including one in La Porte, TX, that is generating power for a lower cost and with lower emissions. The group running the test facility in Texas has plans for the first utility-scale project using this technology, projected to capture approximately 850,000 tons of CO2 per year while generating approximately 300 MW. A recent surge in costs has delayed this project. Other private companies are in the process of commercializing this technology, thus adding options for energy and manufacturing to lower their carbon emissions.
DIRECT AIR CAPTURE (DAC) Capture of CO2 directly from the atmosphere is challenging because of its low concentrations relative to other gases. However, because of the impacts of higher atmospheric CO2 levels, investments in technology for capturing CO2 directly from the atmosphere are advancing. The world’s largest direct air carbon capture project, STRATOS, is preparing to start operations in Texas as of 2026. While this technology is very expensive, large technology companies whose data storage needs consume tremendous amounts of energy are investing in these approaches to help offset their carbon footprints.
Step Two: CO2 Transport
Once CO2 is captured, it must be transported to a storage or utilization site. In most cases, CO2 will not be stored on power plant property. Instead, it will be compressed into a liquid and transported to locations where the geology is supportive of holding large quantities of CO2. For distances up to 1,000 km (about 621 miles), pipelines are the preferred choice for CO2 transport. In fact, CO2 pipeline transport is not new. The current system of CO2 pipelines consists of a network with a combined length of more than 5,300 miles. Most of these pipelines connect natural sources of CO2 with oil fields for enhanced oil recovery. Over 70 million metric tons (MMtCO2) are transported through this network each year. As industrial CO2 capture projects increase, the network of pipelines will grow, too. While pipelines are a proven technology in the oil and gas industry, there are challenges for developing a large pipeline infrastructure. Developing infrastructure is costly. The location of pipelines will influence overall costs of CCUS. Engineers need to determine largescale network requirements, and design pipelines and routes that will be safe through all types of terrain. Unlike oil and natural gas, CO2 is non-explosive, non-hazardous, and non-toxic, and is not ignitable.
Carbon Capture, Utilization, and Storage Overview Carbon dioxide from a power plant or industrial facility will be separated from other flue gases at a separation facility on site. It will then be pressurized into a liquid and transported via pipeline to be used in a new application or in enhanced hydrocarbon recovery. It could also be sent underground into a deep saline formation, depleted oil reservoir, or unmineable coal seam.
POWER PLANT CO2 SEPARATION FACILITY
PIPELINE
LIQUEFIED CO2
CO2 may be transported far away from the power plant
INDUSTRIAL UTILIZATION
INJECTION AND STORAGE
Note: Not to scale
Carbon Capture, Utilization, and Storage Projects Site Characterization Capture Capture and Storage Storage Data: U.S. Department of Energy National Energy Technology laboratory
©2026
Carbon Capture, Utilization, and Storage
www.NEED.org
25
Risks associated with CO2 pipeline transport are expected to be less than those posed by oil and natural gas pipelines already in use. Studies are underway looking at the feasibility of repurposing existing infrastructure to create more opportunities to transport captured CO2 to ideal storage locations. While risks may be lower, safeguards along a CO2 pipeline need to be in place to monitor for leaks. Procedures need to be implemented to protect against overpressure, and to stop or control CO2 releases should they arise. A small CO2 leak would self seal as it froze and would not pose an immediate danger. In concentrations of seven to ten percent (by volume in air), CO2 is dangerous to human health. When CO2 is released from a pipeline, it is denser than air and stays along the ground settling into low spots. In most conditions, the CO2 would quickly transform into a gas and be diluted and dispersed with the wind. The food and beverage industry currently uses mostly tanker trucks to transport CO2. However, trucks and rail cars will be uneconomical for large scale CO2 transportation. Some CO2 is transported by pipeline. In the U.S., pipelines are expected to transport all of the captured CO2. In other parts of the world, engineers are considering the possibility of using ships for transporting smaller amounts of CO2.
Utilization One way to mitigate the amount of CO2 entering the atmosphere is to find other uses for the gas. For a long time, CO2 has been used to carbonate beverages, as the active ingredient in fire extinguishers, and in refrigeration. Most current and potential uses of CO2 tend to be on a small scale, however, and they also typically emit the CO2 into the atmosphere after its use. Scientists are studying ways that CO2 can be used in larger-scale applications, and in ways that do not produce more CO2 than what is trying to be saved from entering the atmosphere originally. There are four main CO2 utilization research areas: enhanced fuel recovery, cement, polycarbonate plastics, and mineralization.
Uses for CO2 Carbon dioxide is currently used in a variety of ways. Most of these materials currently utilize naturally occurring CO2. Research is underway on how to use CO2 captured from stationary sources in some of these products. BIOLOGICAL CONVERSION
Fire extinguishers
EXTRACTANT
Polycarbonate Polymers
PLASTICS
Flavors/fragrances Decaffeination
MINERALIZATION
ENHANCED FUEL RECOVERY
Carbonates Concrete
Oil Natural Gas
FOOD/PRODUCTS
CHEMICALS
Liquid fuels Fertilizer
Carbonated beverages
REFRIGERANTS
Injected into metal castings Added to medical O2 as a respiratory stimulant Aersol can propellant Dry ice pellets used for sand blasting Red mud carbonation
MISCELLANEOUS
Refrigeration Dry ice
INERTING AGENTS
Blanket products Protective carbon powder Shield gas in welding
Bioenergy Production with Carbon Capture & Sequestration
ENHANCED FUEL RECOVERY
CO2 Atmospheric Draw Down
Oil and gas are fuels that we use everyday. Enhanced fuel recovery utilizes CO2 in oil and gas fields to increase production. Enhanced fuel recovery is more commonly referred to as enhanced oil recovery (EOR). It can also be called enhanced gas recovery (EGR). In operating oil fields that are slowing production, CO2 is injected into the wells as a liquid. Some of the CO2 dissolves in the oil and increases the bulk volume while decreasing the viscosity. This allows the oil to flow more easily toward the well bore and be pumped to the surface. This process of EOR allows for an additional 10-15 percent of oil to be recovered from existing wells. Technology for EOR is already in use. Over 63 million metric tons of CO2 are injected underground each year for EOR, but more than 80% of this CO2 comes from naturally occurring geologic formations. Most of the operations capable of conducting EOR are located close to a point source of CO2 emissions or a natural reservoir. Using CO2 for EOR has the advantage of having revenue associated with the CO2. The costs for storage are offset by revenues from the additional oil and gas produced. This use also results in significant storage.
26
FIRE SUPPRESSION
Fuels Food
Biomass
• Residue • Waste
Transport
Storage Bioenergy Combustion or Biofuel Conversion Transport
Heating
Industry
©2026 Carbon Capture, Utilization, and Storage
C02 Capture
Power
www.NEED.org
CEMENT
POLYCARBONATE PLASTICS Carbon dioxide can be combined with traditional monomers, such as ethylene and propylene, to produce polycarbonates such as polyethylene carbonate and polypropylene carbonate. Polycarbonates can be used in coatings, plastic bags, and laminates. This use of CO2 is a potential semi-permanent storage of carbon dioxide depending on the product’s life cycle end stage.
MINERALIZATION Naturally occurring alkaline and alkaline-earth oxides react chemically with CO2 to produce minerals such as calcium carbonate (CaCO3) and magnesium carbonate (MgCO3). These minerals are highly stable and there is little concern that the CO2 they contain would be released back into the atmosphere. Carbonates can be used as filler materials in paper and plastic products. They can also be used in construction. Mineralization linked with cement production qualifies for a tax credit in the U.S., thus providing an incentive for this approach to carbon capture. Other approaches to mineralization could be coupled with hydrogen gas (H2) production and would convert calcium and magnesium silicates to carbonates. Mineralization pathways can be integrated with flue gas streams, biomass utilization, and syngas generation, but these approaches are still in the research and development phases. As with any potential solution, there are tradeoffs to be considered. For some approaches to mineralization, researchers are studying water use, heavy metal release, energy requirements and land use impacts of mining necessary to acquire the needed silicates, and changes in the frequency of seismic events in areas where dissolved CO2 is injected to promote in-situ mineralization.
BIOENERGY PRODUCTION WITH CARBON CAPTURE AND SEQUESTRATION (BECCS) Meeting our goals for emission reduction will require efforts on many fronts. By combining bioenergy production with carbon capture technology, we can create net-negative carbon systems to help move towards our emission-reduction goals. Where biomass from agricultural waste or landfill gas is burned for energy production, if coupled with post-combustion carbon capture, the process could result in lowering atmospheric CO2 levels. This approach is highly scalable and uses existing technology.
©2026
Carbon Capture, Utilization, and Storage
www.NEED.org
Oil and Natural Gas Production and Exploration Oil and Gas Production and Exploration Sleipner West North Sea Production wells
Carbon Dioxide CAP ROCK
CO2 injection well Utsira saline formation Sleipner East Field In the North Sea, Equinor (formerly Statoil), an international energy company, has been capturing and storing CO2 from natural gas production 1996.an Captured directly from natural production, In the North since Sea, Statoil, international energy company, hasgas been 2,625 CO feetfrom (800 m) below the seabed. OverCaptured 14 million CO 2 is stored capturing and storing natural gas production since 1996. 2 metric tons of CO2 have been stored inside the Utsira formation since directly frombegan. natural gas production, CO2 is stored 2,625 feet (800 m) below the project
the seabed. Over 11 millions tons of CO2 have been stored inside the Utsira formation since the project began. Phase Diagram of CO Phase Diagram of CO2 2
D
Pressure (atm)
Cement manufacturing is an energy intensive project that usually produces a large amount of CO2. After energy production, cement manufacturing is the second-largest industrial source of greenhouse gases. This is mainly due to limestone calcination, a process where limestone is decomposed and heated in a kiln. This process releases huge amounts of CO2. Scientists have recently created a process that consumes CO2 from onsite flue gases and local combustion sources, and repurposes it as part of the concrete-curing process, which will sequester the carbon dioxide for many years, acting as a semipermanent storage product. One approach developed by scientists at the Lawrence Livermore National Laboratory and Northwestern University uses calcium silicates from basalt, recycled concrete and industrial waste, and CO2 to produce calcium carbonate (CaCO3), eliminating the need for limestone decomposition. To explore some of the chemistry behind this approach, see the activity on page 44.
Critical Point
72.79 atm
Solid
5.11 atm
C
Liquid
Triple Point
B -56.57 °C
A
Super Critical fluid
Gas 30.98 °C
Temperature (°C)
Geologic Storage Determining a suitable location for CO2 storage depends on a thorough site assessment. Sites are evaluated for their reservoir capacity, injectivity rates, and abilities to contain CO2. Using a variety of tools, geologists study the area to make sure the reservoir is capable of containing the CO2 indefinitely. CO2 is injected as a liquid into porous rock formations that hold, or once held, fluids. Injecting CO2 deeper than 800 meters will allow the natural pressure of the Earth to keep CO2 in a liquid state, which makes it less likely to migrate out of the formation. There are a few potential reservoirs for storing significant amounts of CO2 within the Earth—oil and natural gas fields, deep saline formations, and unmineable coal seams. The capacity estimates for each of these reservoirs continue to evolve as researchers learn more about each area. Other options for storage include basalt and organic rich shale formations.
27
North American Oil and Natural Gas Reservoirs
DEPLETED OIL AND NATURAL GAS FIELDS Using depleted oil and natural gas reservoirs without enhanced oil recovery is another option for CO2 storage, but there are no end use cost benefits. The advantage with this option is that the geology of the reservoirs is well understood, and for hundreds of thousands of years they trapped fluids, proving the structural integrity of the reservoir. Because these are depleted reservoirs, the infrastructure and wells from oil and natural gas extraction are already in place. It may be possible to convert these for transporting the CO2 into the reservoir. If not properly capped, however, the same wells may be a conduit for CO2 release, so monitoring is essential. Usually these reservoirs are quite a distance from the CO2 source, so constructing pipelines to connect the source to the reservoir could be costly, unless existing infrastructure can be repurposed.
DEEP SALINE FORMATIONS
Data: U.S. Department of Energy’s National Energy Technology Laboratory
The largest potential capacity for CO2 storage is deep saline formations. In these geologic formations, salt water, called brine, is stored in the rocks' pores and is unsuitable as drinking water or for agriculture. Saline formations are found both onshore and in subsea rock offshore. Saline reservoirs are common throughout the U.S. and have a higher probability of being located closer to point sources for CO2 than oil and gas reservoirs.
Strategiesfor forGeologic Geologic Storage Strategies StorageofofCarbon CarbonDioxide Dioxide
1
2
DEPLETED OIL RESERVOIRS
3
DEEP SALINE FORMATIONS
Deep saline formations are layers of porous rock saturated with brackish water. They are more abundant than oil-bearing rock and coal seams and hold much potential for storing CO2. However, much less is known about saline formations than is known about crude oil reserves and coal seams. Many existing sources of CO2 are within easy access of potential saline formation injection points, which would limit pipeline transportation.
These formations hold crude oil in layers of porous rock. Above the oil, a layer of non-porous rock (cap rock) traps the oil. This also can trap injected CO2. As an added benefit, the CO2 can help release any remaining oil, allowing it to be pumped to the surface. The U.S. already uses about 60 million metric tons of CO2 per year for this purpose.
CAP ROCK
CAP ROCK
UNMINEABLE COAL SEAMS
Coal beds typically contain amounts of methane (natural gas). Injecting CO2 into coal releases methane, which is captured and brought to the surface. Tests have shown the absorption rate for CO2 to be about twice that of methane. Limited CO2 recovery of coal-bed methane has been demonstrated in field tests, but more testing is necessary.
CAP ROCK COAL SEAM
OIL RESERVOIR CO 2
CO 2 OIL
CO 2 METHANE
Redrawn with permission from The Columbus Dispatch, originally published November 6, 2007
28
©2026 Carbon Capture, Utilization, and Storage
www.NEED.org
Coal Basins
DeepFormations Saline Formations Saline
Assessed Coal Area Coal Basins
Data: U.S. Department of Energy
Data: U.S. Department of Energy
When injected into the brine, CO2 is expected to eventually dissolve and later mineralize to become part of the rock formation. Since 1996, the Sleipner Project in the North Sea has been utilizing this technology. Over 1 million metric tons (1MMt) of CO2 is stored each year in the Utsira formation, a sandstone reservoir below the sea that is 200-250 m (650-820 ft) thick and contains saline fluids. Because of the depth, pressure, and temperature, it stays liquid. The CO2 is trapped below a very thick layer of ceiling rock. There are no signs that the CO2 has leaked out from the formation, and researchers believe that the CO2 will dissolve into the saline. Scientists estimated that saline aquifers may store up to 10,000 gigatonnes (Gt) of CO₂.
Basalt BasaltFormations Formations
UNMINEABLE COAL SEAMS The U.S. has the largest recoverable coal reserves in the world. Even so, with today’s technology a very high percentage of coal resources remain unmineable. The U.S. Department of Energy estimates unmineable coal seams in the U.S. have more potential capacity for CO2 storage than oil and natural gas fields. Methane is a gas commonly found trapped in coal seams. CO2 will adhere to coal more tightly than methane does. For every methane molecule released, three to thirteen CO2 molecules can be adsorbed to the coal. This means CO2 could be injected into a coal seam and the methane would be displaced and potentially recovered at the surface as a source of revenue. This is called enhanced coalbed methane recovery (ECBM). Burning methane releases CO2, but there still is a net storage of CO2 in the unmineable coal seam. Whether storing CO2 in unmineable coal seams for use with ECBM, or using the seam as a storage site without ECBM, unmineable coal seams are often located near large CO2 point sources, which would reduce transportation distances. This technology has been demonstrated successfully in the Powder River Basin in Wyoming and Montana, where a pilot project stored 2 billion cubic feet of CO2. Large-scale implementation of this approach is not yet economically feasible.
©2026
Carbon Capture, Utilization, and Storage
www.NEED.org
Data: Idaho National Laboratory
BASALT FORMATIONS Basalt is a rock that forms when molten lava cools and hardens relatively quickly. Basalt is the most abundant volcanic rock and makes up much of the oceanic crust. When CO2 is dissolved in water at the surface, it can the be injected into basalt formations. Basalt is considered highly reactive, as it contains lots of minerals with calcium and magnesium that chemically react with the CO2 and mineralize it, creating calcite, dolomite, or magnesite relatively rapidly—as little as a few years (versus thousands of years with other CCS methods). By mineralizing the CO2, it is effectively permanently stored and no longer cycles in and out of the atmosphere. This process has been tested with success in Iceland by a company called CarbFix. In Iceland, geothermal power stations also produce CO2. Due to the geology in Iceland, the power stations sit on top of basalt-rich rock. CarbFix has been able to use direct capture (DAC) of the CO2 that is emitted as the hot water is drawn up from the ground. They then dissolve it in the wastewater and inject it right back into the basalt underground. In their initial testing, they found that over 90% of the injected CO2 was mineralized within two years of its injection.
29
Researchers with the Pacific Northwest National Laboratory (PNNL) had similar findings at the Wallula Basalt Carbon Storage Project in Washington. Flood basalts are formations where large amounts of land are covered with lava. These formations have a higher porosity and permeability than some basalts, which makes them good candidates for injection and storage. The Columbia River is home to some of these formations. Here, the team injected nearly 1,000 metric tons of CO2, found a mineralization rate similar to that of the Iceland project, and estimated that the region's reservoirs could mineralize up to 40 gigatons of CO2. These methods are also being studied for other rock types and in offshore settings where sequestration had not been considered. Scientists are also trying to use the minerals that may exist in basalt formations to help speed up the process of mineralizing where these rates are slower. Reactant minerals like those in basalt can be mined, processed, and transported for further processing. They are then piped into a CO2 stream for mineralization above ground where solid particles can be separated out and stored. The entire process is much more energy intensive, however, and requires several metric tons of mineral product to store one ton of CO2. It has been applied on small scales but may be difficult to employ on larger scales.
ORGANIC-RICH SHALE BASINS Shale is a sedimentary rock formed from silicate minerals that degrade into clay particles over the course of millions of years. Shales tend to form structures resembling stacked plates which limits their vertical permeability, trapping fluids beneath them. Shales are often used as a confining zone or cap rock in geological storage. Organic-rich shales have a high capacity to adsorb or adhere to CO₂ molecules due to the presence of kerogen, an organic matter that is highly porous. CO₂ can be stored within the pores of the shale matrix by adsorbing onto the surface of the organic material. This is similar to how natural gas is stored in these formations, but CO₂ has an even higher adsorption affinity, meaning it can be stored more effectively. Geologic storage solutions are further along in development than other storage options, but research is ongoing.
CCUS Costs In order to mitigate climate change, using CCUS technologies need to be a part of the solution. Capturing CO2 offers the most viable way to significantly reduce the CO2 impact on the evironment of generating electricity at the current level with the resources readliy available. There will be other environmental impacts and economic costs for pursuing CCUS technologies. Capturing and compressing CO2 with today’s technology is energy intensive and will lower a power plant’s efficiency. A power plant using current CCUS technologies will require 10-40 percent more energy than an equivalent plant without CCUS. For example, a power plant that generates 1,000 megawatts (MW) of electricity could require up to 300 MW for CCUS. Additional fuel will be needed to make up the energy requirement for capturing and compressing the CO2. This means additional plants will need to be built to meet the consumer demand for electricity and the additional load requirements for CCUS. Even with the additional plants, net CO2 capture is expected to be 80-90 percent.
30
U.S. Average Levelized Costs ($/Megawatthour) for Plants Entering Service in 2030 Coal (Combustion with CCS) Natural Gas-fired Conventional Combined Cycle Advanced CC with CCUS Advanced Nuclear Wind (Onshore) Wind (Offshore) Solar PV Geothermal Biomass Hydropower
$133.88 $64.55 $48.78 $81.45 $29.58 $88.16 $31.86 $37.58 $80.85 $58.54
Data: Annual Energy Outlook 2025, EIA
Average Residential Price for Electricity, 2025 PRICE PER KILOWATT-HOUR < 12¢ / kWh 16-20¢ / kWh WA OR
ID NV
CA
MT
ND
AZ
VT MI
IA IL KA
MO
OK
AR
NM TX
LA
NH
NY
WI
NE CO
14-16¢ / kWh > 30¢ / kWh
MN
SD
WY UT
12 to 14¢ / kWh 21-29¢ / kWh
OH
IN
KY
PA WV
TN MS
AL
VA NC
ME MA RI CT NJ DE MD
SC GA FL
AK WASHINGTON, D.C. HI Data: Energy Information Administration
Older power plants retrofitted with CCUS technology will see a greater reduction in overall efficiency than plants with CCUS technology incorporated into the design. The cost will also be higher to retrofit plants than for new builds. This is due to adapting plant configuration for a capture unit, a shorter lifespan of the plant compared to a new unit, and lost revenue when the plant is offline undergoing the retrofit. Overall, the U.S. Department of Energy estimates that the cost of electricity would increase 80 percent if current CCUS technologies were used to retrofit existing pulverized coal power plants. In addition, the capture technology requires a great deal of physical space. Many plants may not have the physical space in which to build the capture unit.
©2026 Carbon Capture, Utilization, and Storage
www.NEED.org
The use of CO2 for EOR is already occurring, and the demand for CO2 is higher than the supply. Potential for CO2 use with EOR is smaller compared to other geologic storage options, but a need exists right now. In the short term, EOR is believed to be a promising market for CO2. In the long term, however, the capacity of this reservoir is relatively small and few companies will be able to take advantage of selling CO2 to oil and natural gas companies for EOR purposes. In recent years, the cost of CCUS has declined some thanks to earlier pilot projects. Some earlier full-scale projects were abandoned due to cost overruns. Financial incentives can offset these additional costs, helping to make some new large-scale projects feasible. The Inflation Reduction Act, (enacted in 2022), extended and significantly increased the tax credit for CO2 sequestration. Together, this tax credit and the funding included in the Infrastructure and Investment and Jobs Act (enacted in 2021) incentivize the deployment of CCUS and other greenhouse gas (GHG) emission control technologies. Some projects begun under these programs are now stalled due to a change in administration. It is expected that costs will be high for the first few plants and decrease as the demand for CCUS technology grows. In July of 2024, carbon pollution standards issued by the EPA went into effect for power plants that set CO2 limits for new gas-fired combustion turbines and CO2 emission guidelines for existing coal, oil and natural gas-fired steam generating units. These rules were meant to bring clarity to generation facilities and incentivize investments in CCUS technology. These rules required that all long-term coal-fired plants and new baseload natural gas-fired plants control 90% of their carbon emission to significantly reduce carbon pollution. The standards were analyzed for impact and projected emissions reduction of 1.38 billion metric tons of CO2 by 2047, and a reduction of other harmful air pollutants as well. However, in 2025, under the direction of President Trump, the EPA has rolled back its standards while the federal government reviews the final rules.
CCUS Safety As CCUS pilot and demonstration projects progress toward commercial scale projects, safety is a key component in all stages. There are thousands of miles of CO2 pipelines in the U.S., the first of which was the Canyon Reef Carriers Pipeline, which began operation in 1972. The Canyon Reef Carriers Pipeline is located in Scurry County, TX and was built to bring CO2 from Shell Oil Company gas processing plants to the Texas Val Verde Basin. CO2 pipelines, as with natural gas and petroleum pipelines, are regulated by the U.S. Department of Transportation’s Office of Pipeline Safety. While CO2 is a non-flammable gas, CO2 pipelines have many of the same safety requirements as pipelines carrying crude oil and gasoline. However, CO2 pipelines have a fairly safe history, relative to other pipelines. Over a 20-year period (1986-2006), there were only twelve total leaks in CO2 pipelines. None of these incidents resulted in injuries to people. Transporting CO2 by pipeline is a safe transportation option.
The permeable rock space where CO2 is stored is capped by an impermeable cap rock. This restricts any upward movement of the CO2. In addition, the reservoirs and wells are closely monitored. Scientists use 4D seismic surveys with temperature and pressure sensors to monitor and map the CO2 as it is injected and once it is underground. Those involved with CCUS projects are committed to developing safe technologies for capture, transport, utilization, and storage.
Conclusion Incorporating additional CCUS technology into existing plants and new designs is expensive. The research conducted in laboratories and at small scale facilities in recent decades has yielded promising results that have motivated the development of utility scale projects such as Bayou Bend near Port Arthur, TX and Project Tundra near Center, ND. As of 2026, there are more than 20 operational CCUS facilities in the U.S. according to the International Energy Association (IEA). Of these 15 use CO2 for EOR with a combined capacity over 20 MtCO2 per year. Only five of these facilities are dedicated to storage, with a combined capacity of just over 1 MtCO2 per year. However, there are a lot of new projects on the horizon. As of this writing, eleven projects are under construction for dedicated storage with an estimated capacity of over 16 MtCO2 per year. 220 projects are officially in planning in the U.S. according to the IEA, with an estimated capacity of almost 380 MtCO2 per year dedicated to storage. Managing anthropogenic or man-made sources of CO2 is important on a worldwide scale. More than 100 countries signed the Kyoto Protocol in 1997, agreeing to work toward stabilizing greenhouse gas levels in the atmosphere to prevent human impact on the world’s climate, however, this agreement was non-binding. The Paris Agreement is a legally binding international treaty on climate change. It was adopted by 196 entities at the UN Climate Change Conference (COP21) in Paris, France, in December 2015 and became effective in November 2016. The U.S. withdrew from this agreement for a short time, recommitted in 2021, and withdrew again in 2026. Regardless of U.S. participation, the Paris Agreement is a landmark in the multilateral climate change process because, for the first time, a binding agreement brings nations together to combat climate change and adapt to its effects. Implementation of the Paris Agreement requires economic and social change, based on the best available science. The Paris Agreement works on a five-year cycle of increasingly ambitious actions carried out by member countries. Since 2020, countries have been submitting their national climate action plans, known as nationally determined contributions (NDCs). Each successive NDC is meant to reflect an increasingly higher degree of ambition compared to the previous version. It will take many different CO2 management approaches to reduce atmospheric CO2 levels including improving efficiency, lowering demand, increasing the use of renewable energy sources, and CCUS.
Selecting an appropriate geologic storage site is an important factor in reducing risks associated with CO2 storage. A suitable site will contain porous rocks that will trap the CO2. Natural mechanisms in the porous rock will contain the CO2 within its pore spaces. When CO2 interacts with the brine (salt water) found in the permeable rock, the CO2 will eventually dissolve. The solution becomes a weak acid, which over time forms new minerals binding the CO2 to rocks permanently. ©2026
Carbon Capture, Utilization, and Storage
www.NEED.org
31
Carbon Dioxide and CCUS KWL Chart What I Think I Know
32
What I Want to Know
What I Learned
©2026 Carbon Capture, Utilization, and Storage
www.NEED.org
Carbon Footprint Given The average gallon of gasoline weighs approximately 6.3 pounds. Gasoline is roughly 81% carbon by weight. Therefore, the average gallon of gasoline contains roughly 5.1 pounds of carbon. One four-pound bag of charcoal briquettes contains approximately 75 briquettes. Charcoal is carbon residue left behind from combustion. Four pounds of carbon/75 briquettes = 0.05 lbs. carbon per briquette
Sample Problems 1. If you drive or ride in a vehicle that averages 25 miles per gallon (mpg), how many briquettes per mile would you be emitting?
2. If each briquette of charcoal contains 0.05 lbs. of carbon, how many pounds of carbon are emitted each mile?
? Questions 1.
How many miles per gallon does your car (or a family member's car) average?*
2.
How many briquettes per mile would be emitted while driving your vehicle?
3.
If each briquette contains 0.05 lbs. of carbon, how many pounds of carbon are you emitting per mile?
4.
How many miles do you drive or ride to school?
5.
Calculate how much CO2 you are emitting as you travel to school in a personal car.
6.
How many miles do you travel on the average day? Think about everywhere you might go on an average day.
7.
Calculate how much CO2 you are emitting in a personal car as you travel on an average day.
Conclusions 1. Do you think people would change their behavior if carbon dioxide were emitted in a visible way, such as charcoal briquettes, rather than as a gas? Why or why not? 2. What are challenges in decreasing the amount of carbon dioxide emitted from our vehicles? 3. What might be some options for reducing the amount of carbon dioxide emitted by the transportation sector?
*NOTE: To find the estimated fuel economy of your vehicle, visit www.fueleconomy.gov.
©2026
Carbon Capture, Utilization, and Storage
www.NEED.org
33
Properties of CO2 What are the properties of CO2 as a gas? Record your observations below.
34
©2026 Carbon Capture, Utilization, and Storage
www.NEED.org
Modeling Combustion Materials Molecular modeling kit (or similar objects)
Procedure 1.
Use the spheres to build a molecule of methane (CH4). Draw the model below:
2.
Build two oxygen (O2) molecules. Draw the model below:
3.
In combustion, thermal energy + oxygen + hydrocarbons release energy we can use. This combination also releases other byproducts. Use your models to help you balance the equation:
CH4 + 2O2
Draw the products of combustion below:
©2026
Carbon Capture, Utilization, and Storage
www.NEED.org
35
Separating Mixtures ? Problem You have been given 100 g of a gravel/sand/salt mixture. You need to use your understanding of physical properties to recover the sand from this mixture.
Materials Make a list of the materials you will need: 100 g of Gravel/salt/sand mixture
Procedure 1. Make a plan to recover the sand. Describe this plan below. 2. Implement your plan. Take notes about what you did and any changes you made along the way. 3. Record the amount of sand you were able to recover. Ask your teacher to tell you the amount of sand you originally were given in the mixture. 4. Compare the amount of sand you recovered to the known amount. Calculate your percent error.
The Plan
Implementing the Plan
Data Amount of sand recovered: Calculate your percent error for recovering sand: Percent Error = Measured Value - Actual Value x 100 Actual Value
Conclusions 1. What physical properties of the materials allowed you to recover the sand? 2. How successful were you at recovering the sand? What changes would you make to be able to recover more sand? 3. Describe a challenge you might face if separating a mixture of gases.
36
©2026 Carbon Capture, Utilization, and Storage
www.NEED.org
Exploring Porosity ? Question Which size material will have the greatest porosity?
Hypothesis Write a hypothesis to address the question.
Materials 350 cm3 Small gravel 350 cm3 Medium gravel 350 cm3 Large gravel 100 mL Graduated cylinder 3 – 600 mL Beakers Water (can be dyed with food coloring) Safety glasses
Procedure 1. Fill one beaker to the 350-cm3 mark with large gravel, fill a second beaker with 350 cm3 of medium gravel, and fill the third beaker with 350 cm3 of small gravel. 2. Fill the graduated cylinder with 100 mL of water dyed with food coloring. 3. Slowly pour water into the first beaker until the water just reaches the top of the rocks. Record exactly how much water you poured into the beaker. If you need more than 100 mL of water, fill the graduated cylinder again. 4. Follow step 3 for the other two beakers. 5. Calculate the porosity of the three materials using this formula:
Porosity =
volume of water volume of material
x 100.
*Reminder 1 cm3 = 1 mL
Data TYPE OF MATERIAL
VOLUME (mL) OF WATER POURED
VOLUME (cm3) OF MATERIAL
PERCENTAGE OF PORE SPACE IN MATERIAL
Large gravel Medium gravel Small gravel
Conclusions 1. Did the results allow you to confirm or reject your hypothesis? Explain using experimental data.
2. How does porosity affect the ability of a material to contain carbon dioxide?
©2026
Carbon Capture, Utilization, and Storage
www.NEED.org
37
Enhanced Fuel Recovery Model OPTION A: DRY ICE
YouTube Demonstration of Activity
? Question
How does using carbon dioxide allow additional oil and gas to be recovered from reservoirs that are slowing production?
Hypothesis Write a hypothesis to address the question.
Materials 1 Mason jar lid with two ¼" holes 1 Mason jar lid with one ¼" hole 1 Empty water bottle 2 24” x ¼” Tubing 1 Piece of dry ice, about the size of an ice cube Assorted rocks, sand, and marbles 150 mL Vegetable oil or lamp oil
350 mL Water Silicone sealant Tongs Gloves Safety glasses Tape 1 Dark color of food dye (optional)
Procedure 1.
Review Dry Ice Safety rules with your teacher and your group members.
2.
Put one piece of tubing through the lid with two holes. Slide the tubing all of the way down into the bottom of one jar. Tape the tubing to the inside of the jar to hold it in place. This jar will serve as your reservoir jar. Place the other end of this tube into the water bottle. The water bottle will serve as your production bottle.
3.
Insert the second piece of tubing about 5 cm through the second hole in the lid for the reservoir jar. Insert the other end of this tubing about 5 cm into the lid with one hole for the other empty mason jar. The jar with one hole in the lid will serve as your CO2 injection jar.
4.
Secure the tubing in both lids with sealant. (If time permits, allow the sealant to dry prior to executing the experiment for better results.)
5.
Fill the reservoir jar with marbles, rocks, and/or sand. Leave about an inch of open space at the top of the reservoir jar.
6.
Add 150 mL of oil to the reservoir jar. This represents crude oil stuck within the rocks below ground.
7.
Fill the remainder of space in the reservoir jar with water, being careful to fill only up to the top of the rocks/marbles/sand. Dye the water with food coloring if you desire.
8.
Secure the lid with two holes on the reservoir jar tightly.
9.
Pinch off the tubing and gently rotate and mix the reservoir jar. Release the pinch in the tubing.
10. Using tongs, place a piece of dry ice into the CO2 injection jar with one tube in its lid. Secure the lid tightly and be prepared for the production bottle to start filling up with recovered oil and water from the reservoir.
38
CONTINUED ON NEXT PAGE ©2026 Carbon Capture, Utilization, and Storage
www.NEED.org
Observations Draw a diagram of your reservoir model. Describe what is happening. Where is the CO2 going? Where is the oil going? How much oil were you able to recover?
Conclusions 1. How does carbon dioxide allow for enhanced hydrocarbon recovery?
2. What are some of the benefits? What are some of the challenges?
©2026
Carbon Capture, Utilization, and Storage
www.NEED.org
39
Enhanced Fuel Recovery Model OPTION B: EFFERVESCENT TABLETS
YouTube Demonstration of Activity
? Question
How does using carbon dioxide allow additional oil and gas to be recovered from reservoirs that are slowing production?
Hypothesis Write a hypothesis to address the question..
Materials 1 Mason jar lid with two ¼" holes 1 Mason jar lid with one ¼" hole 1 Empty water bottle 2 24” x ¼” Tubing Effervescent tablets Assorted rocks, sand, and marbles 150 mL Vegetable oil or lamp oil 350 mL Water
Silicone sealant Tongs Gloves Safety glasses Piece of tissue paper Tape 1 Dark color of food dye (optional)
Procedure 1.
Put one piece of tubing through the lid with two holes. Slide the tubing all of the way down into the bottom of one jar. Tape the tubing to the inside of the jar to hold it in place. This jar will serve as your reservoir jar. Place the other end of this tube into the water bottle. The water bottle will serve as your production bottle.
2.
Insert the second piece of tubing about 5 cm through the second hole in the lid for the reservoir jar. Insert the other end of this tubing about 5 cm into the lid with one hole for the other empty mason jar. The jar with one hole in the lid will serve as your CO2 injection jar.
3.
Secure the tubing in both lids with sealant. (If time permits, allow the sealant to dry prior to executing the experiment for better results.)
4.
Fill the reservoir jar with marbles, rocks, and/or sand. Leave about an inch of open space at the top of the reservoir jar.
5.
Add 150 mL of oil to the reservoir jar. This represents crude oil stuck within the rocks below ground.
6.
Fill the remainder of space in the reservoir jar with water, being careful to fill only up to the top of the rocks/marbles/sand. Dye the water with food coloring if you desire.
7.
Secure the lid with two holes on the reservoir jar tightly.
8.
Pinch off the tubing and gently rotate and mix the reservoir jar. Release the pinch in the tubing.
9.
Pour 350 mL of water into the CO2 injection jar.
10. Make a packet for the 6 effervescent tablets out of a single piece of tissue paper and twist it closed. 11. Holding the lid set-up of the CO2 injection jar close to the mouth of the jar, quickly drop the tissue paper packet into the CO2 injection jar. 12. Immediately secure and tighten the lid of the CO2 injection jar. 13. The tissue paper will get wet, permitting the tablets to fizz. Swirl the jar around gently to encourage all of the tablets to dissolve. Be prepared for the production bottle to start filling up with recovered oil and water from the reservoir.
40
CONTINUED ON NEXT PAGE ©2026 Carbon Capture, Utilization, and Storage
www.NEED.org
Observations Draw a diagram of your reservoir model. Describe what is happening. Where is the CO2 going? Where is the oil going? How much oil were you able to recover?
Conclusions 1. How does carbon dioxide allow for enhanced hydrocarbon recovery?
2. What are some of the benefits? What are some of the challenges?
©2026
Carbon Capture, Utilization, and Storage
www.NEED.org
41
Carbon Sequestration Projects Name of partnership or project: What states and/or provinces are part of the project?
What research is being done by the project?
Choose one project to study more in depth and create a multimedia presentation to share with your class. Use the flow chart on the next page to help focus your presentation.
42
©2026 Carbon Capture, Utilization, and Storage
www.NEED.org
Who is involved?
BACKGROUND
When did it start?
Project Name: ________________________________________
How is the CO2 being used?
CO2 Utilization
Make up your own question category and include at least three sub-questions.
OTHER
Location: ________________________________
THE SCIENCE CO2 Storage
How much has been stored already?
What is the geology of this location?
Why was this site chosen?
What is the CO2 source?
How is the CO2 captured?
What is the CO 2 storage location?
How is the CO2 transported?
What lessons have been learned?
THE FUTURE
What is next?
Is the project scalable?
Will new plants be built using this model?
________________________________________________
________________________________________________
________________________________________________
43
www.NEED.org
Carbon Capture, Utilization, and Storage
©2026
Calcium Carbonate Precipitation Introduction Conventional cement manufacturing uses an enormous amount of energy and produces a huge amount of CO2. This is in part due to steps needed to prepare limestone, an essential raw material in cement manufacturing. Once the extensive treatment process with the limestone is complete, the product, calcium carbonate (CaCO3), is fed into the process of making cement. To avoid some of the energy use from these steps, scientists have developed a process that uses CO2 from onsite flue gases and recycled concrete to generate CaCO3 materials for cement manufacturing rather than from the treated limestone. This process eliminates the need for mining, transporting, and processing limestone, and generates valuable hydrogen gas as a byproduct. Carbon dioxide is slightly soluble in water. An equilibrium occurs as some CO2 reacts with water to form carbonic acid (H2CO3):
CO2(aq)+ H2O(l) ⇌ H2CO3(aq)
When a weak acid is in an aqueous solution, some of the units dissociate to yield hydrogen ions (H+) and its conjugate base. Carbonic acid is a weak acid, so some units of H2CO3 dissociate into hydrogen ions (H+) and hydrogen carbonate ions (HCO3−) H2 CO3(aq) ⇌ H+(aq) +HCO3− (aq)
Hydrogen carbonate ions (HCO3−) also behave as a weak acid, so some units of HCO3− dissociate in aqueous solution yielding hydrogen ions (H+) and carbonate ions (CO32−) HCO3-(aq) ⇌ H+(aq) + CO32−(aq)
When dealing with equilibrium reactions, we can push the reactions in one direction or another by removing or adding a component of the system. As explained by Le Chatelier’s Principle, if a system is changed by increasing the concentration of one of the reacting species, the reaction that consumes that species is favored. If a product is removed, this also shifts the equilibrium toward generating more of that product to reestablish balance. In this system, scientists drive the equilibrium to the right by removing carbonate ions (CO3 2−) from the system. The system is now out of balance, with the left side overloaded. The substances on the left of the equilibrium will dissociate until equilibrium is reached again. The more carbonate ions (CO3 2−) removed from the system at the end of the reaction series, the more carbon dioxide (CO2) we can feed into the process. When calcium ions (Ca2 +) encounter carbonate ions (CO32−) in solution they will usually form solid calcium carbonate (CaCO3) and precipitate from the solution. As carbonate ions are removed from the system by the precipitation of calcium carbonate, more carbon dioxide can be captured by feeding it into this series of equilibrium reactions. In this experiment you will investigate how pH of the solution affects the solubility of CaCO3. ? Question
How is the solubility of calcium carbonate (CaCO3) affected by the pH of a solution?
Hypothesis Write a hypothesis to address the question.
44
©2026 Carbon Capture, Utilization, and Storage
www.NEED.org
Materials Three test tubes with caps Test tube rack 1M Calcium chloride, low pH (prepared by your teacher) 1M Calcium chloride, near-neutral pH (prepared by your teacher) 1M Calcium chloride, high pH (prepared by your teacher) 1 mL Pasteur pipette 0.5M Sodium carbonate (prepared by your teacher)
Graduted cylinder Beaker (for waste) Squirt bottle of distilled water Paper towel pH Strips with scale Pencil or marker
Procedure 1.
Gather materials and put on your safety glasses.
2.
Label three test tubes, low pH, near-neutral pH, and high pH.
3.
Use the graduated cylinder to measure 10 mL of the 1M calcium chloride (low pH) solution and carefully pour it into the appropriate test tube.
4.
Rinse the graduated cylinder with a small squirt of distilled water and pour into waste beaker.
5.
Repeat steps 3 and 4 for the remaining calcium chloride solutions.
6.
Place a paper towel on the table in front of your test tube rack.
7.
Hold one tube at an angle and dip the bottom 1 cm of a pH test strip into the solution. Lay the test strip on the paper towel in front of the tube that you used for this test.
8.
Repeat step 7 for the other two tubes.
9.
Compare the colors of each test strip to the indicator color chart and record the pH of each solution. Take a photo if you have that option for use in a lab report (if required by your teacher).
10. Carefully pipette 1 mL of 0.5M sodium carbonate (Na2CO3) solution into each test tube. Cap and gently invert each tube several times and observe them for several minutes. Record your observations.
Data and Observations Low pH
Near-Neutral pH
High pH
Measured pH Observations
Analysis Was your hypothesis supported? Explain what happened.
Conclusion How does this relate to the process of carbon capture?
How does this process relate to cement manufacturing?
©2026
Carbon Capture, Utilization, and Storage
www.NEED.org
45
a
46
b
c
Glossary
absorption
the taking up and holding of a liquid or gas by a substance (a solid or liquid) through pores or gaps between molecules
acid
a chemical unit that when placed in water produces a hydrogen ion (H+) and reduces the pH
adsorption
the process of atoms, ions, or molecules adhering to a surface to form a film or layer
basalt
igneous rock type that make sup most of the Earth's volcanic rock; formed from volcanic material that cooled at the surface (extrusive, fine-grained), and is typically low in silicates, dark in color and high in magnesium and iron
anthropogenic
made or generated by a human or caused by human activity; used in the context of global climate change to refer to gaseous emissions that are the result of human activities, as well as other potentially climate-altering activities, such as deforestation
aqueous
a solution where the solvent is water, or more simply, a solution containing water
baseload
the minimum amount of power a utility must have available to its customers
carbon budget
the balance of the exchanges (incomes and losses) of carbon between carbon sinks (e.g., atmosphere and biosphere) in the carbon cycle, also called "carbon flux"
carbon capture, utilization, and storage (CCUS)
the fixation of atmospheric carbon dioxide in a carbon sink through biological or physical processes; also referred to as "carbon sequestration"
carbon cycle
all carbon sinks and exchanges of carbon from one sink to another by various chemical, physical, geological, and biological processes, also see carbon sink below
carbon dioxide (CO2)
a colorless, odorless, non-poisonous gas that is a normal part of Earth's atmosphere; a product of fossil-fuel combustion as well as other processes; considered a greenhouse gas as it traps heat (infrared energy) radiated by the Earth into the atmosphere and thereby contributes to the potential for global warming; the global warming potential (GWP) of other greenhouse gases is measured in relation to that of carbon dioxide, which by international scientific convention is assigned a value of one (1)
carbon sink
a reservoir that absorbs or takes up released carbon from another part of the carbon cycle; the four sinks, which are regions of the Earth, within which carbon behaves in a systematic manner, are the atmosphere, terrestrial biosphere (usually including freshwater systems), oceans, and sediments (including fossil fuels)
climate change
a term used to refer to all forms of climatic inconsistency, but especially to significant change from one prevailing climatic condition to another; has been used synonymously with the term "global warming;" scientists tend to use the term in a wider sense inclusive of natural changes in climate, including climatic cooling
coal
a combustible rock whose composition consists of more than 50 percent by weight and more than 70 percent by volume of carbonaceous material; formed from plant remains that have been compacted, hardened, chemically altered, and metamorphosed by heat and pressure over geologic time
coal gasification
the process of converting coal into gas, which involves crushing coal to a powder, which is then heated in the presence of steam and oxygen to produce a gas; the gas is then refined to reduce sulfur and other impurities and can be used as a fuel or processed further and concentrated into chemical or liquid fuel
combustion
chemical oxidation accompanied by the generation of light and heat
conjugate base
a chemical unit that can accept a hydrogen ion (H+); a conjugate base is left when a hydrogen ion is released from a Bronsted-Lowry acid; for example, NO3- is the conjugate base to nitric acid (HNO3)
dissociate
disconnect or separate naturally when placed in an appropriate solvent
electric grid
the series of interconnected power and transmission lines that deliver electricity to consumers
emissions
anthropogenic releases of gases to the atmosphere; in the context of global climate change, they consist of radiatively active greenhouse gases (e.g., the release of carbon dioxide during fuel combustion)
energy carrier
a secondary source of energy; a source that requires another source to create it
enhanced fuel recovery
the recovery of oil and gas from reservoirs using means other than using natural reservoir pressure; generally results in the removal of increased amounts of oil from a reservoir when compared to employing methods using natural pressure or pumping alone ©2026 Carbon Capture, Utilization, and Storage
www.NEED.org
equilibrium
a chemical system is in equilibrium when the forward and reverse chemical reactions occur at equal rates. Equilibrium is not limited to reactions, but can occur in a wide range of physical processes (example: thermal equilibrium)
flue gas
gases that are produced through the combustion of a fuel, which are normally emitted into the atmosphere
fossil fuel
fuels (coal, oil, natural gas) that result from the compression of ancient plant and animal life formed over hundreds of milions of years
gasification
a method for converting coal, petroleum, biomass, wastes, or other carbon-containing materials into a gas that can be burned to generate power or processed into chemicals and fuels
greenhouse effect
the result of water vapor, carbon dioxide, and other atmospheric gases trapping radiant (infrared) energy, thereby keeping the Earth's surface warmer than it would otherwise be; greenhouse gases within the lower levels of the atmosphere trap this radiation, which would otherwise escape into space, and subsequent re-radiation of some of this energy back to the Earth, causing it to maintain higher surface temperatures than would occur if the gases were absent
greenhouse gases
those gases, such as water vapor, carbon dioxide, nitrous oxide, methane, hydrofluorocarbons (HFCs), perfluorocarbons (PFCs), and sulfur hexafluoride, that are transparent to solar (short-wave) radiation but opaque to long-wave (infrared) radiation, thus preventing long-wave radiant energy from leaving Earth's atmosphere; the net effect is a trapping of absorbed radiation and a tendency to warm the planet's surface
injectivity rate
the rate at which fluid is inserted into a geologic formation; the rate at which carbon dioxide can be injected and the ability of the carbon dioxide to migrate from the injection well site
metric ton (Mton)
a metric ton is equivalent to 1,000 kilograms, and is strictly speaking a megagram (one million grams) a unit of weight equal to 2,204.6 pounds
mineralization
the process by which minerals carried in a fluid or water build up and crystallize or become rock
national determined contribution (NDC)
national climate action plans by countries participating in climate agreements (Paris Agreement) that outline efforts to reduce emissions
natural gas
a gaseous mixture of hydrocarbon compounds, the primary one being methane
petroleum
liquid hydrocarbon mixtures including crude oil, lease condensate, unfinished oils, and refined products obtained from the processing of crude oil, and natural gas plant liquids
pH
mathematically, pH is equal to the negative log of the hydrogen ion concentration in a solution (-log[H+]); the pH scale ranges from 0–14. Aqueous solutions with a pH of 7 are said to be neutral. Solutions with a pH below 7 are acidic, and above 7 are basic or alkaline.
precipitate (noun in chemistry)
a solid that forms in a chemical reaction where one of the products is insoluble (if the product of a chemical reaction is insoluble, it will result in a solid that floats to the bottom of the container; solid is called a precipitate)
precipitate (verb in chemistry)
to come out of solution and form a solid
reserves, coal
quantities of unextracted coal that comprise the demonstrated base for future production, including both proved and probable reserves
reservoir
a porous and permeable underground formation containing an individual and separate natural accumulation of producible hydrocarbons (crude oil and/or natural gas), which is confined by impermeable rock or water barriers and is characterized by a single natural pressure system
reservoir capacity
the present total developed capacity (base and working) of the storage reservoir, excluding contemplated future development
seam
a bed of coal
solubility
the degree to which a substance is able to dissolve in a solution
soluble
able to be dissolved in a specific solvent; for example, sugar is soluble in water
solution
a mixture in which the minor component (the solute) is uniformly distributed within the major component (the solvent)
sublimation
a change from the solid state to the gaseous state, without first passing through the liquid state
synthetic gas (syngas)
a manufactured mixture of gases including carbon monoxide (CO), CO2, and hydrogen, that is created by a conversion of hydrocarbons at high temperatures
terrestrial sequestration
the net removal of CO2 from the atmosphere or the prevention of CO2 net emissions from the terrestrial ecosystems into the atmosphere; terrestrial ecosystems include forest lands, agricultural lands, biomass croplands, deserts and degraded lands, and boreal wetlands and peatlands
©2026
Carbon Capture, Utilization, and Storage
www.NEED.org
47
Youth AWards Program for Energy Achievement
Youth Energy Conference & Awards
NEED’s annual Youth Awards Program for Energy Achievement rewards students for their efforts in energy outreach and student leadership.
The NEED Youth Energy Conference and Awards gives students more opportunities to learn about energy and to explore energy in STEM (science, technology, engineering, and math).
The Youth Awards Program is great for all schools—new to energy education, or veteran. Projects and outreach completed for the program provide opportunity for enrichment and engagement, as well as an opportunity for your students, classroom, and school to shine. Youth Awards projects can be completed by afterschool/out-of-school time programs, community groups, and even families!
The annual June conference has students from across the country working in groups on an Energy Challenge designed to stretch their minds and energy knowledge. The conference culminates with the Youth Awards Ceremony recognizing student work throughout the year and during the conference.
What’s involved?
For More Info: www.NEED.org/youthenergyconference
Students and teachers set goals and objectives and keep a record of their activities. Students create a digital project to submit for judging. In April, digital projects are uploaded to the online submission site.
Check out: For more information and project submission details, we invite you to visit https://youthawards.NEED.org. Be sure to explore the site to view past winning projects and garner inspiration!
48
©2026 Carbon Capture, Utilization, and Storage
www.NEED.org
Looking for more energy information and resources? Check out the “Student” section of NEED’s website for great energy information and resources, including our graphics library, science fair project ideas, video clips, our Energy Infosheets, and much more!
Visit www.NEED.org/NEED-students
URANIUM A T A GLANCE
Uranium pr ov energy cons ided almost 9 percen t umed in th e United St of all ates in 20
WHAT IS UR
ANIUM?
Uranium is a naturally occur ring radioactive heavy and is element, that classified as is very hard and a metal. It is fissioned. It is also one of the the fuel used few elements by nuclear powe that is easily the Earth was r plants. Urani created and um was forme is found in rocks a lot of urani d when all over the world um are called . Rocks that conta uranium ore, abundant, is or pitch-blen in a nonrenewa de. Urani um, although ble energy sourc Three forms e. (isotopes) of urani um are found uranium-235 in nature, urani and uranium-2 um-234, 38. These and protons numbers refer in each atom to the numb . Uranium-235 er of neutr production becau ons is the form comm se, unlike the only used for other isotopes, energy bombarded the nucleus splits by a neutron. During fissio easily when bombarding n, the uranium-2 neutron, causi 35 atom absor ng its nucleus bs a mass. At the to split apart same time, the into two atom fission reacti s of lighter radiation, as on releases energ well as releas y as heat and ing more neutr on to bombard ons. The newly other uranium released neutr atoms, and the ons go over. This is called process repea a chain reacti ts itself over on. and
WHAT IS NU
24.
URANIUM FU
EL CYCLE
The steps— from mining the uranium disposal—a ore, through re called the its use in a nucl uranium fuel ear reactor, cycle
to its
TOP NUCLEA
R STATES
CLEAR ENER
GY
Nuclear energ y is energy that comes from particles that the nucleus of make up all objec an atom. Atom ts in the unive s are the protons, and rse. Atoms consi electrons. Nucle st of neutrons, ar energy is releas two processes: ed from an atom nuclear fusion through one or nuclear fissio released when of n. In nuclear the nuclei of fusion, energ atoms are comb y is the sun produ ined or fused ces energy, In toget her. nucle This ar fission, energ is how of atoms are split apart. Nucle y is released when the nucle ar fission is the nuclear plant i only method s to generate currently used electricity. by
PENNSYLVAN
IA
GEORGIA
(The U.S.
does not
reprocess)
ALABAMA
©2026
Carbon Capture, Utilization, and Storage
www.NEED.org
49
Our Awesome Extras page contains PowerPoints, energy graphics, and other great resources to complement what you are teaching! www.NEED.org/educators/awesome-extras
E C N A L G A MASS AT
BIO WHAT IS
MASS PES OF BIO
BIOMASS?
TY
—that mal wastes seaweed, ani of wood, crops, oldest source c matter— t probably our any organi wood to hea Biomass is ned bur rce. Biomass is e sou hav rgy rs, people d as an ene usands of yea can be use sun. For tho energy the red r sto s afte tain energy ir food. c matter con the and cook the . All organi t gives plants their homes from the sun hesis, sunligh s its energy and sugars. ed photosynt Biomass get e into oxygen process call bon dioxid . During a mals that eat ter and car ani wa from the sun t the ver and energy for ply plants y need to con d source of energy the ydrates, sup s are a goo called carboh bohydrate These sugars, ds rich in car energy. Foo limited. We plants with plies are not sup its e y. aus bod rce bec the human exist. e energy sou will always a renewabl and waste Biomass is and crops, grow trees can always
THESIS
PHOTOSYN
pro agricultural wood and mass today— sel). die r types of bio We use fou ls (like Ethanol or Bio l fue oho alc and
ODUCTS bark, and LTURAL PRenergy. Wood—logs, chips, anic matter can D AGRICU WOOD AN used today is home grown mass energy. But any org l waste products
m the
rgy fro t radiant ene nts conver sugar) ynthesis, pla s of photos glucose (or the form of In the proces al energy in mic che o sun int
ss half of bio agricultura Most bioma just under can include accounts for mass sources sawdust— . Other bio is used by mass energy electricity produce bio Much of the corncobs. cess called electricity. te and era pits t gen s, it is a pro d to like frui ted by utilitie generate to waste are use ribu ts od dist duc wo not waste pro Wood and waste; it is y need to ch of their making the energy, the mills use mu the industries use so much ls and saw since they on. Paper mil . However, cogenerati for their use electricity s. itie util steam and from nal electricity buy additio nds) of (2,000 pou rgy. One ton e is not all form of ene STE coal. Garbag SOLID WAh turns waste into a usable pounds of made from rgy as 500 s, which are Burning tras ch heat ene stic mu pla as ut es from ed tains abo rgy are call content com ene rgy garbage con for e ene s half of its t burn garbag ed plants do, hap tha l-fir per nts ss; coa pla as bioma city much l gas. Power . erate electri and natura their boilers petroleum se plants gen l used to fire The . fue nts the pla is ergy not coal— waste-to-en e garbage— t combustibl except tha m
causing the
animals, OGAS d plants and itself. GAS AND BI They eat dea ars to feed LANDFILLfungi are not picky eaters. converting cellulose to sug is still
gas log is Bacteria and ed methane on a rotting stance call thane gas ay. A fungus dfill, a sub collect me to rot or dec ed in a lan landfills to is not process is slow tions require rless, but it Although this . New regula rless and odo ays colo dec is ste gas and is ne the wa rby homes sons. Metha nea produced as rea l into nta ps can environme ons if it see l. Methane and losi fue ty exp as safe it or s for use se fire esters are purify it, and gas can cau Biogas dig thane gas, harmless. The an wastes. ect the me tainers is tural and hum dfills can coll into the con from agricul ignited. Lan put rgy ste ene g Wa to ks. d duced usin can be use steel or bric also be pro lined with gas. This gas thane-rich tainers or pits duce a me airtight con gen to pro . without oxy and lighting fermented for cooking or , city ctri produce ele
50
ducts,solid
l gas and bio
waste, landfil
gas,
ches found ars and star ing the sug ch, or sugar by ferment cellulose, star hol) made containing l (ethyl alco comes al fue teri Sta hol ma ted tes an alco organic ed in the Uni Ethanol is g them. Any rs from anol produc then distillin woody fibe ty of the eth in jori se ma ulo in plants and cell ethanol. The anol from eth into de ing ma duc can be is logies are pro ethanol and New techno 10 percent from corn. residues. tains around roved the s, and crop the U.S. con ncy (EPA) app trees, grasse oline sold in vehicles tection Age all of the gas passenger mental Pro in iron use Env for . Today nearly e) U.S cent gasolin . In 2011, the 15 percent anol, 85 per known as E10 t ethanol and percent eth l ing 85 percen flexible fue n of E15 (15 Fuel contain 20 million introductio and newer. ll re are about year 2001 ever, a sma tive fuel. The How rna . from model alte E10 or an E85 s as 5) qualifie ciently on (E8 effi e run olin gas d that can V) on the roa regularly. vehicles (FF icles use E85 of these veh percentage l fats, or oils, anima h vegetable soybean oil. g alcohol wit BIODIESEL made by chemically reactin biodiesel today is made from ), five l t (B2 Most fue cen . a is per ase sel gre Biodie os of two d restaurant 00). diesel in rati h as recycle biodiesel (B1 h petroleum greases, suc neat (pure) blended wit ines with the be used as most often diesel eng It can also Biodiesel is unmodified the U.S. cent (B20). be used in ion fuels in ), or 20 per can rtat (B5 t spo and h cen tran per fuel ible wit wing fastest gro ion’s diesel ls are compat one of the ls in the nat Biodiesel fue ucture. It is sulfur leve astr uce infr red from ur ling so it can existing fue removing sulf ly no sulfur, nt and can fuels. While tains virtual erior lubrica low sulfur sup a ay’s is Biodiesel con tod sel h die wit important rication, bio n compared t. This is an in poor lub supply, eve two percen ur levels sel results only one or -based die uires that sulf in blends of petroleum ncy now req diesel fuel tection Age friction of mental Pro 6. reduce the iron 200 Env to r the prio because n they were tha er characteristic low cent l be 97 per in diesel fue
ETHANOL
©2026 Carbon Capture, Utilization, and Storage
www.NEED.org
Carbon Capture, Utilization, and Storage Evaluation Form State: ___________
Grade Level: ___________
Number of Students: __________
1. Did you conduct the entire unit?
Yes
No
2. Were the instructions clear and easy to follow?
Yes
No
3. Did the activities meet your academic objectives?
Yes
No
4. Were the activities age appropriate?
Yes
No
5. Were the allotted times sufficient to conduct the activities?
Yes
No
6. Were the activities easy to use?
Yes
No
7. Was the preparation required acceptable for the activities?
Yes
No
8. Were the students interested and motivated?
Yes
No
9. Was the energy knowledge content age appropriate?
Yes
No
10. Would you teach this unit again? Please explain any ‘no’ statement below.
Yes
No
How would you rate the unit overall?
excellent
good
fair
poor
How would your students rate the unit overall?
excellent
good
fair
poor
What would make the unit more useful to you?
Other Comments:
Please fax or mail to: The NEED Project
8408 Kao Circle FAX: 1-800-847-1820 Manassas, VA 20110 Email: info@need.org
©2026
Carbon Capture, Utilization, and Storage
www.NEED.org
51
National Sponsors and Partners AES AES Clean Energy Development Ameresco American Electric Power Foundation Appalachian Voices Arizona Sustainability Alliance Atlanta Gas Light–Southern Company Gas Atlantic City Electric Avangrid Baltimore Gas & Electric Berkshire Gas–Avangrid BP America Inc Bob Moran Charitable Giving Fund Cape Light Compact–Massachusetts Celanese Foundation Central Alabama Electric Cooperative Chattanooga Gas Company–Southern Company Gas CITGO The City of Cuyahoga Falls Clean Virginia CLEAResult Clearloop ComEd Confluence ConocoPhillips Constellation Energy Foundation Delmarva Power Department of Education and Early Childhood Development–Government of New Brunswick, Canada Dominion Energy, Inc. Dominion Energy Charitable Foundation DonorsChoose Eagle Creek Renewable Energy East Baton Rouge Parish Schools East Kentucky Power Cooperative EcoCentricNow EDP Renewables EduCon Educational Consulting Elmo Foundation Enel Green Power North America EnergizeCT ENGIE Entergy Equinix Eversource Exelon Exelon Foundation Foundation for Environmental Education FPL Fuel–Future Use of Energy in Louisiana Generac Georgia Power Gerald Harrington, Geologist Government of Thailand–Energy Ministry Greater New Orleans STEM GREEN Charter Schools Green Power EMC Guilford County Schools–North Carolina ©2026 The NEED Project
Independent Petroleum Association of New Mexico Interstate Natural Gas Association of America Foundation Intuit Iowa Governor’s STEM Advisory Council–Scale Up Iowa Lakes Community College Iowa State University Iron Mountain Data Centers Kansas Corporation Energy Commission Kansas Energy Program–K-State Engineering Extension Katy Independent School District Kentucky Environmental Education Council Kentucky Office of Energy Policy Kentucky Power–An AEP Company Liberty Utilities Llano Land and Exploration Louisiana State Energy Office Louisiana State University–Agricultural Center LUMA Marshall University Mass Save Mercedes Benz USA Minneapolis Public Schools Mississippi Development Authority–Energy Division Motus Experiential National Fuel National Grid National Hydropower Association National Laboratory of the Rockies National Ocean Industries Association NC Green Power Nebraskans for Solar NextEra Energy Resources Nicor Gas NCi–Northeast Construction North Shore Gas Offshore Technology Conference Ohio Energy Project Oklahoma Gas and Electric Energy Corporation Omaha Public Power District ONEOK Ormat Pacific Gas and Electric Company PECO Peoples Gas Pepco Performance Services, Inc. Permian Basin Petroleum Museum Phillips 66 PowerSouth Energy Cooperative PPG Prince George’s County Office of Human Resource Management (MD) Prince George’s County Office of Sustainable Energy (MD) Providence Public Schools Public Service of Oklahoma–AEP
8408 Kao Circle, Manassas, VA 20110
1.800.875.5029
www.NEED.org
Quarto Publishing Group The Rapha Foundation Renewable Energy Alaska Project Rhoades Energy Rhode Island Office of Energy Resources Salal Foundation/Salal Credit Union Salt River Project Salt River Rural Electric Cooperative Schneider Electric C.T. Seaver Trust Secure Solar Futures, LLC Shell USA, Inc. Silicon Ranch Corporation SMUD Society of Petroleum Engineers South Carolina Energy Office Southern Company Gas Snohomish County PUD Starwood Digital Ventures SunTribe Solar TXU Energy United Way of Greater Philadelphia and Southern New Jersey United Illuminating Unitil University of Iowa University of Louisville University of North Carolina University of Northern Iowa University of Rhode Island U.S. Department of Energy U.S. Department of Energy–Office of Energy Efficiency and Renewable Energy U.S. Department of Energy–Solar Decathlon U.S. Department of Energy–Water Power Technologies Office U.S. Department of Energy–Wind for Schools U.S. Energy Information Administration United States Virgin Islands Energy Office Vineyard Wind Virginia Cooperative Extension Virginia Natural Gas Virginia Natural Gas–Southern Company Gas Vistra Energy We Care Solar West Virginia Office of Energy West Warwick Public Schools Williams Woodside Energy Workers Renewable Energy Fund Worldwide Mission Critical