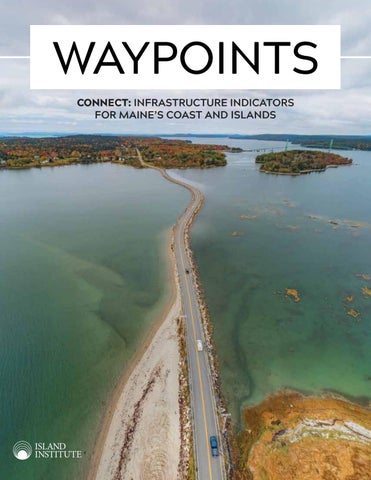
WAYPOINTS CONNECT: INFRASTRUCTURE INDICATORS FOR MAINE’S COAST AND ISLANDS
Contents MISSION The Island Institute works to sustain Maine’s island and coastal communities, and exchanges ideas and experiences to further the sustainability of communities here and elsewhere.
INTRODUCTION . . . . . . . . . . . . . . . . . . . . . . . . . . . . . . . . . . . . . . . . . . . . . . . . 1 COASTAL MAINE AT A GLANCE. . . . . . . . . . . . . . . . . . . . . . . . . . . . . . . . . . . 2 BROADBAND Economic Feasibility. . . . . . . . . . . . . . . . . . . . . . . . . . . . . . . . . . . . . . . . . 4 Connecting Remote Communities to the World. . . . . . . . . . . . . . . . . 6 TRANSPORTATION
CONTACT 386 Main Street P.O. Box 648 Rockland, ME 04841 Inquiries: (207) 594-9209 communitydata@islandinstitute.org www.islandinstitute.org
Vulnerability to Sea Level Rise. . . . . . . . . . . . . . . . . . . . . . . . . . . . . . . . . 8 Financing the Response to Rising Seas . . . . . . . . . . . . . . . . . . . . . . . . 10 CO₂ Emissions . . . . . . . . . . . . . . . . . . . . . . . . . . . . . . . . . . . . . . . . . . . . . 12 ENERGY Home Heating . . . . . . . . . . . . . . . . . . . . . . . . . . . . . . . . . . . . . . . . . . . . . 14 TRADE Domestic Connectivity. . . . . . . . . . . . . . . . . . . . . . . . . . . . . . . . . . . . . . 16 International Connectivity. . . . . . . . . . . . . . . . . . . . . . . . . . . . . . . . . . . 18
DATA ANALYSIS: Meghan Grabill, Ph.D, and Island Institute staff with support from Michael LeVert and Stepwise Data Research
Lobster Imports and Exports . . . . . . . . . . . . . . . . . . . . . . . . . . . . . . . . 20 WORKING WATERFRONTS Ocean Traffic . . . . . . . . . . . . . . . . . . . . . . . . . . . . . . . . . . . . . . . . . . . . . . 22 From Sardines to Yachts: Belfast Transforms Waterfront. . . . . . . . 24 Protections. . . . . . . . . . . . . . . . . . . . . . . . . . . . . . . . . . . . . . . . . . . . . . . . 26
FRONT COVER: Deer Isle Causeway BACK COVER: Machiasport Cover photos by Jack Sullivan
ABOUT THE COVER A single, half-mile causeway is a vulnerable portion of the only road that connects the communities of Deer Isle-Stonington to the mainland. This causeway is a crucial link for more than 500 people to get to and from work. Yet with increasing severity of storm surge and rising seas, the use of this lifeline is becoming challenging. Learn more on pages 8-12.
CIVIC INFRASTRUCTURE Nonprofit Employees and Volunteers. . . . . . . . . . . . . . . . . . . . . . . . . 28 A Labor of Love for Cheryl Crowley. . . . . . . . . . . . . . . . . . . . . . . . . . . 30 DATA NOTES . . . . . . . . . . . . . . . . . . . . . . . . . . . . . . . . . . . . . . . . . . . . . . . . . . 32
Visit www.islandinstitute.org/waypoints to further explore this publication. Download data sets, link to online tools, and access stories about the communities and coastal residents working on these topics.
Introduction Infrastructure Connects and Shapes Maine’s Island and Coastal Communities Driving north into Maine, under the pale green arch of the Piscataqua River Bridge, some breathe a sigh of relief… I’m home. Whether it’s driving along the highways or scenic back roads, tying up a boat at the wharf, turning up the thermostat on a cold winter day, or getting online at the coffee shop, the state of our infrastructure underpins who we are, what we do, and how we thrive as communities. It gives us insights into how well we are prepared to respond to a rapidly changing and less predictable future along the coast of Maine. The Island Institute’s Waypoints: Community Indicators series uses compelling, often never-before-seen data to communicate the character of our communities along with the challenges and opportunities before us. Previous editions have grounded us in the truths we often hold to be self-evident about the coast of Maine, and provided a look into community trends that have surprised us. The publications help coastal and island leaders make data-driven decisions and tell compelling stories of what distinguishes their communities to their constituents, state and federal legislators, grant-makers, and the press. In Waypoints: Connect, we set out to better understand the status of Maine’s coastal infrastructure systems, with a focus on the topics where we see local and state leaders grappling with change. We looked at data that are central to our physical infrastructure—think roads, wires, and ports; our economic infrastructure that underpins trade and jobs; and our civic infrastructure to consider how human assets, organizational entities, and networks connect coastal communities to resources that help them thrive.
Key takeaways include: CHANGE IS CONSTANT AND UNPREDICTABLE Species shifts impact where fishing activity takes place. Changes in trade policy alter where goods are exported. Managing the unknowns when planning for infrastructure upgrades can be challenging, especially for small communities. YANKEE INGENUITY MATTERS One-third of the coast lacks a strong economic case to build out 21st century internet service, yet communities are utilizing local financing options and public-private partnerships to get the job done. Creativity and resourcefulness are key to meeting infrastructure needs. REGIONAL THINKING IS REQUIRED The state of infrastructure in one community often has implications for those surrounding it. Regional collaboration can help unlock more durable solutions. INFRASTRUCTURE IMPROVEMENTS ARE NOT MONOLITHIC Progress can be made incrementally to drive towards a larger shift. Programs that direct investment in sustainable options in heating, waterfront protections, and broadband are moving the needle on the coast of Maine. Waypoints are defined as points that “indicate a change in direction, speed, or altitude.” We hope that this edition helps communities along the coast of Maine make informed decisions on where to head from here.
—The Island Institute Community Data Team
Coastal Maine at a Glance Age, income, and self-employment trends, combined with small populations, distinguish the coast and islands from the rest of the state and nation. KEY: Population, 2018
1-750 751-1,500 1,501-3,500 3,501-10,000 10,001-67,000 BRUNSWICK ROCKLAND
PORTLAND
WHY THIS MATTERS
10 coastal communities in southern Maine hold the
HIGHEST
MEDIAN HOUSEHOLD INCOME IN MAINE
2
WAYPOINTS: CONNECT
10
Smaller, rural communities have capacity and financial challenges that can limit investments in infrastructure and economic development. It’s difficult for these communities to change demographic pressures themselves. This prompts a need for creative approaches to infrastructure financing, trade relations, and civic networks to bridge resource gaps.
coastal and island communities have
more than 10,000 residents. None are north of Brunswick.
MEDIAN AGE Maine’s median age is the highest in the country.
Click here for more resources on this topic.
44.6 U.S. 37.9
Maine
5 coastal communities in Downeast Maine hold the
LOWEST
MEDIAN HOUSEHOLD INCOME IN MAINE
MACHIAS
Maine is the most rural state in the nation with
BAR HARBOR
75% fewer than 3,500 residents. of coastal and island communities have
61%
of residents living outside of urban areas.
25% fewer than 750 residents.
of coastal and island communities have
HOUSEHOLDS WITH SELF-EMPLOYED INCOME, 2018 U.S. Average Maine Coast and Islands Year-Round Island
11%
U.S.
15%
$60,293 $67,398
New England
18%
Maine
41% 5% 10% 15% 20% 25% 30% 35% 40% 45%
ANNUAL MEDIAN HOUSEHOLD INCOME, 2018
Typical Coastal and Island Community
$55,425 $57,572
$25,000 $50,000 $75,000
WWW.ISLANDINSTITUTE.ORG/WAYPOINTS
3
BROADBAND
Economic Feasibility
BANGOR
One-third of the coast lacks a strong business case to build out the 21st century internet infrastructure that is increasingly needed by business owners, students, fishermen, elderly residents, and others in their day-to-day lives. KEY: Addresses Per Mile, 2019
0 NONE 1-6 VERY LOW 7-15 LOW
ROCKLAND
16-22 MEDIUM 23+ HIGH
ISLESBORO PORTLAND
CLIFF ISLAND Broadband infrastructure built with support from private investment in an LLC.
WHY THIS MATTERS
4
WAYPOINTS: CONNECT
Broadband infrastructure built with support from a municipal bond.
The density of homes and businesses along roads drive the economic return on building out reliable, high-speed internet infrastructure. Absent other reasons to build infrastructure in a place with low premise density, private companies may be less willing to invest in updated fiber infrastructure. Communities can improve the economics of a project by expanding the customer base or by helping to obtain a subsidy for the construction costs.
Click here for more resources on this topic.
PREMISE DENSITY This map shows density of addresses, or “premises,” along the road network.
ROQUE BLUFFS See next page for more
PREMISE DENSITY ACROSS MAINE, 2019
22%
25% CRANBERRY ISLES SWAN’S ISLAND See next page for more
Broadband infrastructure built with support from a USDA grant.
12% 22% 20%
0 NONE No customer base 1-6 VERY LOW Revenue generated from customer base may not be sufficient to fully offset operating costs of internet service provider (ISP) 7-15 LOW Revenue generated likely covers ISPs operating costs but may not allow for market rate returns on capital investments 16-22 MEDIUM Premise density is such that it may be sufficient to generate an economically viable project 23+ HIGH There is a decent business case for private investment to have already built the infrastructure
13% 37%
17%
19%
15%
COAST AND ISLANDS
WWW.ISLANDINSTITUTE.ORG/WAYPOINTS
BROADBAND
MAINE
5
Connecting Remote Communities to the World LACK OF ACCESS TO FAST, RELIABLE, AND AFFORDABLE INTERNET
Rural coastal communitites strategize to build broadband networks that will provide access and opportunitites for young and old.
service has long been a leading factor working against the sustainability of small town life on the coast of Maine. Rural towns with poor internet service are finding it difficult to attract young families. Businesses are unlikely to locate where internet service is spotty, and senior residents increasingly rely on dependable communications networks to support their ability to age in place. Lisa Hanscom knows this as well as anyone. She owns a family-run blueberry business and manages a pair of Airbnb rentals located at her farm in Roque Bluffs, a small community of 300 people in Downeast Maine. She served as first selectman, and as such, is well acquainted with the struggles of residents to access good, reliable internet service. “We have inadequate internet to advertise blueberry products, interact with buyers, and deal with rental customers. I am unable to increase the quality and quantity of my businesses specifically because of the poor internet speeds,” she says. The community recently came together to bring broadband to the entire town in locations where internet is poor or even inaccessible. “There are many more of me—farmers, fisherman, lobster sellers— who are either paying exorbitant prices for better connectivity or are struggling to make this inadequate technology work for them,” Hanscom says. “I hope that we will not have to wait 30 years to lift all of our boats, all of our communities, to bring this real opportunity to all of those who dream to better themselves and their families.” High-speed, reliable internet service ensures equitable access to education and healthcare, supports civic engagement, and spurs economic diversification and development. Geographic isolation and sparse populations mean Maine’s rural communities lag behind the rest of the nation in quality of internet service and economic productivity. More Maine towns are realizing a future backed by broadband is possible through improved planning. They are starting the process by forming
ROQUE BLUFFS
6
WAYPOINTS: CONNECT
ROQUE BLUFFS In Roque Bluffs, residents who planned to run businesses out of their homes had to sell because their internet service was so slow. Home-bound, elderly patients cannot connect over the internet in order to interact with their doctor or nurse. Elementary, high school, and college students must drive 30 minutes roundtrip into Machias to accomplish their online homework, and older continuing education students cannot complete their online exams because of the inconsistency of their internet connectivity, in some cases resulting in not being able to pursue their career of choice.
The Cranberry Isles community celebrates an award to complete its broadband project after leveraging planning grants to support their application for USDA funds. community broadband working groups to bring in local residents with diverse backgrounds. More than one-third of the coast lacks a strong economic case for providers to build out broadband infrastructure for 21st century internet service. As they see the digital divide widening, many island and coastal communities are taking charge by developing community-driven broadband solutions that will result in a stronger economic future for all. Communities like the Cranberry Isles (above) are utilizing local financing options and regional collaborations to get the job done.
SWAN’S ISLAND
SWAN’S ISLAND Like many rural municipalities along Maine’s coast, Swan’s Island is made up of multiple villages, where internet service varies widely within the community. By bringing in diverse perspectives and seeking creative financial options, broadband can be brought to whole communities. On Swan’s Island, a citizen working group is designing and assessing broadband infrastructure options that can be built and operated either by the existing provider or with other potential providers to find balance between the community’s goals and risk. Addresses Per Mile, 2019 0 NONE
1-6 VERY LOW
7-15 LOW
16-22 MEDIUM
23+ HIGH
WWW.ISLANDINSTITUTE.ORG/WAYPOINTS
7
TRANSPORTATION
Vulnerability to Sea Level Rise Rising seas and more frequent flooding threaten to fragment Maine’s connected coast. Nearly 6% of coastal and island roads are at risk of becoming inaccessible to emergency services with two feet of sea level rise, a scenario that is likely to occur by 2100. KEY: Road Miles Inaccessible to Emergency Services at Two Feet of Sea Level Rise
0% 1-5% 6-10% 11-20% 21-50% >50%
73%
road miles BROOKSVILLE 643 addresses
97%
road miles ARROWSIC 291 addresses
WHY THIS MATTERS
8
WAYPOINTS: CONNECT
97%
road miles GEORGETOWN 932 addresses
Transportation networks are key to a thriving coast. Residents and businesses alike depend on well-maintained roads to commute to work, transport seafood to market, and access emergency services. However, when roads are flooded, it can become very challenging to reach someone in need. Additionally, the increased travel time and maintenance costs can have significant impacts on the well-being of our communities.
Global average sea level has risen by about
Click here for more resources on this topic.
7–8 inches
since 1900, with almost half of this rise occurring since 1993 as oceans have warmed and land-based ice has melted.
!!!! !!!
road miles DEER ISLE 1,308 addresses
100%
road miles STONINGTON 909 addresses
! !
!
!
!
! !
!
!
! ! ! !
!
!!! !!!! !!! !!
!
DEER ISLE
At two feet of sea level rise, portions of the Deer Isle Causeway will be underwater, effectively disconnecting Deer Isle and Stonington from the mainland.
STONINGTON
AT TWO FEET OF SEA LEVEL RISE
ACCESSIBLE Roads and Addresses INACCESSIBLE Roads and Addresses Inundated Roads
The Coastal Risk Explorer uses projected sea level rise scenarios to understand which locations will be cut off from emergency services and are most vulnerable. The Nature Conservancy in Maine developed the tool in partnership with Bowdoin College, the Maine Geological Survey, and Blue Sky Planning Solutions. You can explore this tool at maps.coastalresilience.org/maine.
WWW.ISLANDINSTITUTE.ORG/WAYPOINTS
TRANSPORTATION
84%
! !
! !! ! !
!!! ! ! ! !! ! !! ! ! ! ! ! !! ! ! ! ! !!! ! ! ! !! ! ! ! !! ! ! ! ! !! ! ! !! ! ! ! ! ! ! ! ! ! ! ! ! ! ! ! ! ! !! ! ! ! ! !! !!!! ! ! ! ! ! ! ! ! ! ! ! !!! ! ! ! ! ! ! ! ! ! ! ! ! !! !! ! !! ! ! ! !!! ! ! ! ! !!!! ! ! !!! !! !!!!! !! ! ! !! ! ! ! !! ! ! ! !! ! ! ! ! ! ! !! ! ! !! !!!! !! !!! !! ! ! ! ! ! ! ! ! ! ! ! ! ! ! ! ! ! ! ! ! ! ! ! ! ! !! !! ! !! ! ! ! !! ! !! !! !! !! !! ! ! !!!! ! ! ! ! ! !!!! !! !! !!!! ! ! ! !!! ! !! ! ! !! !! ! ! ! ! ! ! ! !! !! ! ! ! ! ! !! !! ! ! ! ! ! ! !! ! !! ! ! ! ! !! ! !!! ! ! ! !! ! !!! ! ! ! ! !!! ! ! ! ! !! ! !! !! ! ! ! ! ! ! ! ! ! ! !! !!! ! ! ! ! ! ! !! ! ! ! ! !!! ! ! ! ! !!! ! ! ! ! ! !!!! ! ! ! ! ! ! ! ! ! !! ! ! !! ! ! !! !! !! !! ! ! !! !! ! ! !! ! ! ! !! ! ! !! !! ! !! ! ! ! !! ! ! ! ! !! ! ! ! ! ! ! ! ! !! ! ! !! ! ! ! ! !! ! !!! ! !! ! ! ! ! ! !! ! ! ! ! ! ! ! ! ! ! ! ! ! ! ! ! !! ! !!! ! ! !! ! ! ! ! ! !! ! ! ! ! ! ! !! ! !!! !! ! ! ! ! ! ! !! ! ! ! ! !! ! ! !! ! ! ! ! ! ! ! ! ! ! ! ! !! ! ! ! ! !! ! ! !!!!! !!!! !! !! ! ! ! ! ! !! !!!! !! ! ! ! !!! ! ! ! ! ! ! ! ! ! ! ! ! ! ! !! ! ! ! !!! ! !! ! !! ! ! ! ! ! ! !!! ! ! ! ! ! ! ! ! !! !!!!! ! ! ! ! ! ! ! ! ! ! !! ! !!!!!!!!!!! !! ! ! !! ! !! ! ! ! ! ! !! !! ! ! !!! ! ! !! ! ! ! !!! ! ! !! ! !! ! !! ! ! ! ! ! ! ! !! !! ! ! ! ! !! ! ! ! ! ! ! ! !! !! ! ! ! ! ! ! ! !! ! ! ! !!! ! ! ! !!! ! !!! ! ! ! ! ! ! ! ! ! ! ! ! ! ! ! ! ! ! !!! ! ! !!! !!! !!!!!! !! !! ! !! !! ! ! !! ! ! ! ! ! !!!! ! ! ! ! !! ! ! !! ! !! ! !! ! ! ! ! ! ! ! ! !!!! ! !! ! ! ! !! ! ! !! ! ! !! ! ! ! ! ! ! ! !! ! ! !! ! ! ! ! !! ! !! ! ! ! ! ! ! ! ! ! !!! ! !!! !! !! ! !! ! ! ! ! ! ! !! ! ! ! ! !!! ! ! ! ! !! ! ! ! ! ! ! !! !!! ! ! ! ! ! !!! !! !! ! ! ! ! ! !! ! ! ! ! ! !! ! ! !! ! ! !!!! ! ! ! !! ! ! ! ! ! !! ! ! ! ! ! ! ! ! ! ! ! ! ! !!!!! !!! ! !! ! ! ! !! ! !!! !! ! !! ! ! ! !! !! ! ! ! ! ! ! !! ! ! ! !! ! !!!! ! ! !! ! !! !! ! ! !! !! ! ! ! ! !! ! ! ! !! ! ! ! ! ! ! !! ! !! ! !! ! ! !! ! !! ! ! ! !! ! ! ! !! ! ! ! ! ! ! ! !! ! ! ! ! ! ! !! !!! ! ! !! !! ! ! !! ! ! ! ! ! ! ! ! ! ! !! ! !!! !! !! ! !! ! ! ! ! ! ! ! ! ! ! ! !! ! ! ! !! ! ! !!!! !! ! ! ! ! ! ! ! ! ! ! ! ! ! ! ! ! !!! ! ! ! ! ! !! ! ! ! ! !! !! ! ! !! ! !! !! ! ! ! ! !!!! ! ! ! !! ! ! ! ! !!! ! ! ! ! !! ! ! ! ! ! ! ! !!! ! !! ! ! !!!!!! !! ! !! !! ! ! ! ! ! ! ! ! !! !! ! !! ! ! ! ! ! !!! ! ! !! ! ! ! !! ! !! !! ! ! !!! ! !!! ! ! ! ! ! !!! ! !!!! ! ! !! ! !!!! !!! ! ! ! ! !! !!!! ! ! !! ! ! ! ! ! ! !!! !!! !! ! !! ! !! ! ! !!! ! ! ! ! ! ! ! !! !! !!! ! !! ! ! !! ! ! !! ! ! ! !!! !! ! ! ! ! !! !! ! !!! ! ! !! ! !! !! ! ! ! ! !! ! ! !!! ! ! !! ! !! !! ! ! ! ! ! ! ! ! !!! ! !!! ! !! ! ! ! !!!!! !!! !! ! ! !! ! !! ! ! !! !!! !! ! !! ! ! ! ! ! ! ! ! !! ! ! ! !! ! ! ! ! ! ! ! ! ! !! !! !! ! ! ! !! ! ! ! ! ! ! ! !! !!!! ! ! ! ! ! ! ! ! ! ! ! ! !!! ! !!! !! ! ! ! ! ! ! ! !! !! ! !!!!!!!!! !! !!!! ! ! ! ! ! !! ! !! ! ! !! !! !! ! ! !!! !!! ! !! ! !! ! ! !!!! ! !! !! ! ! !! ! ! ! ! ! ! ! ! !!!!!! ! ! ! ! ! ! !!!!! ! ! !! ! ! ! !!! ! ! ! ! ! ! ! ! ! ! !!! !!! ! ! !! ! !!! !! !! ! ! ! ! ! !! !!!! ! ! ! ! ! ! ! ! ! ! ! ! !!! ! !! !! ! !! !!!!! !! ! ! ! ! ! ! ! ! ! ! ! !! ! ! ! !! ! !!! ! !! ! ! ! !!! !! ! ! !! !!! ! ! !!! ! ! !!! ! ! ! ! ! !! !! !! ! !! !!!! ! ! ! ! ! ! !! ! ! ! ! ! ! ! ! !! ! !! ! ! ! !! !! ! ! ! ! ! ! ! !! ! ! ! ! ! ! ! ! ! ! ! ! ! ! ! ! ! ! ! ! !! ! !! ! ! ! ! ! !!!!! !! !! ! ! ! ! ! ! ! ! !! ! ! ! ! ! ! !! ! ! ! ! ! !! ! !! ! ! ! ! ! ! ! ! ! ! ! ! !!!! !! ! ! ! ! ! ! ! ! ! !!!!!!! ! !! ! !!! ! ! ! !!! !! ! ! !!!! ! ! ! ! !!! !! !! ! !! ! ! ! ! ! !!! ! !! ! ! !! !! ! ! ! !!! ! ! ! ! ! ! ! ! ! ! !!!!! ! ! ! ! !!! !! ! !!! !!!! ! ! ! !!! ! !! ! !!! ! ! ! ! ! ! !! !! !!! ! ! ! ! ! ! ! ! ! ! !! ! ! ! !! ! ! !! !!! ! ! ! ! ! !! ! ! ! ! ! ! ! ! ! ! ! ! ! !! ! ! !! !! ! !! !! ! ! ! !! ! ! ! ! !! ! !! ! !! ! !! ! ! !! ! ! ! ! ! ! ! ! ! ! ! ! ! ! !! ! !!! !! !! ! !! !! !! ! !! ! !!!!! ! !! ! !! !!! !!! !! ! ! ! ! ! ! ! ! ! ! ! ! ! ! ! !! !! ! !!!! ! !! ! ! !! !!! ! ! ! !! !! !!!! !!! !! ! ! ! ! !! ! ! ! ! !! ! ! !! !!! !! ! !!! ! ! ! ! ! ! !!! ! ! ! ! ! ! ! !! ! ! ! ! ! ! ! ! !! ! ! !! !! ! ! ! ! ! ! ! ! ! ! ! ! ! ! ! ! ! !! !! ! ! ! ! ! ! ! !! ! ! ! !!! ! ! ! ! !!! ! ! !! ! ! ! ! ! ! ! ! !!!! ! ! ! ! ! ! ! ! ! ! ! ! ! !! ! !! ! ! ! !! !! ! ! !!! !! ! ! ! ! ! ! ! ! ! ! ! ! ! ! ! ! ! ! ! ! ! ! ! ! ! ! ! ! !! !!! ! !! ! ! ! !! ! !! ! ! !!! ! ! ! ! !! ! ! ! !!!! ! ! !! !! ! ! ! ! !! ! !!!!! !!! !! !! ! ! ! !!!! !! !! ! !! ! ! ! !! ! ! ! !! ! !! !! !! !!! !!!!!! ! !! !! ! !
9
Financing the Response to Rising Seas Town leaders are looking for innovative ways to fund infrastructure projects.
MANY COASTAL COMMUNITIES ARE GRAPPLING with more frequent instances of flooding and storm surge events. As a result, town leaders are planning for an uncertain future with increasing sea level rise projections and are exploring ways to finance needed upgrades to roads, bridges, and docks.
In Portland, sea level rise is being incorporated into the zoning and building permitting process. “When the city is working with the many infrastructure changes that we contemplate, sea level rise is now part of the design consideration,” said Bill Needelman, Portland’s waterfront coordinator. “If you’re going to spend money and just end up with exactly what you have right now, it’s all loss,” he said. “You can make yourself more resilient at the same time that you’re building your tax base and continuing to have a vital community.” After completing its sea level rise scenarios study, the island of Vinalhaven now approaches its infrastructure planning with an eye toward resiliency. “We’ve got a long list of things we’d like to do, so it’s about prioritizing those things,” said Andy Dorr, the island’s town manager. Part of that is taking advantage of the natural life-cycle replacement of infrastructure such as bridges, sidewalks, and roadways. For instance, Vinalhaven’s Carrying Place Bridge is in poor condition and will soon need to be replaced. As the town discusses the design for a replacement bridge, it’s considering whether the bridge should be raised to a height that will accommodate rising water in its expected lifetime. Beyond the bridge, sea level rise threatens commerce and transport as extreme high tides currently flood the downtown area parking lots even
Andy Dorr (left), Vinalhaven town manager, reviews flood maps of the downtown parking area with consultants.
10
WAYPOINTS: CONNECT
VINALHAVEN
DAMARISCOTTA
PORTLAND
on sunny days, and high-water levels have kept the ferry from docking. Impacts to ferry service will increasingly affect tourism and emergency services. To tackle these issues, the town has formed a sea level rise committee and has received grant funding for vulnerability and engineering studies. While it is hard to estimate exactly how assessed values will change for parcels that experience flooding, sea level rise will cause Vinalhaven’s tax base to shrink and shift to inland residents.
“ When the city is working with the many infrastructure changes that we contemplate, sea level rise is now part of the design consideration.” — BILL NEEDELMAN, PORTLAND WATERFRONT COORDINATOR
With 1.6 feet of sea level rise projected by 2050, more than twofifths of residential properties and more than two-thirds of commercial properties on Vinalhaven will experience flooding. This scenario will put almost $35 million in assessed value at risk, more than 6% of the island’s total tax base.
Several other Maine coastal communities are working with engineers and scientists to explore the potential impacts of sea level rise and storm surge as their first step toward designing thoughtful solutions that will help them prepare, but funding these projects remains a major challenge. An incremental approach has helped Damariscotta improve its infrastructure. The town used state grant funds to study projected sea level rise scenarios for its historic downtown, but finding the funding to make
Flooding in the Vinalhaven downtown area threatens buildings and commerce. Virtually every year-round Vinalhaven resident will be affected by rising sea levels, either directly because their home or business will experience flooding, or indirectly as property taxes increase for island residents.
the full improvements to their infrastructure has been challenging, according to Town Manager Matt Lutkus. Damariscotta’s planned infrastructure efforts, some of which are underway or completed, include: enhancing a park bordering the harbor; sidewalk and culvert replacements; improvements to the public parking area along the harbor; and installing a flood wall to protect the downtown. In total, these improvements will cost the town millions of dollars. Grant money exists to fund studies, Lutkus noted, but most infrastructure grants either go to communities with more dire needs or don’t provide enough money to enable the town to get projects completed. So, Damariscotta has been tackling the projects it can—often with the help of private donors—in the hopes that future generations can build on what is being done now. Communities are learning from each other and are coming up with new financing models. Owen Casas, the town administrator for South Thomaston, leveraged initial planning grants to find matching funds to address frequent high-tide flooding of a critical road. But future funding for such projects is uncertain. While progress is being made, there are a broader set of questions about the role of communities in financing large infrastructure projects along a changing coast.
WWW.ISLANDINSTITUTE.ORG/WAYPOINTS
11
TRANSPORTATION
CO₂ Emissions
BANGOR
The transportation sector accounts for 54% of CO2 emissions in the state of Maine. KEY: CO₂ Emissions Per Square Kilometer, 2017
HIGH
AUGUSTA LINCOLNVILLE
ISLESBORO
LOW
SWAN’S IS NORTH HAVEN ROCKLAND
VINALHAVEN
MAINE STATE FERRY SERVICE
Transportation along the coast includes shipping, commercial fishing, and ferry traffic. Each year, the state’s two largest ferry operators—Maine State Ferry Service and Casco Bay Lines—emit over 8,000 metric tons of CO₂, the equivalent of about 0.1% of the state’s annual CASCO BAY LINES transportation emissions.
PORTLAND
CHEBEAGUE !
! !
GREAT DIAMOND
PORTLAND
12
WAYPOINTS: CONNECT
MATINICUS
!
LONG
!
!
PEAKS
CLIFF
Since 2014, Casco Bay Lines has been powering its fleet with a biodiesel mix which annually avoids about 450 metric tons of CO₂ emissions that would have otherwise come from fossil fuels.
RASTER MAPS This map shows the CO₂ emitted from passenger and freight traffic on coastal and island roads in 2017. Visualized here as a raster map, this type of spatial analysis plots data on a grid, in this case, by square kilometer.
Click here for more resources on this topic.
MOUNT DESERT ISLAND The summer tourist influx to Mount Desert Island contributes to the region’s annual CO₂ emissions.
BASS HARBOR
SLAND
FRENCHBORO
MIDCOAST The major roads surrounding Rockland and Augusta highlight the connections between coastal and inland service centers.
CO₂ EMISSIONS BY ENERGY SECTOR, 2017 5%
Transportation
11% 7%
Industrial
37%
33%
54%
19%
Residential Electric Power
6%
19%
UNITED STATES
9%
Commercial MAINE
WWW.ISLANDINSTITUTE.ORG/WAYPOINTS
TRANSPORTATION
WHY THIS MATTERS
Maine is a state large in area with a small and dispersed population. As a result, the distances that people and goods must travel—by land, sea, and air—exceed those in more densely settled areas. Even though emissions are highest along heavily traveled highways, they are also relevant on smaller roads that lead to service centers and down peninsulas. As state policymakers consider the transportation sector’s CO₂ emissions, rural road traffic—which makes up 72.4% of the state’s total annual vehicle miles (the third highest in the nation)—is increasingly relevant.
13
ENERGY
Home Heating Heating fuel choices are limited for Maine’s island and coastal homes. Increasingly, homeowners are choosing high-performance heat pumps, which are powered by electricity.
KEY: Heat Pumps Per Total Housing Units Incentivized By Efficiency Maine, 2014-2019
0% 1-5% 6-10% 11-15% 16-25%
19% VERONA ISLAND
18% LONG ISLAND
22% PEAKS ISLAND
WHY THIS MATTERS
14
WAYPOINTS: CONNECT
Maine continues to rank as the state most dependent on heating oil in the nation. Due to the limited reach of natural gas infrastructure, 62% of Mainers heat their homes with heating oil—a costly, carbon intensive fuel that is imported from out of state. Driven by recent technology advancements, policy mandates, and incentives, consumers are increasingly choosing heat pumps as a strategy to minimize the economic and environmental impact of home heating.
Click here for more resources on this topic.
18%
Even with a 14 percentage point decrease between 2009 and 2018, most of Maine’s coastal and island homes continue to depend on fuel oil.
-2.0
Utility Gas
-0.8 -2.5
Bottled, Tank, or LP Gas Fuel Oil, Kerosene, etc.
Wood 0
4.9
Electricity Other
UNITED STATES
HOW WE HEAT OUR HOMES IS CHANGING 2009-2018
0.4
3.7
Bottled, Tank, or LP Gas
3.7
-13.7
Fuel Oil, Kerosene, etc. Wood
3
Electricity
1.6
Other
1.7
Utility Gas
4.4 4.0
Bottled, Tank, or LP Gas
-13.1
Fuel Oil, Kerosene, etc. Wood
1.9
Electricity
2.0
Other
0.9
COAST AND ISLANDS
Utility Gas
-14 -12 -10 -8 -6 -4 -2 0 2 4 6 PERCENTAGE POINTS
WWW.ISLANDINSTITUTE.ORG/WAYPOINTS
ENERGY
Islands top the list with the highest number of incentivized installations per total housing units along the coast. Often motivated to make the switch by higher-thanmainland heating fuel prices, many island communities have successfully utilized collective purchasing programs to make it easier and more affordable to install heat pumps.
MAINE
CRANBERRY ISLES
15
TRADE
Domestic Connectivity Maine’s coastal communities are spurring economic growth through their “traded industries”: fishing, finance, management, arts, entertainment, and recreation. KEY: Top Traded Industries Relative to the State, 2018 Resource Extraction (fishing, farming, forestry) Arts, Entertainment, and Recreation Finance and Insurance Management of Companies and Enterprises Manufacturing No Concentration
GREATER PORTLAND High concentration of management, finance, and insurance industries
WHY THIS MATTERS
16
WAYPOINTS: CONNECT
Four out of five of Maine’s most heavily traded industries are concentrated in Maine’s coastal communities. With the exception of manufacturing, employment in traded industries is higher along the coast. Goods and services move beyond the coastal region and serve the rest of the state and country.
TRADED INDUSTRIES Traded industries are industries that concentrate in a particular region but sell products and services across their borders to other regions. They are essential to economic growth as they bring new money into the region and are often associated with higher wages and productivity than local industries. These industries may not be the largest employer.
Click here for more resources on this topic.
DOWNEAST REGION High concentration of resource extraction industries
MOUNT DESERT ISLAND REGION High concentration of arts, entertainment, and recreation industries
COASTAL INDUSTRIES RELATIVE TO THE STATE, 2018 Coastal communities are serving more than their local communities in these traded industries, exporting goods and services to other communities in Maine and around the country. 40%
Management
35%
39% higher
30%
Arts, Entertainment, and Recreation
25%
23% higher
20%
Finance and Insurance 26% higher
15%
TRADE
10%
Resource Extraction
5%
2% higher 0% -5% -10%
STATE BASELINE
9% lower Manufacturing
WWW.ISLANDINSTITUTE.ORG/WAYPOINTS
17
TRADE
International Connectivity Almost $2 billion of international exports flow through Maine’s nine coastal ports each year, connecting Maine’s coastal communities with every continent in the world except Antarctica.
SEARSPORT
BELFAST
KEY: Exports Through Maine Coastal Ports, 5-Year Average, 2014-2018
0 - $2 million $2 million - $20 million
ROCKLAND
$20 million - $1.5 billion BATH
PORTLAND: $246 million
PORTLAND
Connected with Europe, Portland’s top export is semiconductors.
WHY THIS MATTERS
18
WAYPOINTS: CONNECT
Exports drive economic growth, supporting jobs and incomes statewide. Maine’s coastal ports serve as essential gateways for Maine and other states to trade with the rest of the world. They connect the state with every continent except Antarctica and export virtually every product imaginable, including hundreds of millions of dollars of lobster, fish, wood pulp, semiconductors, and more.
CALAIS
Click here for more resources on this topic.
TRADE WITH CANADA Maine has a unique relationship with Canada, our neighbor and largest trade partner. Due to the location of processing facilities, some products passing through Maine’s coastal ports are both imported and exported. For example, Canada has particular processing opportunities for lobster, fuels, and wood products that Maine does not. This means that some raw products are exported from Maine to Canada and then imported back into Maine as value-added products.
EASTPORT
JONESPORT
EASTPORT: $159 million Linked with Asia, Eastport exports wood pulp. BAR HARBOR
CALAIS: $1.4 billion Closely linked with Canada, Calais exports lobsters, fish, and energy products produced outside of Maine. SEARSPORT: $11 million Searsport primarily imports oil from Canada.
INTERNATIONAL EXPORTS FROM MAINE’S COASTAL PORTS 5-YEAR AVERAGE, 2014-2018
North America $1.5 billion Europe $224.3 million
Australia and Oceania $3.9 million Africa $3.4 million South and Central America $1.8 million $50 million
$100 million
$150 million
$200 million
TRADE
Asia $121.9 million
$1.5 billion
WWW.ISLANDINSTITUTE.ORG/WAYPOINTS
19
TRADE
Lobster Imports and Exports Lobster connects Maine to the world. Maine lobsters are eaten locally, shipped to other parts of the country, and exported internationally—primarily as live lobsters.
U.S. LOBSTER LANDINGS, 2017 77% MAINE $423 million
STONINGTON $58 million
8% OTHER STATES $47 million
15% MASSACHUSETTS $82 million
WHY THIS MATTERS
VINALHAVEN $37 million
More than a quarter of Maine’s total lobster landings by value in 2018 came from these top three ports.
Over the past decade, lobster landings in Maine have doubled. During this time, lobster buyers and dealers grew the supply chain, infrastructure, and markets. Global trade relationships increasingly matter in the industry’s ability to grow its markets and play an important role in keeping lobster prices relatively stable.
Significant insight into the lobster trade provided by the Maine Lobster Dealers’ Association. 20
WAYPOINTS: CONNECT
2
1
MAINE AND CANADA LOBSTER TRADE, JULY 2018-JUNE 2019 Maine lobster travels all over the world. A Maine lobster could cross more than four borders before reaching its final destination on someone’s dinner plate. For example, a lobster landed on the Stonington dock could be exported to Canada, processed, and re-imported back to Maine, then travel south to Boston, where it could be shipped to Asia. In this process, the Maine brand is obscured.
$379.4 million
LIVE $299.3 million
MAINE
CANADA $461.7 million
PROCESSED $5.8 million
3
JONESPORT/BEALS $31.6 million
Click here for more resources on this topic.
LOBSTER VALUE INCREASES AS IT MOVES THROUGH THE SUPPLY CHAIN.
FROM THE DOCK
TOTAL U.S. LOBSTER EXPORTS, JULY 2017-JUNE 2019 $600
July 2018-June 2019
July 2017-June 2018
$588.2 million
REST OF ASIA NORTH AMERICA
$86.3 million
Exports to Europe declined due to a trade agreement between the EU and Canada.
$182.2 million $94.6 million
Exports to China have declined since tariffs were imposed in July 2018, falling from 27% of total exports to 15%.
MILLIONS
$105.9 million
$400 $300 $200 $100
$52.5 million Processed
Live
$136.5 million $131.8 million
$249.1 million $318.9 million
WWW.ISLANDINSTITUTE.ORG/WAYPOINTS
TRADE
CHINA
EUROPE
$500
21
WORKING WATERFRONTS
Ocean Traffic
ROCKLAND
The Gulf of Maine is a busy place, filled with activities that can be difficult to track and often shift over time. RECREATIONAL BOATING LOW
2012
HIGH
PRESENCE OF VESSELS
KITTERY
HERRING FLEET
2015-16
PRESENCE OF VESSELS
HIGH
GROUNDFISH FLEET
LOW
2015-16
PRESENCE OF VESSELS
HIGH
22
WAYPOINTS: CONNECT
NR
OC
, NM
FS
LOW
Click here for more resources on this topic.
Decision-making about shifting current uses or potential new ocean uses is complicated. While the Gulf of Maine may appear as an empty blue void on maps, it is filled with highly-valued commercial and recreational activity that helps define the state’s coastal economy and connection to the world. The availability of data to represent the multiple ways in which the ocean is used varies, as tracking and reporting methods are still expanding. These maps show where a few of the many types of fishing, transportation, and recreational vessels were operating over the course of a year.
WHY THIS MATTERS
While recreational uses are not always known, fishing, scuba diving, whale and bird watching are common activities in the Gulf of Maine. JEFFERY’S BANK TUG-TOW, TANKER, AND CARGO FLEET
2017
VESSEL COUNTS Tug-tow Tanker Cargo
COMMERCIAL PASSENGER FLEET
2017
VESSEL COUNTS Commercial Passenger
WWW.ISLANDINSTITUTE.ORG/WAYPOINTS
WORKING WATERFRONTS
MOUNT DESERT ROCK
23
From Sardines to Yachts: Belfast Transforms Waterfront A PART OF BELFAST’S WATERFRONT that was characterized by graffiti-
City government and Front Street Shipyard collaborated to create a thriving working waterfront with public access.
covered, decrepit industrial buildings was remade in dramatic fashion when Front Street Shipyard established its yacht service there in 2011. It might seem like an overnight success story. In fact, it’s a story that owes its happy ending to two groups of people who saw opportunity and were willing to work to find a way for each to win. Clichéd though it might sound, the Front Street Shipyard and Belfast’s city government truly achieved a win-win. It may not have come to fruition without a bit of legal innovation with a name only a lawyer could love: contract rezoning. The story begins with the demise of the sardine industry. In 2001, the Stinson Seafood plant on the city’s northeasterly waterfront was for sale. Wayne Marshall, the city’s planner, remembers Stinson asking $1.3 million for the property. “It was pretty much an unusual beast,” this 1,000 feet of shorefront that was dormant industrial, yet close to the heart of downtown. It was flat, a plus for redevelopment, yet narrow, hemmed in by Front Street. As the economy strengthened in the first decade of the century, the property drew interest from developers. Rather than allow a buyer to impose a vision, the city wanted a say in how this key property would develop. “We established a contract zone goal statement,” Marshall remembers. “We would negotiate what the terms were.” Contract zoning allows municipalities to consider a range of development proposals and stipulate their own standards. If both sides agree on a set of terms, a unique zone is created for an individual property. This provision is typically applied to larger properties.
In 2004, Tom Roberts, a would-be developer from New Jersey joined by four partners, applied to the city to redevelop the sardine plant as 22 residential condominiums, 14,000 square-feet of retail space and offices, a restaurant, and a 62-slip marina offering boat repair and storage. He agreed to begin negotiating with the city on a contract rezoning deal—the first time the city employed this mechanism. Marshall remembers more than 25 meetings with Roberts, who landed financing for his proposal in 2005. One key provision the city wanted in any deal with Roberts was his approval of a long-planned public walkway along the harbor, through the project site. The walkway idea originated in the late 1990s, Marshall said, with a renewed effort to establish it when the Armistice Bridge—the former U.S. Route 1 bridge, now known locally as the footbridge—was rebuilt in 2003. In its negotiations with Roberts, the city also worked to establish protections for a small lobster fleet and maintain public access from both the harbor and land. The contract between the city and Roberts was inked, but despite the deal, Roberts and his partners sought to sell the property and the project, perhaps because of a souring real estate market. By June 2008, Roberts and his group were ready to bail. Investors dipped in their toes, but none committed. By late 2009 and into early 2010, Marshall said, “The property was becoming increasingly derelict. You could see water through the building from the street side. The owner was doing nothing. It was a safety hazard.”
BELFAST, MAINE PHOTO BY TIM SHACKLEFORD/5IVELEAF PHOTOGRAPHY
The fate of the property, and the city’s vision for a public waterfront walkway, hung in the balance. If the building remained decrepit for another five years, city councilors could be blamed for driving too hard a bargain. In late 2010, the city learned of an inquiry about the property from four men: Taylor Allen, owner and operator of Rockport Marine; JB Turner, former president of Lyman-Morse in Thomaston; Steve White, owner and operator of Brooklin Boat Yard; and Ken Priest of Kenway Composites. The group planned not a boatyard, but a shipyard, capable of handling large yachts and commercial vessels at the Belfast site. The new investors accepted what Marshall describes as non-negotiable terms—the harbor walk through the property, a dock for commercial fishermen, removal of the building in the worst shape, and the city retaining a $200,000 performance bond. In December 2010, the new entity, Front Street Shipyard, purchased the property. The business demolished the troubled building in 42 days.
A waterfront walkway winds through Belfast’s Front Street Shipyard, alongside the largest marine travel lift on the East Coast. “It was unlike almost anyone else I’ve worked with,” Marshall said. Not only was the city taking the new company at its word, but the partners trusted the city. “I’m not sure a lot of people would have purchased a single-family home with these conditions.” What has followed has been described by both city officials and the shipyard as a love fest. The two parties have exchanged nearly 40 parcels of land, and right of ways and building height restrictions have been modified. And they were not city giveaways—the shipyard paid $600,000 for what had been a city parking lot.
“ All of a sudden, Belfast was on the map.”
“I remember it to this day,” said Turner, now president and general manager of Front Street Shipyard. “They had a vision for what — WAYNE MARSHALL, they wanted Belfast CITY PLANNER to be,” he said. “They worked with us, arm in arm, to make everything possible that we wanted to do.” Construction began in January 2011, and in July of that year, the Front Street Shipyard opened its doors with a community picnic that 450 people attended. “All of a sudden, Belfast was on the map,” Marshall said, with large yachts, some from the Caribbean and Europe, which had come solely for the service at the yard. The city landed a $1.9 million federal grant to rebuild Front Street with upgraded curbs, sidewalks, higher-grade asphalt to allow large vessels to be hauled, and new water lines. “We would not have seen one nickel of that if not for Front Street Shipyard,” he said. And, of course, the city benefits from the property taxes paid by the shipyard and the 100-plus skilled employees, whose wages average more than $18 an hour. “It’s probably the only shipyard in North America where you can actually walk through the travel-lift area,” Turner observed, but it’s more than a recreation area. “We brought a working waterfront back to Belfast.”
—Tom Groening
WWW.ISLANDINSTITUTE.ORG/WAYPOINTS
25
WORKING WATERFRONTS
Protections There are multiple ways to protect working waterfronts, which are critical to Maine’s coastal economy. Every fishing trip starts and ends at a dock and the success of many marine businesses depends on access. ! !
KEY: Federal and State Protection Programs, 2019 !
U.S. Army Corps of Engineers Dredging Locations, 2019
!
!
!
Working Waterfront Access Protection Program, 2019 Community with Some Acres in Current Land Use for the Working Waterfront Program, 2017
! ! !
!!
!
! !
! !
! !
!
!! ! !
! !
! ! ! !
!
!
!!
!
! !
!
! ! ! !
!
! !
A&R ENTERPRISES !
!!
BREMEN LOBSTER COOP + COMMUNITY SHELLFISH Historic lobster pound was revitalized and now supports aquaculture and commercial fishing.
!
! ! ! ! ! !
!! ! !
26
WAYPOINTS: CONNECT
!
WHY THIS MATTERS
This wharf is the site of Maine’s first aquaculture cooperative, which is vertically integrated and developing novel approaches and products for the fishing industry.
Protecting access to working waterfront infrastructure supports the people who make their living from the ocean and helps ensure communities will continue to be connected to the businesses that rely on this infrastructure.
!!
!
Click here for more resources on this topic.
FRENCHBORO Improved shared working waterfront facilities and dredging are priorities for this small island community where fishing is the primary source of employment.
!
! !!
! ! ! ! ! ! ! !!
!
! !
!
! !
CURRENT LAND USE FOR THE WORKING WATERFRONT PROGRAM
!
The state of Maine’s land use taxation program allows property owners to pay taxes on the value of the property as a working waterfront instead of the value of the property for condos, homes, hotels, or other “higher” value uses.
!
!
As of 2017, there are
114 ACRES across
34 COMMUNITIES with
86 PARCELS
28%
WORKING WATERFRONT ACCESS PROTECTION PROGRAM (WWAPP) Part of the state-run Land for Maine’s Future program, WWAPP supports projects that sustain access to the waterfront for commercial fishing and aquaculture in exchange for development rights.
25 PROPERTIES totaling
42.3 ACRES have received funds.
Percent of coastal and island communities with a working waterfront protection
17%
To date,
in this program.
U.S. ARMY CORPS OF ENGINEERS DREDGING The U.S. Army Corps of Engineers maintains navigation channels and water depths, helping to connect working waterfronts to ocean resources.
48%
As of 2017, there are
66 DREDGING LOCATIONS in Maine.
WWW.ISLANDINSTITUTE.ORG/WAYPOINTS
WORKING WATERFRONTS
!
27
CIVIC INFRASTRUCTURE
Nonprofit Employees and Volunteers Maine’s nonprofit sector and volunteers connect coastal residents to resources that help their communities thrive. KEY: Nonprofit Employees Per Capita, 2018
None 0.1% - 2.5% 2.6% - 5% 5.1% - 10% 10.1% - 20% > 20%
ARTS | CULTURE | EDUCATION
MONHEGAN ISLAND Monhegan Historical and Cultural Museum and the Monhegan Memorial Library are the two primary nonprofit employers on the island.
WHY THIS MATTERS
28
WAYPOINTS: CONNECT
Nonprofits help communities access resources from inside and outside of Maine. These organizations enrich the state by building diverse partnerships to provide innovative solutions and services. They also employ a significant number of people in communities along the coast and islands.
In 2018,
425,346
Click here for more resources on this topic.
VOLUNTEERS contributed
39.2
MILLION HOURS in the state of Maine.
HEALTH
MACHIAS
VOLUNTEERISM, 2018 Maine ranks #9 in the nation 40% RESEARCH
Maine 39%
35% PERCENT OF POPULATION
BAR HARBOR Jackson Laboratory, a world-class research facility, is the largest nonprofit employer in Bar Harbor.
30% 25%
U.S. 30%
20% 15% 10% 5%
5%
4%
1% 1%
NONPROFIT ORGANIZATIONS IN MAINE, 2018 By number of organizations and primary focus of activity
7% 30% 9% 9% 10%
23%
Public/Social Benefit
Recreation
Arts, Culture, Education
Environmental
Other
Community Improvement
Health
Agriculture
Philanthropy
Research
WWW.ISLANDINSTITUTE.ORG/WAYPOINTS
CIVIC INFRASTRUCTURE
Downeast Community Hospital, Sunrise Opportunities, and Sunrise Nursing Care are the three largest nonprofits in Machias.
29
A Labor of Love for Cheryl Crowley Quietly and effectively working to keep a Casco Bay island vital
CHERYL CROWLEY OFFERS A VIVID METAPHOR for the challenges and rewards of working to support a small island community. “It’s like painting a house,” she says. “I hate all the scraping. But then, after the final coat is applied, it’s Ahhhh!”
Crowley has been scraping away, reimagining, and applying a fresh coat to her beloved Cliff Island for years. Though she had to have her arm twisted to consent to an interview about her volunteer work, she is, in fact, one of a small number of folks on this island of about 50 year-round residents plugging away at keeping it vital. The journey that led Crowley, 56, to Cliff Island—which lies at the southeast edge of the Casco Bay archipelago, the last stop on the outbound ferry run—is as angular as its shore. Her family has visited the island since 1916, but she grew up in Trumbull, Connecticut, where her father was a school teacher. While in high school, Crowley worked as a nanny for a family on the island. She attended and graduated from the University of Maine at Farmington. Following in her father’s footsteps, she became a teacher, working in special education in the GrayNew Gloucester system in southern Maine. Later, she ran a group home for disabled adults in central Maine. After her first marriage ended, she moved to the island in 1996, while her grandparents were still living there, and never left. She reconnected with high school friend David, and married and had a family. His family had a cottage on nearby Stave Island.
PHOTO BY LORINDA VALLS
“He migrated south to Cliff,” she jokes. The couple have three girls, one still attending Casco Bay High School in Portland. And it was being the parent of school-aged children that led to her volunteer work, a natural progression for many, she observes.
30
“Being on the island, and being available, I started getting busy,” she recalls.
Cheryl Crowley attended and graduated from the University of Maine at Farmington. Later, she became a teacher, working in special education. She’s made Cliff Island home since 1996 and is an active volunteer in many of the island’s initiatives.
WAYPOINTS: CONNECT
Crowley began substitute teaching, then lending a hand in administrative work, such as helping to hire a teacher for the island’s one-room school. Even though her daughters no longer attend, and the school has just two students, she remains actively involved. “I can’t let it go,” she says with a smile. Early in 2018, the Portland school system considered closing some island schools, which drew her into fighting such a move, and a commission formed to study the matter. “I’m on that, too.” Crowley is also Cliff Island’s representative to the Maine Islands Coalition, a group that gathers to share solutions for community challenges and discuss island issues. Since Cliff Island is part of the city of Portland, it’s challenging to create island-based organizations for activities typically
operated by a municipality, Crowley explains. To address the lack of summertime programs, islanders formed the Cliff Island Corporation for Athletics, Conservation, and Education (known on-island as “ACE”). Among the offerings it made possible was live music. “It’s really awesome,” Crowley said, as residents and summer folks gather at the pier for the performances. Another island-based entity, Cliff Island Association, operates the community hall. Last summer, residents supported a plan to expand the hall to house the hardware for high-speed internet. Another big step was taken when Crowley and islanders Roger Berle, Bob Howard, and Eric Anderson formed Sustainable Cliff Island. “We started this way back when—12, 13 years ago,” she remembers. “It was about housing,” trying to create more affordable options, a common concern on Maine’s islands. But the effort was set aside when the housing bubble burst. Five or six years ago, the group became active again, and seized on an opportunity that was presented when a waterfront parcel of land that had included a pier, fuel depot, store, and house had been seized by the city of Portland when its owner failed to pay property taxes. The city put the property out to public bid, and Sustainable Cliff Island secured it for $10,000. The conditions attached by the city were such that the house on the parcel could only be rented or sold as affordable housing for the next 20 years and the fuel depot had to be maintained as such for 20 years as well. “It’s all about sustaining a year-round community,” Crowley explained. The elements that must be supported for such vitality include affordable housing and a school, along with what had been at the now-secured property—store, fuel depot, and access to the water. To that list she adds jobs and access to broadband internet as necessary components. Sustainable Cliff Island is still working on plans for the waterfront parcel. The old fuel tanks have been removed, and the wharf is being rebuilt. The store could be revived in some form, she said, and the small house might serve as a residence for an island teacher. “We need to gut the house,” she said. “It needs a lot of work.” The property also might help serve the island as the base for a health clinic. Earlier on in her island volunteer work, Crowley dove into health care—inspired by her mother, a nurse—and persuaded Portland city officials to hold EMT classes on the island. She and husband David now are two of the island’s three EMTs. Crowley and Peggy
Akers, a summer resident, have worked to expand medical services. “We’ve created an informal health center,” she said, clarifying that the “center” looks like a Rubbermaid bin with supplies. Focusing on health is a passion for Crowley. Working on offering home care for aging island residents is another project on her agenda. “I love it,” she says. “It’s one of those things that doesn’t divide a community.” Island life agrees with her. “I love the nature of it—being in the elements, skiing in the middle of a snowstorm,” she says, along with the deeper, multi-generational relationships that form. “I see that in my girls. They’re so accepting.”
“ It’s challenging to create island-based organizations for activities typically operated by a municipality.”
Roger Berle, a fellow Cliff Islander, has worked closely with Crowley on a number of projects. “I’m a huge fan,” he said, adding that he’s known her since she was a child.
“She is smart. She is patiently thoughtful. She’s got her eyes wide open, and she’s pretty quick to understand where people are coming from,” Berle said, adding that Crowley has one foot in the yearround community and one foot in the summer community, he said, making her effective. “She is quietly persistent, a quiet but effective leader,” he continued, with “a wonderful personality” that gives her “a way with people.” On the day we talked, Crowley was in Portland to attend a meeting of the Casco Bay Lines board of directors, hoping to lay the groundwork for designating a private space in its terminal for cancer patients while they wait for their ferry back home. And in explaining her plans, she disclosed something about her approach to her community work. Rather than demand change, she said her goal for the meeting was to gently introduce the idea. When asked what drives her volunteer work, she says, “I like problem-solving. I like to collaborate.”
—Tom Groening
WWW.ISLANDINSTITUTE.ORG/WAYPOINTS
31
Data Notes GENERAL INFORMATION In the United States, the U.S. Census Bureau recognizes geographic units within all counties and statistically equivalent entities known as county subdivisions. In the state of Maine, these county subdivisions are minor civil divisions, a type of county subdivision with legal boundaries and governmental or administrative functions. These data presented in this publication for ‘communities’ come from the American Community Survey (ACS) and Decennial Census which rely on these county subdivisions for the spatial analysis. The ACS uses multi-year surveys to compile enough data to improve the statistical reliability of the findings. Caution should still be exercised when taking this data as absolute due to large margins of error in communities of such small size. Some difficulties are associated with using Census data for Maine’s island communities. First, Great Diamond, Cliff, and Peaks islands are all included in the totals for Portland. Where possible, Peaks Island is broken out using Census Tract 24, Block Group 1. Cranberry Isles is a county subdivision that includes both Islesford and Great Cranberry Island, two distinct communities. This is also the case for Edmunds and Trescott townships which are combined into the East Central Washington county subdivision with other territories. All U.S. Census Bureau data are available at data.census.gov. PAGE 2 | MAINE AT A GLANCE MAP: Population “B01003. Total population: 2018–Maine County Subdivisions.” Dataset: ACS 5-Year Estimates. STATISTICS: Median Age “S0101. Total Population by Age and Sex: 2018–State of Maine and U.S.” Dataset: ACS 5-Year Estimates. Rural “P2. Total Population, Urban and Rural: 2010–Maine County Subdivisions, State of Maine, and U.S.” Dataset: Decennial Census (SF1). BAR CHARTS: Self-Employment Income “B19053. Self-Employment Income in the Past 12 Months by Household: 2018–Maine County Subdivisions, State of Maine, Northeast Region, and U.S.” Dataset: ACS 5-Year Estimates. Median Household Income “S19101. Income in the past 12 Months by Household (in 2018 inflation adjusted dollars): 2018– Maine County Subdivisions, State of Maine, Northeast Region, and U.S.” Dataset: ACS 5-Year Estimates. PAGES 4-5 | BROADBAND | ECONOMIC FEASIBILITY MAP: The map displays a point density analysis (not speed or coverage), an analysis that shows density of premises along the road network. It is dependent on the known relationship between premise density and broadband speeds. This relationship exists for the simple reason of the spatial pattern of human settlement. Dense areas have access to higher speeds for three reasons: 1. Dense areas are often in the urban centers and are therefore closer to the source. 2. Density makes it more cost effective to build out the necessary infrastructure for the broadband system and therefore internet service providers are more likely to build and continually upgrade a system. 3. Federal grants can only be awarded to places where the density meets a minimum level, meaning areas that are more rural are unlikely to be eligible for broadband grants. DATA LAYERS: Point density analysis based on 1. Maine Geolibrary. Maine E911 Roads. Emergency Services Communication Bureau: State of Maine, 2019. https://gis.maine.gov/arcgis/rest/services/Location/ Maine_E911_Addresses_Roads_PSAP/MapServer/2. 2. Maine Geolibrary. Maine E911 Addresses. Emergency Services Communication Bureau: State of Maine, 2019. https://gis.maine.gov/arcgis/rest/services/Location/ Maine_E911_Addresses_Roads_PSAP/MapServer/1. All accessed 1 November 2019. PIE CHARTS: Premise Density Across Maine calculated using county subdivisions and point density analysis described above. PAGES 6-7 | BROADBAND | CONNECTING COMMUNITIES INSET MAPS: Based on same point density analysis described above.
32
WAYPOINTS: CONNECT
PAGES 8-9 | TRANSPORTATION | SEA LEVEL RISE VULNERABILITY MAP: Percent of miles of roads and addresses inaccessible at two feet of projected sea level rise compiled by The Nature Conservancy of Maine for the Coastal Risk Explorer tool with Bowdoin College, the Maine Geological Survey, and Blue Sky Planning. MAP INSET: Deer Isle-Stonington inset map based on 1. Maine Geolibrary. Maine E911 Roads. Emergency Services Communication Bureau: State of Maine, 2019. https://gis.maine.gov/arcgis/rest/services/ Location/Maine_E911_Addresses_Roads_PSAP/MapServer/2. 2. Maine Geolibrary. Maine E911 Addresses. Emergency Services Communication Bureau: State of Maine, 2019. https://gis.maine.gov/arcgis/rest/services/ Location/Maine_E911_Addresses_Roads_PSAP/MapServer/1. Accessed 1 November 2019. STATISTICS: Global average sea level rise Fourth National Climate Assessment 2018, Chapter 2: Our Changing Climate. Key Message 4. https://nca2018.globalchange.gov/chapter/2/. Accessed 31 December 2019. PAGES 10-11 | TRANSPORTATION | FINANCING THE RESPONSE DATA POINTS: Based on analysis from “The Cost of Sea Level Rise: Economic Impact Analysis,” a 2019 study commissioned by the Island Institute. Results of the study can be found here: Vinalhaven - https:// arcg.is/1f8T9L. PAGES 12-13 | TRANSPORTATION | CO₂ EMISSIONS MAP: Gately, C., L.R. Hutyra, and I.S. Wing. 2019. DARTE Annual On-road CO₂ Emissions on a 1-km Grid, Conterminous USA, V2, 1980-2017. ORNL DAAC, Oak Ridge, Tennessee, USA. https://doi.org/10.3334/ ORNLDAAC/1735. Accessed 31 December 2019. MAP INSETS: Maine State Ferry Service Maine Office of GIS. Maine Department of Transportation Public Roads (Ferry Routes). https:// www.maine.gov/megis/catalog/metadata/medotpubrds.html. Accessed 1 November 2019. Casco Bay Lines Adapted from Casco Bay Lines Islands Map https://www.cascobaylines.com/islands/. Accessed 31 December 2019. STATISTICS: CBL total emissions Casco Bay Lines. 1 November 2017. “Fueled by French Fries: Casco Bay Lines Runs on Biodiesel” [Blog post]. https://www.cascobaylines.com/blog/fueled-french-fries-casco-bay-linesruns-biodiesel/. Accessed 8 January 2018; correspondence with Hank Berg of Casco Bay Lines. MSFS total emissions Number presented by Maine Department of Transportation. October 2019. Maine State Ferry Service Advisory Board Meeting, Rockland, Maine. State of Maine total emissions “State Carbon Dioxide Emissions Data, 2017.” U.S. Energy Information Administration–EIA Independent Statistics and Analysis, https://www.eia.gov/environment/emissions/state/. Accessed 31 December 2019. Percent rural VMT from “Fact #902: December 7, 2015 Rural versus Urban Vehicle Miles of Travel by State.” Office of Energy Efficiency and Renewable Energy: Vehicle Technologies Office. https://www.energy. gov/eere/vehicles/fact-902-december-7-2015-rural-versus-urban-vehiclemiles-travel-state. Accessed 10 January 2020. Carbon dioxide emissions coefficients Greenhouse Gas Protocol 2017, https://ghgprotocol.org/sites/ default/files/Emission_Factors_from_Cross_Sector_Tools_March_2017. xlsx Diesel fuel 10.16kg CO₂/gallon; B20 Biodiesel 8.10442 kg CO₂/gallon; B20 Biodiesel 1.892 kg CO₂/gallon from biomass fuel; B20 Biodiesel portion of CO₂ emissions avoided is 2.03kg CO₂/gallon. Rural “P2. Total Population, Urban and Rural: 2010–Maine County Subdivisions, State of Maine, and U.S.” Dataset: Decennial Census (SF1). PIE CHARTS: “State Carbon Dioxide Emissions Data, 2017.” U.S. Energy Information Administration–EIA Independent Statistics and Analysis, https://www.eia.gov/environment/emissions/state/. Accessed 31 December 2019. PAGES 14-15 | ENERGY | HOME HEATING MAP: Heat pumps Efficiency Maine residential heat pump incentives program, FY2014-FY2019. Number of Housing Units “DP04. Selected Housing Characteristics (Total Occupied Housing Units): 2018–Maine County Subdivisions.” Dataset: ACS 5-Year Estimates. Limitation Values of percent of heat pump coverage may appear inflated because a housing unit could have up to two heat pumps installed using Efficiency Maine incentives.
BAR CHARTS: “B25040. House Heating Fuels (Housing Units)–Maine County Subdivisions, State of Maine, and U.S.” Dataset: ACS 5-Year Estimates. Charts show percentage point change between 2009 and 2018. Other category contains coal or coke, solar energy, no fuel, and other fuel. PAGES 16-17 | TRADE | DOMESTIC CONNECTIVITY MAP: Traded Industries are defined and categorized by Delgada et al. “Categorization of Traded and Local Industries in the US Economy.” 2015. US Clusters Project. https://www.clustermapping.us/content/clustermapping-methodology. Data “S2404. Industry by Sex for the Full-Time, YearRound Civilian Employed Population age 16 and Over: 2018. Maine County Subdivisions.” Dataset: ACS 5-Year Estimates. The location quotient (LQ) is a method of quantifying how concentrated a particular traded industry is in a community as compared to the state as a whole. It is calculated by dividing the proportion of individuals working in an industry in a given community by the statewide average for that industry. Values above 1 indicate a community has a greater relative proportion in a certain industry compared to the state which can be interpreted as an indication that it is serving more than its local population. For example, an LQ value of 1.5 can be interpreted as a community having a 50% greater proportion of individuals in a given industry than the state average. The export industry associated with each coastal community was identified as the export industry with the highest LQ. PAGES 18-19 | TRADE | INTERNATIONAL CONNECTIVITY MAP AND BAR CHART: Export data are from the U.S. Census Bureau using the USA Trade® Online tool. https://usatrade.census.gov/.Harmonized System Port-Level Data was averaged over the five-year period 2014-2018 to smooth out single year anomalies and to provide a more general picture of export trade through Maine’s coastal ports. Export values represent the amount of products that flow through Maine ports on their way to other countries, regardless of where the product originated. As such, this data will differ from other export data series based on product origination. PAGES 20-21 | TRADE | LOBSTER IMPORTS AND EXPORTS MAP: Top three lobster ports in Maine based on landings value. Values from Maine Department of Marine Resources Lobster Landings Viewer. https://maine.maps.arcgis.com/apps/opsdashboard/index.html#/ aad15e3248d44555a11d01ba4bbc51f8. Accessed 31 December 2019. PIE CHART: National Oceanic and Atmospheric Administration National Marine Fisheries Service 2018. Fisheries of the United States 2017. Silver Spring, MD: Office of Science and Technology. https://www.fisheries.noaa. gov/webdam/download/92995934. Accessed 9 January 2020. BAR CHART: Total U.S. lobster exports: U.S. Census Bureau using the USA Trade® Online tool. https://usatrade.census.gov/. State Export Data (Origin of Movements). The state export data reflects only the value of products that originate or have a final destination in the US. Dates: July 2017–June 2018; July 2018–June 2019. Note: Several regions were omitted from the bar charts. These are Australia and Oceania, Africa, and South America. These ‘Other Countries’ represent $6.5 million from July 2017-June 2018 and $9.1 million from July 2018-June 2019. FLOW DIAGRAM: Maine and Canada trade: U.S. Census Bureau using the USA Trade® Online tool. https://usatrade.census.gov/. Harmonized System Port-Level Data. The port-level data reflects the value of products that flow through Maine ports, even if their origin or final destination is not Maine. Dates: July 2018–June 2019. CREDIT: Annie Tselikis, Executive Director of Maine Lobster Dealers’ Association, and Emily Lane, International Sales Manager at Luke’s Lobster, provided insight into the international lobster trade and helped in the creation of the visualization that captured a complicated topic. Photo by Jeff Roberts. PAGES 22-23 | WORKING WATERFRONTS | OCEAN TRAFFIC MAPS: All datasets are from the Northeast Ocean Data Portal https:// www.northeastoceandata.org/. 1. Vehicle Monitoring System Vessel Activity of the: Multi-Species (Groundfish) Fleet, 2015-2016; Pelagics (Herring, Mackerel, Squid) Fleet, 2015-2016. 2. Marine Transportation Commercial Traffic Vessel Traffic Counts of Tug-Tow, Tanker, Cargo, and Commercial Passenger Fleets, 2017. 3. Recreational Boating is based on the SeaPlan 2012 Northeast Recreational Boater Survey.
The reason the fleets were picked was partially due to limited data availability. The lobster fleet was not shown, because the entire fleet has not been required to regularly report vessel locations. PAGES 26-27 | WORKING WATERFRONTS | PROTECTIONS MAP: Working Waterfront Access Protection Program (WWAPP) Project sites and acres from Land for Maine’s Future. Working Waterfront Access Protection Program, 2019. https://www.maine.gov/dacf/lmf/ docs/2008-June2019-LMF-WWF-projects-completed.pdf. In the summer of 2019, six new properties were selected for the Land for Maine’s Future Working Waterfront Access Protection Program, but the funds are not awarded until after an appraisal and proper due diligence is successfully completed. These properties are not shown on the map. Current Land Use for Working Waterfront State of Maine, Department of Administrative and Financial Services, Maine Revenue Services. “Municipal Valuation Return Statistical Summary Report 2017.” https://www.maine.gov/ revenue/propertytax/municipalservices/statisticalsummary.htm. Accessed 31 December 2019. Data cleaned and joined with county subdivisions. U.S. Army Corp of Engineers Dredging locations: USACE, New England District. “Maine Navigation Projects.” https://www.nae.usace.army.mil/ Missions/Navigation/Maine-Projects/. Accessed 31 December 2019. STATISTICS: Totals of acres, parcels, and communities in the Current Land Use Program are from the Municipal Valuation Return Statistical Summary Report 2017 (listed above). In the WWAPP, “Sustaining Maine’s Working Waterfront.” The Working Waterfront, 14 August 2019, http:// www.islandinstitute.org/working-waterfront/sustaining-maines-workingwaterfront. Accessed 14 January 2020; total acres from project sites list from Land for Maine’s Future (listed above). Percent of communities with a protection based on spatial analysis of each of the above programs’ locations and the 120 county subdivisions of coastal Maine. CREDIT: Additional support provided by Caitlin Cleaver. PAGES 28-29 | CIVIC INFRASTRUCTURE | NONPROFITS MAP: Data from United States Internal Revenue Services, Charities and Nonprofits. “Exempt Organizations Business Master File Extract (EO BMF).” 2019. https://www.irs.gov/charities-non-profits/exemptorganizations-business-master-file-extract-eo-bmf and United States Internal Revenue Services, Charities and Nonprofits. “Statistics of Income Tax Stats-Annual Extract of Tax-Exempt Organization Financial Data.” 2018. https://www.irs.gov/statistics/soi-tax-stats-annual-extract-of-taxexempt-organization-financial-data. Accessed 31 October 2019. Analysis Only organizations filing Form 990 include the number of employees in the Statistics of Income Tax Stats File. Organizations that file 990s are larger organizations that are not private foundations. Churches, while tax exempt, are not required to file Form 990, although some do. Employee counts were totaled based on the city in the address line. These totals were joined with the county subdivisions and mapped. The data was cleaned for exceptionally large nonprofit employers who may act as a headquarters for employees out of state. For example, Jackson Laboratories employs people in multiple states and so the number was adjusted down to reflect only the employees working in Bar Harbor. STATISTICS: Hours and volunteers from the Corporation for National and Community Service, “Maine Highlights, 2018.” https://www. nationalservice.gov/serve/via/states/maine. Accessed 9 January 2020. PIE CHART: Nonprofit Organizations in Maine Nonprofit organizations filings indicate what the organization identifies as its primary exempt activity classified by the National Taxonomy of Exempt Entities (NTEE) codes. The NTEE was formally adopted in 1995, but organizations determined exempt before 1995 retain their Activity Codes as this form of identification. Where the NTEE code was blank for organizations, the Activity Code was used. These primary exempt activities were categorized and the total number of nonprofits in each category were used to calculate the percent of nonprofit organizations in Maine by the various activities. BAR CHART: State rankings by volunteerism from the Corporation for National and Community Service, Serve Your Community, “Volunteering in America, Rankings.” 2018. https://www.nationalservice. gov/serve/via/rankings. Accessed 31 December 2019. CREDIT: Additional support provided by Caitlin Cleaver.
The Island Institute works to sustain Maine’s island and coastal communities, and exchanges ideas and experiences to further the sustainability of communities here and elsewhere.