SAMPLE EXAM PAPERS
BASED ON THE NEW SUBJECT SPECIFICATION FOR LEAVING CERTIFICATE

BASED ON THE NEW SUBJECT SPECIFICATION FOR LEAVING CERTIFICATE


• 4 SEC Sample Papers (2 Higher and 2 Ordinary)
• 12 4schools Sample Papers (8 Higher and 4 Ordinary)
• Student Guide to the Exam
• Full-colour papers to reflect the SEC exams
E-BOOK | ONLINE SOLUTIONS AND MARKING SCHEMES | LESSONS FROM THE TUITION CENTRE ON HOW TO APPROACH THE AACS 12 Sample Papers • Includes Exam Papers 16 •4SECSamplePap e r s
Published by 4schools
89F Lagan Road, Dublin Industrial Estate, Glasnevin, Dublin 11, D11 F98N, Republic of Ireland.
T: ++ 353 1 8081494 - E: info@4schools.ie
ISBN 978-1-918341-05-8
All rights reserved. No part of this publication may be reproduced or transmitted in any form or by any means, including photocopying and recording, without the publisher’s written permission. Such written permission must also be obtained before any part of this publication is stored in a retrieval system of any nature. Permission requests should be directed to 4schools.
As of the time of publication, all web addresses listed were active and contained information relevant to the topics discussed in this book. 4schools does not accept responsibility for the content or opinions expressed on these websites and videos. Please note that the content, views, and web addresses may change, which is beyond the control of the publisher or the author. Students should always be supervised when reviewing websites and videos.
4schools has attempted to contact all proprietors of images, texts and graphics included in this book. Proprietors we were unable to reach are requested to contact us. We would be happy to make the necessary arrangements at the first opportunity.
Across the papers, the overall format is clear and consistent:
2 hours 30 minutes, 300 marks
Student answer six out of seven questions, each worth 50 marks
Question 1 is compulsory, followed by choice from Questions 2–7
Students answer question 1 and any five other questions
The exam papers consist of large, multi-part questions where marks are gained by students across many short subparts (definitions, explanations, data interpretation, investigative reasoning, etc.).
Compared with historical exam papers, these sample papers tend to show several important shifts. The papers provide a balance of short-answer recall questions, structured data-analysis tasks, and extended response questions that require scientific reasoning, the ability to make connections between different areas of the course and the cross-cutting themes of health, technology and sustainability are integrated throughout.
Most questions involved student engagement with a graph, data table, diagram, or short comprehension piece. Students then answer multiple related question parts that follow.
Student knowledge of concepts and recall of biological terms, processes and structures is still essential, but assessment of nature of science skills is also centrally important. This takes the form of students being expected to:
• interpret evidence
• justify claims
• identifying variables
• writing conclusions
• evaluating methods
• suggesting improvements to investigations
• understanding the importance of reliability, accuracy, validity
• applying understanding to unfamiliar settings.
Centre Stamp
Coimisiún na Scrúduithe Stáit
State Examinations Commission
2 hours 30 minutes
300 marks
There are seven questions on this examination paper. Each question carries 50 marks. Answer Question 1 and any five other questions.
Write your Examination Number and your Day, Month and Year of Birth in the boxes on the front cover.
Write your answers in blue or black pen. You may use pencil for sketches, graphs and diagrams only.
This examination booklet will be scanned and your work will be presented to an examiner on screen. All of your work should be presented in the answer areas, or on the given graphs, or diagrams. Anything that you write outside of the answer areas may not be seen by the examiner.
You are not required to use all the space provided. There is space for extra work at the back of the booklet. If you need to use it, label any extra work clearly with the question number and part.
You may lose marks if your solutions do not include relevant supporting work. You may lose marks if the appropriate units of measurement are not included, where relevant.
Question 1
Question 1 is compulsory
50 marks
(a) (i) Identify each of the following organs (A and B) associated with the digestive system.
(ii) Describe a role organ A plays in digestion.
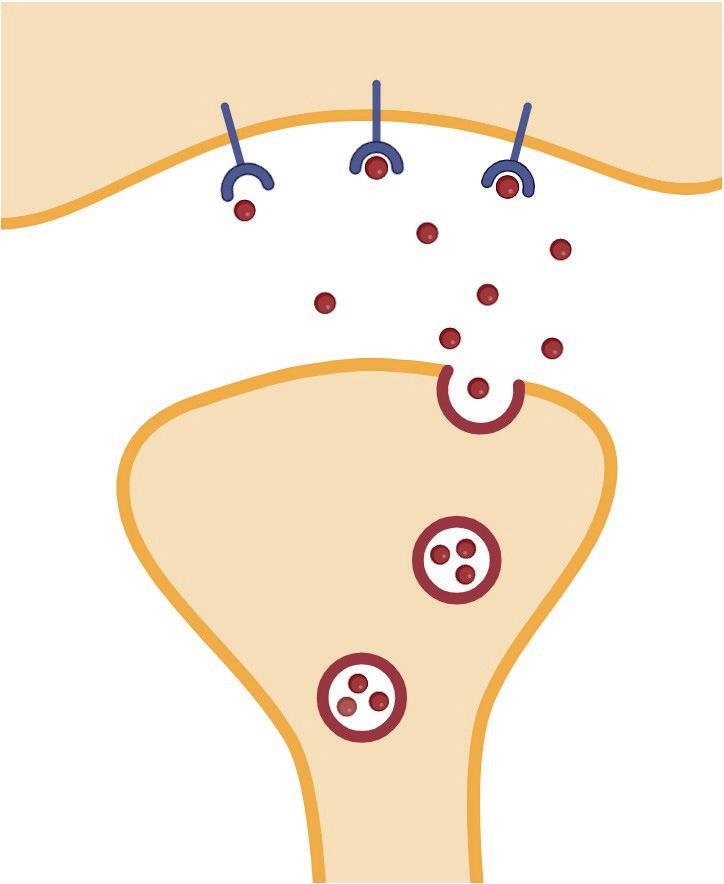
(b) The diagram shows a synapse in the nervous system.
(i) Molecule A and structure B have roles in neurotransmission. Identify A and B
(ii) On the diagram on the right, draw an arrow to show the direction the nerve impulse is transferred.
(iii) What happens to the molecules labelled A after the nerve impulse transmission is complete?

(c) A student carried out an investigation on the movement of water into and out of plant tissue.



During the investigation, pieces of cucumber (each 5 g in mass) were placed into different salt concentrations (M = molarity) and the final masses of each were recorded after 30 minutes. The student collected the following data. Analyse the data and answer the questions that follow.
Molarity is a measure of concentration
(i) What term describes movement of water across a membrane?
(ii) Name the independent variable in this investigation.
(iii) What conclusion can the student make from this investigation based on the data collected?
(d) The hormone insulin stimulates the uptake of glucose from the bloodstream into cells, particularly in muscles. Glucagon is another hormone that converts stored glycogen back into glucose when needed. Glucose and glycogen are types of carbohydrate.
(i) What is the general chemical formula for all carbohydrates?
(ii) Explain why glycogen cannot be absorbed into body cells.
The graph shows a person’s relative blood glucose concentration over a period of time. The person begins eating at the 20 minute mark. Analyse the data and answer the questions that follow.
Blood glucose levels after a meal
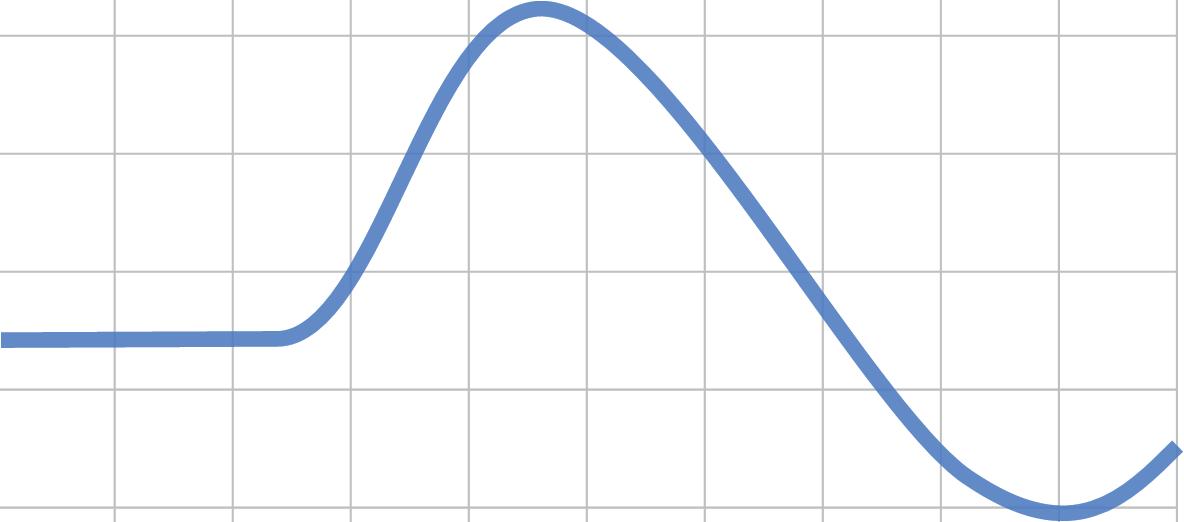
(iii) On the horizontal axis above, indicate a time with the letter X, when the secretion of the hormone insulin is likely to start increasing.
(iv) Low blood glucose concentration is a stimulus for the secretion of glucagon. On the horizontal axis above, indicate a time with the letter Y, when the secretion of the hormone glucagon is likely to start increasing.
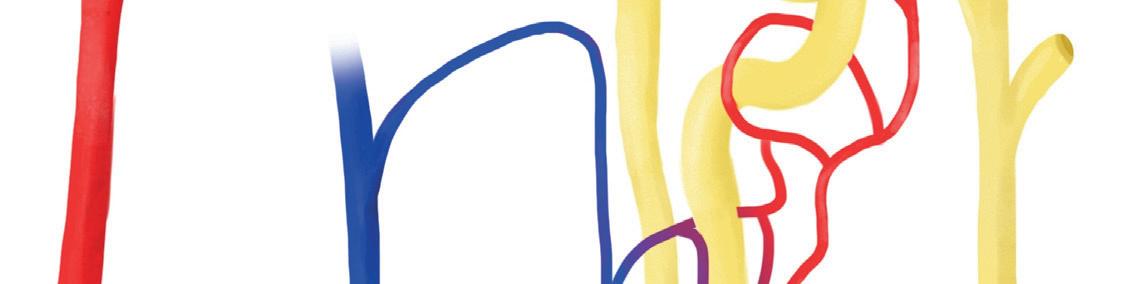
(e) The diagram shows a nephron from a human kidney which plays a part in the filtration of blood.



Blood vessels
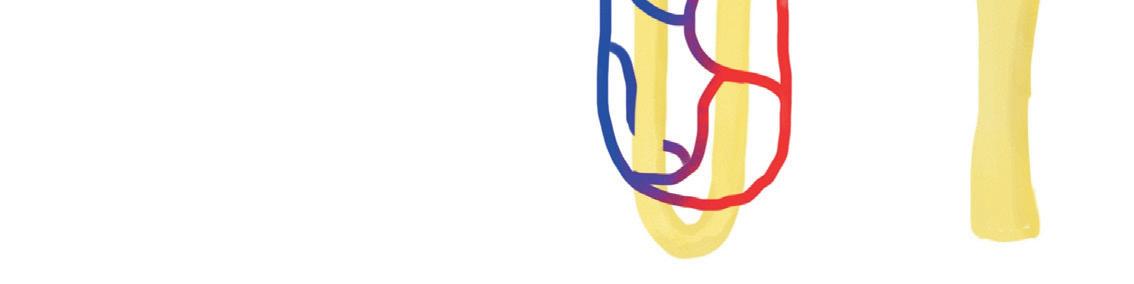
(i) Name the parts of the nephron labelled A and B
Collecting duct containing urine
(ii) Filtration in the kidney occurs under a form of high pressure known as ultrafiltration. On the diagram above, write the letter F to show where this type of filtration occurs.
(iii) Name a constituent of the blood not normally present in urine.
(iv) The structure labelled B has evolved to be longer in certain animal species such as camels and desert rats. Suggest an advantage this provides to these animals.
(f) Rhizopus is a fungus and can be classified as a decomposer.
(i) What is meant by the term decomposer?
(ii) Draw a labelled diagram of Rhizopus
Labelled diagram:
Question 2
Answer any five questions from the following questions 2 to 7. Each question carries 50 marks.
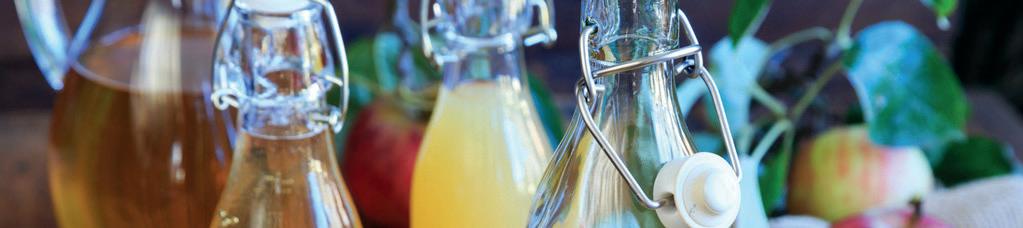
The food and drinks industry use a variety of enzymes and microorganisms to maximise production. Pectinase is an enzyme used to remove the cloudiness in juices such as apple juice by breaking down the pectin found in fruit.
Pectin is a naturally occurring polysaccharide which provides strength to plant tissues. The breakdown of pectin aids the filtration process and increases the overall juice yield.
(a) (i) What are enzymes?
50 marks


(ii) What is the role of pectin in plant cells?
(iii) Why is pectinase used in juice production?
(iv) State two factors that would affect the rate of activity of enzymes such as pectinase.
(v) What part of an enzyme allows them to act on their substrate?
(b) Microorganisms such as the yeast Saccharomyces cerevisiae are used to produce ethanol from fruit juices in a process known as fermentation.
(i) Name two conditions that must be present for fermentation to occur, other than the presence of sugars in the fruit juice and microorganisms.
(ii) Biologists use a two-part naming system called the binomial system when referring to organisms.
Identify the classification level for each part of the binomial name Saccharomyces cerevisiae
Saccharomyces cerevisiae
(iii) Apple trees are members of the kingdom plantae (plants), whereas yeasts are members of the kingdom fungi
Compare the kingdoms by placing a tick ( ) in the appropriate boxes in the table below.
Note: a characteristic may be present for both kingdoms.
Kingdoms
Characteristic
Have cell walls made of cellulose
Heterotrophic
Eukaryotic
Lacks chloroplasts
Contains chitin
Plantae Fungi
(c) The diagram shows some of the main steps in fermentation in yeast. Analyse the diagram and answer the questions that follow.





(i) Name the 3-carbon compound formed at X.
(ii) Where in the yeast cell does fermentation occur?
(iii) Describe the role of ATP in cellular reactions.
(iv) Name the waste product of fermentation when it occurs in animal cells.
(v) How many carbon atoms does the product you named at part (c) (iv) above contain?
(vi) Suggest an example of animal tissue in which fermentation might occur.
(d) A student investigated the effect of different sugars ( A and B) on the rate of fermentation in yeast. The volume of carbon dioxide produced over time was used to measure the rate of fermentation. The yeast and sugar mixture in this investigation was maintained at a temperature of 25 °C. The graph below shows the student’s results. Analyse the graph and answer the questions that follow.

(i) Which line A or B indicates the results for glucose? Justify your answer.
Justify:
(ii) On the graph above, draw a line to predict the rate of fermentation of sugar B over the course of the investigation if the yeast were maintained at a temperature of 4 °C (placed in the refrigerator).
Question 3
(a) The diagram shows a transverse section through an alveolus in the lungs. The arrow shows the overall movement of water vapour during gas exchange.
Alveolus (air space)



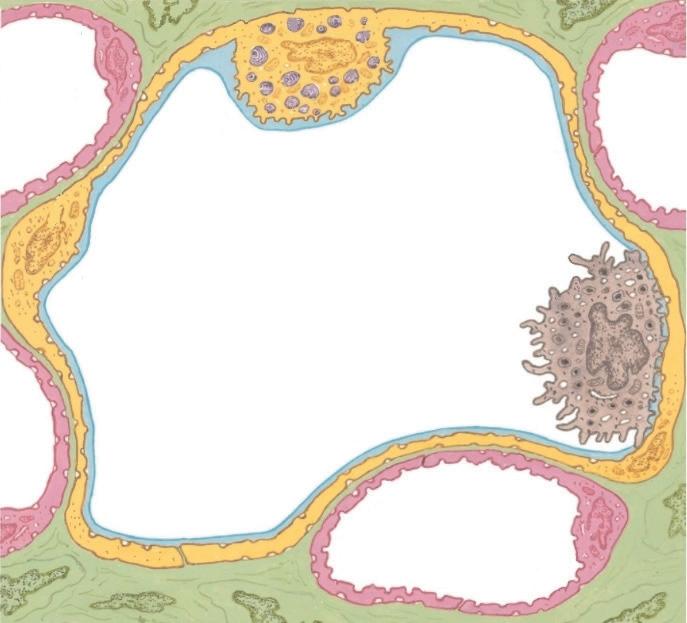
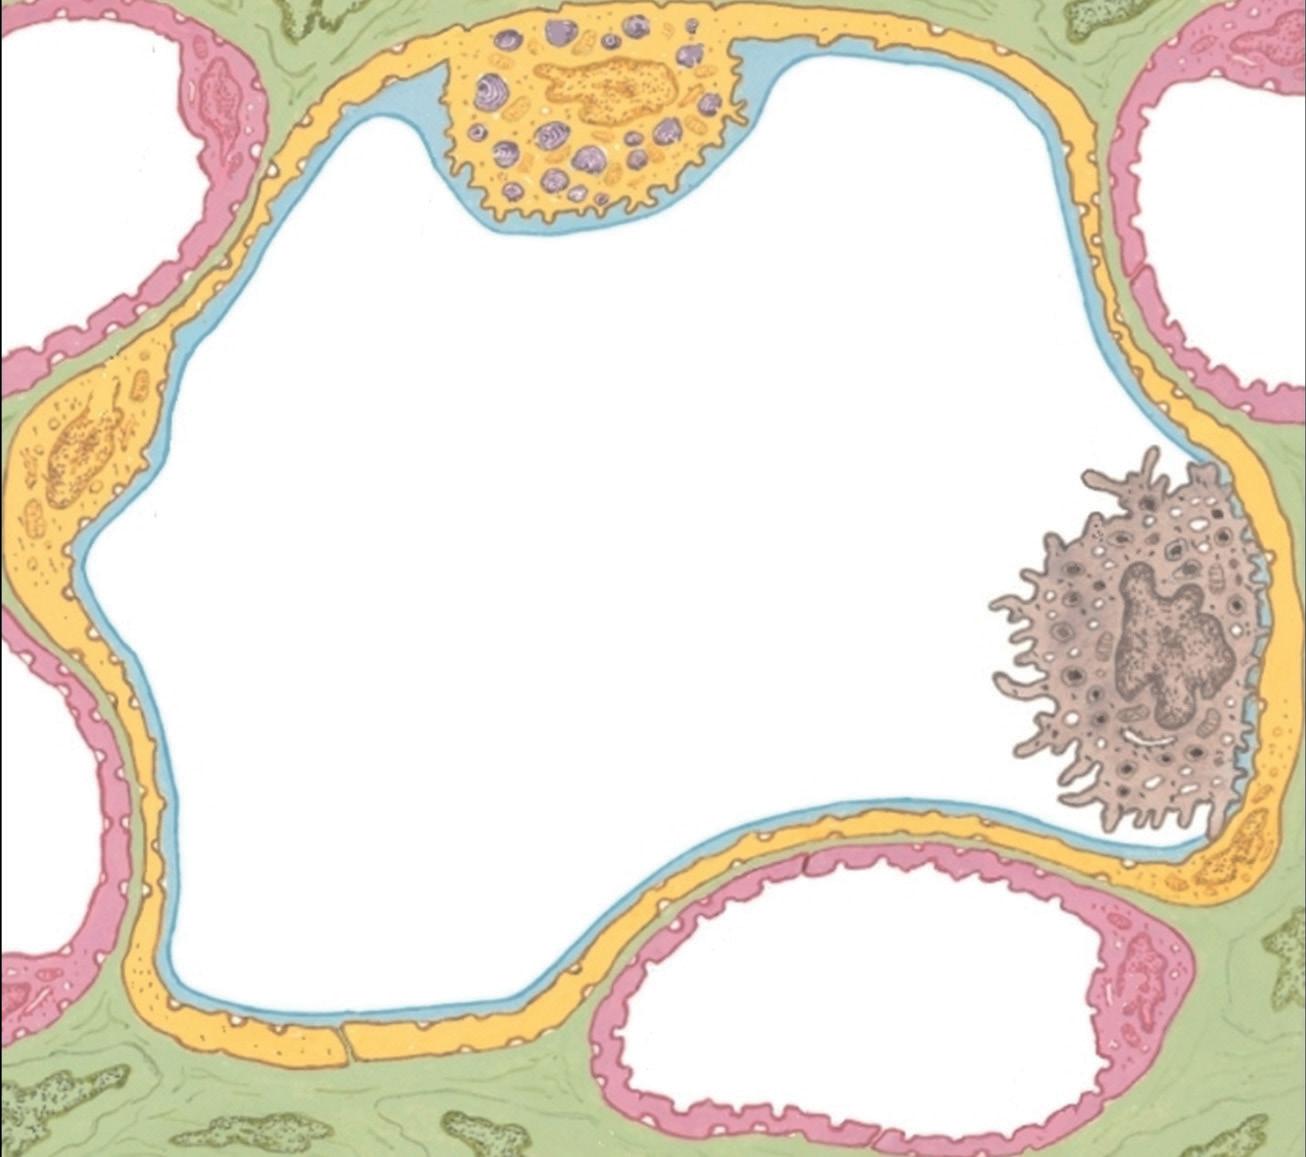
(i) On the diagram, draw labelled arrows to clearly indicate the overall direction in which each gas, oxygen (O2) and carbon dioxide (CO2) move during gas exchange.
(ii) Name the process by which this gas exchange occurs.
(iii) Outline one way that alveoli are adapted to carry out efficient gas exchange.
(b) (i) The alveolar macrophage is an example of a monocyte that has migrated from the bloodstream into the alveolus.
Describe the role monocytes play in the innate immune system.
(ii) Describe one other innate immune response in the body.
(c) Carbon dioxide and oxygen are two common gases carried in the blood between the heart and the lungs in the pulmonary system.
(i) 1. Describe the main way carbon dioxide is transported in the blood.
2. Describe the main way oxygen is transported in the blood.
(ii) Compare the relative concentration of each gas (carbon dioxide and oxygen) in arterial pulmonary blood and venous pulmonary blood by writing the words ‘ High’ or ‘Low’ into the correct boxes.
Increased carbon dioxide in the blood increases its acidity (acidosis). Respiratory acidosis is a condition that results from lower than normal blood pH. The normal pH range of the blood is between 7.35 and 7.45.





The blood pH of two individuals (A and B) was measured after resting for 5 minutes. Person A had a blood pH of 7.43 and person B had a blood pH of 7.42. Their blood pH was then measured at set times during an exercise period. The data from this study is shown in the table.
(iii) On the grid below, plot a suitable graph to represent all the data in the table above.
(iv) Which person is better adapted at removing carbon dioxide from their bloodstream? Explain your answer.
Person:
Explain:
(d) As part of their training, athletes often us e a spirometer to measure the volume of air inhaled and exhaled during exercise. The gra ph below shows how the volume of air in the lungs changes for an athlete before, during and after a short period of exercise.
(i) Name the two muscles responsible for inhalation and indicate whether these muscles are contracting or relaxing during this inhalation process.
(ii) Using information from the graph, estimate the volume of air that enters and leaves the lungs of the athlete at rest.
(iii) On the graph above, write the letter X to show the time at which exercise began and the letter Y to show the time at which the breathing rate returned to the resting rate.
(iv) Analysing information from the graph, describe two ways the breathing of the athlete changed during exercise.
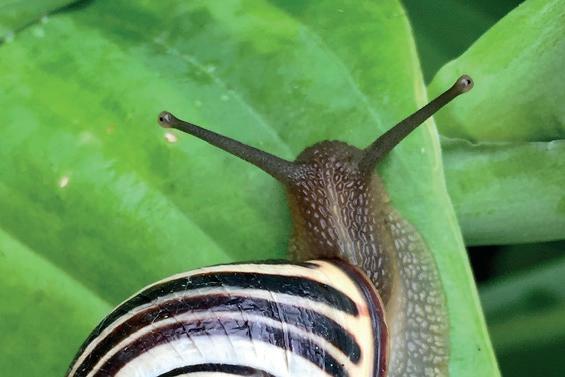
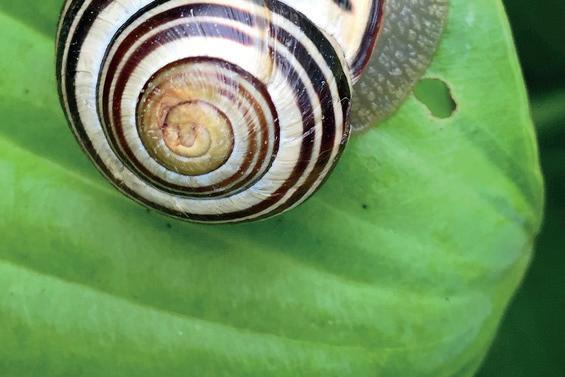
(a) Grove snails (Cepaea nemoralis) have evolved different colours and patterns on their shells to aid in camouflage.
Brown grove snails are less visible in woodlands while brighter yellow grove snails blend into open grassy areas in summer.
The gene for shell colour has several alleles, such as the dominant allele brown B, and a recessive yellow allele b
Banding on the shell is controlled by two alleles: the dominant allele N, for a normal, unbanded shell and a recessive allele n, for one that is banded.
(i) Explain the underlined terms used in the passage.
Gene:
Alleles:
Dominant:
(ii) State the genotype for a snail with a yellow, banded shell and state the genotype of the gamete(s) that this snail could produce.
(iii) State the genotype for a snail with a brown, unbanded shell, heterozygous for both characteristics and state the genotype of the gamete(s) that this snail could produce.
(iv) A student carried out a cross of the offspring produced between the two snails described in (ii) and (iii). They a ssumed that the genes are not linked. Use an appropriate method to determine the genotypes and phenotypes of this cross.
(v) Researchers have discovered that the genes controlling colour and banding are linked and are located on the same chromosome. What is the significance of the genes bein g located on the same chromosome on the possible offspring of this cross?
(b) Read the passage below and answer the questions that follow.
Grove snails are a favourite food of the song thrush which breaks open their shells on flat stones to feed on the soft interior. The song thrush is itself hunted by cats and sparrow hawks and uses its speckled plumage to hide in the brown undergrowth of hedgerows.
Grove snails feed mainly on decaying vegetation. They are often host to parasites such as nematodes and flatworms, which along with the song thrush can limit their population.
Adapted from woodlandtrust.org.uk
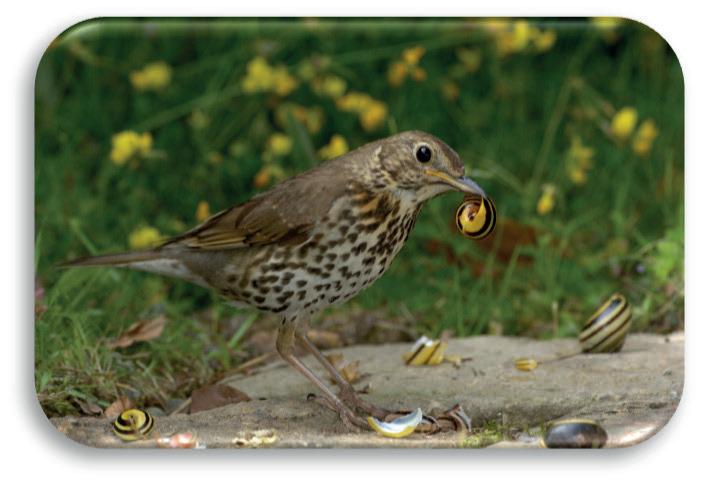
(i) Using organisms from the article above, model a food chain and draw a pyramid of biomass of this food chain.
(ii) The population of song thrushes has declined steeply over the last fifty years. Suggest one possible explanation for this decline.
(iii) What ecological change might result if the population of song thrushes continues to decrease?
(iv) Describe one adaptation that has evolved in the song thrush which enables it to survive and explain how this adaptation benefits the song thrush.
(v) State the ecological relationship between the song thrush and the grove snail.
(vi) Gardeners sometimes use nematodes to control the population of slugs and snails. Suggest one advantage of this form of control.
(a) The diagram shows a side view of the female reproductive system.
(i) Identify any two of the parts labelled A, B and C.
(ii) On the diagram above, mark with the letter X the position of the labia.
(iii) State any one change that occurs in the human female during puberty.
(b) The diagram below shows the events at differ ent stages inside an ovary during a complete menstrual cycle.





(i) Name the type of nuclear division that re sults in the formation of haploid egg cells.
(ii) Identify the structure labelled Y
(iii) Name the hormone that stimulates ovulation of the egg.
(iv) Identify the structure labelled Z.
(v) Is structure Z formed before or after ovulation?
(vi) What happens to structure Z at the end of the menstrual cycle, assuming the egg is not fertilised?
(c) (i) When the egg is fertilised, a zygote is formed. Describe how the zygote develops up until implantation.
(ii) The graph below shows how the relative levels of the hormones oxytocin , prolactin and progesterone change during pregnancy, birth and post-partum (after the birth).

In the table below, match the hormones named above to their effects in the human female and match each hormone to their correct letter on the graph. Effect
Stimulates breastmilk production
Stimulates uterine contractions
Suppresses uterine contractions
(iii) Model how the levels of another sex hormone, oestrogen, would change throughout pregnancy, birth and the post-partum stage by either sketching a line on the graph above or describing how the levels would change in the space below
(d) During antenatal screening blood samples may be taken to determine the blood group of the mother.
(i) Name the two common blood grouping systems in humans.
1.
(ii) Why is knowledge of a person’s blood group important?
(e) (i) Difficulties may occur during the reproduction process due to infertility. Outline one treatment for infertility.
(ii) There are many types of contraception. Name any two types and outline how each works.
2. Type: Outline: Type: Outline:
(a) Using aseptic techniques, a student carried out an investigation into the growth of a species of bacteria by inoculating five agar plates, each at a different pH. Inoculation involves the process of introducing bacteria into a nutrient culture, such as agar. All plates were incubated at 30 °C for 48 hours and the average diameters of the bacterial colonies were calculated. The table below shows the student’s results. Analyse the data and answer the questions that follow.
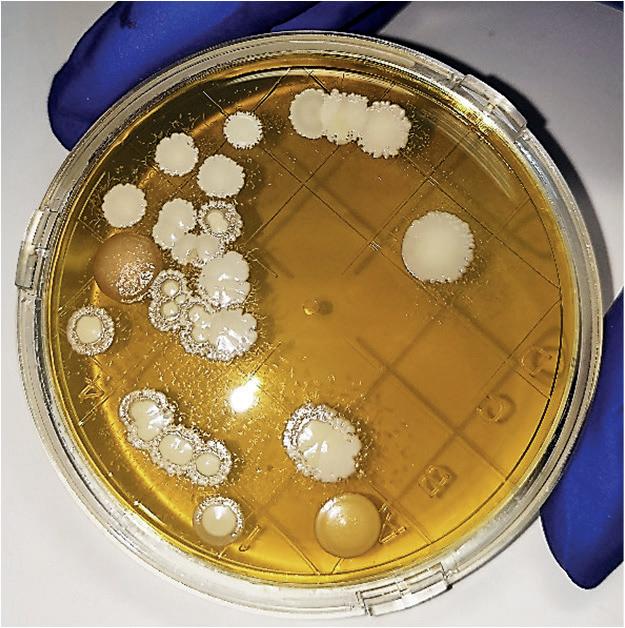
(i) Name the dependent variable in this investigation.
(ii) Describe one way the student would have maintained aseptic conditions during the investigation.
(iii) Suggest a reason why this species of bact erium shows low growth at pH 4 and pH 10.
(iv) It can be difficult to measure the diameter of the colonies when they merge together after a period of time. Suggest one way the student could have overcome this problem.
(b) Read the article and answer the questions that follow.
The bacteria naturally present in the vagina form part of the human microbiome, with Lactobacillus crispatus as a dominant species in a healthy vagina.
These bacteria maintain an acidic environment that prevents harmful bacteria from growing. Low levels of lactobacilli in the vagina can lead to infections (vaginosis) from other species of harmful bacteria.
Adapted from W.J.Y. Chee et al., 2020.
(i) Explain the term microbiome.
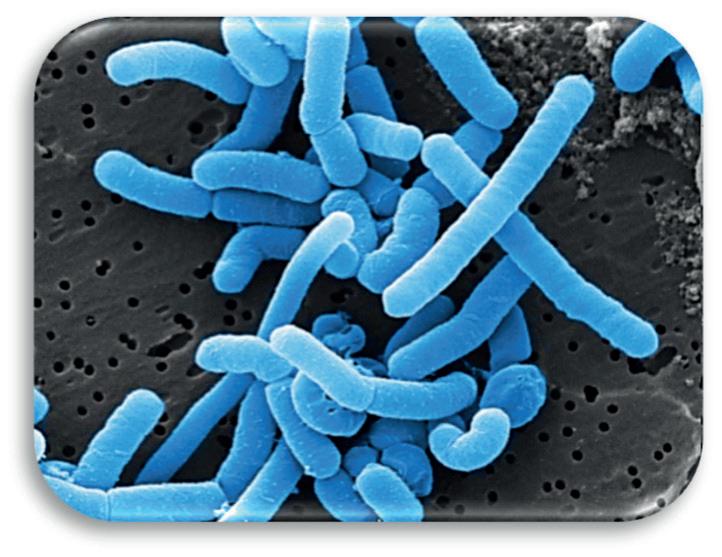
(ii) How does the presence of Lactobacillus crispatus in the vagina provide benefit?
(iii) What type of relationship exists betw een vaginal lactobacilli bacteria and humans?
(iv) It has been suggested that ingesting capsules containing live Lactobacillus crispatus cultures is a treatment for bacterial vaginosis caused by pathogenic bacteria. Is this a testable hypothesis? Justify your answer.
(c) Read the article and answer the questions that follow.
Helicobacter pylori and peptic ulcers
Helicobacter pylori (H. pylori) is a species of bacteria that has evolved to survive in the acidic environment of the stomach.
It weakens the mucus lining allowing acid to damage the stomach wall, causing painful disorders such as peptic ulcers.
Long term infection by H. pylori can inhibit genes that regulate normal cell division of epithelial cells in the stomach leading to cancer.
Adapted from mayoclinic.org
(i) What is the normal pH of the stomach?
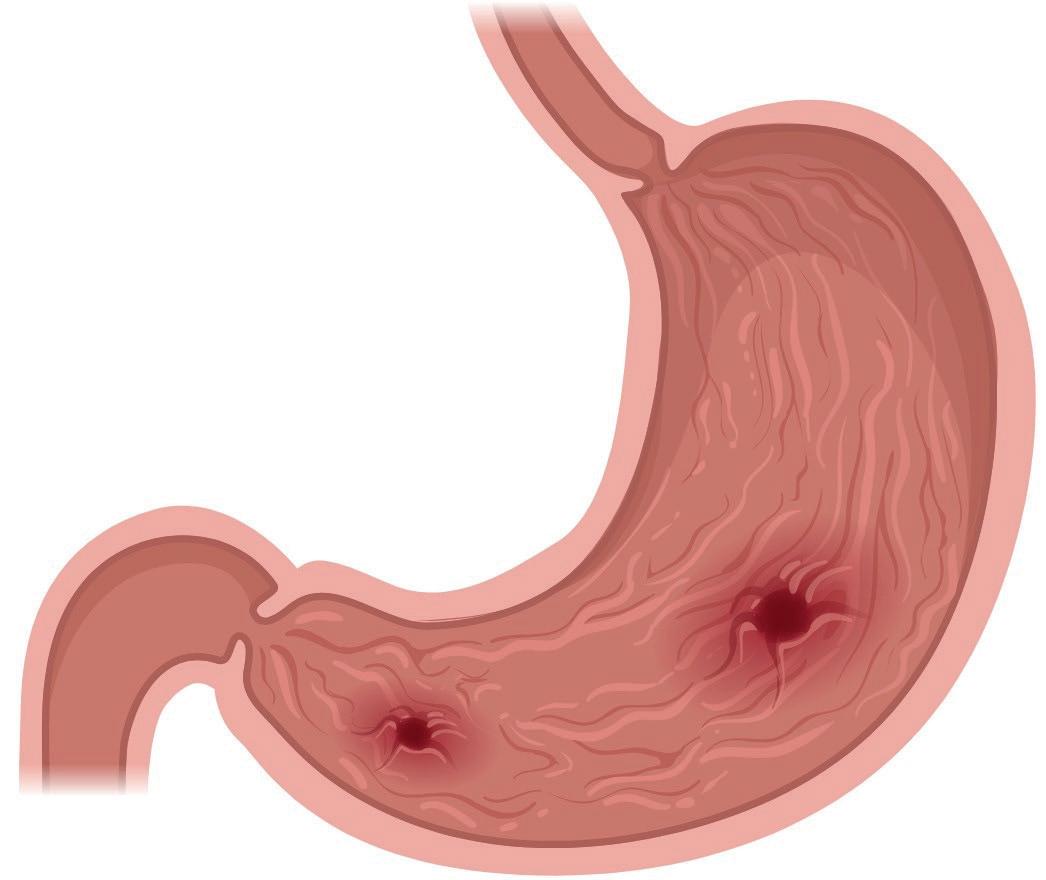
(ii) State a function of the acid produced in the stomach.
(iii) H. pylori infection can influence gene expression. What term describes the interaction between environment and gene expression?
(iv) Genetic variations in H. pylori can significantly increase its ability to survive in the host. Describe two types of genetic mutations.
(d) H. pylori survives in the acidic stomach environment by producing the enzyme urease. Urease produces ammonia which raises the pH of the stomach. The table below shows a sequence of DNA bases from the CagA gene in H. pylori that is responsible for regulating urease production.
(i) Write down the corresponding mRNA code that is generated from this section of DNA.
(ii) Use the information in the translation key below to write down the sequence of amino acids formed when this section of the CagA gene is expressed.
Amino acid 1: Amino acid 2: Amino acid 3:
(iii) To identify emerging strains of H. pylori, researchers use DNA sequencing to map the genome by breaking it into fragments and separating them based on size. How many fragments are formed from the sequence above during DNA sequencing?
(iv) Describe how these fragments are formed and separated.
Question 7
(a) The Rhododendron is a medium-sized shrub that grows rapidly in woodlands creating shade that inhibits the growth of smaller plants. A group of researchers conducted a study comparing the abundance of species in three different environments.
Areas without Rhododendron (Uninvaded)
Areas with dense Rhododendron cover (Dense)
Areas where Rhododendron had been previously cleared (Cleared)
Adapted from J.E. Maclean et al., 2017
Abundance of species in different environments
(i) How is the abundance of species affected by dense Rhododendron cover?
(ii) Rhododendron is in competition with the small plants. Explain the term competition.
(iii) Suggest a conservation strategy to maintain a high abundance of species in an ecosystem with increasing Rhododendron cover.
(iv) Suggest why the abundance of species is slow to recover in areas cleared of Rhododendron
(v) Suggest how bias could be avoided when measuring the abundance of species in an area.
(b) Another group of researchers compared the amount of carbon dioxide (CO2) released from soil invaded with Rhododendron and soil from native woodlands over a nine-month period.
Adapted from G.L. Jones et al., 2019
(i) On the grid below, plot a suitable graph to represent all the data in the table above.
(ii) What is the source of the CO2 released from the soil?
(iii) Suggest a reason for the difference in the levels of CO2 produced in each soil.
(iv) Name any other process that can release carbon to the atmosphere.


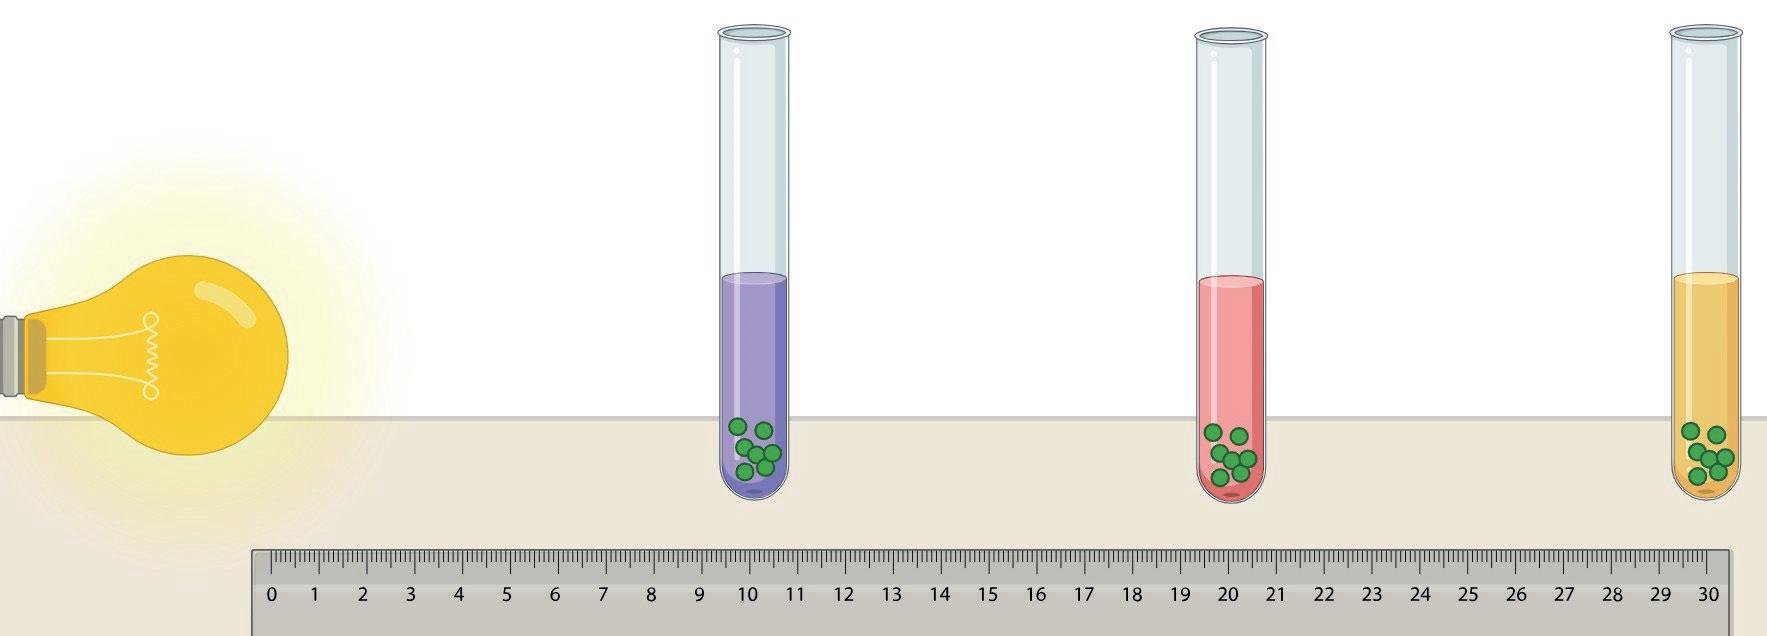
(c) A group of students carried out an investigation into the effect of decreasing light intensity on the rate of photosynthesis. Green algal ce lls were immobilised and placed in hydrogen carbonate indicator, which changes colour in different concentrations of carbon dioxide. CO2 level High Medium Low Colour

Indicator Immobilised algal beads
(i) Describe how a named environmental condi tion could be kept constant during the investigation.
(ii) Use the colour chart above to determine the relative carbon dioxide concentration in each test tube.
Test tube 1:
Test tube 2:
Test tube 3:
(iii) Explain why there are differences in carbon dioxide concentrations between test tubes 1 and 3
(d) The diagram represents a section of the thylakoid membrane inside the chloroplast of a leaf cell showing two possible electron pathways during photosynthesis.


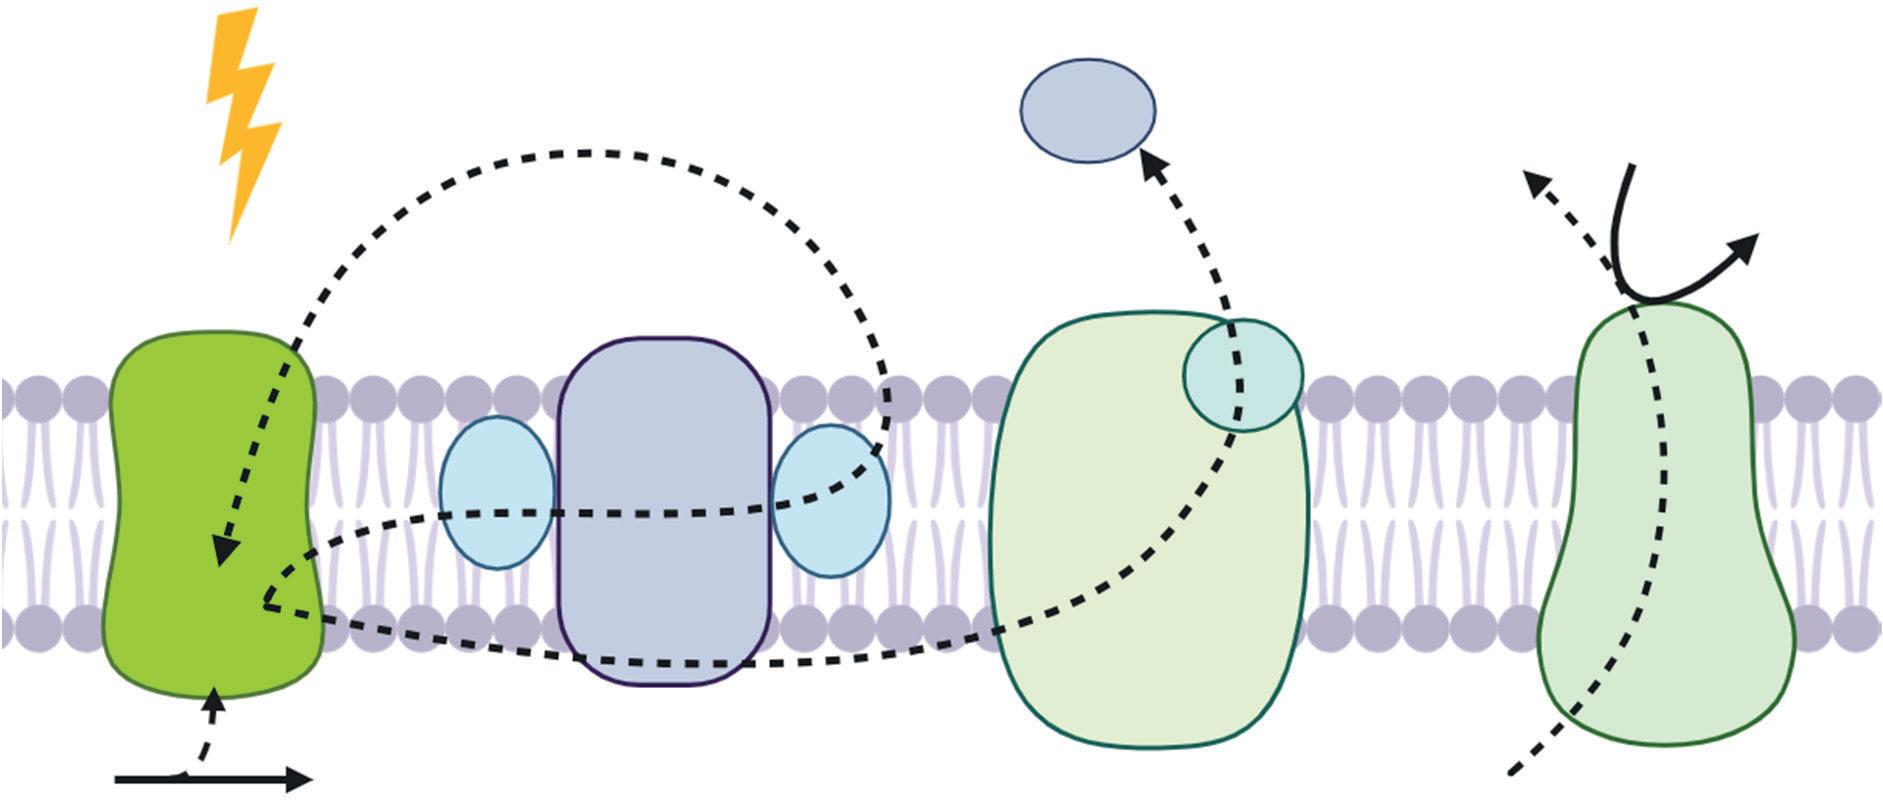



(i) What is the purpose of the chlorophyll molecules labelled in the diagram?

(ii) Describe how photolysis of water occurs at A.
(iii) Name the final electron acceptor labelled B at the end of the non-cyclic pathway.
(iv) Describe the role of molecule B in the light-independent reaction.
(v) Name the enzyme labelled C in the thylakoid membrane that allows protons to flow along a concentration gradient from the thylakoid lumen to the stroma.
Additional writing space. Label all work clearly with the question number and part.
Additional writing space. Label all work clearly with the question number and part.
Additional graph paper. Label all work clearly with the question number and part.
Acknowledgements:
Images/graphs/diagrams:
Diagrams on page 3: shutterstock.com; biorender.com
Image on page 4: State Examinations Commission
Graph on page 5: State Examinations Commission
Diagram on page 6: dreamstime.com
Image on page 8: istockphoto.com
Diagram on page 10: State Examinations Commission
Graph on page 11: State Examinations Commission
Image on page 11: State Examinations Commission
Diagram on page 12: netterimages.com
Diagram on page 14: State Examinations Commission
Graph on page 15: State Examinations Commission
Images on page 16: snails101.com; alamy.com
Image on page 18: alamy.com
Diagram on page 20: Adapted from shutterstock.com
Diagram on page 21: dreamstime.com
Graph on page 22: State Examinations Commission
Image on page 23: alamy.com
Image on page 24: wikipedia.com
Image on page 25: © 2018 Dr. Horst Neve, Max Rubner-Institut
Diagram on page 26: Created on biorender.com
Graph on page 28: Adapted from Invasion by Rhododendron…., J.E. Maclean et al., 2017.
Diagram on page 30: Created on biorender.com
Diagram on page 31: Created on biorender.com
Texts/data:
Data on page 14: Adapted from Acid-base balance during repeated cycling sprints….., S. Ratel et al., 2002, Journal of Applied Physiology.
Text on page 18: Adapted from woodlandtrust.org.uk
Text on page 25: Adapted from Vaginal microbiota…., W.J.Y. Chee et al., 2020, Microbial Cell Factories.
Text on page 26: Adapted from mayoclinic.org
Text and data on page 28: Adapted from Invasion by Rhododendron ponticum…., J.E. Maclean et al., 2017.
Data on page 29: Adapted from Reduced soil respiration…., G.L. Jones et al., 2019, Soil Biology and Biochemistry.
Material may have been adapted, for the purpose of assessment, without the authors’ prior consent.
Do not write on this page
Copyright notice
This examination paper may contain text or images for which the State Examinations Commission is not the copyright owner, and which may have been adapted, for the purpose of assessment, without the authors’ prior consent. This examination paper has been prepared in accordance with section 53(5) of the Copyright and Related Rights Act, 2000. Any subsequent use for a purpose other than the intended purpose is not authorised. The Commission does not accept liability for any infringement of third-party rights arising from unauthorised distribution or use of this examination paper.
Leaving Certificate Examination – Higher Level
Biology
Sample 1
2 hours 30 minutes
2 hours 30 minutes 300 marks
Examination Number
Date of Birth For example, 3rd February 2005 is entered as 03 02 05
Centre Stamp
You can download this paper’s marking scheme by scanning the QR code:

There are seven questions on this examination paper. Each question carries 50 marks. Answer Question 1 and any five other questions.
Write your Examination Number and your Day, Month and Year of Birth in the boxes on the front cover.
Write your answers in blue or black pen. You may use pencil for sketches, graphs and diagrams only.
This examination booklet may be scanned and your work presented to an examiner on screen. All of your work should be presented in the answer areas, or on the given graphs, or diagrams. Anything that you write outside of the answer areas may not be seen by the examiner.
You are not required to use all the space provided. There is space for extra work at the back of the booklet. If you need to use it, label any extra work clearly with the question number and part.
You may lose marks if your solutions do not include relevant supporting work.
You may lose marks if the appropriate units of measurement are not included, where relevant.
Question 1
Question 1 is compulsory
50 marks
(a) The graph below shows the antibody concentration over time after initial and secondary exposure to an antigen.
of antibody
Source: teachmephysiology.com
(i) What is an antibody?
(ii) Name the white blood cells that produce antibodies.
(iii) Describe two differences between the primary and secondary immune responses shown in the graph.
(iv) Exposure to an antigen can occur through natural infection. State another way in which a person could be exposed to an antigen.
(b) The diagram shows an overview of the nitrogen cycle. The arrows represent the processes involved in the cycling of nitrogen from one form to another.
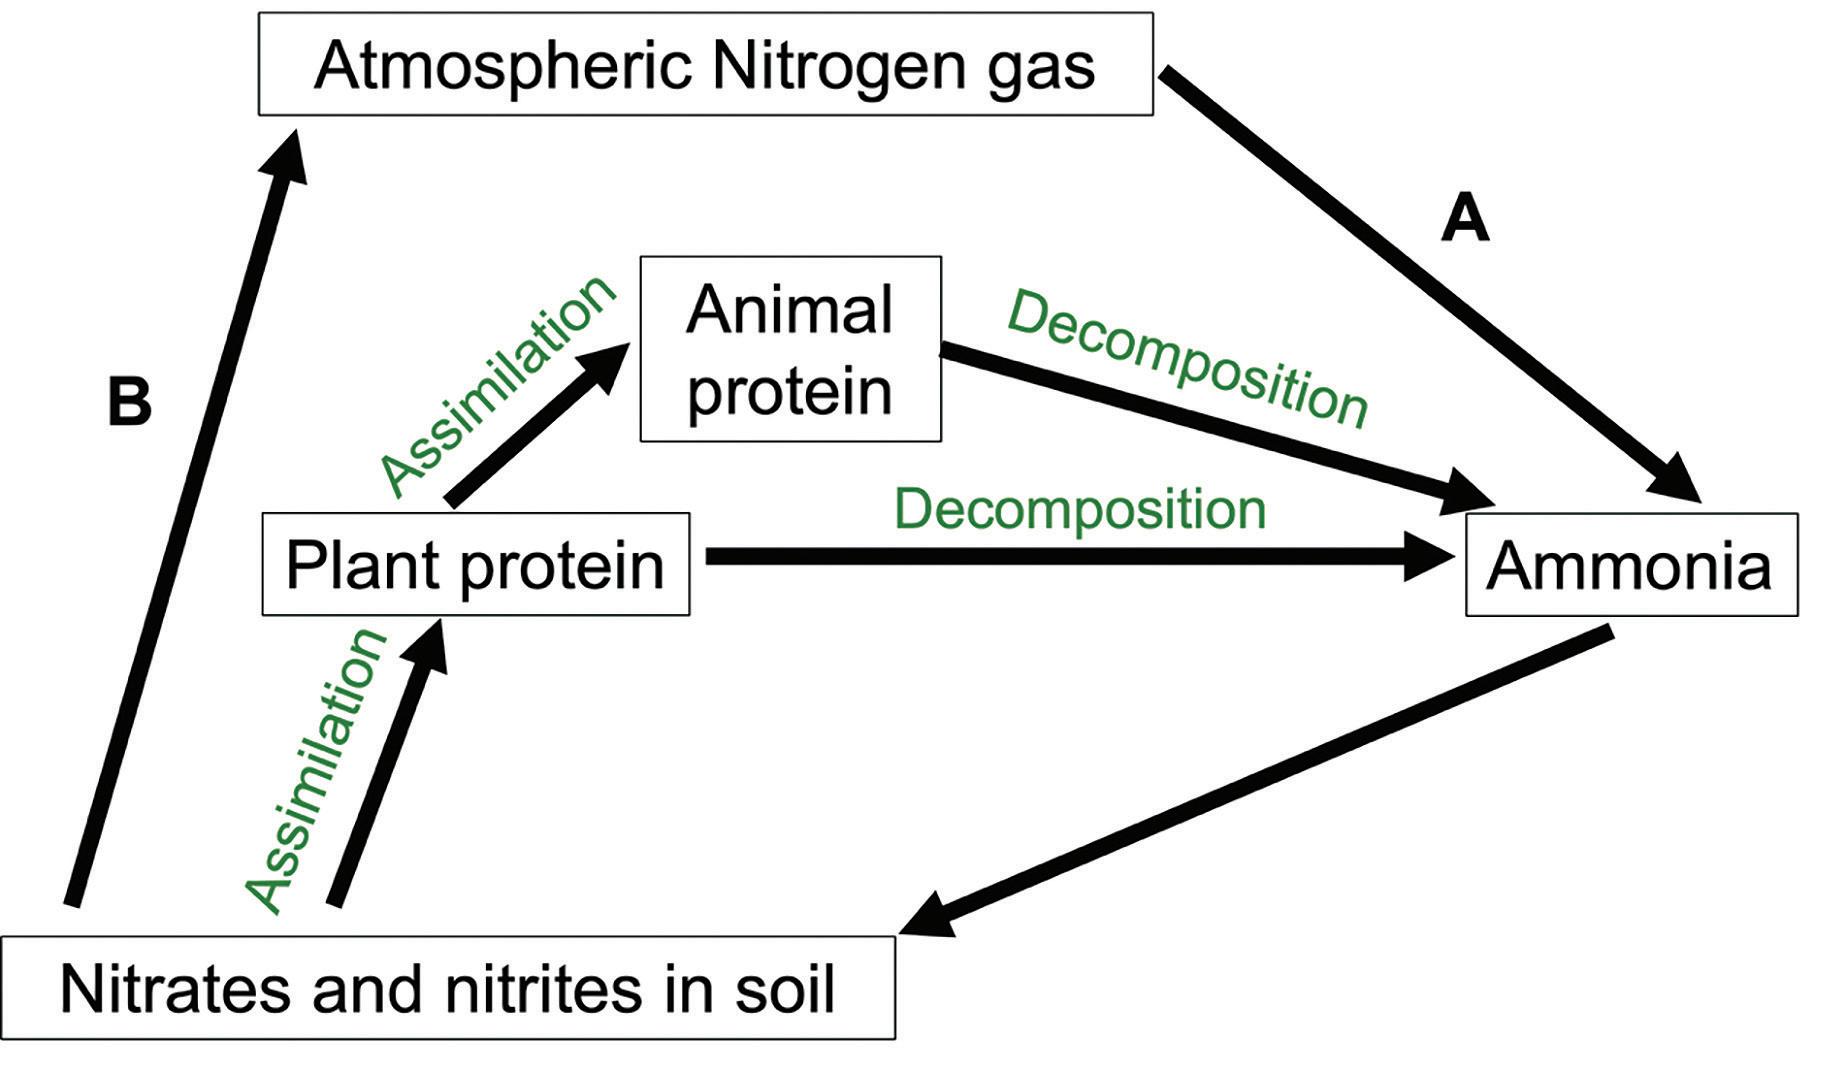
(i) Identify processes A and B.
A: B:
(ii) Name one biomolecule, other than protein, that contains the element nitrogen.
(iii) Name one human activity that has disrupted the nitrogen cycle and state how it has negatively impacted the environment.
Named activity:
Negative impact:
(iv) Suggest one measure that can be taken to counteract the issue identified in (iii)
(c) The diagram below is a model of transcription, a process by which an mRNA copy of a gene is produced.
Coding strand
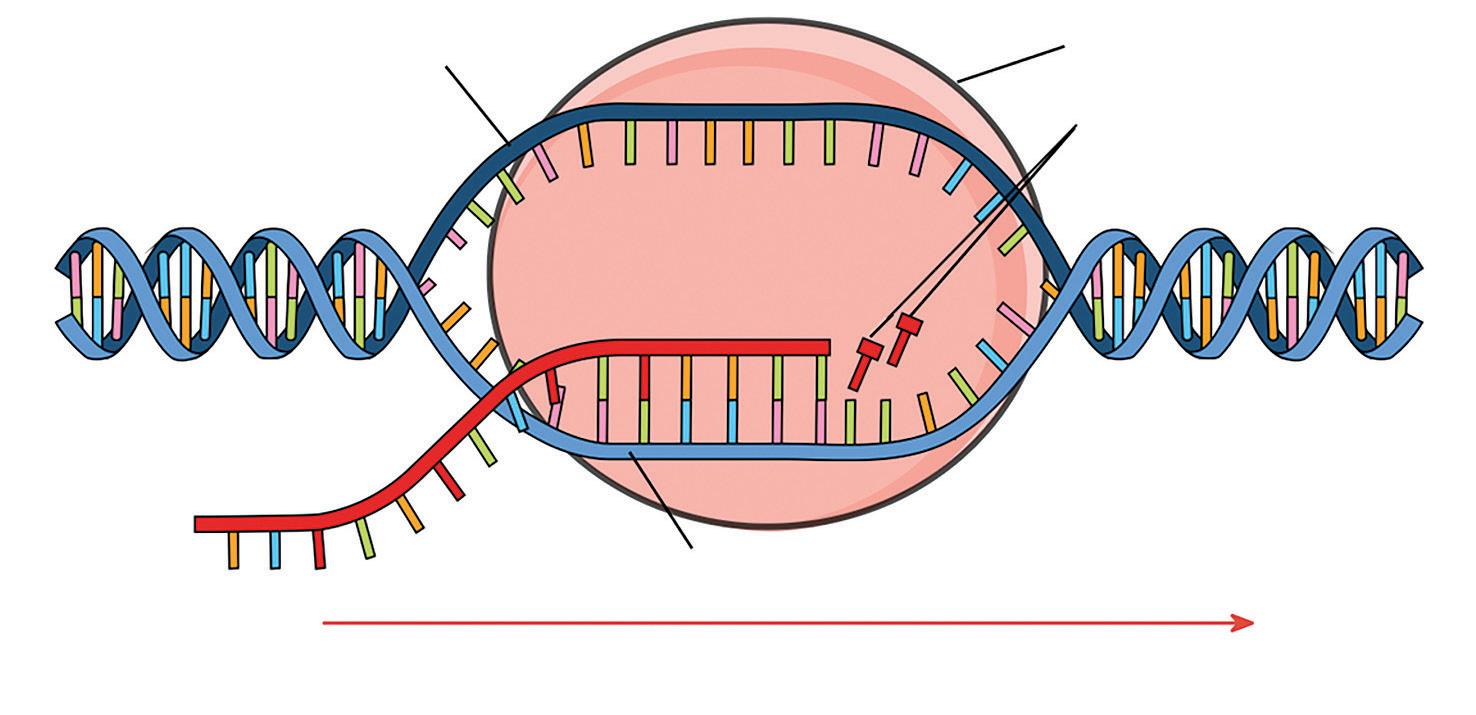
Template strand
Direction of transcription mRNA
Free ribonucleotides added
(i) Where in the eukaryotic cell does transcription take place?
(ii) Name the enzyme, labelled X, that catalyses the formation of mRNA.
(iii) Write the mRNA sequence that would be produced from the double-stranded DNA sequence below.
Template strand: AGGCTGAATCTGAG
Coding strand: TCCGACTTAGACTC
mRNA sequence:
(iv) The diagram shown is an example of a model. Suggest one reason why models are used in biology.
(d) Enzymes are key to controlling metabolic reactions in cells.
(i) What is meant by the term enzyme?
(ii) Give an example of an enzyme-catalysed reaction you have studied. In your response, state the enzyme, the substrate and the product.
Enzyme:
Substrate:
Product:
(iii) Describe the induced fit model of enzyme activity. Include a labelled diagram.
Diagram:
(e) The graph below shows the percentage of children who died before the age of 5 (child mortality) in different continents across the world from 1968 to 2023.
(i) Africa shows the highest child mortality. From the graph, estimate the percentage of children who died before the age of 5 in Africa in 1968 and in 2023.
1968: 2023:
(ii) Describe the overall trend in child mortality shown in the graph for all of the continents.
(iii) Identify one advancement in either prenatal or postnatal care that could have contributed to the observed trend.
Question 2
Answer any five questions from the following questions 2 to 7. Each question carries 50 marks.
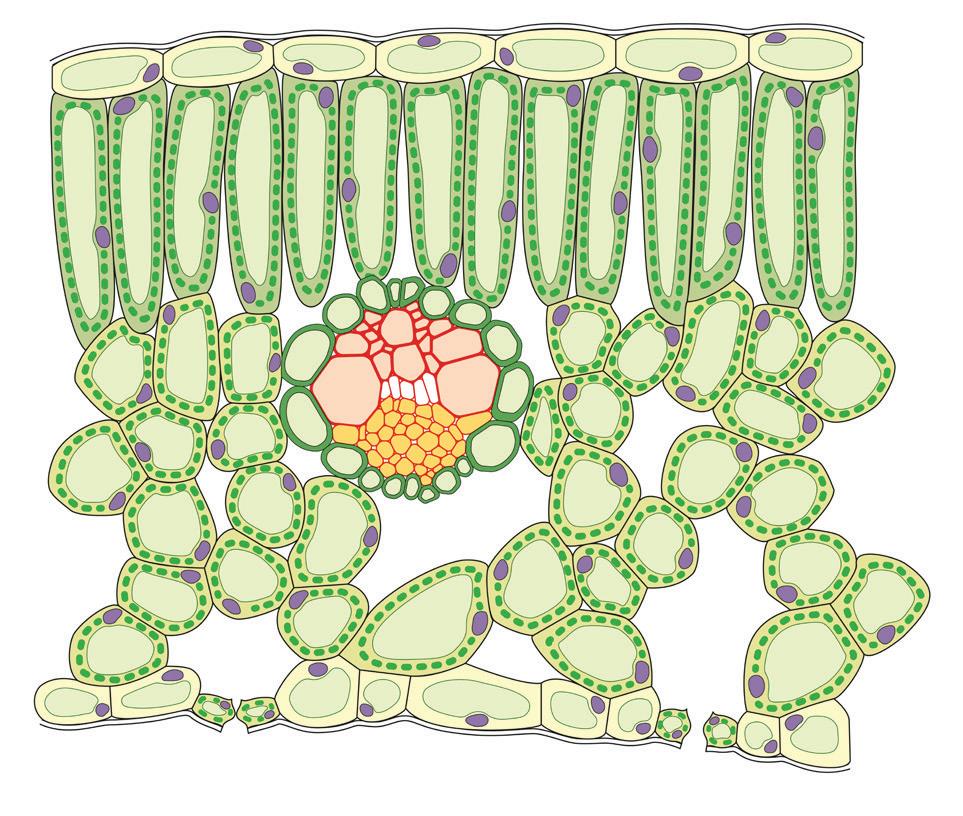
(a) The diagram below shows the internal structure of a leaf of a flowering plant.
50 marks
(i) The vein is labelled in the diagram. Name the specific type of vascular tissue found within the vein that delivers water to the leaf.
(ii) State two ways in which the structure of the tissue type named in (i) is adapted to its function.
(iii) Transpiration is the loss of water vapour from the aerial parts of plants. State two factors that affect the rate of transpiration.
(iv) Describe the steps you took to investigate one factor you named in (iii). You must include the name of the factor and how you measured the rate of transpiration. You may include a labelled diagram.
Diagram:
(b) Stomata are pores in the epidermal layer of the leaf that allow gas exchange.
(i) Name the cells that control the opening and closing of stomata.
(ii) Describe how changes in the concentration of carbon dioxide cause the stomata to open and close at different times of the day.
(iii) Name the structures that enable gas exchange to take place in the stems and fruit of plants.
(c) Carbon dioxide is also a controlling factor in the human breathing system. An increase in carbon dioxide concentration in the blood causes an increase in the breathing rate.
(i) What cellular process produces carbon dioxide in humans?
(ii) Increased carbon dioxide levels could result in a drop in pH in the cells and blood. Explain why removal of this waste product is necessary.
(iii) Carbon dioxide is removed from the bloodstream in the lungs, while oxygen enters the blood. Name the structures at which this gas exchange takes place.
(iv) Describe the process of exhalation. In your response, refer to the atmospheric (or air) pressure.
(d) Carbon dioxide, water and light are needed for photosynthesis. A group of students carried out an experiment to test which colour light resulted in the highest rate of photosynthesis. They used pond weed submerged in a solution of sodium bicarbonate.
The test tubes were covered with different coloured transparent plastic films. One tube was left uncovered, allowing white light, which contains all colours of light, to fall on the pond weed. The rate of photosynthesis was measured by counting the number of bubbles of oxygen gas produced in one minute. Their experimental set up is shown below:
(i) Name the independent variable in this investigation.
(ii) Identify one variable that would have needed to be kept constant to ensure the investigation was a fair test.
(iii) Explain why fair testing is important when carrying out a scientific experiment.
(iv) The students observed that exposure to white light resulted in the most bubbles of oxygen being produced, followed by blue light, then red light. No bubbles were detected from the pondweed exposed to green light. Write a conclusion for this experiment.
Question 3. 50 marks
(a) The graph below represents the nuclear DNA content of a cell at different stages of the cell cycle.
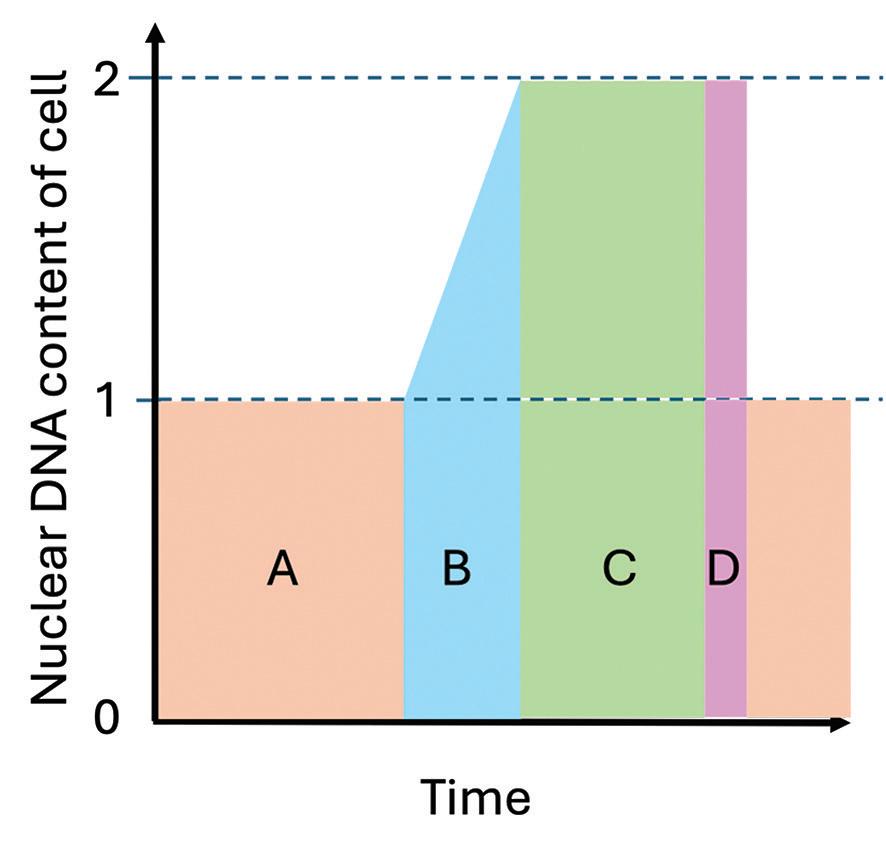
(i) Parts A, B and C all belong to one phase of the cell cycle. Name this phase.
(ii) During section B of the graph, the nuclear DNA content of the cell doubles. Based on your understanding of the cell cycle, what process is occurring during this section?
(iii) Section D of the graph represents nuclear division. There are two types of nuclear division: mitosis and meiosis. Identify which form is represented in section D of the graph. Give a reason for your answer.
(iv) Distinguish between the functions of mitosis and meiosis in multicellular organisms.
(v) Name the process that occurs after nuclear division and which results in division of the cytoplasm.
(b) The process of mitosis, although continuous, may be divided into four phases.
(i) Number the phases 1 to 4 in the correct order that they occur during mitosis:
Anaphase
Metaphase
Prophase
Telophase
(ii) In the space provided, draw a labelled diagram of a cell (where 2n = 4) at anaphase of mitosis.
Diagram:
(iii) Bacteria do not undergo mitosis during cell division. Give a reason for this.
(c) Cancer is a disease that is caused by cells dividing uncontrollably and invading nearby tissues.
(i) Mutations in DNA can result in unregulated mitosis and uncontrolled cell division. What is a mutation?
(ii) Outline how uncontrolled cell division can lead to the development of cancers.
(iii) Explain why early detection of cancer can lead to more successful treatment of the disease.
(iv) Explain why vaccination can be used to prevent certain types of cancer.
(d) The diagram below represents a pedigree showing the inheritance of familial breast cancer. The BRCA1 (BReast CAncer gene 1) normally functions to repair DNA damage. Mutations in this gene can lead to harmful mutations being passed on to new cells. Women who have a BRCA1 gene alteration have a 60–90% lifetime risk of developing breast cancer. For men with BRCA1 mutations, there is a 1 to 5% lifetime risk of developing breast cancer.
Male, unaffectedMale, affected
Female, unaffected Female, affected
BRCA1 Pedigree:
(i) The BRCA1 mutation that causes cancer is dominant over the normal version of the gene. What does dominance mean in terms of genetic inheritance?
(ii) Identify the possible genotypes of individuals P and Q, where B represents the dominant allele and b represents the recessive allele.
(iii) Explain how it is possible for parents R and S to have a child with the disease, despite neither parent having the disease.
Question 4. 50 marks
(a) The diagram shows a molecule of the protein haemoglobin.
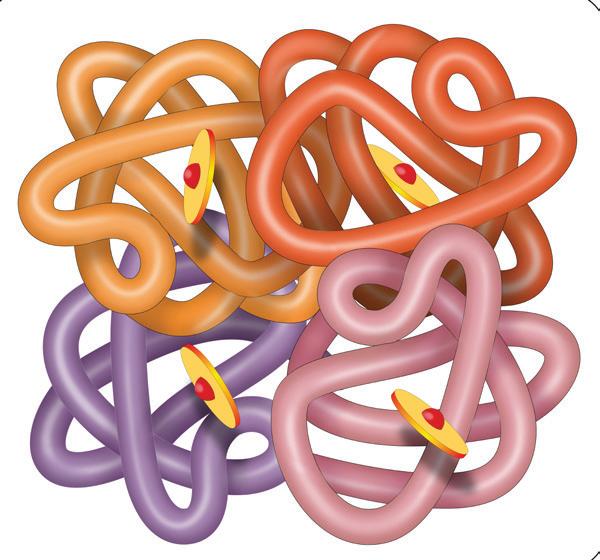
(i) The haemoglobin protein is made up of four polypeptides. What is a polypeptide?
(ii) After being synthesised, the polypeptides are folded in a cellular organelle consisting of a network of membranes. Give the full name of this organelle.
(iii) Each of the four polypeptides has an iron-containing haem group. Iron is a mineral. Give an example of two other minerals and outline their roles in biological processes.
Mineral: Role:
Mineral: Role:
(iv) Haemoglobin is a protein that plays a metabolic role in the body. Give an example of a structural role played by proteins.
(b) Haemoglobin is found in red blood cells.
(i) What is the function of red blood cells?
(ii) Describe two ways in which the structure of a red blood cell is adapted to its function.
(iii) Where in the body are red blood cells produced?
(iv) Red blood cells have a limited life span of around 120 days. Suggest a reason for this.
(c) The graph below represents the percentage of blood donors with each of the four ABO blood types.
(i) Identify the most common ABO blood type of donors.
(ii) Describe how the immune system would respond if a patient was given a transfusion of an incompatible blood type.
(iii) The terms ‘positive’ and ‘negative’ after the ABO blood groups refers to the presence or absence of the Rhesus antigen. Apart from blood transfusions, describe another situation in which it is necessary to know the Rhesus status of an individual.
(d) As part of your studies, you investigated the structure of the heart using primary data.
(i) Describe how you carried out your investigation.
In the space provided below, draw a diagram of the heart and its attached blood vessels.
(ii) Use the words listed below to correctly label parts of the heart: right atrium, left atrium, right ventricle, left ventricle, pulmonary artery, pulmonary vein, vena cava, aorta, cuspid valves, semilunar valves, septum.
(iii) On your diagram, draw arrows to clearly show the direction of blood flow.
Question 5
marks
(a) The levels of calcium in the blood are regulated by a hormone called parathyroid hormone, produced by the parathyroid glands.
When levels of calcium in the blood drop, parathyroid hormone is released. It targets the skeleton, resulting in the release of calcium from bone. It also targets the kidneys and the intestine. In the kidneys it causes reabsorption of calcium into the blood, while in the intestine is increases the absorption of dietary calcium. Once blood calcium levels rise sufficiently, the release of parathyroid hormone is inhibited.
(i) Control of blood calcium concentration is an example of a negative feedback mechanism. Explain what is meant by negative feedback mechanism and state why blood calcium is an example of such a mechanism.
(ii) Negative feedback is important for homeostasis. What is homeostasis?
(iii) Temperature regulation in the body also involves negative feedback mechanisms. Describe two ways the body responds in cold conditions, to maintain body temperature.
(b) Both the endocrine and nervous systems are involved in homeostasis in vertebrates. Specialised cells called neurons are involved in nerve transmission.
(i) Name the parts of the neuron labelled A and B in the diagram below.
A: B:
(ii) State the function of parts A and B labelled in (i)
Function of A:
Function of B:
(iii) Apart from the parathyroid hormone, name one other hormone of the endocrine system. State the gland that produces it and the function of the hormone.
Hormone: Gland: Function:
(iv) Describe one example of hormonal manipulation in either sport, health or agriculture.
(v) Outline one way in which the endocrine and nervous systems differ in how they carry out their functions in response to stimuli.
(c) (i) State two functions of the human skeleton.
(ii) Name the connective tissue that attaches bones and muscles.
(iii) Describe a model you used to demonstrate the function of antagonistic muscle pairs. Relate the components of the model to those of a named antagonistic muscle pair found in humans.
(d) Apart from calcium, the kidneys are responsible for reabsorption of a number of other substances.
(i) Name two other substances reabsorbed by the kidneys.
(ii) Name the parts of the kidney labelled A and B in the diagram.
(iii) Reabsorption occurs to ensure the body does not lose vital substances that have been filtered out of the blood. Identify which part of the kidney, A or B, is the site of filtration.
Question 6
(a) The diagram below represents a cell.
(i) Identify whether this is an animal or plant cell.
(ii) Give a reason for your answer to (i)
(iii) Name the structures labelled A, B and C and give a function of each.
Function
(b) Describe the method you used to view cells of the type shown in (a) under the light microscope. In your response, describe the source of the cells you used, the method of preparation and how you used the microscope.
(i) Source of cells:
(ii) Method of preparation:
(iii) Use of the microscope:
(iv) Identify two components of the cell shown in (a) that would be visible under the light microscope.
(c) The movement of water into and out of cells occurs by osmosis. A group of students carried out an investigation to see the effect of concentration gradient on the rate of osmosis. The experimental set up is shown below, along with a table showing the data the students collected. Five tubes were set up, each with dialysis (Visking) tubing containing a different percentage sucrose. All tubes were left for 30 minutes. The mass of each tube was measured at the beginning and end of the incubation period and the percentage change in mass over that time was calculated.
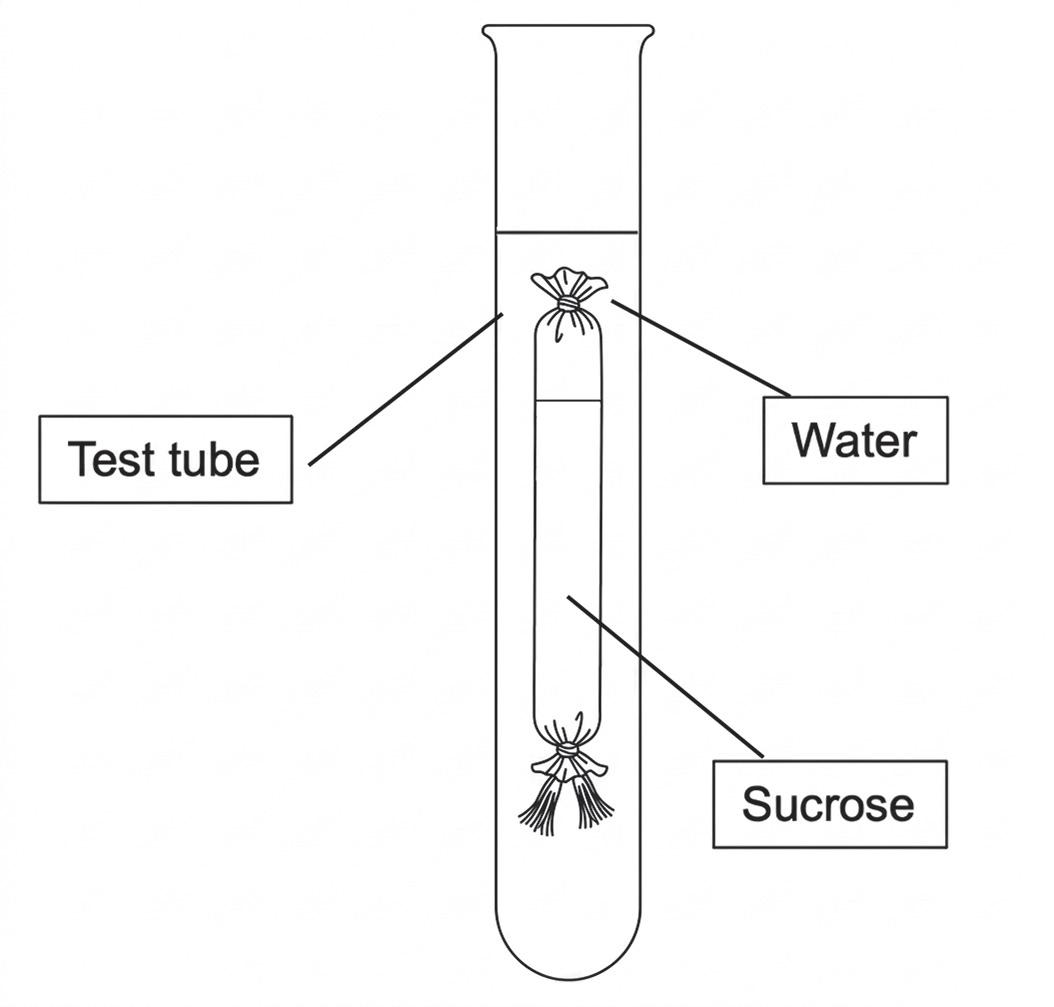
(i) Draw an arrow on the diagram showing the direction of movement of the water.
(ii) On the grid below, plot a suitable graph to represent the data in the table.
(iii) Identify one variable that needed to be kept the same to ensure this was a fair test.
(iv) Write a conclusion based on the data.
(d) In 2025, Japan opened its first osmotic power plant, while Denmark has had a similar plant in operation since 2023. These power plants rely on the movement of water molecules across a semi-permeable membrane to move a turbine, which powers a generator.
(i) From your study of biology, explain why the development of alternative energy sources, such as the one described, are preferable to continued use of fossil fuels.
(ii) Suggest two other biological strategies that can be used to reduce the use of fossil fuels.
Question 7 50 marks
(a) Vitamins can be water soluble or fat soluble.
(i) Name a water-soluble vitamin required by the body.
(ii) For the vitamin you named in (i) describe a source of this vitamin, its role in the body and a condition associated with its deficiency.
Source:
Role: Effect of Deficiency:
(iii) Based on your understanding of vitamin solubility, comment on the usefulness of vitamin supplements if someone is eating a balanced diet.
(b) Vitamin A, a fat-soluble vitamin, is critical for growth, development and a functioning immune response in children. It is also critical for vision, with vitamin A deficiency a leading cause of preventable childhood blindness.
The table below shows data on the percentage of preschool children with vitamin A deficiency in a number of regions.
(i) In the grid below, use the data to draw a suitable graph.
(ii) Based on the data, identify the region you would predict has the highest occurrence of childhood blindness.
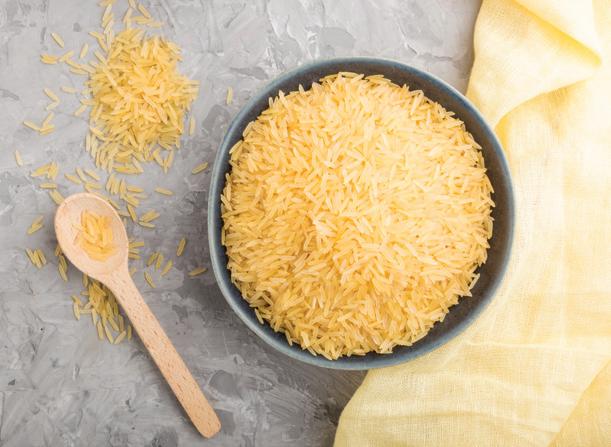
Golden rice is the name given to a number of varieties of rice that have been genetically modified to produce beta carotene. The body converts beta carotene into vitamin A. It was developed in an attempt to address vitamin A deficiency in the developing world, in communities that rely on a diet mostly based on rice. It is named after its bright yellow colour caused by the presence of beta carotene.
(i) Explain why rice crops were modified to express beta carotene.
(ii) Genetic modification uses genetic engineering techniques. What is meant by genetic engineering?
(iii) Outline the steps involved in genetic engineering.
(iv) Describe one positive and one negative ethical or societal impact of genetically modified crops.
Positive: Negative:
(d) (i) Identify a role the liver plays in digestion of food.
(ii) Outline two other functions of the liver apart from its role in digestion.
(iii) Name the blood vessel that connects the small intestine to the liver.
(iv) Give one reason why most nutrients absorbed in the intestine are transported first to the liver before travelling around the body.
Additional writing space. Label all work clearly with the question number and part.
Additional graph paper. Label all work clearly with the question number and part.
Do not write on this page
Copyright notice
This examination paper may contain text or images for which the Examcraft Group is not the copyright owner, and which may have been adapted, for the purpose of assessment, without the authors’ prior consent. Any subsequent use for a purpose other than the intended purpose is not authorised. The Examcraft Group does not accept liability for any infringement of third-party rights arising from unauthorised distribution or use of this examination paper.
Leaving Certificate Examination - Higher Level
Biology
Sample A
2 hours 30 minutes
You can download this paper’s marking scheme by scanning the QR code: