
Property Report
FIRST QUARTER 2026

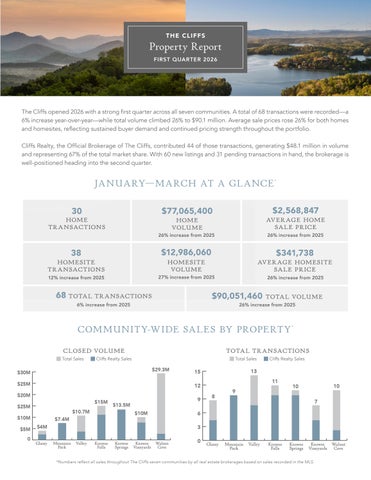
The Cliffs opened 2026 with a strong first quarter across all seven communities. A total of 68 transactions were recorded—a 6% increase year-over-year—while total volume climbed 26% to $90.1 million. Average sale prices rose 26% for both homes and homesites, reflecting sustained buyer demand and continued pricing strength throughout the portfolio.
Cliffs Realty, the Official Brokerage of The Cliffs, contributed 44 of those transactions, generating $48.1 million in volume and representing 67% of the total market share. With 60 new listings and 31 pending transactions in hand, the brokerage is well-positioned heading into the second quarter.
*
JANUARY MARCH AT A GLANCE

30 H OME TRANSACTIONS
38 HO MESITE TRANSACTIONS
TOTAL TRANSACTIONS
$77,065,400 H OME VOLUME
$12,986,060 HOMESITE
$2,568,847 AVERAGE HOME SALE PRICE $341,738 AVERAGE HOMESITE SALE PRICE
$90,051,460 TOTAL VOLUME
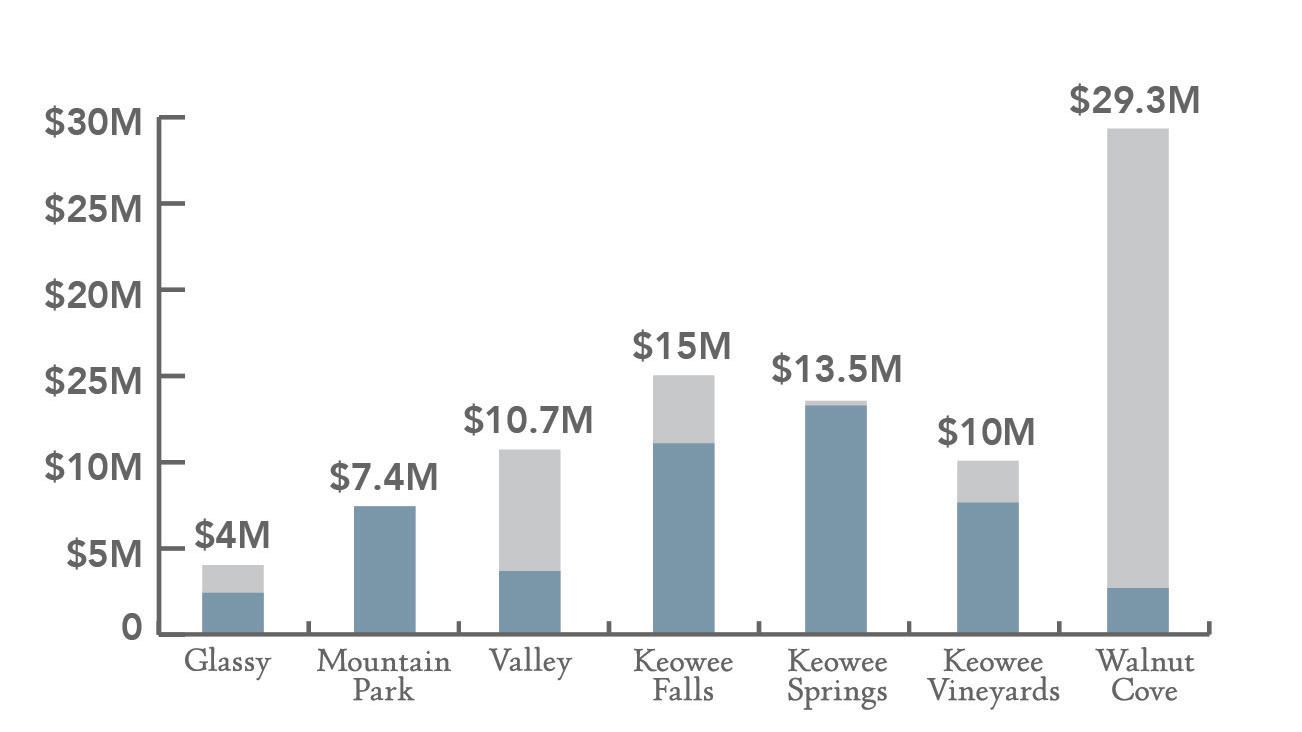
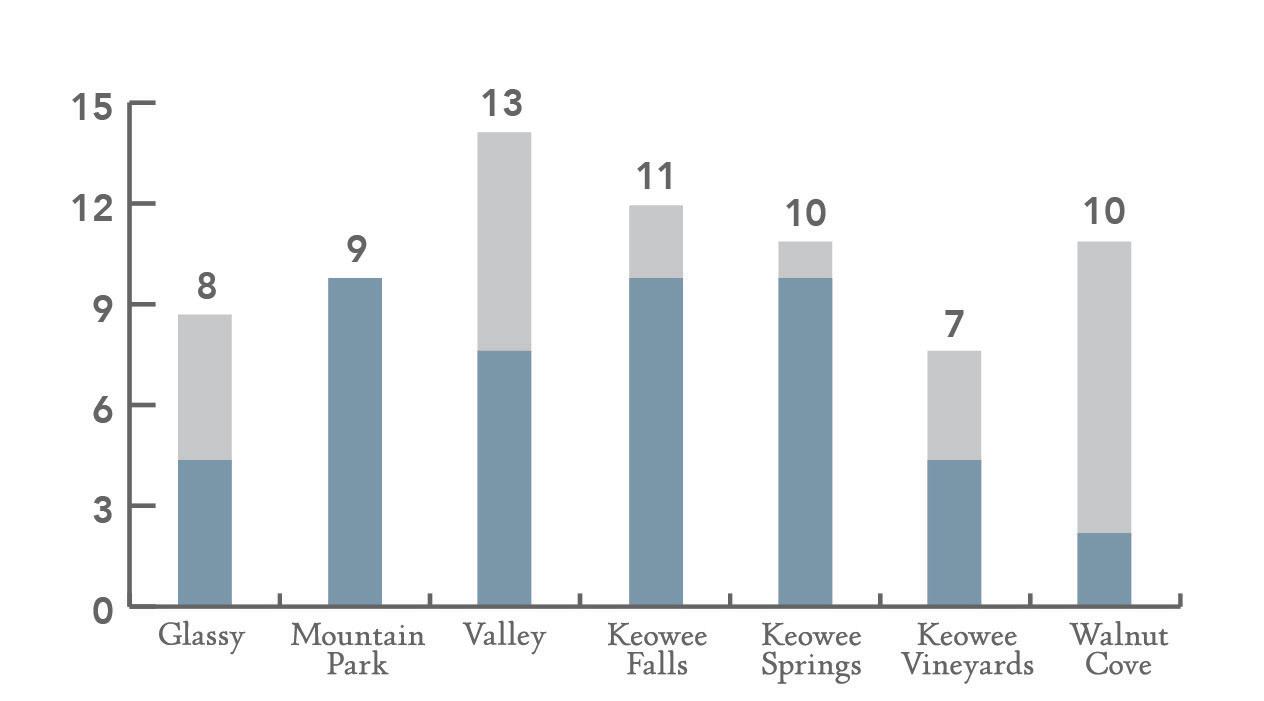
SALES BY PROPERTY
*
NOTE FROM THE DIRECTOR OF SALES
The Upstate of South Carolina and Western North Carolina are having a moment—and it isn’t slowing down. These have become two of the most sought-after destinations in the country, drawing buyers from high-tax states, remote workers no longer tied to a city, and those who simply want a better quality of life. That regional momentum is showing up directly at The Cliffs, and Q1 reflects it.
What the numbers don’t show is the competitive picture. Cliffs Realty outsold every other brokerage at The Cliffs combined this quarter—and that dominance isn’t accidental. Our agents work in these communities, know every street and every nuance, and bring a depth of insight no outside firm can replicate. Whether you’re buying your first property at The Cliffs or considering a sale, who you work with here genuinely matters.
I’d welcome the chance to talk through what this market means for you. Visit any of our four offices or reach out directly— we’re here when you’re ready.
Warm regards,

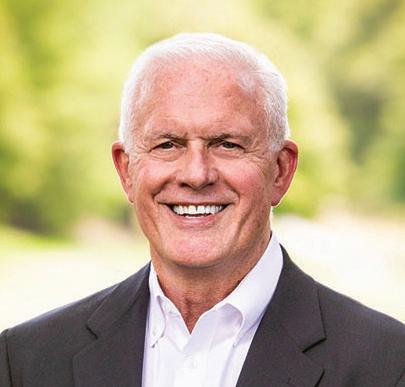
Richard Seay, Director of Sales rseay@cliffsliving.com
44 TOTAL TRANSACTIONS
31 PENDING TRANSACTIONS
JANUARY–MARCH AT A GLANCE
$48,070,300 TOTAL VOLUME
$41,131,400 TOTAL HOME VOLUME
Year-Over-Year
60 NEW LISTINGS
$6,938,900