10 minute read
ACIR Feature report: The Impacts of COVID-19 on the Healthcare System

FEATURE REPORT
The impacts of COVID-19 on the Healthcare System
Advertisement
A review of ACHS Clinical Indicator data
The ongoing COVID-19 pandemic has been caused by the severe acute respiratory syndrome coronavirus 2 (SARS-CoV-2 and variants). The first outbreak was reported in December 2019 in Wuhan in China, however, despite control attempts, it evaded quarantine measures and spread throughout the world. The World Health Organisation (WHO) recognised the epidemic on 31 January 2020 and declared it as a public health emergency of international concern on 11 March 2020, meaning that the outbreak was a pandemic. The first confirmed case of COVID-19 in Australia was identified on 25 January 2020 in Victoria, with a national human biosecurity emergency declared on 20 March 2020. In response, the Australian government introduced strict intervention measures to limit the pandemic spreading, aiming to prevent the devastating growth seen in other COVID-19-affected nations. Each State and Territory announced their own restrictions, which impacted health services across Australasia significantly. These restrictions included periods of cessation of non-urgent elective surgery, redeployment of staff, and re-allocation of healthcare resources to support Australians during the outbreak. As the outbreak progressed, governments, healthcare systems and organisations prepared for the potential major outbreak of COVID-19 through several measures such as:
• Shifting to virtual care where possible;
• Postponement of non-urgent scheduled care;
• Utilisation of private hospital beds for spillover care;
• Increased resourcing of intensive care with creation of new temporary intensive care wards;
• Major purchases of equipment including ventilators;
• Redeployment of staff from usual duties to focus on COVID-19 care, triage and eventually vaccination programs;
• Significantly increased personal protection equipment (PPE) usage.
The first wave of COVID-19 peaked on the 4 April 2020 at 490 hospitalisations Australia-wide, after which followed the second wave which peaked at 694 hospitalisations on the 18 August 2020. These two waves were well prepared for, not overwhelming the health system. It was the third Delta variant wave which caused major issues with the health system in 2021. This wave peaked at 1,551 hospitalisations, 297 patients admitted to the ICU and 177 patients on ventilation due to COVID-19 infection. This third wave significantly impacted the Australian health system. Staff became furloughed with COVID-19 at the same time as demands on hospitals, community practice and vaccination centres were extreme. Australia has relied on healthcare workers from overseas to supplement the workforce: such professionals could not enter Australia during 2020-21.
The impact of COVID-19 is also evident in the Clinical Indicator data as it is both a measure of activity and resource allocation. These impacts are discussed below to highlight how the COVID-19 pandemic has impacted the delivery of quality healthcare and the maintenance of healthcare improvements through resource setbacks based on the available data to date which ends at the start of 2022, when the largest of the waves occurred (January and July peaks).
Data submission
The submission of clinical indicator data is an important measurement of organisational performance and due to the ACHS Clinical Indicator program being patient centred, this impact was heavily felt. This not only impacted the volume of data received during waves of the pandemic but also the ability of many healthcare facilities to submit data, even in the face of greater flexibility around data submission. Due to these demands, ACHS offered one month of extra time thus delaying the reporting, until organisations had enough staffing available to make the submission. This increased flexibility was required for 15% of ACHS member organisations.
Indicators Affected
Anaesthesia & Perioperative Care
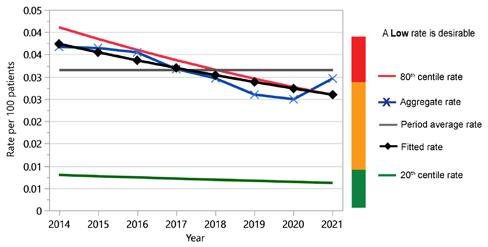
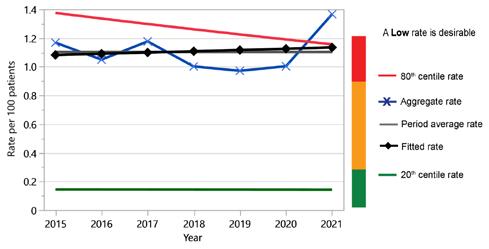
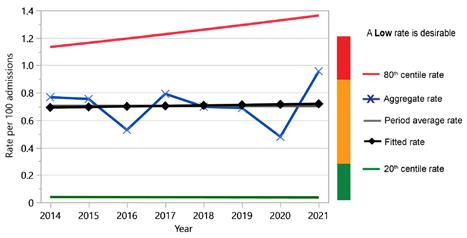
Anaesthesia and Perioperative Care indicators cover the preanaesthesia, intraoperative, post-operative and recovery periods. Of the 13 indicators in this set, two appear to be measurably impacted by COVID-19, with the patient recovery period indicators 3.1 and 3.5 affected (see figures 1 and 2). The indicator 3.1 measures the relief of respiratory distress in the recovery period, while indicator 3.5 measures the unplanned stay in the recovery room longer than 2 hours.
The relief of respiratory distress may be due to COVID-19 affected patients requiring increased oxygen post anaesthesia due to the impact of the virus on their lung function and the differences in airway management at this time. The change between 2020 and 2021 was subtle with a difference of 5 per 100,000 patients, with over 1.2 million patient episodes examined.
With regard to unplanned stay in the recovery room, the rate increased from 1.0% to 1.37%, which is approximately a 73% increase during the third COVID wave, thought likely due to bed management issues caused by finding a suitable bed to discharge from the recovery room.
Figure 1: CI 3.1 Relief of respiratory distress in the recovery period (L)

Figure 2: CI 3.5 Unplanned stay in the recovery room longer than 2 hours (L)
Day Patient
Of the Day Patient set, the measure affected by COVID was indicator 2.1 Booked patients who fail to arrive. For this indicator, the impacts may have been due to COVID-19 infections, and the government lock downs. There were substantial increases in 2019 and 2020, which resolved by the end of 2021, when the lockdowns were progressively lifted due to the success of the vaccination program. The data shows that there was a two-year deterioration of approximately 70% which recovered in 2021 to the long-term forecast level (see Figure 3). Due to the poor performance in 2019 it is difficult to determine if this transient poor performance was linked to COVID-19 in 2020 or to a few organisations which were poor performers not able to report indicator data in 2021.
Figure 3: CI 2.1 Booked patients who fail to arrive (L)

Intensive Care
The Intensive Care set has three indicators which appear to be affected by resourcing issues surrounding COVID-19: indicator 1.1 Adult non-admissions to ICU due to inadequate resources, indicator 1.2 Elective adult surgical cases deferred or cancelled due to unavailability of bed, and indicator 1.3 Adult transfer to another facility / ICU due to unavailability of bed.
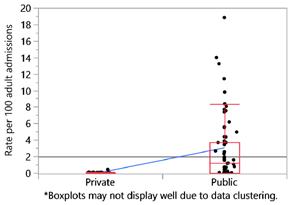
Non-admission of adults to ICU due to inadequate resources was trending downward from 2017 with a sharp change in 2021 of 48% on 2020 data (Figure 4). While there was a spike in ICU admissions in 2020, there was a significant effort at the time to reinforce ICUs with resources, so non-admission was proportionately less. While the third wave at the end of 2021 was three times larger, even with the same extra ICU resources, this data demonstrates deterioration in access due to inadequate resources. As expected, this was overwhelmingly felt by the public system rather than the private system, as evidenced in the stratification of CI 1.1 by public/private measures (Figure 5).
Figure 4: CI 1.1 ICU - Adult non-admission due to inadequate resources (L)
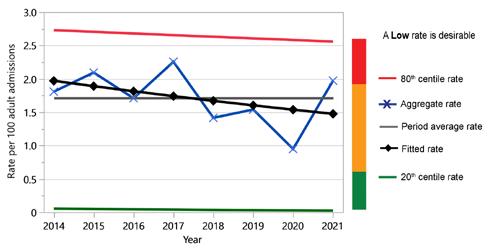
Figure 5: Breakdown of public/private healthcare organisations submitting 2021 data for Intensive Care CI 1.1
Bed availability and transfers are captured by indicators 1.2 (Figure 6) and 1.3 (Figure 7). These two figures represent deterioration in 2021 from relatively stable measures across prior years. The deterioration of elective adult surgical cases deferred or cancelled due to unavailability of beds rose approximately 40% in 2021 compared to 2020. Adults in ICU transferred to another facility due to bed unavailability increased by 50% in the same period.
Figure 6: CI 1.2 ICU - elective adult surgical cases deferred or cancelled due to unavailability of bed (L)
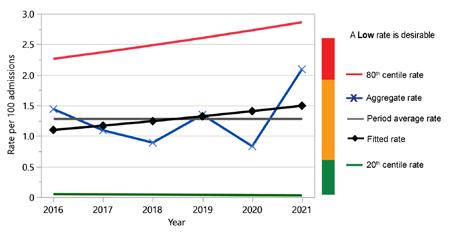
Figure 7: CI 1.3 ICU - adult transfer to another facility / ICU due to unavailability of bed (L)
Emergency
Some of the ACHS Emergency indicators measure the Australasian Triage Scale (ATS). This scale is broken down into 5 indicators based on maximum waiting time for medical assessment and treatment. The most critical measures ATS 1 and 2 were not affected by COVID-19, with the most critically ill patients not having any change to the standard of care they received throughout the measured period. There was a spike in the 2020 data for ATS categories 3, 4 and 5, which showed a small improvement of approximately 5 per 100 patients. These three categories deteriorated in 2021, back to historical levels. This change is thought to result from the COVID response, meaning Emergency Departments received a boost in resources, which then reduced during 2021. This is matched in the admissions data which showed that admissions during the 2019-20 COVID-19 period declined 2.8% which then climbed back to the 3% historical increase in the 2020-21 (AIHW).7 During 2021, with the efforts towards vaccination, ED presentations with COVID-19 disease began to improve, lockdowns started to lift, and Australian society slowly resumed along normal lines.
Staff immunisation
There has been a large increase in the reporting of staff immunisation (Infection Control indicators 5.1 to 5.5) since the start of the pandemic in 2019. There has been an approximately 70% increase in the reporting of staff immunisations amongst healthcare organisations. However, this increased reporting has seen the compliance numbers overall actually drop across the following: Influenza, Hepatitis B, Measles, Mumps, Rubella, Pertussis and Varicella. This increase in reporting is likely due to organisations having an increased focus on recording the COVID vaccination status of their employees, which led to increased reporting of employees’ overall vaccination status.
Pathology
ACHS implemented a new measure during the update of the Pathology indicators in 2020 with their release in 2021 for data collection. The new measure (Pathology indicator 4.3 - COVID-19 testing - PCR result in hospitalised patients from receipt in testing laboratory to reporting <24 hours) specifically measured the time between receipt of the sample for testing and reporting of the result. This measure aimed to ensure that laboratories were providing results to patients and clinicians in a less than 24 hours timeframe using the gold standard PCR test. The results from only 6 months of reporting in 2021 show that they have achieved a rate of 96.6%.
Conclusion
The ACHS indicator set data is a retrospective dataset and as such has not collected all the data to date for the current Omicron wave of COVID-19, which is both the largest wave in terms of hospitalisations, ICU admissions and total infections. Due to this, it will be interesting to see the impact of that wave in the next edition of the Australasian Clinical Indicator Report, in contrast to the government policy changes which occurred earlier in the pandemic such as lockdowns, vaccination programs, closure of elective surgery and targeted resourcing. The Clinical Indicator program run by ACHS provides a view of some of the impacts to a wide range of clinical areas within the Australian healthcare system related to metrics and data collection, but it does tell a story of impact and the challenges faced by the Healthcare system over this time.
REFERENCES
1. Wang C, Horby PW, Hayden F et al. A novel coronavirus outbreak of global health concern. Lancet 2020; 395(10223): 470-473.
2. World Health Organisation (WHO). Report of the WHO-China Joint Mission on Coronavirus Disease 2019 (COVID-19). WHO, Switzerland; 2020.
3. World Health Organisation (WHO). WHO Director-General's opening remarks at the media briefing on COVID-19. 11 March 2020.
4. Chang SL, Harding N, Zachreson C et al. Modelling transmission and control of the COVID-19 pandemic in Australia. Nature Communications 2020; 11(1): 1-3.
5. Sutherland K, Chessman J, Zhao J et al. Impact of COVID-19 on healthcare activity in NSW, Australia. Public Health Research and Practice 2020; 30(4): e3042030.
6. Capon A, Sheppeard V, Gonzalez N et al. Bondi and beyond. Lessons from three waves of COVID-19 from 2020. Public Health Research and Practice 2021; 31(3): 1-9.
