6 minute read
Growth curves and the changing climate


“Have your growth curves changed? If they have, then is this compromising efficiency and profit potential?
A key driver of profit in a grass and forage-based dairy system is the cost of production. Reduce this and it should help drive profit. Relationships supporting this are maximising grass as a percentage of the diet (David Beca – GrassRoots Issue 4) and increasing grass utilisation per hectare (as seen by Teagasc work in Ireland – https://www. teagasc.ie/crops/grassland/grass10).
The reason for this is, the more grazed grass a cow eats, the more you save on purchased feed, forage costs, power and machinery plus labour. Additionally, she spreads her own manure, so saving on labour, power and machinery. These savings really ramp up if over 50% of her diet is grazed grass.
The standard grass growth curve we’ve worked with historically supports a profitable spring and autumn grassbased system when we have the correct stocking rate for our individual farm growth curve.
If you manage your average cover well through the season, then a spring calving demand of 40-50kg DM/ha/ day and an autumn calving demand of 50-60 kg DM/ha/day suits most farm circumstances and the historic growth curves have matched demand.
But what if growth curves are changing?
Most of the country, with exception of Scotland and Northern England, has just come through 2022 with another severe drought similar to that experienced in 2018. At the end of 2018, many who were old enough likened it to 1976, and thought “Well that was 40 years ago and so we shouldn’t have another of those in my working life”, but then 2022 came along.
Now we must consider that the historical growth curve is an average line and averages can hide a multitude of sins in the range.
You may be thinking I’m adding 1 and 1 and making 11 here, but high autumn growth drove high average covers from a very mild and ‘growy’ autumn in 2022, with growth rates all around my area of Southern England 20-30kg DM/ha/ day by the end of November where traditionally those growth rates would be 0-10kg DM/ha/day. This got me thinking, are our growth curves changing?
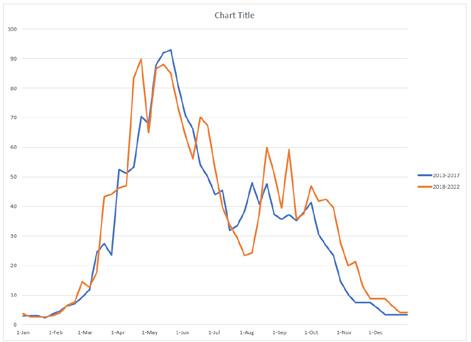
The following are two examples, the first from Lydney Park in Gloucestershire.
The graph shows the last five-year average growth in red, and the previous 14 years in blue. Both follow each other until early June, when the red line is well below the blue, until mid-September. Historically Lydney Park has had good growth through the autumn, but certainly the red line is above the blue in early autumn.
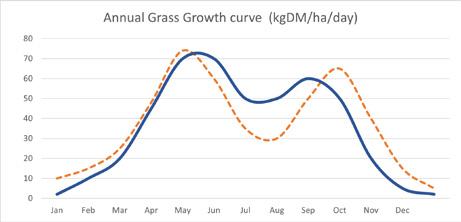
I’ve looked at a number of businesses’ average growth curves for the past five years compared to the previous five, and the following graphic is generally what I’ve seen. The full line is traditional, the dotted line the past five years. Again, beware of averages as they can hide a lot.
This shows a deeper drop in summer, but higher growth from early September all through the autumn.
Am I saying all your growth curves are radically different? No, but I am saying it may be worth you considering that the dotted line could be the new normal as climate change looks here to stay.
What are the potential consequences of this change?
When we have strong autumn growth and very high covers, spring utilisation will suffer especially in a wet spring, because very heavy covers shade the base and slows regrowth, potentially causing a feed shortage approaching balance day.
Do we need a second balance day approach in early autumn where we drive average cover low to take account of autumn/winter growth? This could be the case in autumn calving situations where demand is low in early September and achieved by taking silage cuts. Instead of raising covers in the spring calving herds in August, as traditionally done, should we leave this until September? Or do we devise ways to graze longer into the autumn with autumn and spring calvers.
I hear two cries now - one being what about getting autumn cows in calf? Well, I know of autumn herds who graze certainly for the first three weeks of service with no detrimental effects on fertility. The key here is consistency. If it’s an awful day the cows still go out, but not for so long.
For example, on a wet day for two hours and on dry days end of milking to lunch time. This will be in the region of 5-6kg DM grass per cow. This is 5kg DM less silage needed, and grazing is higher quality with grass at 20%-30% crude protein. Autumn herds feeding maize in the diet can feed lower protein concentrate. The second almost deafening cry I hear is “My ground is too wet they’ll trash the paddocks”. The answer to this is that it won’t work for all businesses, but it will for more than you would think. How do I justify my comment?
Firstly, track and gate infrastructure and lateral thinking of how you use them. Second, as seen this last autumn after a dry summer, land that’s heavy and non-grazeable once wet (I do concede some farms are like this). Due to such dry conditions in the summer, this land has not filled up with water yet as I write in mid-December, and as such is travelable!
One member of a group from the Blackmore Vale in Dorset at a meeting in November mentioned that where he would struggle to get cows on normally, he could now drive over with his Land Rover.
Historically, the end of November target for average cover has been 2100/2200kg DM/ha, however if these very mild autumns are now the new normal, maybe we need to review this. My reason for saying this is that when we have mild winters and daily grass growth is an average of say 5kg DM; there are 60 days from the end of November to 1 February, which means around 300kg DM growth is added to closing covers.
In a wet spring, there is the potential for very poor utilisation, plus knock on effects into the second round, and then we’re coming up to mating for spring calvers.
Perhaps the last round should be shorter to give a flatter wedge so that the top covers are not beyond 3000kg DM, which could be very difficult to utilise in a wet spring.
Taking another look at the following graphic, it seems sometime in mid-June growth drops more quickly and deeper (see point B) so look at soil moisture, grass growth, weather and growth potential. Make decisions; do you need to feed supplement? Then perhaps go early with a little, then it’s easy to increase if needed, or pull out if it rains, small early actions keep grass ahead of cows longer.
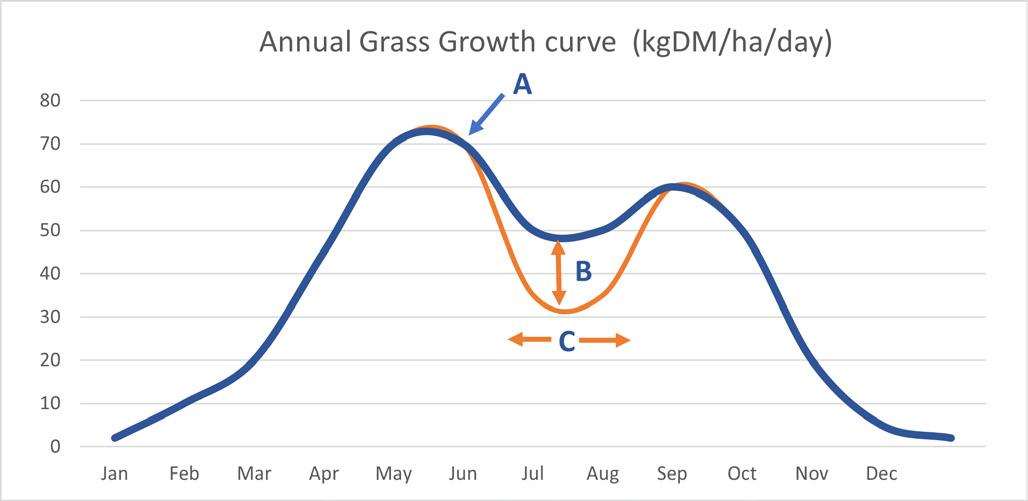
If grass production and growth drops, then the stocking rate needs reviewing unless we can do something about it. Can we arrest this drop in growth (A) above, and shorten (C) the time period so we’re supplementing for less time?
Point (B) is when we should be assessing our position. Has it been dry, what’s my average cover like, what’s the forecast like, is it forecast to be dry and hot? If so, act early and feed the wedge. Start supplementing early to maintain average cover. Those that went early with supplements did come out of the dry better in feed availability and cow body condition.
Options to arrest the drop
Introduce supplements early – feed the wedge, as some did successfully this year Reseeds do have better persistency in the dry
Slow the round, early graze at full third leaf
Review grass species mix, cocksfoot has deeper roots and grows at lower temperatures and is dry tolerant. Festuloliums which are a cross between fescue and ryegrass also have higher tolerance to the dry
Plenty of work coming out of Ireland on grass clover swards
6-8 species – PRG, cocksfoot/Timothy, white clover, red clover, chicory & plantain, see Teagasc 2018 Johnstown work
Six-species sward – 12.5t DM/ha.
Ryegrass 300kg of N – 11.2t DM/ha. Ryegrass 150kg of N – 9.4t DM/ha.
Stocking rate may need to be reviewed, which doesn’t mean a definite change, but a review on the risk and circumstances.
Does this matter? Yes, I think this potential change matters a lot. When growth is below demand we must feed, be that a little concentrate in a small deficit, or concentrate, silage and palm kernel in big deficits for example. This reduces grass in the diet and raises costs because of purchased feed, power and machinery and labour.
Raising costs will have a negative impact on your profit, remember the relationship between cost of production and profit mentioned at the beginning. But to add to this work, from AHDB’s Milkbench, when you add 1p/litre to your cost of feed this impacts the total cost of production by 1.3 to 1.6p/litre. This has also been seen in work around the world.
Due to the war in Ukraine, and bounce back post Covid, input costs are high and the milk price is potentially under pressure. We need to make sure we don’t get caught in a situation that’s hard to get out of. Pasture deficits are expensive, so it may be worth taking a look at how your last five year average growth looks when compared to your demand.
Grass utilisation and lowering cost of production drives profit, so matching demand to growth is key.
I don’t have hundreds of farms data to back up my view, so there’s a note of caution and how you read this will depend on your view on risk. But I do suggest you take a good look, and see if this discussion is applicable to you.


