13 minute read
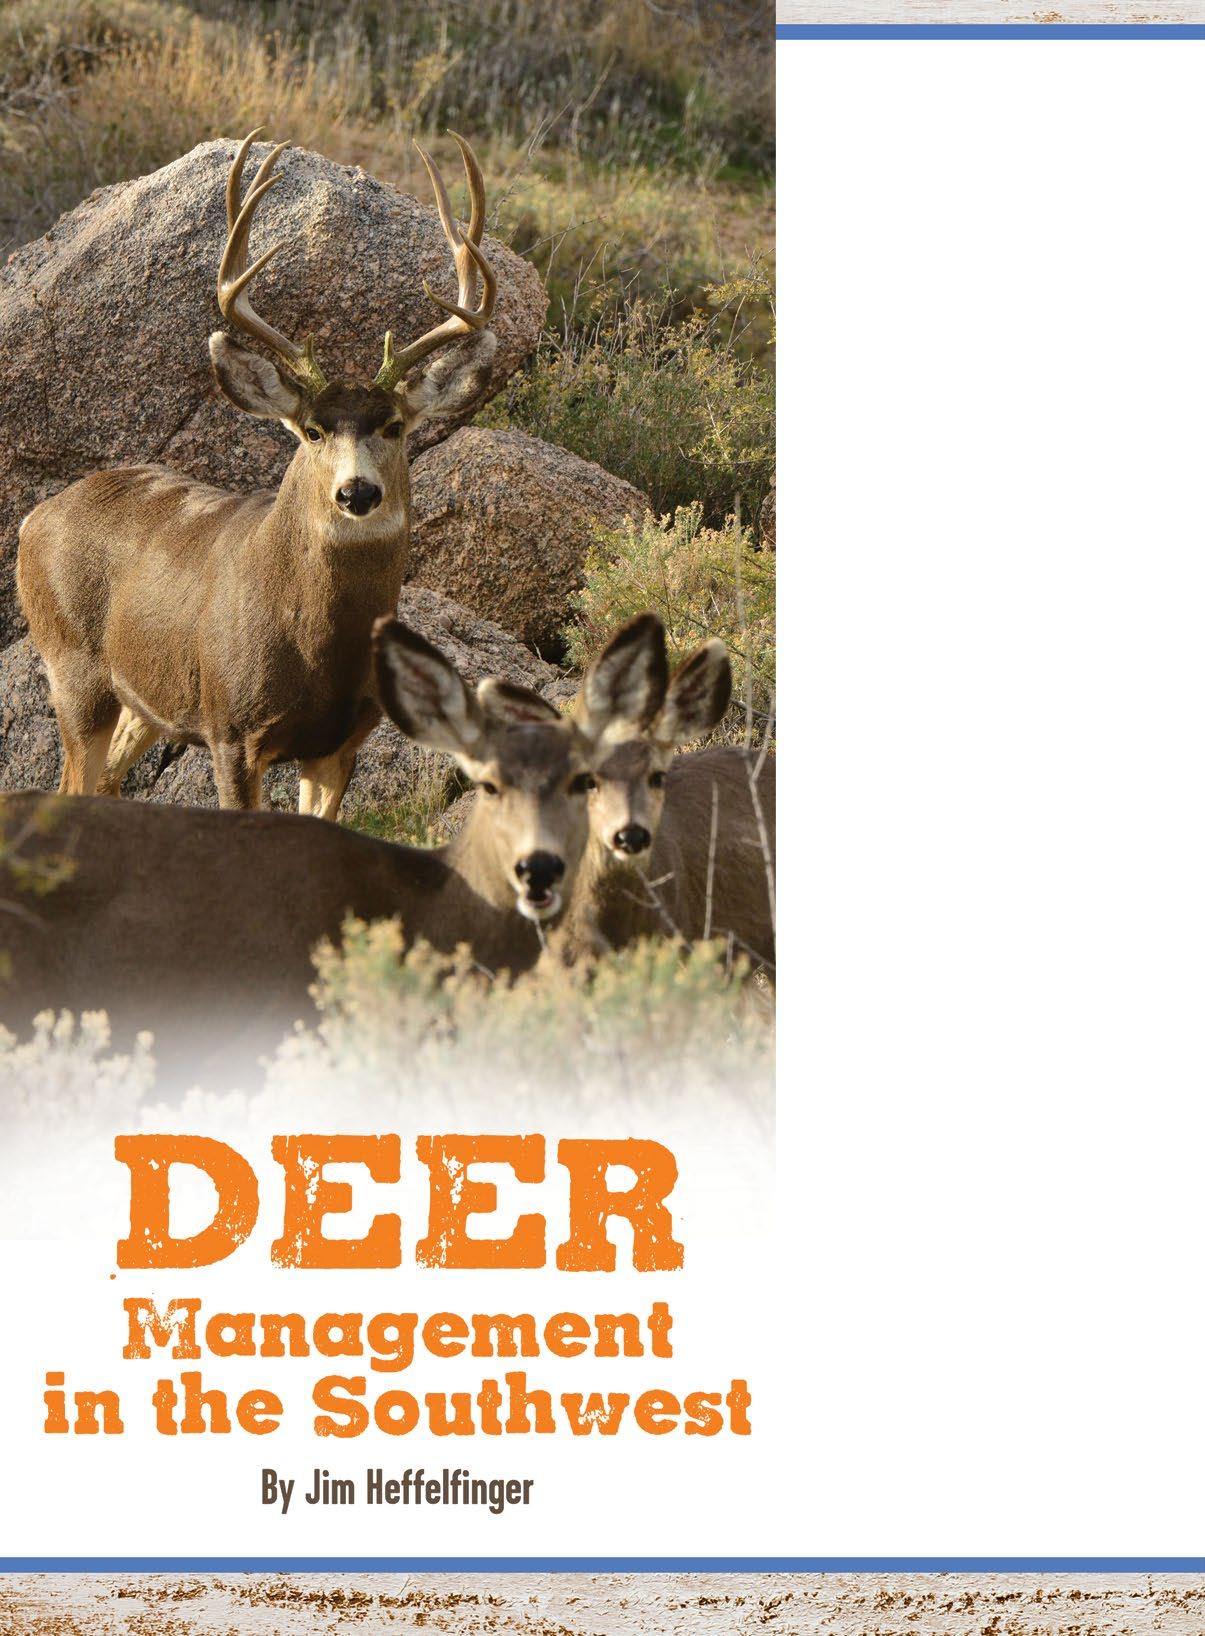
Deer Management in the Southwest


Buck-to-doe ratios are collected more accurately after the hunting seasons and during the rut because bucks and does are together at that time.
Managing deer in the Southwest differs from other parts of North America in several important ways. Terrain, topography, and vegetation require different ways to survey deer populations and collect harvest data. Surveys can usually be conducted from the air because of the open, less vegetated habitat they occupy. Indeed, this method is preferred over much of the area dominated by rough, rugged terrain with few roads. Because of sparse human populations and long hunting seasons, check stations are normally not feasible and so harvest information generally comes from post-hunt questionnaires.
Proper management of deer populations requires decisions based on specific information collected in a consistent way and not by sporadic observations and general assumptions. Although all information should be considered in management decisions, it is sometimes tempting to place too much emphasis on anecdotal information, like what we saw on our last hunt. Only through a standardized and scientifically designed data collection program can deer managers accumulate useful information.
The basic biology of deer is the same throughout their range, but there are differences in management brought about by the diverse habitats deer occupy. Likewise, whitetail management differs in some ways from mule deer because of basic ecological and behavioral differences in the species and because they usually live in different environments. Regardless, deer population management everywhere has three basic foundations that underlie all successful programs: survey data, harvest data, and supporting information.
Survey data is foundational because without some direct measure of a few basic population parameters, it is hard to know what is happening out there. Helicopter surveys offer the best solution in open country but are expensive. Deer surveys from the ground can be useful, but only if they are done in a standardized way so you know the changes you observe are variations in the population and not in the methodology. The basic information collected on most population surveys is some measure of the trend in deer abundance or density, estimates of sex (bucks to does) and age (fawns to does) ratios, and sometimes an index to age structure (percent spikes).
Harvest information is valuable in tracking population performance and is probably the easiest to obtain. All that needs to be done is to set up a standardized list of information collected from every animal harvested. Harvest data might be trends in the number of deer harvested, age structure of harvested deer, body weights, antler measurements, or percentage of hunters who were successful. Supportive information can also help supplement survey and harvest data and may be a trend in habitat condition, roadkill trends, or trail cameras.
Although all state agencies in the Southwest base their management on some form of survey and harvest data, there are differences in how they actually collect those data and make hunt recommendations. Some of these differences are justified by ecological variations from one area to another or budgetary constraints in some states. In other cases, differences in methodology simply Tracking the trends of consistently gathered survey data provides for a solid basis to make management decisions and chart progress towards goals. evolved along parallel paths separated by nothing but a state line. Let's take a closer look at how deer management differs among the southwestern states. Texas
With more than 97% of Texas in private ownership, there are some differences in how deer are managed compared to states with large amounts of public land. Traditionally, deer management has occurred by county because of the historic control each county had in wildlife management. Management data are still collected and summarized by county, but a more refined approach for mule deer includes “mule deer monitoring units” that vary in mule deer density. Each county has a game warden responsible for law enforcement, but district biologists may have responsibilities of up to five counties.
The survey method of choice for whitetails is by helicopter in the thick South Texas brush, where they have a long history of perfecting the methodology there. In the Trans-Pecos and Panhandle areas of Texas, mule deer have been surveyed since the 1970s by fixed-wing aircraft and ground surveys, primarily spotlight counts. Desert mule deer populations in the Trans-Pecos hit an all-time high in the mid-1980s, but then declined starting with the serious droughts in the late 1980s. Since about 2001, populations have increased and are now at least stabilizing. In 2005, Texas Parks and Wildlife Department switched to use helicopters to survey mule deer on long survey lines flown with observers tallying deer seen on both sides of the helicopter. Using the length of the survey line and the width of observation allows biologists to calculate the area surveyed and estimate the number of deer per square mile by county and deer management compartment. These raw densities are underestimates because only 25-75% of the deer are seen. However, a sightability model is Harvest data from hunters is an extremely important source of management information. used to correct for the underestimates based upon past research. Using these standardized methods has reduced variation in survey data and provided a better measure of long-term trends and herd composition (buck to doe and fawn to doe ratios), but it yields less information for individual ranches. A statewide big game harvest survey is mailed out after the hunting seasons to a random selection of 100,000 licensed hunters in Texas. Also, 25,000 randomly selected hunters are emailed a link to the online version of the survey. This survey allows biologists to estimate the harvest information to help them in making management decisions. The information collected by county and deer management/monitoring units include number of hunters, harvest laRisa haRding photo (buck and doe), hunter-days, hunter suc-
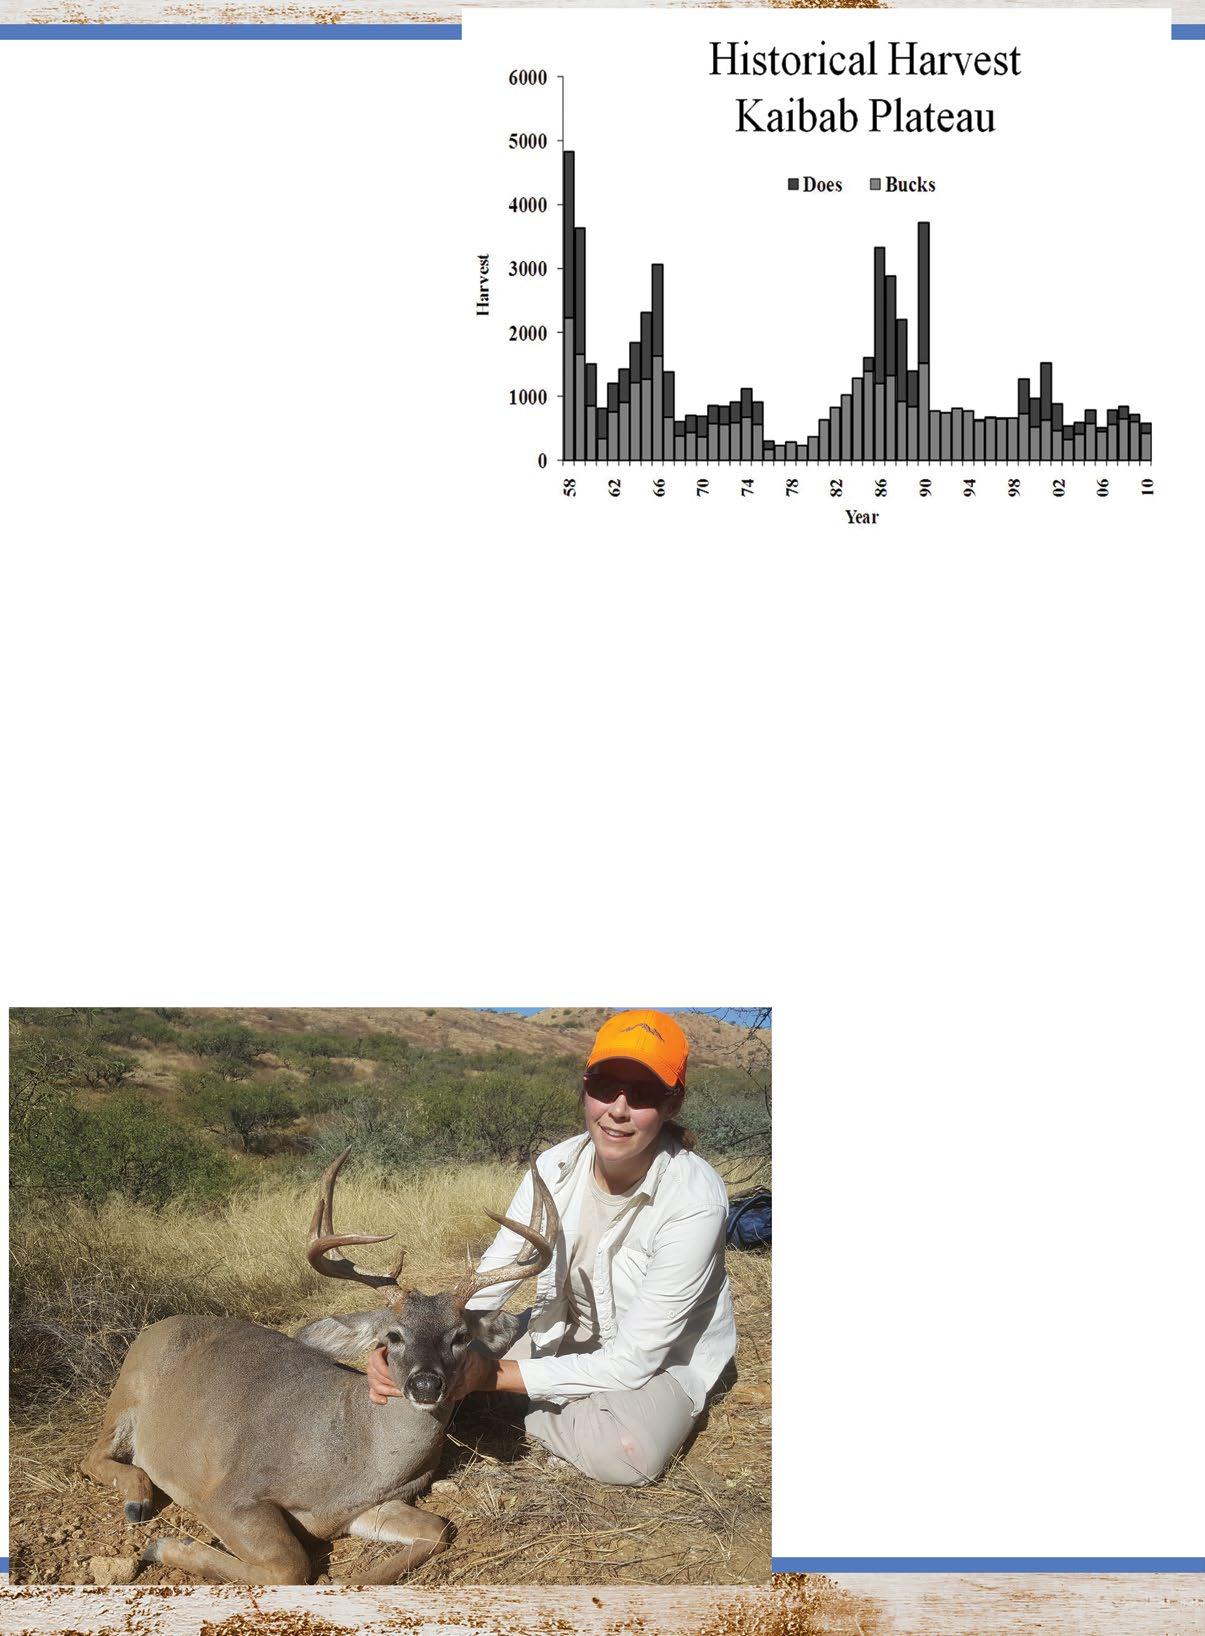
cess, number of deer harvested per hunter, hunter densities, and number of deer harvested per 1,000 acres.
In addition to the harvest data provided by hunters, biological data are collected by biologists in the field, at meat lockers, check stations, and in hunting camps statewide to sample deer harvested in each management/monitoring unit. Data such as age, number of antler points, inside antler spread, antler base circumference, ranch name, and county of harvest are recorded from all deer handled. The percent of the harvest comprised of yearlings, the proportion of deer older than 3 years, or average age are all useful measures of the age structure of the deer population. By tracking antler growth and body weight annually, biologists not only monitor herd health, but can also obtain information about antler development which is of interest to everyone. These data have also been instrumental in the development of antler restrictions in both white-tailed deer and mule deer.
Deer hunting in Texas is not limited by a lottery-style draw. As such, the harvest structures and seasons are fairly broadly set by TPWD and not altered much on an annual basis. With the predominance of private land, landowners can control access and permission to use their property to be more restrictive than what is allowed legally by the state. Many landowners have specific herd goals and objectives and work with the local biologist to develop strategies to accomplish those goals.
District biologists enter their survey and harvest data into a database that the white-tailed deer or mule deer program leader accesses for review, data analysis, and assimilation into reports. These data are used to evaluate the impacts of regulations and management actions on deer and are also used to formulate regulation change proposals. Any regulation change proposal would go through the nine-member commission for approval. Arizona
New Mexico
Deer management in New Mexico is based on 59 big game management units, some of which are divided into sub-units for specific management purposes. Surveys focus on collecting information to monitor abundance and important ratios of deer populations. Some survey data are collected from ground surveys in some areas, but given the limited road system across the landscape, the vast majority comes from helicopter surveys conducted in December and January to obtain post-hunt buck to doe and fawn to doe ratios. Not every unit is surveyed every year, about 20-25% of the units are flown on a rotation and biologists assume these represent other similar units that are not flown that year.
All big game license holders are required to fill out online harvest reports. If hunters do not submit a harvest report by the deadline, they are unable to apply for big game tags for the following hunting season. Similar to other states, New Mexico asks questions that allow the estimation of harvest, number of hunters, number of hunter-days, hunt success, hunter satisfaction, and harvest rates by weapon type. This information is used to assess whether the tag allocation is appropriate for the game management units. There are no hunter check stations in use for collecting biological data directly from harvested deer, except for those established to collect samples for testing for Chronic Wasting Disease.
Statewide species biologists and the big game program manager work with the four regional biologists to develop hunt recommendations for each unit. Once initial recommendations are developed, the public is invited to provide input through a series of public meetings, emails, the Department website, individual group meetings, and at commission meetings. Biologists then revise the hunt recommendations based on biological sustainability and public preferences. Final recommended changes are submitted to the State Game Commission for review and approval and then remain in place for a four-year cycle.
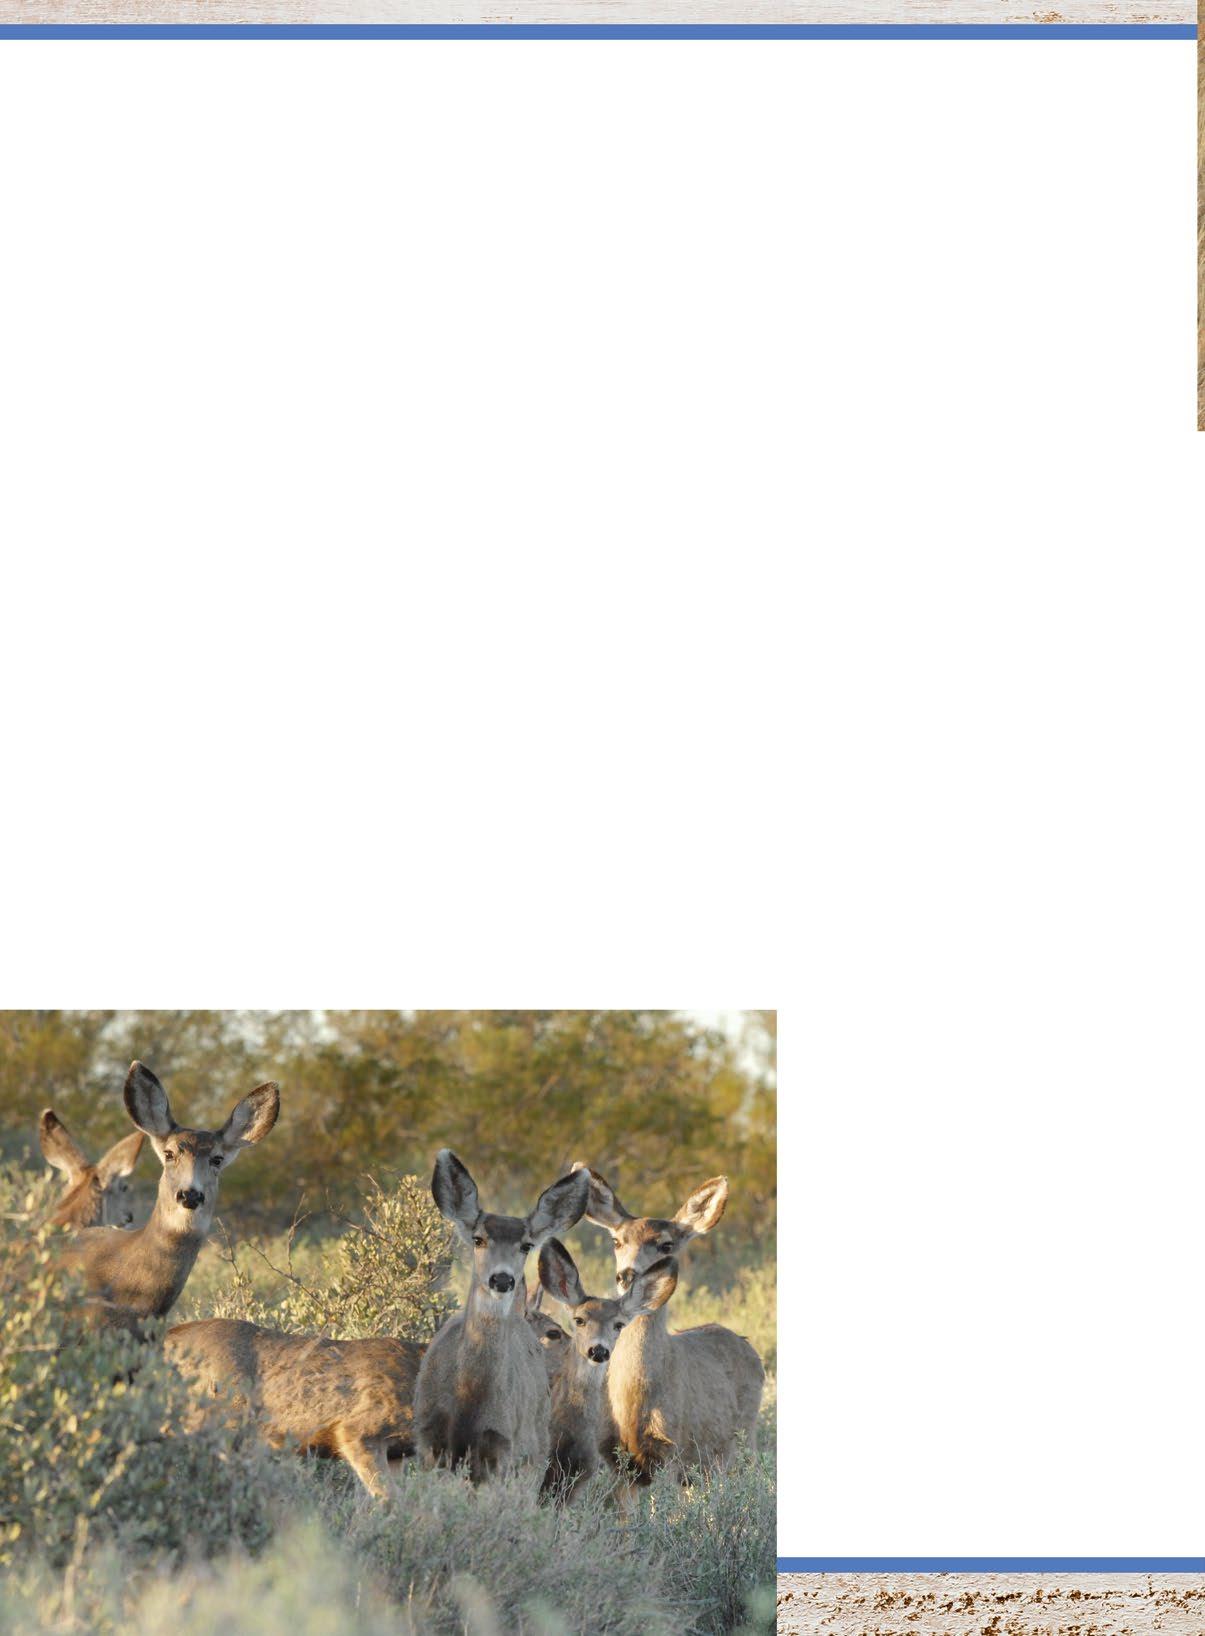
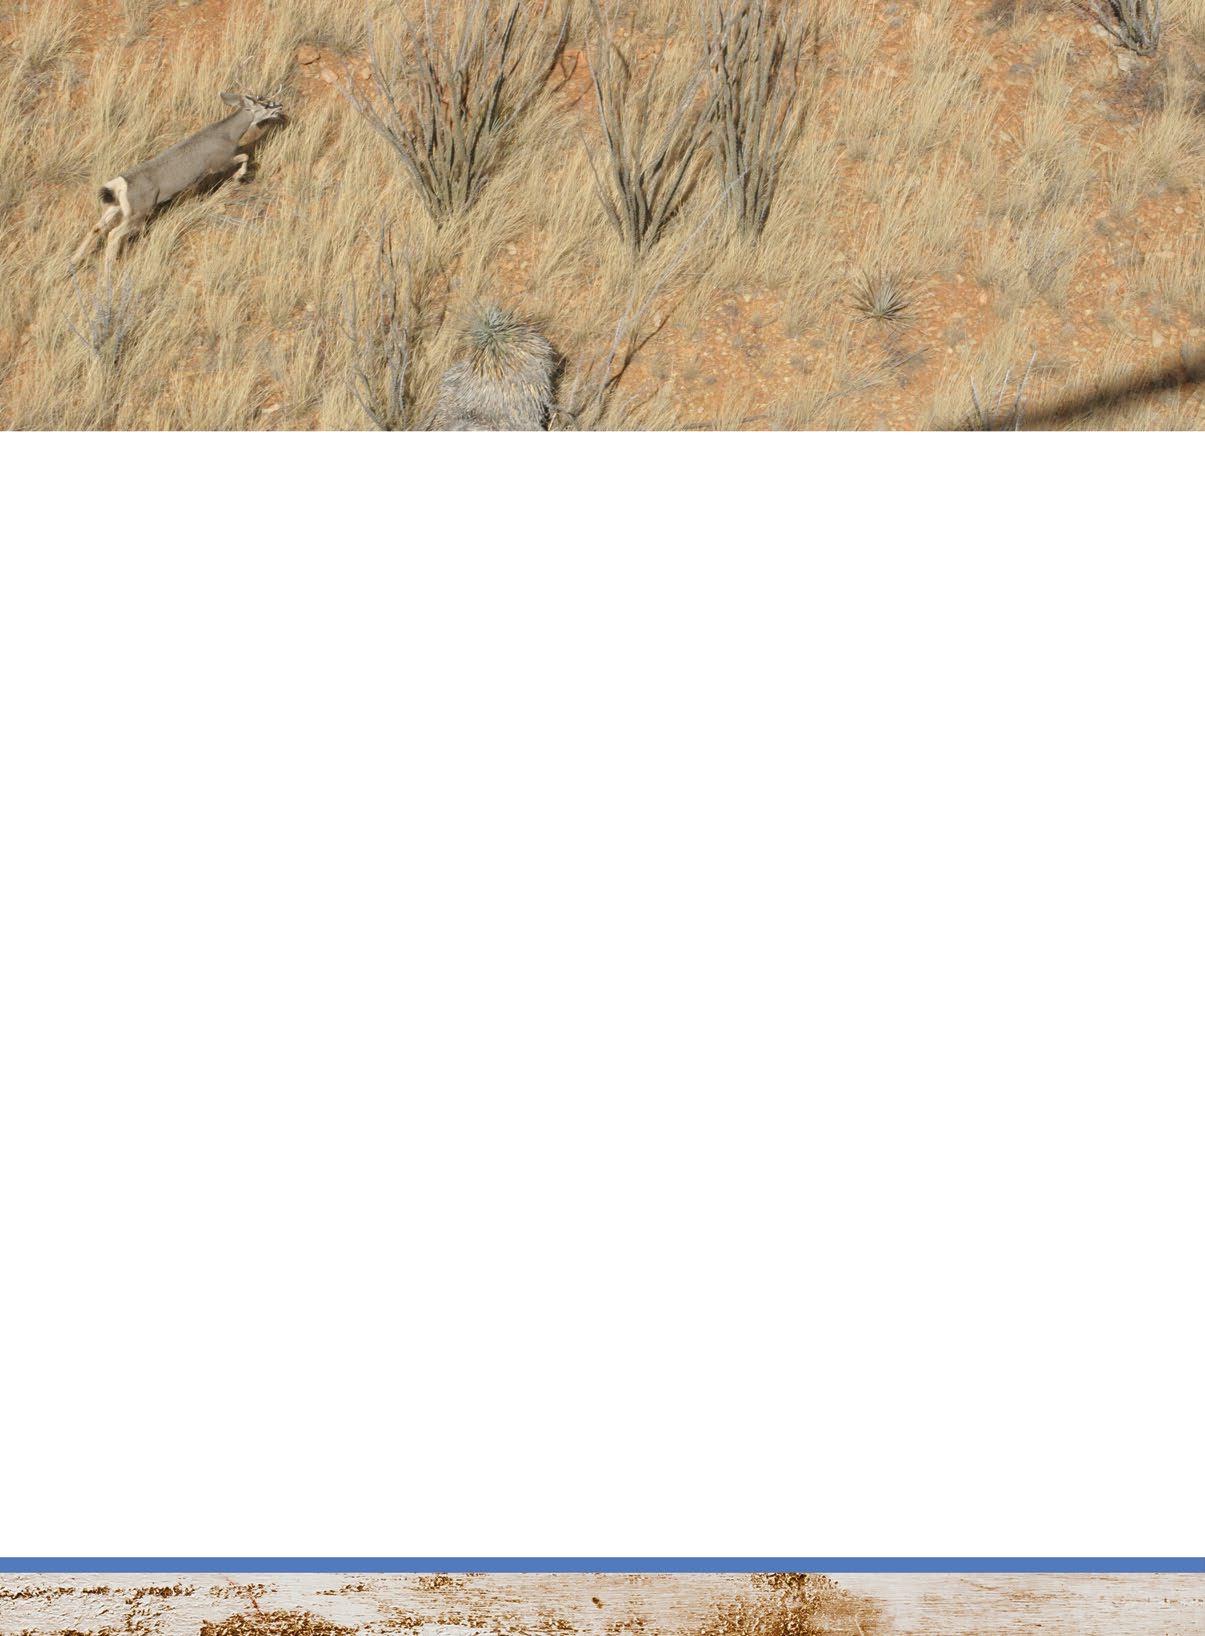
Arizona has 80 game management units (GMU) throughout that state. Almost every GMU has a resident wildlife manager who is a law enforcement officer and holds a bachelor’s degree in wildlife management or a related field. Firearm deer harvest is controlled in all GMUs by a limited-entry lottery drawing. Helicopter surveys between Dec. 1 and Feb. 15 account for at least half of the deer observations, with fixed-wing aircraft, vehicle, foot and horseback surveys making up the rest. Wildlife managers survey areas of each GMU where deer are found in higher concentrations so they can maximize the e number of animals seen. The helicopter surveys are conducted in standardized blocks of about 4 square miles each. These blocks provide managers with a consistent evaluation of population trends because the same area is flown at the same time of year. Immediately after the hunts, questionnaires are mailed to permit holders to obtain harvest information. This program has remained basically unchanged since the 1960s, providing for a long-term data set of harvest-related information gathered consistently. The information Although shrubs are common on the southwestern landscape, habitats collected includes estimates of harvest, are generally open enough to survey effectively from the air. number of hunters, hunter-days, par-
hoto p ko J R nd a ge R eo g
authoR photo Surveys should be conducted annually as consistently as possible to maximize the value of the data.
ticipation rate, days per deer harvested, unrecovered deer, weapon-type preference, and hunt success. In addition, a few hunter check stations are operated, and most wildlife managers collect harvest data as they patrol their GMUs during the hunts.
Deer permit adjustments are made in each GMU using all available information, but a set of hunt guidelines define management ranges for three of the most important variables:
• Buck to doe ratios: 20-30 bucks per 100 does surveyed. • Fawn to doe ratios: 40-50 fawns per 100 does surveyed. • Hunt success: 15-25% of hunters successful in harvesting a deer.
If data from a GMU falls within these ranges for all or most of the three variables, it indicates the permits should stay the same. If survey and harvest data are above or below guidelines, permits are adjusted accordingly. The local wildlife manager makes the recommendations and submits them to the regional office and then to the state office for approval. The final statewide hunt package is then presented to a five-member commission for approval at a public meeting.
Southern California
California Department of Fish and Wildlife (CDFW) manages deer in 45 management units called “deer zones,” but the scope of this article focuses only on the desert mule deer in the southern portion of the state. Originally each county in the state had its own biologist, but some now cover two counties with a unit biologist in charge of each deer zone. Management strategies and survey methods differ in southern California because their desert mule deer live in such a different environment compared to the northern part of the state.
In the desert areas, low deer densities make aerial survey inefficient. Too few deer are seen to justify the expense of surveying with this method. However, CDFW biologists have found they can survey deer by setting up automatic cameras in the summer when deer are closely associated with the limited water sources. Experience showed that bucks return about every third day, while does may water daily, depending on whether or not they are pregnant. After reviewing the pictures, biologists can evaluate the minimum number of bucks using the waters, the fawn to doe ratio, and buck to doe ratio.
Under California law, all successful deer hunters must return the report card portion of their tags to CDFW with harvest information. This allows the department to estimate the harvest, hunter success, and number of antler points. During the hunts, biologists also collect harvest data while contacting hunters in the field, including general location of harvest, body condition, and the number of bucks, does, and fawns seen by hunters.
Hunt recommendations are developed by deer zone every two years and remain unchanged in the intervening years. Provisions built into the process allow for emergency changes to a deer zone if warranted. The biologists recommend whether permits should be increased or decreased in each zone based on trends in harvest, hunter success, and other data. The recommendations are submitted to the headquarters office in Sacramento and then forwarded to the State Fish and Wildlife Commission for approval.
Adaptive management
Using an adaptive management approach, deer managers: set specific management goals, monitor progress toward those goals, and make necessary adjustments to achieve them. Survey and harvest information represent the foundation of deer management in the Southwest. No single piece of information alone is sufficient. Managers must use all available data together to make informed choices about how many bucks can be harvested, whether herd reduction is needed, if predator control will help, and the relative age structure of the bucks. Managers not only look at the current herd data, but more important, the trends in all surveys. Trend data from buck to doe ratios, fawn to doe ratios, antler size, age structure, and deer abundance are all monitored to measure herd performance against the manager’s goals.
Deer management is more complicated than most people realize. The harsh, arid southwestern environment adds challenges to the deer manager’s task. However, through time, management systems have been developed to successfully collect the information needed to manage deer populations for a diversity of public desires from trophy hunting to putting some meat in the freezer. Hunters are an important component of this management in all southwestern states and work more as conservation partners than beneficiaries of management. We need to continue to all work together to keep our deer herds robust and healthy.