31 minute read
Second Principle: Ecological Accounting Informs Design

from Ecological Design
by TD Garden

Trace the environmental impacts of existing or proposed designs. Use this information to determine the most ecologically sound design possibility.
Ecological Accounting
Advertisement
All of us are familiar with the conventions of economic accounting. No design gets very far without accompanying budgets, spreadsheets, parts lists, and so forth. Unfortunately, we have largely failed to consider the parallel set of accounts that link designs to the health of ecosystems. These accounts cover acres of abused land, kilowatt-hours of energy, gallons of water, pounds of eroded soil, and all the other environmental impacts of a design. Just as standard accounting procedures allow us to determine how money is acquired and spent, ecological accounting procedures provide a way of tracking ecologically relevant variables.
For several decades, ecologists have produced detailed studies of the flow of energy and materials through ecosystems. Ecological accounting requires us to do the same for products, buildings, landscapes, and entire communities. As Wes Jackson observes, sustainability will result from “our becoming better ecological accountants at the community level. If we must as a future necessity recycle essentially all materials and run on sunlight, then our future will depend on accounting as the most important and interesting discipline.”1 Careful ecological accounting provides an accurate measure of the environmental impacts of designs, allowing these impacts to inform the design process.
Suppose the Acme factory upriver is polluting your favorite fishing hole. While the factory may be within its legal emissions limit, its activities nevertheless have a direct bearing on the health of the river and your enjoyment of it. The pollution, even though free for the polluter, represents a cost to you. In the language of economics, the pollution is
103
104 The Ecological Design Process
an externality; that is, it impacts only third parties not directly involved in buying and selling Acme’s products.
Externalities create a tension between economic accounting and ecological accounting. In a world rife with externalities—from acid rain to global warming and ozone depletion—minimizing economic costs often maximizes environmental and social costs borne in the form of pollution, habitat destruction, and sickness. Market prices fail to reflect wider environmental costs because those costs do not show up in conventional economic accounting. There are few markets in clean air, water, and soil.
Ecological accounting is a way of gathering information for making design decisions in the absence of prices that accurately reflect overall ecological costs. Consider the greenhouse emissions associated with petroleum fuels. While the 1973 OPEC embargo raised the specter of petroleum scarcity, the 1990s have raised the equally disturbing specter of petroleum abundance. As a strong scientific consensus on the greenhouse effect now indicates, continuing present rates of fossil fuel consumption will lead to an increase of five to ten degrees Fahrenheit in global mean temperature by the midpoint of the next century. This will lead to massive crop failures, catastrophic monsoons in Southeast Asia, loss of vast ranges of habitat, and a host of presently unpredictable side effects.
The consensus greenhouse scenario is so disturbing that it can only be considered a threat to global security. Meanwhile, U.S. emissions of carbon dioxide are not taxed or regulated in any significant way even though steep energy taxes have sharply reduced energy consumption in Europe and Japan. Petroleum prices provide a textbook example of the inability of markets alone to guarantee a livable future. While markets accurately reflect supply and demand, they are clearly insufficient to ensure the environmental preconditions for life on this planet.
If prices reflected underlying environmental impacts, there would be plenty of incentive to design products that were ecologically sound. In
Ecological Accounting Informs Design 105
such a system, these products would end up being cheaper, not more expensive. Paul Hawken has proposed such a system in The Ecology of Commerce: “To create an enduring society, we will need a system of commerce and production where each and every act is inherently sustainable and restorative....Just as every act in an industrial society leads to environmental degradation, regardless of intention, we must design a system where the opposite is true, where doing good is like falling off a log, where the natural, everyday acts of work and life accumulate into a better world as a matter of course, not a matter of conscious altruism.”2
In the absence of such a sensibly designed system of commerce, ecologically sound products come to market at a higher price than their destructive counterparts. Everyday acts, like purchasing pesticide-laden produce, have effects that are hidden to the purchaser. Without consulting an ecological shopping guide or deliberately looking for produce that is “certified organic,” one may unintentionally promote an essentially dysfunctional economy. The onus is placed on the careful choices of informed consumers who are willing to pay more to decrease their own environmental impacts.
The gap between economic accounting and ecological accounting presents an exciting challenge for ecological designers. When minimizing environmental impacts coincides with saving money, as in the case of many energy- and water-efficiency measures, the choice is clear. When minimizing impacts seems to require greater expense, as in the case of nontoxic finishes or paints, the choice becomes more complicated. How much extra money should be spent for what level of reduced impact?
Ecological design brings these considerations to the forefront of the design process. It asks us to explicitly consider the environmental impacts of everything we include in a design, from the energy use of a building to the toxicity of a product. The goal is then to improve the ecological accounts—by decreasing energy and materials use, reducing
106 The Ecological Design Process
toxicity, and lessening other impacts—while maintaining a sensible bud get. Often the large cost savings from one set of ecologically sound design choices can help offset the extra expenses associated with another set. In other cases, design decisions that are individually more expensive may yield a synergistic effect that makes them collectively cheaper. For instance, a highly effective passive solar design might pay for itself by eliminating the need for central heating and cooling systems.
Ecological accounting begins with a careful choice of accounts. Typical accounts cover the type and quantity of energy, water, materials, toxins, wastes, and land used in a design. In an agricultural context, we might pay particular attention to energy, water, land, soil, and key nutrients. In an office building, energy, buildings materials, and toxins would require special scrutiny. In a product design, energy, materials, toxins, and wastes would be most important. These accounts can be kept with varying levels of precision, but they should reflect—at least qualitatively—the most significant environmental impacts incurred by a design.
Ecological accounting also requires us to choose boundaries of space and time for our inquiry. If we trace all of the impacts of a design over its complete history, we are performing life-cycle analysis. In this case, discussed in the next section, we sum impacts over the lifetime of a design. In the final section, “Following the Flows,” we examine the flows of resources needed to sustain a given building, campus, or town in its daily operations. In both cases, a consistent, meaningful choice of boundaries helps to focus the ecological accounting procedure and lend it greater relevance to the design problem at hand.
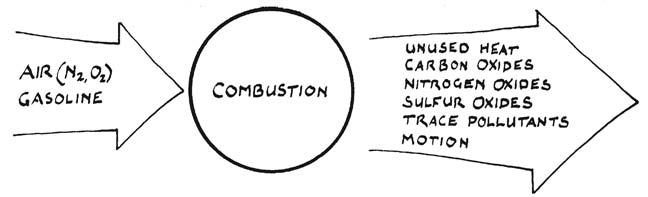
Suppose we were to set up the ecological accounts for two familiar processes: gasoline combustion and photosynthesis. Let us represent a process—respiration, combustion, distillation, and so on—by a circle. Inputs like steel, oxygen, energy, and water are shown by an arrow entering the circle. Outputs, including both useful products and wastes,
Ecological Accounting Informs Design 107
are shown by an arrow leaving the circle. With these conventions, gasoline combustion and photosynthesis may be depicted as in figures 14 and 15.
Industrial processes like gasoline combustion typically manifest a single century or less of human design ingenuity. These processes often accomplish their narrow objectives well, but at great ecological cost. Usually, they are resource intensive, running at very high temperatures and pressures. Their waste products include substances so toxic that they are dangerous even at a level of one part per billion or less. While the processes of nature have been tested over geological time and of necessity fit with the fabric of life, industrial processes have severe impacts that can be reduced only through a conscious design effort.
In the case of gasoline combustion, the energy-rich fuel is derived from millions of years of photosynthetic activity. When one gallon of gasoline is burned, it produces twenty pounds of carbon dioxide as well as trace quantities of other substances like nitrogen and sulfur oxides
FIGURE 14. Gasoline combustion
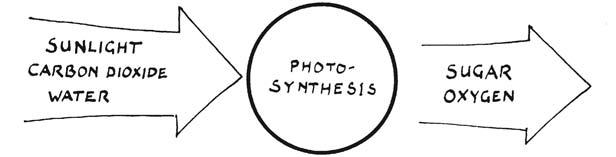
FIGURE 15. Photosynthesis
108 The Ecological Design Process
and ozone. When this process is replicated in thousands of cars driving around a city, it results in smog and regional acid rain. When it is replicated in millions of cars all over the planet, it results in a massive contribution to the greenhouse effect.
Industrial processes are extravagant in their use of energy and materials and dangerous in their production of wastes. In contrast, nature’s own metabolic processes, like photosynthesis and fermentation, are frugal and pollution free. Indeed, “compared with the elegance and economy of biological processes ...most existing industrial processes appear to be far from their potential ultimate efficiency in terms of the basic chemical and energy pathways they use.”3 While nitrogen-fixing bacteria quietly perform their work in the soil, we require three hundred times standard pressure and temperatures upwards of eight hundred degrees Fahrenheit to accomplish the same purpose in fertilizer plants.
In photosynthesis, carbon dioxide, sunlight, and water are transformed into a common sugar, dextrose. Photosynthesis is a remarkably elegant process, one that took three billion years of evolutionary design to perfect. It converts a common waste product of respiration (carbon dioxide) into two vital substances, sugar and oxygen. Unlike gasoline combustion, photosynthesis produces no waste products. It runs at everyday temperatures and pressures and is fueled by sunlight and water. Not surprisingly, ecological accounting greatly favors photosynthesis over gasoline combustion!
All processes must obey two simple laws of energy accounting. The first law tells us that the energy stored in the inputs must equal the energy stored in the outputs plus any waste energy. In the case of gasoline combustion, the chemical energy stored in the gasoline is converted to the mechanical energy of the piston together with waste heat.
The second law tells us that energy degrades in quality or usefulness as it is converted from one form to another. While the chemical energy of gasoline can easily be released at any time with a match, the dispersed
Ecological Accounting Informs Design 109
heat energy from combustion can be only partially recovered. In any process, energy will become decreasingly available for further use, or, equivalently, entropy will increase.
These two laws form the backbone of thermodynamics, and they have been helping engineers and physicists work with energetic transformations for more than a century. Twenty years ago, Amory Lovins, a physicist by training, applied these laws to the entire energy system of the United States. He realized that “people do not want electricity or oil, nor such economic abstractions as ‘residential services,’ but rather comfortable rooms, light, vehicular motion, food, tables, and other real things. Such end-use needs can be classified by the physical nature of the task to be done.”4 He argued that the quality of energy supply should be matched to its end use, for example, keeping a room comfortable or running a motor. To use a high-quality energy source, such as electricity, for a low-quality end use, such as heating the leaky bag of air we call a house, was entropically insane, much like cutting butter with a nuclear-powered chainsaw. His radical pronouncements in the 1970s—“Stop living in sieves,” “Stop driving petropigs”—have been translated into policy in many countries.
In Soft Energy Paths, Lovins was able to show that U.S. electricity consumption could be cut drastically without sacrificing any end-use benefits. The key is efficiency: fewer steps in the energy delivery process, each better designed to minimize wasted energy. The arithmetic is clear: The overall efficiency is the product of the efficiencies at each step. If each step is 70 percent efficient, and this is an optimistic figure, then a three-step process will be just 34 percent efficient, and a five-step process just 17 percent efficient.
If the overall efficiency increases, then the level of end-use benefits may be maintained even as the energy input declines. Lovins has shown that if all Americans adopted the highest-efficiency refrigerators available instead of their present masterpieces of dumb design, the energy saved would allow two dozen nuclear reactors to be shut down. He
110 The Ecological Design Process
has also been able to show utilities and their regulators that meeting demand through efficiency is cheaper than increasing supply. Outfitting customers with energy-efficient lights is more sensible, both economically and environmentally, than building a new coal-fired utility.
There are already burgeoning markets in energy efficiency or nega watts. A negawatt, or negative watt, is a unit of decreased energy demand, just as a conventional watt is a unit of increased energy supply. Electrical utilities or large customers can purchase decreased energy loads—i.e., negawatts—from energy services companies (ESCOs) that provide them through a clever combination of high-efficiency lights, motors, and appliances; physical plant improvements; weatherproofing; and so on. One common arrangement is for an ESCO to offer to split the energy savings with a business. The ESCO purchases and installs the appropriate energy-saving equipment for the customer. The ESCO pays for the installation and maintenance of the equipment itself; its return is a reasonable share of the energy savings resulting from these changes. The customer bears no risk and gets solid energy savings without spending hundreds of hours doing research on energy efficiency. We may hope for eventual markets in negagallons of water, negatons of toxic waste, and negabarrels of oil!
All processes must also obey a fundamental law of materials accounting: matter is neither created nor destroyed. If a carbon atom enters the process, a carbon atom must leave the process. This law tells us that the carbon and sulfur in gasoline must be accounted for in a car’s emissions. The carbon is emitted largely as carbon dioxide, while the sulfur is emitted in the form of oxides contributing to acid rain. Matter that fails to appear in useful products must contribute to the waste stream: there is no other possibility. A great deal of useful information can be obtained by carefully balancing the materials accounts.
In an effort to address materials accounting, many nations are now scrambling to set up a system of national ecological accounts. These accounts attempt to quantify the natural wealth—forests, minerals, air,
Ecological Accounting Informs Design 111
soil, water, and so on—upon which their economic wealth depends. A World Resources Institute case study of Indonesia from 1971 to 1984 demonstrates this idea. Although Indonesia’s gross national product increased by 7.1 percent annually, adjustments for resource losses—depletion of petroleum reserves, forests, and soils—lowered the growth rate to just 4 percent. Indonesia’s efforts to rapidly “mine” its own natural wealth resulted in a burst of apparent economic growth that might well cripple its own long-term economic prospects.5
Ecological accounting—whether at the level of an industrial process, product, building, community, or nation—provides a coherent framework for assessing environmental impacts. It allows us to think more carefully about the connections between ecology and design. Ecological accounting is the key analytical tool of ecological design, for it provides a kind of litmus test for sustainability.
Life-Cycle Analysis
Each object has a history of its own. Your favorite chair, for example, probably was made from wood harvested hundreds of miles away in a logging operation that entailed a network of fellers, roads, and trucks. From there, the wood was milled and sent to a factory for assembly into a chair. At the factory, resins, adhesives, and varnishes were applied as the chair took form. Finally, the chair was packaged, shipped, warehoused, shipped, retailed, and brought home. In several decades, it will probably grow quite rickety, at which time its owner can repair it, junk it, or salvage it in some way.
In a deep sense, the chair embodies the materials, energy, water, and land used during its production and distribution. In other words, these impacts need to be charged against its ecological accounts. The chair is connected, in a tangible way, to the health of streams, forests, and mountains across North America. The Vietnamese monk Thich Nhat Hanh expresses it this way: “When we look at a chair, we see the wood,
112 The Ecological Design Process
but we fail to observe the tree, the forest, the carpenter, or our own mind. When we meditate on it, we can see the entire universe in all its interwoven and interdependent relations in the chair. The presence of the wood reveals the presence of the tree. The presence of the leaf reveals the presence of the sun.”6 Ecological design recognizes that all problems—hence, all solutions—spring from this connectedness.
Looking at environmental impacts over time, we are led to examine the entire histories of the things we use. We need to understand the processes responsible for their creation and decide whether they conserve or squander materials and energy, whether they are toxic or benign, and whether they enhance or diminish the health of those who do the work at each stage. Ecological design demands that we ask of everything we use, “What was sacrificed to create it? What harm to people, animals, and nature was caused by its creation? Or was it created with love which helped people, animals and nature along the way? That is, we have to ask very hard questions of the economic process and we have to apply human and ecological values....Can we now, fully informed, lay claim to this thing and love this thing?”7 This kind of lifecycle analysis revolves around a detailed understanding of the impacts incurred during an entire life-cycle, from the extraction of raw materials through manufacturing, use, and eventual recycling or discarding.
Peter Bahouth, the current director of the Turner Foundation, has gone to some trouble to research and write a kind of ecological biography of a typical North American tomato that begins to suggest the environmental ramifications of industrial agriculture. He calls it “The North American Regional Report, or the Attack of the Killer Tomato,” and addresses it to “nervous eaters.”8
As Bahouth describes it, the tomato was grown on Mexican land traditionally used by Mexican farmers involved in cooperatives, or ejidos. The seed was a hybrid—based on a Mexican strain—now patented by a genetic engineering firm that relied on taxpayer-funded research by the University of California, Davis. The land was fumigated with methylbromide, one of the most ozone-depleting chemicals in existence. It
Ecological Accounting Informs Design 113
was then inundated with toxic pesticides. The production waste from the pesticide manufacturing process was sent to the world’s largest toxic dump in Emelle, Alabama, which happens to sit next to a poor African American community.
Mexican farmworkers, displaced from the ejidos, were given no protection from the pesticides they applied. Nor were they given any instruction in the proper application of these dangerous substances. The workers make about $2.50 a day and have no access to health care.
The tomato was put on a plastic tray, covered in plastic wrap, and then placed in cardboard boxes. The plastic was manufactured with chlorine from Point Comfort, Texas. Residents of Point Comfort face manifold health effects from exposure to dioxins, extremely toxic byproducts of chlorine manufacture. The cardboard began as part of a 300-year-old ancient forest in British Columbia, was processed in the Great Lakes, and was then shipped by the United Trucking Company to Latin American farms. The whole process was fueled by oil from the Gulf of Campeche, Mexico, extracted by Chevron and processed by PEMEX, the Mexican national oil company.
The boxed tomatoes themselves were artificially ripened by applying ether. Now tasteless and nutritionally impaired, the tomatoes were sent by refrigerated trucks throughout the continent. The trucks and distribution centers rely on ozone-depleting CFC cooling equipment. Finally, the tomato arrived, weary and watery, in the salad on your plate.
Bahouth’s tomato was not deliberately chosen as a particularly destructive product. Performing some ecological accounting for this tomato, he uncovered a vast web of environmental side effects ranging from ozone depletion to dioxin contamination to global warming. The life-cycle of an orange, toothbrush, or appointment book would reveal a similar web of effects. While Bahouth’s tomato does not singlehandedly destroy cultures, disfigure landscapes, or change the climate, it is an integral part of a system that does all of these things. The damage is done slowly, cumulatively, through a series of small failures of design and conscience.
114 The Ecological Design Process
The Environmental Protection Agency has already set up a formal life-cycle analysis project for use in regulating products and processes.9 This project is attempting to standardize life-cycle analysis methodology so that it can be used by industry and government alike. One of its prototype examples is a bar of soap, which turns out to be implicated in a surprisingly complex web of processes. Its ingredients include sodium hydroxide, tallow, chemicals, pigments, and fragrances. Sodium hydroxide leads us to a rock-salt mining process, and tallow to the cattle industry. In fact, the entire soap manufacturing process is just the beginning of another series of processes extending from packaging to retailing and consuming.
A life-cycle analysis like this one is an exemplary kind of ecological accounting. It reveals the relative impacts of the various stages of economic activity, from resource extraction through manufacturing, distributing, retailing, consuming, and discarding. Further, it is a tool for making ecologically sound choices. Since purchasing a product indirectly supports all the steps in its life-cycle, it is important to know how destructive these steps are.
Recent German legislation has taken life-cycle analysis from the theoretical to the practical. It requires auto manufacturers to take back each car they make and completely recycle its component parts. This legislation creates a direct incentive for a new kind of design that reclaims as much value as possible when a car is disassembled. It has spurred a move toward using fewer different materials and more modular design than before, so that a car can be more easily broken into useful elements when it is recycled. The car’s “decay” and reintegration into the industrial system become design considerations right from the start.
This attempt to design-in the recycling of the various materials making up a product is termed design for disassembly. Such design intelligently anticipates and facilitates recycling and reuse. It directly reduces the need for virgin materials in the product’s manufacture. In addition, remanufacturing recycled materials is much less energy intensive than manufacturing from scratch—95 percent less in the case of aluminum.
Ecological Accounting Informs Design 115
The German government is also seriously considering a proposal from the Hamburg-based Environmental Protection Encouragement Agency (EPEA) to make manufacturers fully responsible for the lifecycles of their products. The EPEA proposes that products be divided into three categories: consumption products, service products, and unmarketable products. Under this “Intelligent Products System,” consumption products must be fully biodegradable and can be safely discarded after use. Service products—like television sets or automobiles—must be completely recycled by their manufacturers after they have served their functions. Unmarketable products cannot be safely used or disposed of. They must be chemically marked with the manufacturer’s molecular signature and held for safekeeping in a waste “parking lot.” In case of leaks or accidents, the offending chemicals will be traced back to their manufacturer, who will be severely penalized.10
In the United States, the American Institute of Architects (AIA) has been promoting a deeper awareness of materials, energy, and toxicity issues among architects. The following list of questions, adapted from the AIA’s “Making A Difference: An Introduction to the Environmental Resource Guide,” provides an example of life-cycle thinking in an architectural context:11
1.How much “embodied” energy does the building material create over its entire life? 2.How much energy is required to manufacture the material and related products? 3.How much energy is used in transporting the material from source to project site? 4.Are renewable or sustainable energy sources used in the manufacture of the material? 5.Are there less energy consuming, longer-lived alternatives for the same application? 6.Are local sources for the material available?
116 The Ecological Design Process
7.Can the material be recycled or reused at the end of its useful life in a structure? 8.How easy or difficult is the material to recycle? 9.Do different construction systems offer better opportunities for resource recovery at the end of building life? 10.How much maintenance does the material require over its life in a structure? 11.How energy intensive is the maintenance regimen? 12.Are waste byproducts produced during maintenance? 13.Does the material require special coatings or treatments that could present health or safety hazards? 14.If the material produces off-gasses during and after installation, how is indoor air quality affected? 15.Are hazardous solid, aqueous, or gaseous wastes produced during the manufacturing process environmentally significant? 16.How do the amounts of waste resulting from manufacture, fabrication, and installation compare with those from alternative materials?
These questions help us examine a building in a new way. For example, the second and third questions ask us to consider how much energy is required to extract, process, manufacture, and transport a building material. One recent study has provided quantitative estimates of this embodied energy for various materials. Wood has the least embodied energy, at 639 kilowatt-hours per ton. Brick is next (4 times the amount for wood), followed by concrete (5×), plastic (6×), glass (14×), steel (24×), and aluminum (126×).12 The wide variation in embodied energy for different materials confirms that this is an important design issue.
Ecological accounting can cause a painful shock of recognition: our own choices as consumers or designers implicate us in environmental impacts occurring, as often as not, a thousand miles away. In the words of the cartoon character Pogo, “We have met the enemy, and he is us.”
Ecological Accounting Informs Design 117
Identifying impacts, both qualitatively and quantitatively, is a way of improving our present practices. Clear ecological accounts help set the context for ecological design.
Following the Flows
If we turn our ecological accounting to the resource flows—electricity, water, food, and so on—necessary to maintain a building, campus, or community, we grow more sensitive to the systems supporting our lives. Last fall, Sim ran a design studio that focused on the four San Francisco Bay Area hostels run by the American Youth Hostel Association. One group of students attempted to follow the flows of the downtown San Francisco hostel at Mason and O’Farrell Streets. They chose six areas of interest: electricity, garbage, natural gas, recycling, sewage, and water. For each area, they gave practical suggestions for hostelers, provided basic facts on environmental impacts, and mapped the wider resource flows that the hostel was participating in. They detailed their results in a series of multilingual (English, French, German, Spanish, and Japanese) presentation boards. It is worth summarizing the students’ research here:
Electricity. The local utility, Pacific Gas and Electric Company, derives its electricity from a wide range of sources. These include imports from other utilities in the western states and Canada (25 percent), eight fossil-fuel plants just south of San Francisco (25 percent), a nuclear plant near San Luis Obispo (17 percent), seventy hydroelectric plants in the Sierra Nevada (8 percent), a geothermal plant about a hundred miles north of San Francisco (8 percent), and other sources including wind power from Altamont Pass and solar power from Death Valley (17 percent). This represents an unusually diverse range of sources.
Garbage. San Francisco generates twelve hundred tons of trash per day, which corresponds to eight pounds per person, almost twice the national average. This garbage is collected and trucked to a transfer
118 The Ecological Design Process
station just south of the city. About one hundred large trucks carry the garbage seventy miles east to the Altamont Landfill. This huge landfill occupies 1,528 acres. There is a biogas recovery facility on-site that supplies more than six thousand homes.
Natural Gas. Pacific Gas and Electric’s sources include California gas fields (11 percent), Alberta gas fields (51 percent), and southwestern gas fields (38 percent). The utility delivered about seven hundred billion cubic feet of natural gas in 1990.
Recycling. Used glass is melted and processed into new products in Oakland. Used plastic bottles are trucked to Chino in Southern California and remanufactured for a wide range of applications. Aluminum is shipped to Texas for processing. Most of the used paper and cardboard is sent to Pacific Rim countries and made into new paper and cardboard products.
Sewage. Each day, the Oceanside Treatment Plant dumps 22 million gallons of treated effluent four and a half miles out into the Pacific Ocean. The North Point Treatment Plant and the Southeast Treatment Plant dump 60 million gallons into San Francisco Bay. This works out to about 111 gallons of sewage per person.
Water. Water begins as snowmelt in the High Sierra. It passes through a complex system of regulating reservoirs and pipelines, is treated, and is eventually stored in municipal reservoirs.
The educational value of following the flows is immense. It is a practical, ethically engaged way of understanding the ecological implications of design. A recent issue of New Directions for Higher Education, “The Campus and Environmental Responsibility,” presents a series of case studies in which students and faculty have traced resource flows at various universities: UCLA, Tufts, Brown, the University of Kansas, the University of Wisconsin–Madison, Hendrix College, and others. In the issue, David W. Orr suggests the creation of a curriculum focusing on this activity: “The study of institutional resource flows suggests a nontraditional pedagogy that involves students in matters that are direct,
Ecological Accounting Informs Design 119
tangible, immediate, and consequential. In the food studies ... students participated in every step, all the way through the preparation of the proposals that went to the respective college administrations. In the process, students learned how their institutions worked; they learned about agriculture, economics, ecology, and ethics; and they learned that they were implicated in food service systems that were neither sustainable nor just.”13 Such a nontraditional curriculum would emphasize active involvement in environmental decision making.
One of the earliest studies of campus ecology occurred at Arkansas’ Hendrix College in 1986. Four students, under the direction of Orr’s Meadowcreek Project, spent a summer tracking down the sources of the food served in the school’s cafeteria. Armed with notepads and a video camera, the students traveled the country documenting their food suppliers. They discovered that only 6 percent of the cafeteria’s food came from Arkansas, a state with a strong agricultural base.
Vegetables and fruit traveled two thousand miles from California, with a corresponding loss of nutritional value. Growers in California “admitted to the students that their products were developed to survive the long truck ride, and there was little concern for the nutritional quality.”14 Freezing, canning, and packing in chemical preservatives also did little to enhance the quality of the produce. Furthermore, “while beef cattle grazed within sight of campus, the meat served on campus came from a large feedlot operation in Texas. Since cattle raised under the stressful conditions of confinement in a feedlot do not have the same flavor as range-fed beef, fat from Iowa was added to the meat to improve the taste, and then the beef was shipped to the campus.”15 The imperatives of the campus food-services industry had placed a premium on meals that were simple to prepare, not on meals that were nutritionally sound or bound to place.
In 1988–9, further funding was obtained to transform the buying habits of the campus food service. Local farmers were encouraged to grow food for the cafeteria, and the cooks were given additional training
120 The Ecological Design Process
and help in developing menus that would incorporate the new food sources. The campus earned much goodwill in the local community because its purchases were a direct source of economic stimulation. Arkansas sources now account for 30 percent of all food purchased, up from 6 percent at the beginning of the study. Items prepared with local ingredients are labeled with a small emblem that indicates the food’s source. In this study, following the flows of the food system opened the way to a less environmentally destructive system that supported local farmers and provided students with more nutritious food.
A new generation of ecologically engaged artists is busy making resource flows a tangible part of our lives. Just as the Hendrix cafeteria menu reminds students to consider the source of their food, the work of New York City artist Mierle Ukeles reminds us of our relationship to garbage. In 1977, Ukeles became the first artist-in-residence of the New York City Department of Sanitation. An early performance was the eleven-month-long Touch Sanitation, in which she shook the hands of all the sanitation workers in the city. Ukeles believes that
the design of garbage should become the great public design of our age. I am talking about the whole picture: recycling facilities, transfer stations, trucks, landfills, receptacles, water treatment plants, rivers. They will be the giant clocks and thermometers of our age that tell the time and the health of the air, the earth and the water. They will be utterly ambitious—our public cathedrals. For if we are to survive, they will be our symbols of survival.16
Since 1983, Ukeles has been working on a complex piece called Flow City, housed in the Marine Transfer Station at West Fifty-ninth Street along the Hudson River. At the transfer station, trucks deliver garbage to be barged across to Fresh Kills Landfill in Staten Island. The “Passage Ramp” presents a vast panorama of recycled art to the intrepid visitor. Along this ramp, “the materials of glass, metal, and plastic are separated, suspended, and composed in a spiraling format....Ukeles’
Ecological Accounting Informs Design 121
space introduces the concept that waste is a false cultural construct; every item is inherently valuable if only our traditional thinking about garbage can be changed.”17 At the end of the 248-foot passage, the visitor can walk out on the “Glass Bridge” to see trucks dumping their contents onto waiting barges. Ukeles describes this space as “the violent theater of dumping.” The “Glass Bridge” terminates in the “Media Flow Wall,” an installation of twenty-four video monitors displaying live and prerecorded images of the Hudson River, landfill operations and restoration efforts at Fresh Kills, and everyday recycling efforts. Flow City is a rich interpretation of New York City’s waste stream that forces its visitors to rethink their relationship with garbage.
New applications of ecological accounting are also providing a way of relating resource flows to the landscapes that sustain us. William Rees, a professor in the School of Community and Regional Planning at the University of British Columbia in Vancouver, has attempted to calculate the land area it would require to sustainably provide the 1.7 million inhabitants of the Vancouver-Lower Fraser Valley Region with food, forest products, and fossil fuel. Rees estimates that it would take 2.7 acres to provide each inhabitant with an average Canadian diet, 1.2 acres with forest products, and 8.6 acres with renewable biomass production sufficient to replace current fossil fuel use. Multiplying 12.5 acres per capita by 1.7 million people, one finds that an area of 21 million acres is required to provide basic resources for the region—an area twenty-two times larger than the region itself.18
This kind of result challenges us to think more carefully about our patterns of consumption and practices of design. Ecological accounting encourages us to ask tough questions and seek detailed answers. Designs that minimize environmental impacts while meeting economic constraints cannot be developed without clear and comprehensive tools for assessing those impacts. Explicitly setting up accounts for energy, water, materials, and other key variables provides critical guidance for the ecological design process.
122
Notes
The Ecological Design Process
1. Wes Jackson, Becoming Native to This Place (Lexington: Univ. Press of Kentucky, 1994), 99. 2. Paul Hawken, The Ecology of Commerce: A Declaration of Sustainability (New York: HarperCollins, 1993), xiv. 3. Hardin Tibbs, “Industrial Ecology: An Environmental Agenda for Industry,” Whole Earth Review, no. 77 (winter 1992): 15. 4. Amory Lovins, Soft Energy Paths (New York: Harper & Row, 1977), 39. 5. World Resources Institute, World Resources 1990–91 (New York: Oxford Univ. Press, 1992), 235. 6. Thich Nhat Hanh, The Sun My Heart (Berkeley: Parallax Press, 1988),
90.
7. Andrea Cowles, Archipelago, no. 1 (spring 1992): 14–15. 8. Peter Bahouth, Seeds of Change catalog (Santa Fe, N.Mex.: 1994), 61. 9. This example is from Joel Makower, The E Factor: The Bottom-Line Approach to Environmentally Responsible Business (New York: Random House, 1993), 44. 10. Michael Braungart and Justus Engelfried, “The Intelligent Products System,” Bulletin of the Environmental Protection Encouragement Agency (1993). 11. Guidelines from the AIA presented in Architecture 80, no. 5 (May 1991):
118.
12. John Tillman Lyle, Regenerative Design for Sustainable Development (New York: John Wiley & Sons, 1994), 119. 13. David W. Orr, “The Problem of Education,” New Directions for Higher Education, no. 77 (spring 1992): 6. 14. Gary L. Valen, “Hendrix College Local Food Project,” New Directions for Higher Education, no. 77 (spring 1992): 79. 15. Ibid. 16. Quotation of Mierle Ukeles is from Barbara Matilsky, Fragile Ecologies: Contemporary Artists’ Interpretations and Solutions (New York: Rizzoli, 1992), 78.
17. Ibid., 76. 18. William E. Rees and Mathis Wackernagel, “Ecological Footprints and Appropriated Carrying Capacity: Measuring the Natural Capital Requirements of the Human Economy,” in Investing in Natural Capital: The Ecological Economics Approach to Sustainability, ed. AnnMari Jansson et al. (Washington, D.C.: Island Press, 1994), 370–1.