


A.SCOTT MACKNIGHT, CEO / PRESIDENT

A.SCOTT MACKNIGHT, CEO / PRESIDENT
Triangle Credit Union | 2026 Business Plan & Budget Highlights
Prepared for: Top Leadership Team and Board of Directors
Date: January 2026
This executive summary provides a concise, Top Leadership level view of Triangle Credit Union’s 2026 business plan, key operating priorities, and budget outlook. It highlights the major initiatives and assumptions shaping performance in 2026, most notably the core conversion alongside the organization’s risk posture, expected financial results, and areas requiring leadership focus.
• Execution year: 2026 is positioned as an execution-focused year, with enterprise capacity and training demands concentrated on the core conversion while sustaining disciplined growth and service performance.
• Balanced growth: Management is targeting measured expansion in loans, deposits, and total assets, prioritizing profitability and risk discipline over volume.
• Margin and earnings focus: The plan emphasizes prudent asset-liability management, cost-of-funds management, and investment discipline to preserve a healthy net interest margin and capital trajectory amid an uncertain rate environment.
• Member-centric modernization: Marketing, eCommerce, and Member Experience (MX) initiatives focus on improving discoverability, reducing friction, strengthening trust, and supporting adoption of new technology capabilities.
• Risk posture: Interest rate risk metrics in the ALM reporting indicate low earnings risk in rising-rate scenarios, with comparatively higher sensitivity in declining-rate environments supporting the need for continued balance and liquidity vigilance.
• Core conversion readiness and stabilization (May 2026): Complete training, data readiness, testing, and cutover activities; stabilize operations post-conversion while maintaining member experience continuity.
• Sustainable loan growth with margin discipline: Maintain emphasis on direct lending and product profitability; residential mortgages and HELOCs are expected to be primary growth drivers, with commercial real estate as a secondary driver.
• Funding and liquidity optimization: Grow core shares while reducing reliance on higher-cost wholesale funding as market conditions allow; actively manage deposit mix and pricing.
• Operational efficiency and risk reduction: Continue workflow automation and documentation/processing improvements (e.g., business account opening and consumer documentation), reducing manual steps and compliance risk.
• Member acquisition and engagement modernization: Shift toward intent- and datadriven marketing; strengthen financial education platforms (Triangle University, Making Money Personal) as trust and growth engines.
• Technology adoption and trust: Pair new capabilities with proactive education, clear communications, and human support to ensure adoption and protect service quality during transition.
• Loans: +1.48% (≈ $8.6M); primary growth from residential mortgages and HELOCs; CRE growth also expected; vehicle loans expected to decline as prior indirect production amortizes.
• Investments: +2.3% (≈ $5.5M); continued emphasis on government-issued treasuries and mortgage-backed securities while meeting liquidity needs.
Balance Sheet (Year-End Targets)
• Total assets: +1.7% (≈ $14.8M).
• Shares/Deposits: +2.6% (≈ $18.0M); driven primarily by consumer savings and business checking, supported by new/expanded deposit strategies.
• Wholesale borrowings: -9.4% (≈ $6.9M), supported by amortizing advances implemented in 2025; strategy may flex based on relative funding costs.
• Net interest income: +6.2% (≈ $1.6M); NIM: 3.2% at yearend.
• Noninterest income: -16% (≈ $1.2M), reflecting planned overdraft fee reduction and potential interchange fee pressure (with fraud costs remaining elevated).
• Noninterest expense: +13.2% (≈ $3.3M), driven primarily by personnel and benefits, plus normalization of prior-year offsets.
• Projected net income: $3.8M (12-month period), implying ROA: 0.44%.
• Management does not assume a repeat of 2025’s exceptional net income performance, reflecting expected
rate reductions and planned investments (including core conversion).
Interest Rate Risk and Balance Sheet Risk Posture (ALM Highlights based on December 31, 2025, numbers)
• Economic value (NEV) sensitivity: The institution was characterized as low value risk in the ALM reporting. The Up 300 bps NEV percent change is reported at -3.22%, while the Down 200 bps NEV percent change is reported at -11.84%, indicating greater sensitivity in declining-rate environments.
• Earnings sensitivity: The institution was characterized as low earnings risk as implied by the NII volatility (Up 300 bps) scenario.
• Governance implication: Continue disciplined asset-liability management, including monitoring duration mismatch, reinvestment assumptions, and deposit pricing behavior, particularly if rates decline faster than planned.
Major 2026 Initiatives (Operating Plan)
• Core conversion program: Execute conversion activities through May 2026 and stabilize operations post-conversion; prioritize training, process readiness, and member communications to minimize disruption.
• Digital growth and discoverability: Evolve marketing toward member-intent and data-driven acquisition; strengthen financial education content as a trust driver; improve visibility in modern discovery environments (including AI-influenced search behaviors described in the plan).
• Member experience and friction reduction: Continue experience-led process improvements and automation efforts, including business account opening workflows and consumer documentation, to improve speed and reduce rework.
• Deposit growth initiatives: Advance new product concepts (e.g., emergency savings) and targeted business deposit strategies (e.g., operating account and attorney account growth), with monthly monitoring and adjustment.
• Lending portfolio mix and profitability: Focus on direct lending and maintain profitability thresholds; manage expected runoff in vehicle loans tied to prior indirect strategies; monitor economic conditions impacting commercial segments.
• Expense and workforce management: Manage personnel, benefits, and operating costs carefully during a heavy execution year; maintain alignment of compensation and benefits with market realities while protecting service capacity.
• Core conversion execution risk: Operational disruption, member impact, data quality, and staff capacity constraints; stabilization period performance should be actively monitored by management and board committees.
• Interest rate path and margin sensitivity: The budget includes assumed rate reductions; faster or deeper declines could pressure earnings and economic value metrics, reinforcing the need for ongoing ALCO oversight.
• Noninterest income pressure: Planned overdraft fee reduction and potential interchange fee changes (with fraud costs remaining elevated) may weigh on fee income.
• Expense growth and workforce dynamics: Elevated personnel and benefits costs, plus additional roles, require tight management to protect efficiency and service levels.
• Deposit competition and funding mix: Achieving share growth while managing cost of funds will remain critical; wholesale funding strategy may need to flex based on relative pricing.
• Technology adoption and trust: Realizing expected benefits from modernization requires member understanding and adoption, supported through clear communications and effective support.
• Confirm governance and reporting cadence for core conversion readiness, cutover, and post-conversion stabilization (milestones, issue escalation, and member-impact metrics) through the BOD IT Committee.
• Review and affirm key budget assumptions (rate path, growth targets, staffing, and fee income outlook) and establish triggers for mid-year reforecasting by the BOD ALCO/Finance Committee.
• Validate priorities and trade-offs between growth and execution capacity to ensure service levels and risk controls remain strong during the conversion year through all BOD Committees, including Supervisory.
• Reinforce expectations for ALCO oversight (NIM protection, deposit pricing strategy, liquidity buffers, and interest rate risk monitoring) through the BOD ALCO/Finance Committee.
• Note: Although the full board is ultimately responsible for these items, it functions through its committees to ensure the most efficient and effective company governance is occurring.
Conclusion: Triangle Credit Union enters 2026 from a position of strength and stability, with key ratios within policy and a clear focus on disciplined financial management. Successful execution of the core conversion while sustaining member trust, controlling expenses, and managing margin and liquidity will be the defining driver of 2026 performance and readiness for longerterm growth.
As of February 2026
Financial markets responded to multiple noteworthy announcements in January, including the nomination of the next Fed chair
In an effort to lower mortgage rates, President Trump directed Fannie Mae and Freddie Mac to purchase $200 billion of mortgage securities
Kevin Warsh, a former Fed governor, was nominated as the next Fed chair despite being considered more hawkish in the past
The first month of 2026 included multiple announcements consequential for the bond market and financial markets as whole. President Trump and his team proposed multiple policy efforts aimed at improving affordability ahead of the midterm elections later this year, including a 1-year 10% cap on credit card interest rates, a ban on institutional homebuying, and a $200 billion MBS purchase program by Fannie Mae and Freddie Mac (FMs). The credit card interest rate cap is perhaps the most controversial given the potential negative consequences on credit availability. However, market participants were relieved when President Trump suggested that he would rely on Congress to pass a law to cap such rates, which is considered a less likely outcome.
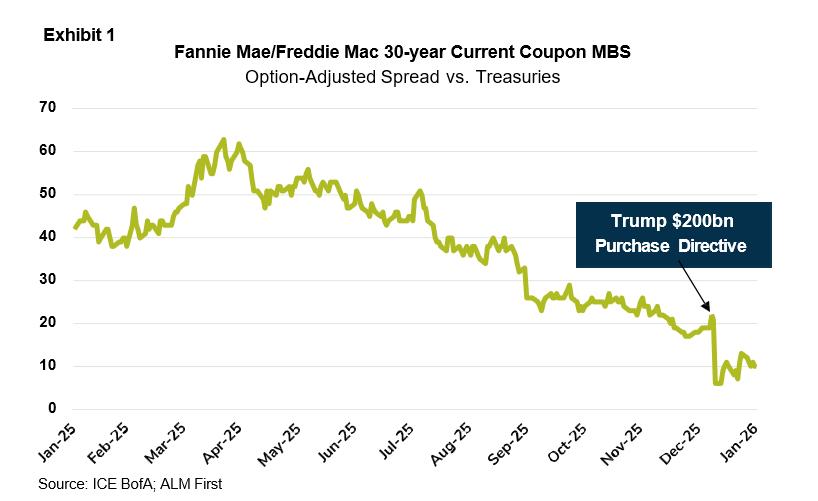
On January 8, Trump directed Fannie Mae and Freddie Mac to purchase $200 billion of mortgagebacked securities (MBS) with the ultimate objective of driving mortgage rates lower. There have still been limited details provided, but it’s worth noting that the FMs had been buying MBS for several months, most recently at a pace of around $16 billion per month, an annualized amount of nearly $200 billion. The most recent disclosures showed that the FMs bought a larger $24.6 billion in December. As illustrated in Exhibit 1, agency MBS spreads tightened on the news, with 30-year conventional coupons trading closest to a par dollar price (e.g., 30-year 4.5% and 5.0% pools) moving the most (10-15 basis points versus Treasuries). However, in a typical “buy the rumor, sell the fact” trade, spreads retraced about half of that move over the remainder of the month, particularly after FHFA Director Bill Pulte said there would be no increase to the total purchase program size of $200 billion.
The Agency MBS market is close to $9 trillion, so a $200 billion (2%) purchase program with no speculation of an upsize will have a more limited impact on MBS spreads and mortgage rates. However, it could have a more material impact on future earnings (and ultimately privatization plans) for both. Disclosures also show the duration gap of both entities rising since the middle of 2025. While the FMs are known to hedge the duration and convexity risks of their portfolio purchases, this information would suggest they are not fully hedging these risks, which alters the risk/return dynamic for both.
At the end of the month, President Trump made the long-anticipated announcement of his nominee for the next Fed chairman when Jerome Powell’s term expires in May. Pending approval by the Senate, Kevin Warsh will take over as leader of the world’s most consequential central bank. Trump has been more than clear in his desire to see a lower fed funds rate, so Warsh may be a curious choice for some given his reputation for being one of the more hawkish members of the Board of Governors from 2006 to 2011. However, Warsh has said most recently that he believes the policy rate should be lower, an almost certain prerequisite for consideration by the President. Additionally, Warsh has been a vocal proponent of policy reform at the Fed, including criticizing balance sheet expansion in the wake of the 2008 financial crisis and average inflation
targeting in 2020. This more than likely caught President Trump’s attention as having a greater legacy impact.
Perhaps most importantly, Warsh is generally viewed as someone that will defend the institution of the Federal Reserve and its independence from political influence. The initial Treasury market reaction to the announcement was a steeper yield curve, pressured by higher long-end yields. Warsh has been a vocal critic in the past of the Fed using its balance sheet as a policy tool (quantitative easing). In other words, he could potentially justify a lower policy rate (easing) as balanced by a smaller Fed balance sheet (tightening). That said, restarting balance sheet reduction, which ended late last year, will be challenging without more substantial structural changes in Fed monetary policy that would likely take more time and effort to implement. In the meantime, Warsh would likely look to build consensus for more gradual steps to reduce the Fed’s balance sheet footprint with minimal market disruption.
Following last week’s FOMC meeting and Warsh’s nomination, fed funds futures were little changed as it relates to pricing for rate cuts in 2026 and beyond. The bond market remains priced for approximately 2 rate cuts in 2026 (50 basis points total), with the first move occurring this summer. The official statement from last week’s FOMC meeting and the Powell press conference that followed suggested the Fed is comfortably on hold until a new data trend emerges.
Rates, Volatility, and Spreads
Treasury yields were higher in January with multiple catalysts for the move
Higher Japanese bond yields could impact demand for Treasuries, particularly out the curve
Fixed income spreads were tighter for most sectors in January, with MBS and ACMBS benefiting the most from President Trump’s $200 billion buying program announcement
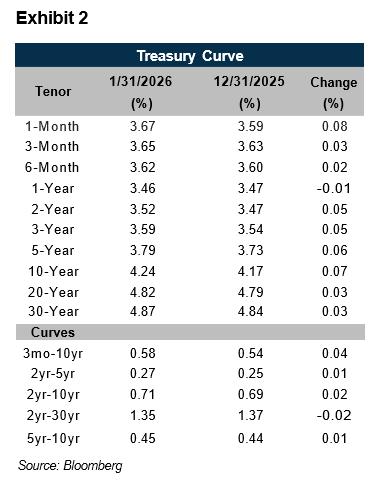
Treasury yields were higher across the curve in January (Exhibit 2), with multiple catalysts for the moves at different tenors. Front-end yields were impacted by a modest reduction in the cumulative level of Fed rate cuts priced by the market over the next two years. At the same time, breakeven yields in the Treasury Inflation Protected Securities (TIPS) market, which are used as a proxy for market inflation expectations, moved notably higher in January. For example, the 2-year breakeven yield rose 54 bps over the month to 2.84%, the highest since April 2025. There was a similar change in inflation swap rates. We saw a modest retracement in market inflation expectations on the news of Kevin Warsh’s nomination for Fed chair.
Long end Treasury yields could also be impacted by a surge in longer dated Japanese government bond yields to the highest levels since 1999. If Japanese yields continue moving higher, it could certainly impact U.S.
bond markets, including Treasuries, agency MBS, and corporate debt. Japanese investors own a large amount of bonds in these sectors, and local yields look much more competitive now relative to U.S. yields on a currency-adjusted basis. The largest allocation and potential impact would be Treasuries, where Japanese investors own $1.1 trillion as of the end of November according to Treasury department data.
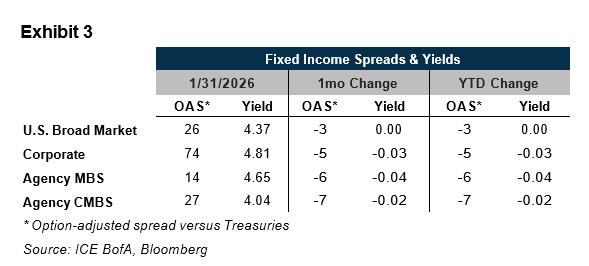
Fixed income spreads moved tighter relative to Treasuries for most sectors in January (Exhibit 3). President Trump’s directive for the GSEs to buy $200 billion of MBS had the biggest impact on Agency MBS and CMBS (ACMBS) spreads. However, the impact on MBS was not uniform, and some higher/premium coupons experienced spread widening amid prepayment risk concerns. Corporate bond spreads were 5 bps tighter versus Treasuries in January, but that trend is not expected to hold for all of 2026. Net corporate bond supply is expected to grow roughly 10% this year, due largely to ongoing digital infrastructure buildout (AI) compared to a 5-7% expected increase in net Treasury issuance.
• President Trump announced that he was directing the GSEs to purchase $200 billion of mortgage-backed securities
• Spreads tightened sharply, though they have given back some of the move. Several questions remain on how the purchase program will be implemented
• We continue to prefer adding 15-year MBS instead of 30-year MBS given current valuations. We also still like adding hybrid ARMs on the margin
• We continue to prefer the belly of the curve in Agency CMBS
In last month's commentary, we discussed Agency MBS’s strong performance through 2025 which left spreads tight vs long-run averages. We noted that there wasn’t much runway for further spread tightening. This was proven wrong a few days later.
Late in the afternoon on January 8th, President Trump announced that the GSEs would purchase $200 billion of MBS with the goal of lowering borrowing costs. MBS, particularly lower and belly coupons, tightened sharply following the news with conventional 30-year 4.5s roughly 10 bps tighter. Higher coupons on the other hand saw minimal tightening due to the prospect of higher prepayments. As discussed earlier, spreads retraced roughly half of their initial move but remain tighter than where they started the year, particularly in the belly of the stack.
Ginnies were less impacted as it was less obvious that Fannie and Freddie would buy FHA-insured loans vs their own loans. The GSEs can buy Ginnies and there’s an argument to be made that purchasing Ginnie pools would help the most affordability constrained borrowers.
The announcement raised more than a few questions. For instance, what would be the pace of purchases? The GSEs had been buying roughly $16 billion the prior two months, would this continue going forward? Would they buy more rapidly? If they bought $200 billion all at once, spreads would likely widen afterwards, which would have a negating effect.
Another question is what coupons they would buy? The belly of the stack seems like an obvious choice given that they most directly impact primary mortgage rates, but this was already the tightest part of the coupon stack, and concentrating purchases here would have a negative impact on the profitability of Fannie and Freddie.
There’s also the question of whether they’ll hedge or not. The GSEs used to hedge their duration and convexity risk when they were more active buyers of MBS. They would pay fixed in interest rate swaps to manage duration and buy swaptions (options on swap rates) to hedge negative convexity. Hedging would likely work against the goal of lowering mortgage rates by increasing yields and implied rate volatility, leaving a reduction in mortgage rates entirely to spread tightening. But, if the GSEs don’t hedge, then they would be adding risk to entities owned by US taxpayers.
MBS investors are also wondering how this will impact monthly roll pricing in the TBA market. If the GSEs copy the Fed and primarily buy cheapest-to-deliver bonds, rolls should richen since the float would be cleaned up and prepayment risk should fall. But, if the GSEs buy specified pools or just retain some of their cash window loans, then the float would worsen and rolls would trade cheaper.
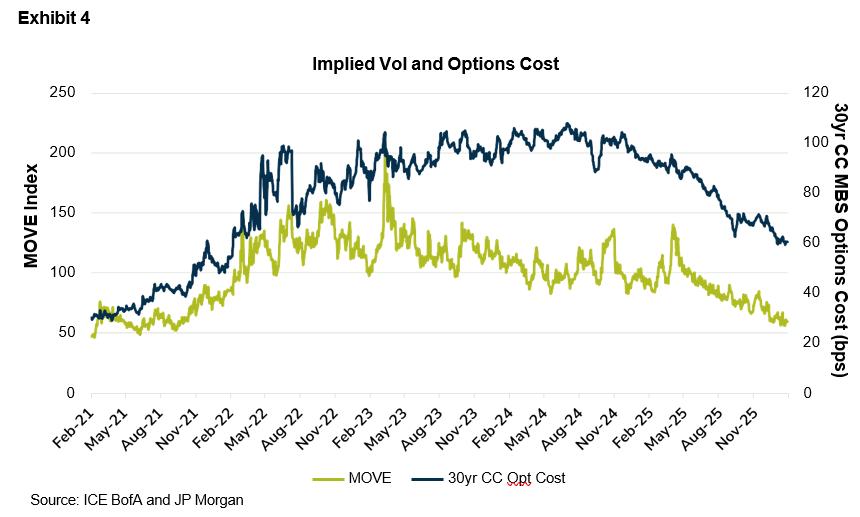
While spreads are generally tighter than they were to start the month, our views are largely unchanged. We currently view a defensive posture within MBS given snug valuations that we feel don’t properly compensate for convexity risk. Implied rate vol and options costs remain at fouryear lows (Exhibit 4). So, now is not a particularly compelling time to sell options.
We continue to view 30-year MBS as unattractive for institutions absent extenuating circumstances. Lower coupons and the belly of the stack are trading very tight with OAS in the low single-digits to low double-digits. Higher coupons offer more spread, but not enough in our view to compensate for the convexity risk.
We still like Hybrid ARMs at this juncture. While spreads here have also tightened by roughly 20 bps, they still maintain a solid pick vs short-duration alternatives. G2 5/1 ARMs are trading with OAS in the high-30 to mid-40 bps range. Supply here has been solid as well with dealers maintaining decently sized inventories.
In 15-year, we still like 5.0 coupons. 5.0s briefly traded in the mid-single digit area but are now trading in the high-teens to low-20s. Though supply is a little challenged since 15-year mortgage rates have hovered around 5.60 recently, issuance has been more concentrated in 4.5s.
The belly of the stack, be it in 30-year, 15-year, or Ginnie is the tightest section due to expectations that these coupons will be the focus of any GSE purchases. This combined with a
relatively thinner float has pushed OAS for these coupons close to 0. As such, we currently view this part of the stack in MBS as unattractive regardless of term and issuer.
In early February Agency CMBS spreads, like most sectors, moved tighter after Trump's announcement regarding the planned purchase of $200 billion in MBS. As a result, we sit just wide of long-run tights across the 5-, 7-, and 10-year points of the curve. This has reinforced our view that staying in the front-end or belly of the curve is appropriate to remain defensive against a potential move wider towards long-run averages. Additionally, given the tailwind following Trump's announcement, spreads between Ks, DUS, and PCs converged on one another leaving the basis between products at only a couple of basis points. As a result, we currently view Ks in the 3–5-year range as the most attractive option, where possible. Bonds here can be found in the mid-20s in secondary, or high-20s in new issue.
Another knock-on effect of the Trump announcement was the further widening of swap spreads. 5-and 10- year swap spreads now sit at -27 and -39 basis points. Consequently, synthetic floater spreads look much less attractive than they did 6 months ago with 5-year synthetic floaters trading at 59 DM versus 5-year K floaters at 49 DM. 10-year synthetic floaters look better given wider swap spreads but still sit close to recent tights at ~75 DM versus 56 DM on 10-year K floaters. While on the surface 10-year synthetic floater spreads look commensurate, we currently view a more defensive posture as appropriate given where asset and swap spreads sit now versus means. In conclusion, we view taking advantage of increasing floater supply across Ks and PCs as the better approach for floater investors.
• We examine the impact a 10% cap on credit card interest rates would have on ABS markets
• We remain constructive on tier-1 near-prime and subprime subordinates
President Trump dropped a potential bombshell for the credit card industry on January 9th via a post on the Truth Social app. Specifically, he said: “Effective January 20, 2026, I, as President of the United States, am calling for a one-year cap on Credit Card Interest Rates of 10%”
Clearly, January 20th has come and gone without the necessary congressional approval or executive action to put the interest cap in place. With that said, we aim to discuss the macro effects this could have on the credit card industry as well as how ABS trusts would be affected at an issuer/security level if something like the proposed cap was put into place.
At a high level, it’s easy to see how a 10% cap could have a negative impact on most participating parties. Cardholders would likely face reduced access to credit and receive less rewards. The credit card issuers would almost certainly see lower revenues. And retailers would likely suffer from lower revenue, as well as the potential scaling back of co-branded initiatives. These issues would be particularly prevalent for lower-income borrowers and smaller lenders who lack the scale to survive such a strong blow to interest income.
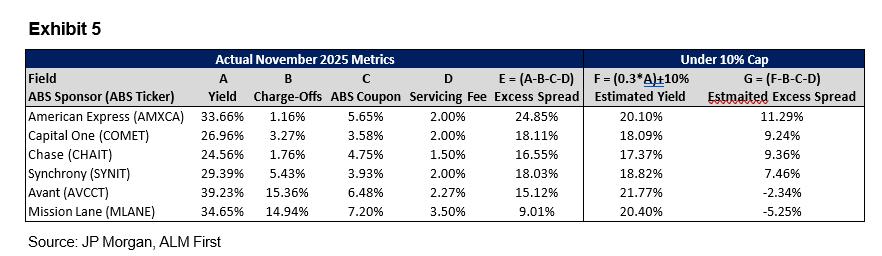
So how does this impact credit card ABS trusts? Without question, a 10% interest rate cap would lower ABS trust portfolio yields and in turn lower excess spread. Taking a step back, the ABS trust portfolio yield is the sum of interest and non-interest income (including fees and interchange.) Further, the trusts’ excess spread is equal to the yield minus credit losses and expenses (servicing fee and ABS coupon). Given that interest income would take a direct hit with a 10% cap, all else equal, excess spread would decrease instantaneously as well.
Why is this important? In a credit card ABS deal, excess spread is a key risk trigger given it represents the level of protection investors have against credit deterioration. So, greater excess spread equals greater protection against potential write-downs. Additionally, in most credit card ABS transactions, if the 3-month average excess spread falls below 0%, the deal will begin amortizing down. This generally happens sequentially by each tranche’s credit rating. Moreover,
excess spread can effectively be looked at as the sponsor’s NIM. So, less excess spread also equals less profitability for the sponsor.
Exhibit 5 examines the difference in excess spread between actual November 2025 figures and what the numbers would look like under a proposed 10% cap for various ABS sponsors. The math here assumes that non-interest income for each sponsor is 30% of the portfolio yield. As you can see, excess spread is cut significantly across the board. So much so for sponsors lending to riskier borrowers that their deals would automatically begin amortizing down. It’s safe to assume that without significant changes to programs lending to lower income borrowers, these sponsors wouldn’t be able to survive the proposed cap.
With all of that said, much of this is still speculation. Most practitioners assign a low probability to the 10% cap coming into effect, stating the political hurdles and strong pushback from credit card issuers as some of the top reasons. Spreads in both prime and non-prime credit card ABS didn’t move much after the announcement which broadcasts that much of the market, at least for now, doesn’t see this as a plausible outcome.
Moving into the second month of the year, spreads across the board moved tighter, further reinforcing our defensive posture in the sector. We remain constructive on near-prime and subprime subordinate bonds of the highest quality. We view this sector as still having some room to tighten post-Tricolor.
Although, the runway is getting shorter. Additionally, we still see value in pockets of the franchise/whole business space despite some tightening in recent months.
Non-Agency RMBS
• Spreads in mortgage credit scream tighter m/m – AAA non-QM shifts to +105 over UST
• Trump administration signs executive order to cut off institutional investor homebuying
• Fallout should be felt more acutely in SFR, but ultimate impact is likely muted
• AAA NQM may push to +95 over UST – senior second liens appear relatively cheap
In addition to directing the GSEs to purchase some $200bn in mortgages, President Trump announced early in January that his administration planned on codifying a ban on single-family home purchases from large institutional investors. Sure enough, an executive order was signed on January 21st.
The rhetoric altogether is not considerably unique – Governor Newsom of California has made similar statements regarding limits on purchasing from private equity or hedge funds. Of course, California remains the largest housing market in the U.S., so less capital participation could be impactful more acutely there if measures go beyond the Federal ban. While the move isn’t immaterial, the ultimate outcome for non-agency RMBS should be rather muted. We discuss further in this month’s special topic.
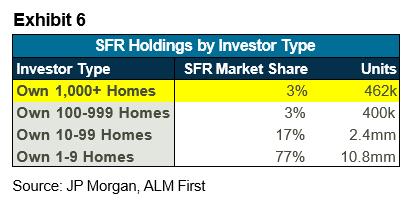
The natural fallout is likely to affect singlefamily rentals (SFR) the most. Large institutional investors account for roughly 3% of all SFR units (Exhibit 6), totaling approximately 460,000 homes. While the desired intent of the law was a part of a broader plan to improve housing affordability for the average American, large SFR operators have notably been net sellers for some time. Meaning, the impact from a purchasing ban is unlikely to have a material impact on affordability in the short term. Acquisitions for this cohort have skewed more towards new build-to-rent (BTR) properties. Moving forward, smaller investor classes may step in to fill the void through DSCR loan financing, commonly found in non-QM trusts, increasing overall supply of the more CMBS-like loans.
It’s worth noting – the legislation is not an outright “ban”, per se. Institutional investors are not outright forbidden, nor are they required to sell existing portfolio properties. Rather the order directs Federal agencies to withdraw financing, guarantees, insurance, securitization outlets, etc. when institutional investors attempt to acquire single family homes going forward. The idea being that this should naturally stem the flow of capital from large investors with effectively no liquidity backstop, which should come to fruition.
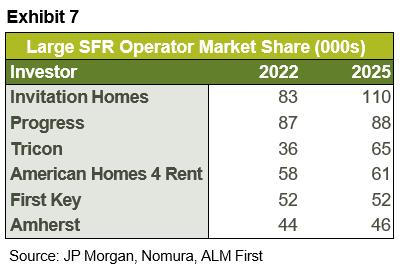
All told, the net impact on housing, and more specifically SFR, should be rather muted. Housing supply could decline marginally if builders scale back new construction to a degree. Over time, the SFR market could face more headwinds if the perception from investors is that the product is less scalable. In total, we don’t believe that to be the case and would argue that the near-term base case is tighter spreads behind lower supply. Exhibit 7 outlines the largest SFR operators that will be most affected on a forward basis, and the change in the size of their portfolio properties over time.
The move in valuations has been unsurprisingly pronounced over the month, as AAA non-QM moved some +25 bps tighter, finishing around +105 bps over Treasuries for Tier 1 names. Calls for further tightening may be justified as well, with investors and research desks alike believing +95 bps over Treasuries is realistic in the near term. Considering the trade still looks optically cheap to current coupon Agency MBS or duration-matched corps/ABS, the potential tailwind looks legitimate. It is worth noting at the most senior level (AAA-rated) second liens have significantly lagged non-QM spread tightening, and sit about +10-15 bps wide. We’ve always argued for a concession to purchase the latter, which may not last, but does currently exist. Even relative to more call-protected non-QM stories such as investor/DSCR, second liens tend to exhibit very little cashflow uncertainty, and we believe the entry point is reasonable to consider.
• GSEs' expected purchases of $200 billion in mortgage bonds are viewed as positive news for IG spreads in the near term
• IG Corporates saw spreads tighten to begin the year, leading to outperformance compared to duration-matched Treasuries
The recent news that President Trump directed the GSEs to purchase $200 billion in mortgage bonds is viewed as a positive for other spread products. With this news comes the expectation of selling and rotating out of Agency MBS, since this creates a price-agnostic buyer in the market. Attention would then turn to Investment Grade Corporates, given that MBS is the second-largest fixed income spread product, with IG corporates the largest ($9.6 trillion IG vs $9.4 trillion MBS). The question now is whether a rotation out of MBS will push already rich IG valuations even richer.
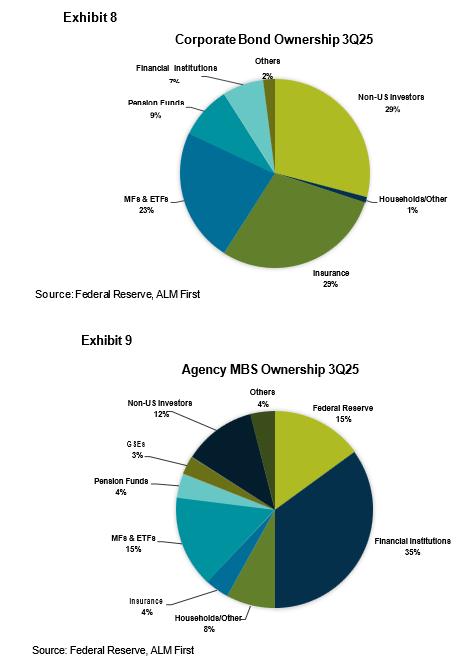
This is a good opportunity to review the investor base for IG corporates and how it differs from that of the next-largest sector, MBS. Exhibit 8 and Exhibit 9 show the percentage breakdown of ownership of the total asset size. “Yield buyers” are a primary investor base for IG corporates, as evidenced by the percentage ownership held by insurance and pension funds. Banks/credit unions fall under the financial institution category and serve a significantly different share of the investor base. If this investor base sells MBS to GSEs, the rotation into IG Corps is expected to be minimal and not beneficial for corporates. The punitive treatment of corporate bonds under riskbased capital keeps banks from holding a material amount of that debt. Money managers (7% MBS vs 15% IG), on the other hand, are the major overlap buyer between the two asset classes. In recent years, money managers have overweighted agency mortgages relative to corporates, given the richer valuations in corporates. This trade has performed well, given that current valuations have richened for MBS while Corporates have stayed range-bound on the low end. Even Agency MBS posted higher total returns than that of high-yield corporate debt in 2025.
IG Corporates and MBS are notably different assets, especially given the embedded cashflow optionality and the absence of inherent credit risk in MBS versus investors being compensated for credit/default risk in corporates. These sectors can be compared given their overall size, and money managers with US aggregate strategies will rotate between them based on relative value. Over the last 3-year period, IG Corporates have been below the average spread pick-up between MBS, but have now moved back above it. The zero-volatility spread on current coupon MBS is now lower than the IG index spread for the first time since 2022. This is viewed as positive news for IG corporate spreads, with tighter spreads expected in the near term amid marginal buying of the asset. Although the 2026 theme of increased issuance is something to watch as a potential
hindrance to further spread tightening. Another hindrance to be mindful of is the rotation of foreign investors (e.g., from Japan) out of US IG Corps in response to global moves, such as Japan’s recent rise in yields.
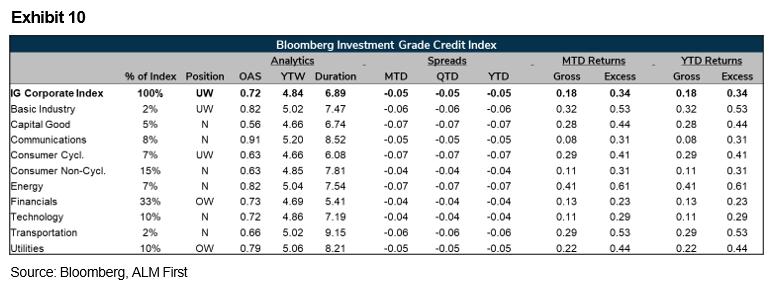
We continue to highlight the historically rich corporate valuations, and January saw spreads tighten further (Exhibit 10). Although valuations across other assets have recently richened, corporates are less rich on a relative value basis through the lens of the historical MBS/Corporate yield basis. Looking at individual sectors, Bank issuance has already led in 2026, with the broad Financials sector issuing $141.7 billion (69% of January issuance). The technology sector, specifically hyperscalers, is expected to dominate issuance in the coming months following Q4 earnings reports. These names have begun to look attractive on the margin, given the recent widening amid fears of AI overspend. For corporate-only mandates, we currently view 3-5-year tenors as the most appropriate positioning, with Banks, healthcare, and utilities remaining the focus.
• Mortgage performance continued 2025’s momentum into the new year as President Trump’s GSE directive compressed sector spreads
• The Bloomberg US Corporate Index set a new post-crisis record with credit spreads tightening to 71-bps over Treasuries
• ALM First’s model portfolios generated positive total returns and 0.19% to 0.28% in excess returns relative to their rate benchmarks
A modest increase in benchmark yields in January wasn’t enough to push most fixed income returns into negative territory (Exhibit 11). Most sectors benefited from spread tightening relative to Treasuries, and for another month, agency MBS was a top performer. The sector benefited from President Trump’s directive that the GSEs purchase $200 billion, and spreads snapped tighter on the headline. It’s presumed that the purchases will be more concentrated in conventional 30-year pools, which explains the outperformance of that particular index.
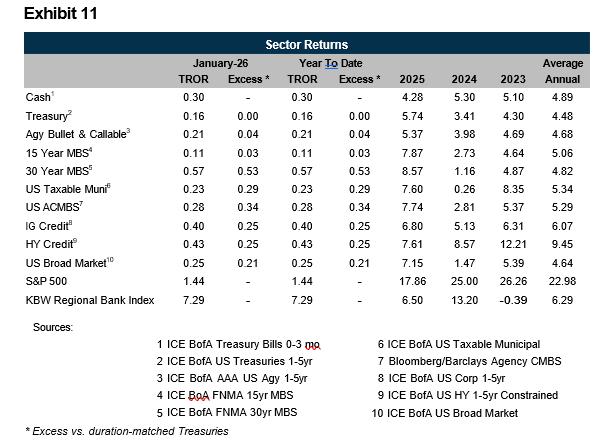
Without the same headlines and attention, the full Bloomberg US Corporate Index created a new post-crisis record with credit spreads falling to 71 bps versus Treasuries. There has been a constant demand from investors to purchase cash settled bonds to start the year as new issue concessions have all but evaporated. In addition, credit default swaps, a synthetic version of the same exposure, haven’t seen the same spread movement and remain unchanged on the month. This renews the question of how much price appreciation is left in corporate bonds.
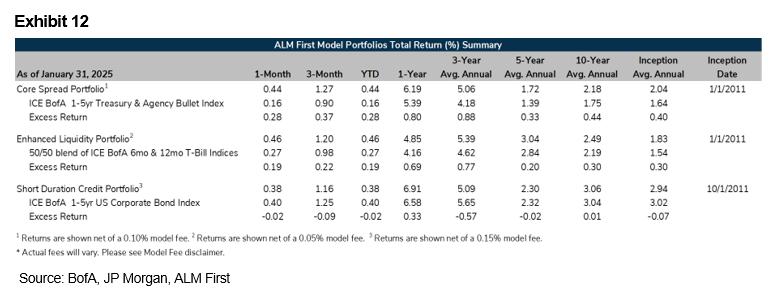
ALM First’s model portfolios started the year off on a strong note as The Core Spread and Enhanced Liquidity strategies beat their rates benchmarks (Exhibit 12). Exposure to mortgages helped the Core Spread produce a 0.44% gross return which outperformed 1-5-year Treasury and Agency Bullets by 0.28%. Whereas the Enhanced Liquidity portfolio generated a similar topline return of 0.46% but only 0.19% in excess of its respective benchmark. Our last strategy, the Short Duration Credit Portfolio, marginally underperformed by 0.02%. However, due to the spread
compression seen across most fixed income sectors, it would have outperformed a comparable rates benchmark by 0.22% after fees.
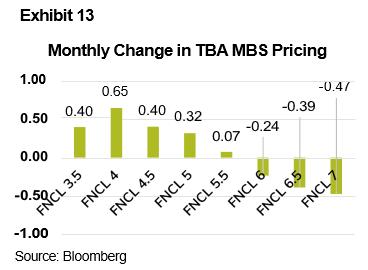
The 10-year U.S. Treasury rate (10CMT) ended the month at 4.24%, 7 basis points higher from the end of December. The 2-year/10-year spread on the treasury curve steepened 2 basis points over the month of January as the 2-year rate increased 5 basis points, ending the month at 3.52%. Low end coupons for TBA MBS pricing primarily increased while higher end coupons for TBA MBS pricing decreased, a reversal of the inverse impact changes observed in the previous month. The 30-year UMBS
5.0% coupon (denoted using the symbol FNCL 5), our most active hedging coupon, increased 0.32 in price over the month. Exhibit 13 shows the change in TBA MBS pricing, which can be compared to Exhibit 14 showing a similar effect on the Fannie Mae cash loan pricing.
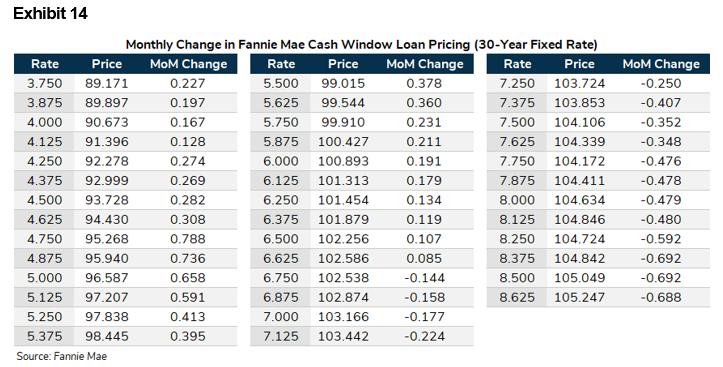
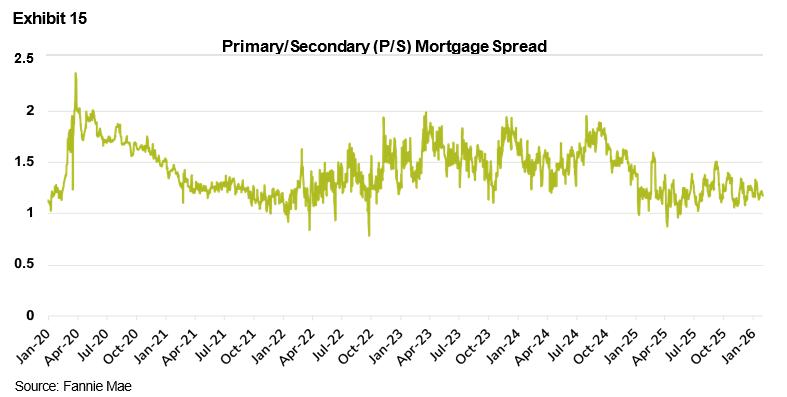
The primary/secondary (P/S) mortgage spread tightened by 1 basis point since the end of December, as the mortgage primary rate (the rate a mortgage borrower may receive) decrease outpaced the par mortgage bond yield decrease (30-year UMBS yields). The 30-year primary mortgage rate, according to Bankrate, is 6.21%, which is 5 basis points lower over the month. The par yield on 30-year UMBS is 5.01%, 4 basis points lower than at the end of December. The P/S spread is a general barometer of mortgage profitability. It has become increasingly volatile since the beginning of 2022, as interest rate volatility has impacted bond yields and liquidity pressures facing lenders. Exhibit 15 shows the P/S spread from the beginning of 2020, and volatility of the P/S spread can be observed from the beginning of 2022.
The net change in price (hedge cost) was negative 1 basis point, with an R-squared of 98.7% for the month of January in aggregate. The hedged cost is a net change in value for lenders hedging Fannie Mae and Freddie Mac (FMs) execution using TBA MBS contracts. Total hedge cost over the last twelve months was -107 basis points representing an average of -9 basis points monthly.
Introduction
Financial institutions utilize various methods for identifying, measuring, and reporting on balance sheet risk exposures. Changes in interest rates affect an institution’s earnings by changing its net interest income. Changes in interest rates also affect the underlying value of the institution’s assets and liabilities because the present value of future cash flows change when interest rates change.
The two most effective methods for assessing an institution’s interest rate risk exposure include the economic valuation of the balance sheet and the earnings projection. As the names suggest, the economic value perspective focuses on the value of an institution’s net cash flows, while the earnings perspective focuses on the impact of interest rate changes on an institution’s near-term earnings (captured in the net interest income simulation analysis).
The Net Economic Value analysis (NEV), which is a point in time analysis, captures the longer-term impact of interest rate changes by including all of the contractual cash flows associated with the balance sheet. The impact of these long-term cash flows cannot be properly shown in an income simulation analysis. We caution the Credit Union, however, that these ALM analyses deal only with interest rate risk and do not properly capture risks due to liquidity or credit.
The Net Interest Income analysis (NII) measures the volatility of net interest income over a period of one year. Net interest income is the difference between total interest income and total interest expense. The more the projected NII results vary among the different interest rate scenarios, the greater the institution’s exposure to interest rate risk. In the interest of isolating interest rate risk, these analyses are performed on a static balance sheet.
Interest rate risk is a spectrum not fully captured by any single scenario and must be viewed holistically. From an NEV perspective, all else equal, if an institution’s value of capital remains unchanged (economic value of assets and liabilities change by the same amount), the implied NEV ratio (NEV/EV assets) will change, despite a constant NEV or $ capital. It is important to
distinguish between the concepts of dollar value capital change (NEV $ Change stated in %, or NEV % Change) versus NEV ratio change (change of NEV/assets). NEV % change can improve from one quarter to the next in an Up300 context, while the NEV ratio in the Up300 shrinks. Effective duration mismatch is also a critical measure to monitor, which is asset duration less liability duration, whereby the larger figure determines the more rate sensitive side of the balance sheet. Institutions often establish a duration gap target and manage their investments around this objective.
The NII simulation is a product of a static balance sheet used to isolate interest rate risk. Maturing, prepaying, or decaying instruments are reinvested at the institution’s current offer rates, adjusted by the forward curve structure and scenario rate change. The forward curve is also impactful for NEV modeling because of its projection of incentive to prepay. It is highly influential in the NII simulation for that reason, as well as its role in determining reinvestment rates for adjustable or expiring instruments. Finally, net income over the simulation is assumed to be invested in the overnight cash balance, the average balance of which, and subsequent earnings, fluctuate accordingly.
After completing the December interest rate risk report for Triangle Credit Union, ALM First submits that the institution is low value risk as determined by the institution’s NEV Percent Change – Up 300 bps scenario. Additionally, the institution is low earnings risk as implied by the institution’s NII Volatility – Up 300 bps scenario. The following table summarizes the December risk position:
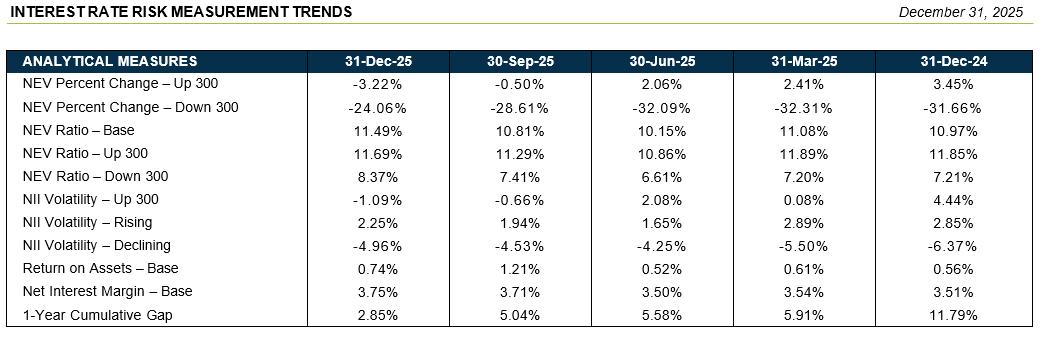
From an economic value perspective, our findings are that Triangle Credit Union’s balance sheet risk position has worsened from September, as implied by the NEV Percent Change – Up 300 bps scenario worsening. The OIS/Swap curve experienced bear steepening between the 2-year and
10-year rates, as the 10-year increased and the 2-year rates decreased. Combined, discount rates (curve + spreads) have decreased since the last analysis, which has resulted in higher pricing and values for most assets and liabilities. For this analysis, Triangle Credit Union’s NEV risk is low as measured by the NEV Percent Change – Up 300 bps scenario, and implies more down rate than up rate risk, as measured by the NEV changes and ratios in the Down100 and Up100 environments. The Up 300 bps NEV Percent Change moved from -0.50% to - 3.22%, as the Investment portfolio experienced the greatest volatility from the previous report. In the Down200 bps scenario, the institution’s implied NEV Percent change is -11.84%.
From an earnings perspective, Triangle Credit Union’s projected risk-to-earnings is low, as measured by the NII Volatility – Up 300 bps scenario. From September to December, the forward curve, which is used to project reinvestment rates, increased across all points on the curve. All else equal, this would lead to higher projected income and expense relative to the last analysis. Looking at interest income, we project increased forward base case interest earnings potential for Triangle Credit Union, driven by the Mortgage Loans portfolio. We also project interest expense contraction relative to the last analysis, led by the Certificates portfolio. In the declining and rising rate environments, whereby interest rates are ramped 25 basis points per month over 12 months to arrive at a gradual 300 basis point change, we project higher risk to earnings in the declining interest rate environment. After accounting for non-interest income and expenses, Triangle Credit Union’s projected net income is $6.41 million over a 12-month period, resulting in an implied ROA of 0.74%.
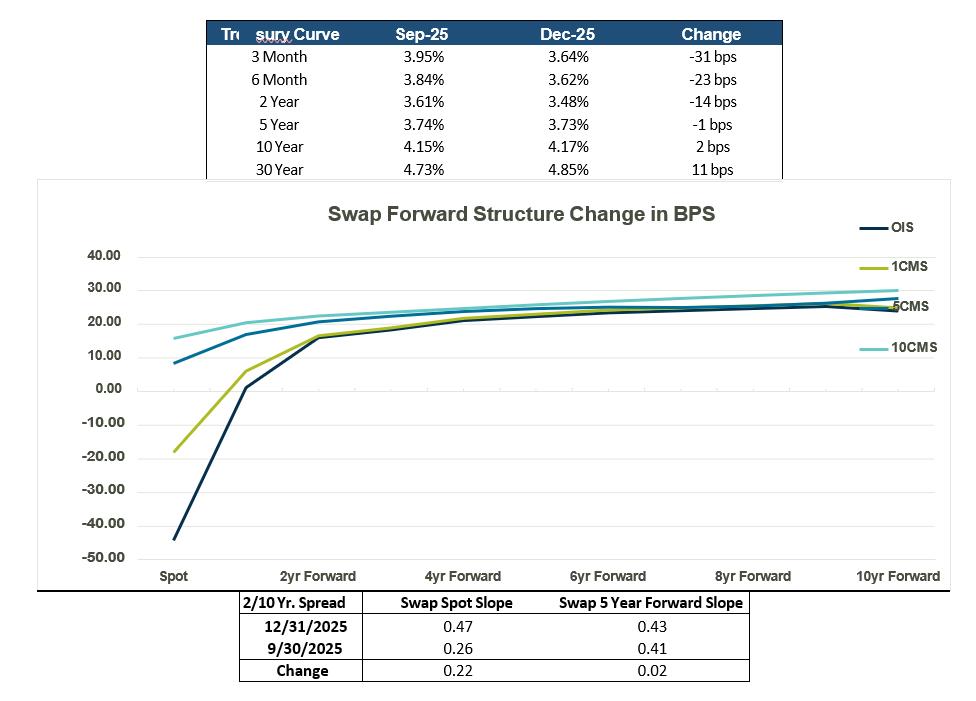
The Effective Federal Funds Rate decreased 50 basis points from September 30, 2025, to December 31, 2025, while the Treasury 3-month 30-year note curve is no longer inverted. The spread between the 2-year and 10-year Treasury notes expanded 15 basis points to 69 basis points between September 30, 2025, and December 31, 2025. The second chart is a visual representation of the swap curve with changes in spot rates from the end of September to the end of December on the left, and the implied change in the forward rate for each forward term moving from left to right (the 1-year swap rate delivered in 1 year, for instance). Spot rates and implied longer-dated forward delivery rates have increased. This leads to higher reinvestment rates in the income simulation and higher asset volatilities.
Disclosures
It is important to remember that prices shown in the ALM analysis are not intended to represent prices that could be obtained if the institution were to liquidate a portfolio. Prices in the ALM analysis represent economic value, which are based on the projected cash flows of the portfolios, and the opportunity cost of owning them, and do not fully capture the risks involved in that ownership (credit, liquidity, and class specific risks).
If the quality of the collateral is materially different from that represented in the data files and assumed by ALM First the actual losses experienced by the institution could differ materially. Moreover, ALM First has relied on the information provided by the client without independent verification and did not perform or obtain any independent appraisals. In addition, where appropriate, ALM First has considered information based on other available published sources that ALM First believes are reliable. While ALM First believes the information and data gathered from all these sources, including the client, are reliable, ALM First cannot guarantee the accuracy and completeness of such information. Since this analysis is necessarily based upon estimates and projections of a number of matters, all of which are subject to change from time to time, the valuation analysis is effective only as of the date of this letter. No implications or representations are made regarding the impact of different assumptions or projections, which would be applied at
the time of a subsequent valuation estimate. The client and ALM First are not affiliated, and neither the client nor ALM First has an economic interest in, or is held in common with, the other and has not derived a significant portion of its gross revenues, receipts, or net income for any period from transactions with the other. The fee payable by the client for these valuation services is fixed and is not dependent upon the valuation conclusion reached. Furthermore, this material has been prepared for informational purposes only without regard to any particular user's investment objectives, financial situation, or means, and ALM First is not soliciting any action based upon it. This material is not to be construed as a recommendation; or an offer to buy or sell; or the solicitation of an offer to buy or sell any security, financial product, or instrument; or to participate in any particular trading strategy. Certain transactions give rise to substantial risk and are not suitable for all investors. ALM First does not provide accounting, tax, or legal advice; such matters should be discussed with your Analytics, and/or counsel.
Moreover, this report was prepared as of the date indicated herein. No representation or warranty is made by ALM First that any of the returns or financial metrics detailed herein will be achieved in the future, as past performance is not a reliable indicator of future results. Certain assumptions may have been made in preparing this material which have resulted in the returns and financial metrics detailed herein. Changes to the assumptions may have a material impact on any returns or financial metrics herein. Furthermore, ALM First gives no representation, warranty or undertaking, or accepts any liability, as to the accuracy or completeness of the information contained this report. This report was prepared for informational purposes only without regard to any particular user's investment objectives, financial situation, or means, and ALM First is not soliciting any action based upon it. This material is not intended as, nor should it be construed in any way as accounting, tax, legal, or investment advice including within the meaning of Section 975 of the Dodd-Frank Wall Street Reform and Consumer Protection Act. Certain transactions give rise to substantial risk and are not suitable for all investors.
This report was prepared by ALM First Analytics, LLC. The hereto-mentioned report contains information, which is confidential and may be privileged. It is for the exclusive use of the intended recipient(s). If you are not the intended recipient(s), please note that any distribution, copying, or use of this report or the information contained herein is strictly prohibited. If you have received this report in error, please notify the sender immediately and then destroy any copies of it. ALM First neither owes nor accepts any duty or responsibility to the unauthorized reader. We shall not be liable in respect of any loss, damage, or expense of whatsoever nature, which is caused by any
use the unauthorized reader, may choose to make of this report, or which is otherwise a result of gaining access to the report by the unauthorized reader.
• It has been a noisy year for financial markets and the economy, but performance across several metrics has proven resilient
• There is little consensus on the future path of the economy among Fed leaders and Wall Street economists
• Credit union and bank profitability remained solid in 2025 amid widening interest margins and stable credit performance
A word we have used often to characterize financial markets and the economy in 2025 has been “noisy.” A simple, yet technical definition of noisy is “accompanied by or introducing random fluctuations that obscure the real signal or data.” In this context, the real signal or data could be economic growth, the unemployment rate, performance in equity and fixed income markets, or the financial performance of banks and credit unions. The obscurities could be tariffs, threats to Fed independence, geopolitical tensions, and the longest government shutdown in US history. To be clear, each of these could prove to have true economic costs rather than being merely distractions. However, thus far, the bark has been greater than the bite.
While ample sources of economic uncertainty and worry persist, the same could be said for economic opportunity. As such, there is a wide dispersion of potential outcomes forecasted by Wall Street economists and Fed leaders alike. The latter has been a heightened area of focus for financial markets in recent months as they try to assess whether the FOMC may be pivoting to a less dovish, or more hawkish, policy path. The minutes of the October 29 FOMC meeting and recent speeches by various Fed leaders suggest a growing contingent more worried about lingering inflation risk. However, as of Monday, the fed funds futures market showed a 100% probability of a December cut and nearly 100 basis points (bps) of rate cuts over the next year. If the labor market proves to be on firmer footing than what the FOMC doves seem to believe, this scenario presents upside risks to bond market yields. However, if business investment remains subdued and unemployment rises, the Fed is more likely to continue lowering the policy rate, as is currently priced by fixed income markets. As always, interest rate directionality scenarios are relative to what is already accounted for in current yields across the curve. Industry Update
As teased above, credit unions and community banks have done quite well amid the noise. As illustrated in Exhibit 1, net interest margins (NIM) have expanded over the last year as principal paydowns on legacy assets have been redeployed into higher yielding loans and investments. At the same time, the average cost of funds has declined for both segments. For credit unions, the weighted average NIM approached 4% at the end of Q3, the highest in more than two decades. Credit union ROA rose 8 bps Q/Q to 0.91%, while ROA for commercial banks with $1-50 billion total assets held nearly steady at 1.23%.
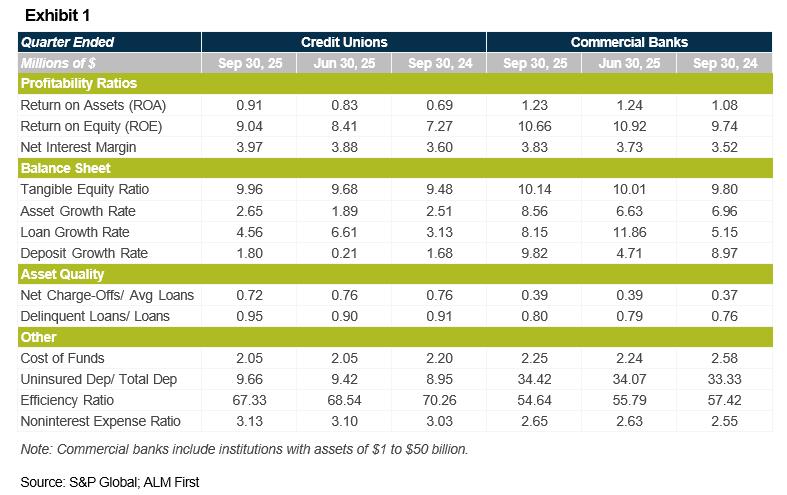
On the credit front, both delinquencies and net charge-off rates have stabilized and generally trended sideways over the last year for banks and credit unions alike. One key differentiator between credit union and bank profitability falls “below the line” in terms of noninterest expense (NIE). The average credit union NIE ratio rose by another 3 bps in Q3 to 3.13%, nearly 50 bps higher than the commercial bank cohort. To be fair, the business models and associated expenses are very different for these two types of institutions. Nevertheless, rising NIE has been a modest negative in an otherwise strong year for the industry.
Rates, Volatility, and Spreads
• Front-end Treasury yields lower in November as markets priced for a higher probability of a December Fed rate cut
• Expected interest rate volatility remains highly correlated to monetary policy expectations
• Fixed income spreads were modestly wider in November across most sectors
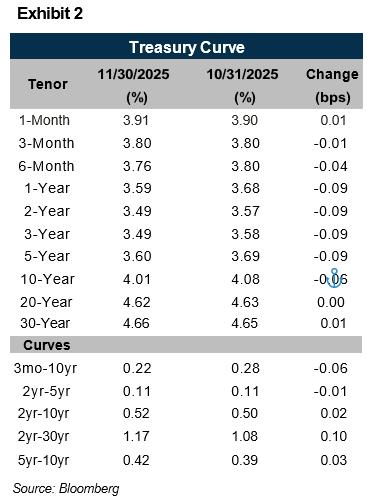
Front-end Treasury yields fell 9 bps in November as the market priced in a higher probability of a December Fed rate cut (Exhibit 2). Most of the decline in yields occurred after the delayed release of the September jobs report on November 20, which showed the unemployment rate rising by 10 bps to 4.4%. The increase was more attributable to increased labor force participation as opposed to a decline in household employment, but that didn’t shake market speculation that the Fed will cut again at the December 10 FOMC meeting. The 3month/10-year yield spread flattened 6 bps in November, but it reversed that move and more on the first day of December amid a sharp sell-off in Treasuries to begin the final month of 2025. The difference between the two maturities ended Monday, December 1 at 0.31%, the highest since January.
The ICE BofA MOVE Index, which tracks expected interest rate volatility, rose to a 2-month high by mid-November before falling near YTD lows by month-end. Rate volatility remains highly correlated with monetary policy expectations. The intra-month rise in the MOVE Index corresponded with the hawkish commentary from Fed leaders after the October 19 FOMC meeting, but the index collapsed lower following the October jobs report. This is a good signal for the likely market reaction if expectations for Fed rate cuts/hikes change in the coming months. A sustained increase in expected rate volatility should negatively impact fixed income returns, particularly assets with embedded options (e.g., MBS).
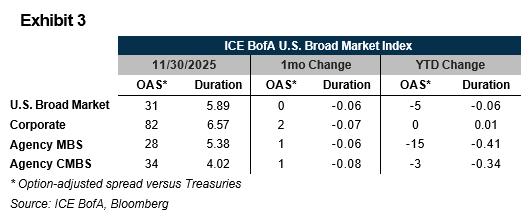
November was relatively quiet in terms of fixed income spread movement (Exhibit 3).
The option-adjusted spread (OAS) of the ICE BofA Broad Market Index remained unchanged versus Treasuries over the month, while MBS and Corporate spreads were modestly wider. Yearto-date, Corporate spreads have held steady near historically tight levels, and Agency MBS has experienced the most tightening among the largest sectors at -15 bps.
• Mortgages were close to flat vs Treasuries in November, but YTD performance remains strong with MBS on track for a positive year.
• We briefly discuss the possibility of 50-year mortgages
• We continue to prefer adding 15-year MBS instead of 30-year MBS given current valuations. We also still like adding hybrid ARMs on the margin, though supply is currently challenging
• 2025 YTD supply moves far ahead of 2024 with lower rates across the curve
• Single loan products like Fannie DUS and Freddie PC drive increase in supply
• Swap spreads continue march wider
Mortgages traded close to flat vs Treasuries in November with the ICE BofA 15-year MBS index up 7 bps vs duration-matched Treasuries while the 30-year MBS index was down 2 bps vs durationmatched Treasuries. Absent a large retracement in December, mortgages are on pace for their best year in over a decade.
Through the first eleven months of the year, the 30-year MBS index is up 1.33% vs durationmatched Treasuries, which is stronger than every year going back to 2012 when the index
outperformed by 1.57%. The 15-year index is up 1.09% YTD, its strongest year since 2012 when the index finished +1.95% vs Treasuries.
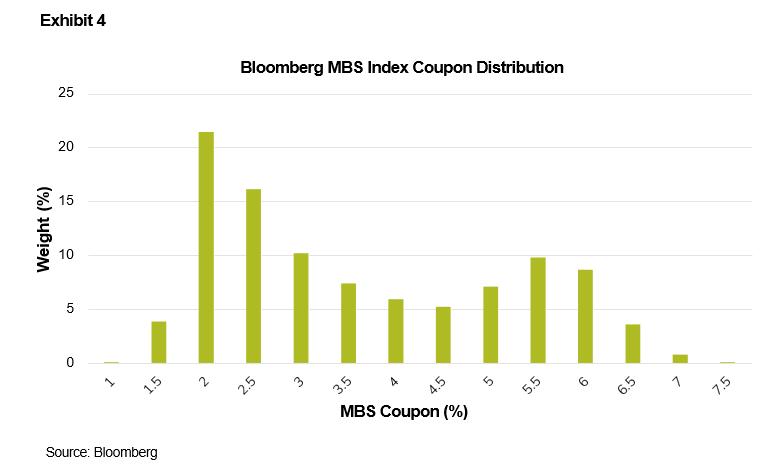
Mortgages have been led by lower coupons, which have seen strong demand as steady inflows into bond mutual funds and ETFs have meant that managers needed to add down-in-coupon MBS. MBS make up roughly 25% of the Bloomberg Agg and lower coupons make up the majority of that 25% weight, (Exhibit 4). To maintain a neutral weight vs the benchmark, bond fund managers must allocate a pro rata share of new money to MBS. To match the index, the funds must buy predominantly lower coupon MBS. Mutual fund managers have some flexibility in terms of weighting and can decide to go overweight or underweight MBS which would impact purchases, but ETFs, which largely just track an index, would simply allocate dollars accordingly.
President Trump posted the idea of a 50-year mortgage on social media to address housing affordability. Like most social media posts, details were scarce. A 50-year mortgage would lower monthly payments through a longer amortization term.
There are several obstacles, however. Dodd-Frank tightened mortgage lending, and loan terms over 30 years are considered to be “risky features” and are thus non-QM. The CFPB and FHFA would need to coordinate and rewrite QM rules to allow 50-year mortgages. TBA deliverability is
another issue. Currently, original terms greater than 30 years are not deliverable, which should result in a liquidity concession and a higher note rate.
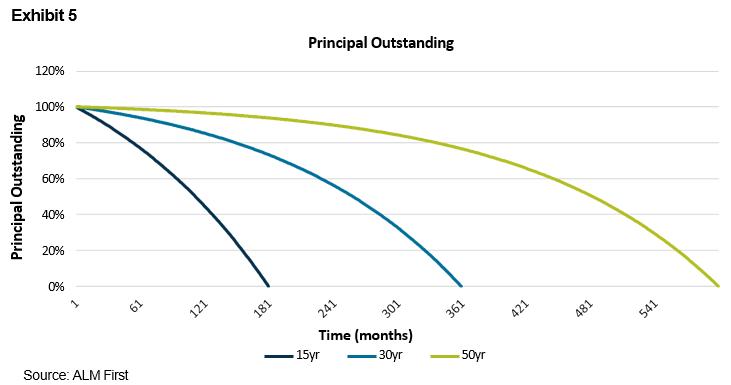
Additionally, a longer amortization term should result in a lower monthly payment, allowing more borrowers to afford a home, but the equity buildup would be much slower than with a 30-year loan. Exhibit 5 shows the principal reduction of 15-year, 30-year, and 50-year loans assuming an original balance of $350,000 and a note rate of 6.75% for each amortization term and no curtailments. As the graph shows, the pace of principal reduction for the 50-year mortgage is slow; after 30 years, the borrower with a 50-year mortgage has only paid down 23% of the original principal balance.
Our recommendations are unchanged from last month. We still like 15-year MBS relative to 30year MBS given valuations. 30-year MBS have done very well up and down the stack. Lower coupons, which started the year in the low-30s OAS area, are now trading in the mid-teens to Treasuries, well inside similar-duration ACMBS.
At the top of the stack, new production 30-year MBS are trading with OAS in the high-20s to low30s area, which puts them in the same range as higher coupon 15-year MBS, with 15-year 5.0s trading with OAS around 30 bps. Given similar OAS and the lower levels of convexity risk, we continue to prefer to add 15-year MBS on the margin.
We still like hybrid ARMs, though spreads have tightened since October. ARM issuance remains robust, with $4 billion issued last month, which is its highest level since September of 2014 according to BNP Paribas. This issuance was well absorbed, which is apparent in the MTD spread tightening. Offer spreads on 5.0 coupon G2 5/1s were in the 104/z area to end October and now sit at 95/z. OAS has tightened similarly, going from the mid-70s to mid-60s area currently. Lower coupon G2 5/1s, like 4.0s and 4.5s, are trading with OAS in the mid-to high-40s. It’s worth noting that dealer inventories are light now despite the higher issuance levels, so sourcing bonds can be challenging.
November was a negative month for the Bloomberg U.S. Agency CMBS Agg Index–particularly in maturity buckets further out on the curve. The 8.5+ year maturity bucket had the worst performance, underperforming duration-matched Treasuries by 25 bps. Overall, the index underperformed by a modest 2 bps, driven by spread widening across the curve. The index widened 2 bps, with the longest maturity bucket widening 5 bps. Year-to-date, the index has generated 77 bps of excess return versus Treasuries.
As we move into the final month of the year, we will review some of the themes we discussed at the beginning of the year and how they played out in 2025. To begin, we mentioned how supply and demand technicals would continue to drive performance in the sector. Particularly, would we see a significant enough rally in rates to see a meaningful increase in supply, and/or would we see bank demand continue to grow? The first part of this equation is easy the answer is certainly yes. Rates across the 5-, 7-, and 10-year parts of the curve dropped 71, 72, and 49 basis points through 11 months of the year, which has allowed year-to-date supply to far outpace the last two years. (Exhibit 6).
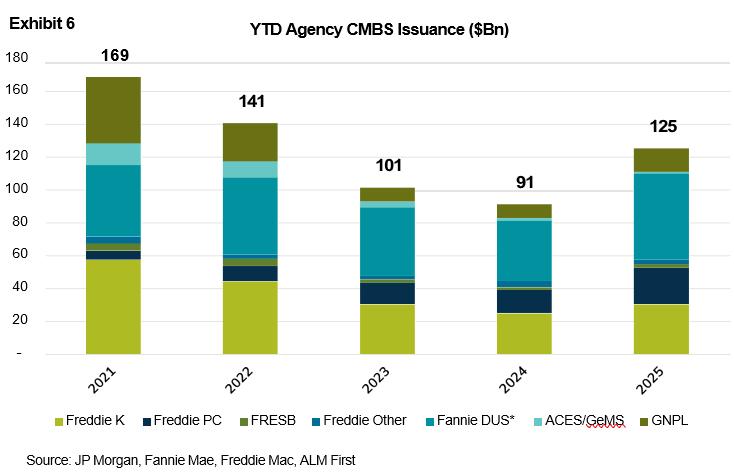
The increase in supply was specifically driven by increases in both Fannie DUS and Freddie PC originations, and to a lesser extent Ginnie Mae project loans. At the beginning of the year, many practitioners, including ALM First, had called for an increased focus on single loan products like DUS and PC from the GSEs, which is exactly what occurred as rates lowered and originations increased. This trend is something we’ve written about in numerous editions of this commentary and something we don’t expect to slow down anytime soon.
To answer the demand side of the equation, we can look at Exhibit 7 and see that, outside of the bounce wider post-Liberation Day, spreads for the most part traded sideways. Given that we know supply increased meaningfully, we can infer that demand kept up with the increase in supply. The increase in demand was driven by two different investor groups– those looking for duration and positive convexity, and those looking to take advantage of significantly negative swap spreads. While spreads have become less negative in recent weeks, for almost half of the year they hovered between -50 and -60 basis points, which drove significant demand from the asset swapping community.
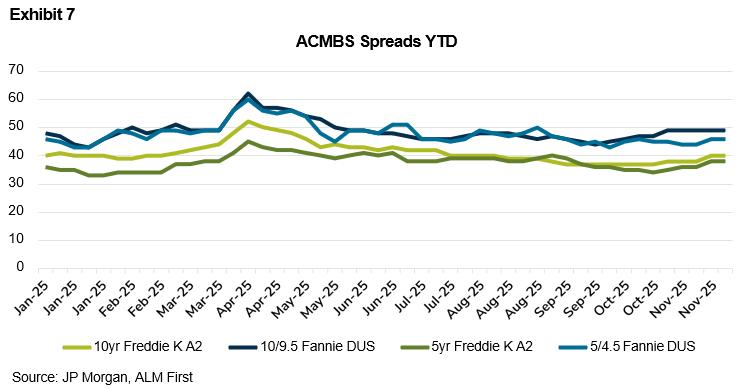
Ultimately, the year was relatively uneventful in Agency CMBS. Spreads largely moved sideways as demand followed supply linearly. Investors continue to view the asset class as a safe haven in times of uncertainty.
To close out the year, our recommendations remain largely unchanged. We still view the belly of the curve as our preferred duration bucket in the long run given the focus on originating supply further out the curve from the Agencies in the future. Freddie Ks have widened and can now be found in the mid-to-high 30s over Treasuries, with DUS in the mid-40s over Treasuries. Out the curve, spreads have backed up to the very-high 30s over Treasuries for secondary 10-year Freddie Ks and the high-40s for 10/9.5 DUS. Traditional floater investors will only have one more chance in new issue this year, with Freddie bringing its last mixed 5-year deal. Spreads on the floating rate tranche should be in the mid-50s DM range. As mentioned earlier, swap spreads have continued to widen (41 basis points at time of writing) so the attractiveness of synthetic floaters has deteriorated. With that said, swapped 10-year Freddie Ks can still generate ~80 basis points of spread over SOFR vs. the latest 10-year Freddie K floater priced at 61 basis points over SOFR.
• YTD supply overtakes 2024 volumes for 2nd consecutive banner year
• Despite moments of volatility, ABS spreads were resilient for much of 2025
• Gigital Infrastructure is the new subsector in vogue moving into 2026
ABS Spreads were rangebound to slightly tighter heading into the last month of the year. This was particularly true for tier 1 subprime auto subordinates, where there is still room to tighten versus where the market was pre-Tricolor. Additionally, with supply dwindling for the balance of the year, we should see spreads tighten, even if only slightly, all else equal. Year-to-date supply of $331 billion has surpassed that of 2024 and will mark the second consecutive year of record issuance. Given spreads across much of the sector are on the tight side of long-run averages, it’s easy to ensure demand is keeping up with the growth of the sector (Exhibit 8).
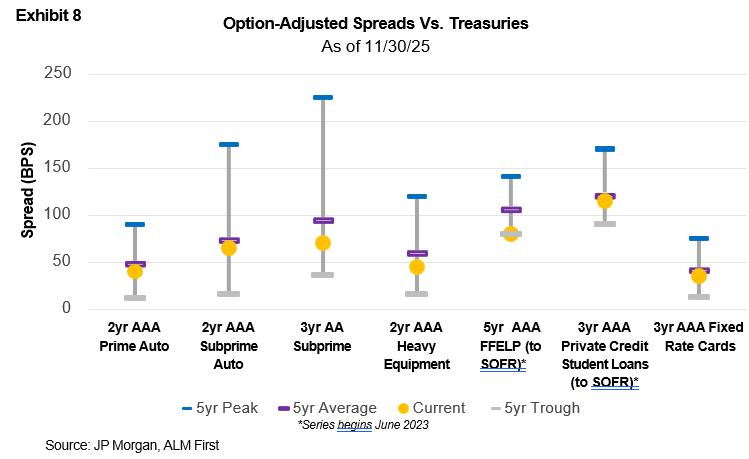
2025 was an eventful one for ABS markets – from macro headwinds to Liberation Day to credit concerns after the Tricolor fraud/bankruptcy, ABS markets remained resilient. While spreads were somewhat volatile during certain moments of uncertainty, they are ultimately rangebound or tighter YTD depending on the sector (Exhibit 9).
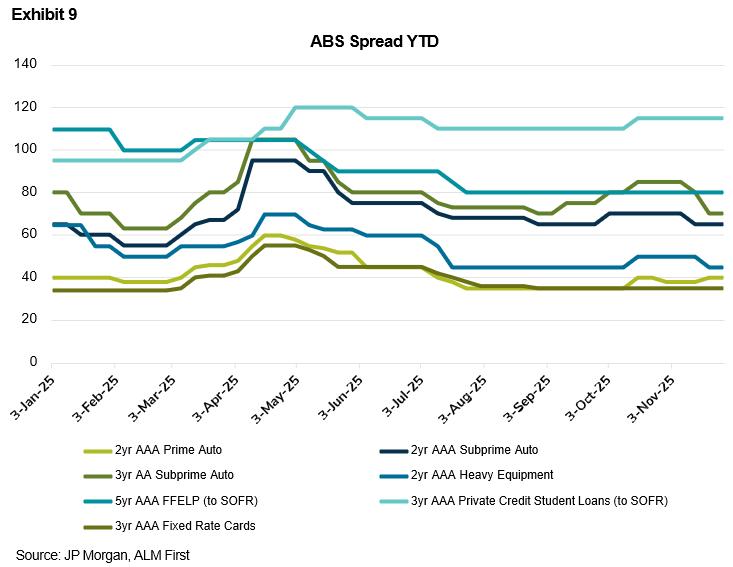
With that said, performance across some sectors did see pressure as the year went on. This was specifically true in subprime auto ABS, which arguably felt more pressure than any other sector between worsening delinquency and loss trends and the headline risk that came with the Tricolor bankruptcy. While the Tricolor bankruptcy did bring back necessary tiering across issuers, it’s important to also understand that delinquencies are still well below GFC levels for most issuers with sufficient history to compare. Additionally, the structures are built to withstand reasonable stress, as long as we don’t see unexpected economic weakness causing delinquencies and losses to exceed forecasts.
Another important theme of 2025 has been the expansion in data center and fiber ABS (digital infrastructure). Thus far, there has been a record $27 billion in digital infrastructure ABS new issue volume throughout 2025. This is up more than 50% versus 2024. Given the continued increase in investment in AI, based on current conditions, we expect this trend to continue and securitization volumes (ABS and CMBS) to increase as a result.
In the end, while there were moments that drove investors away temporarily, ABS generally rebounded efficiently. Many subsectors will finish the year trading well inside of long-run averages, theoretically capping upside as we move into 2026.
We remain defensive in the sector given that spreads are generally on the tight end of their historical range. While spreads have tightened in tier 1 subprime auto issuers, they could potentially see further credit tightening into the end of the year. However, this area of the market still carries headline risk given elevated losses and lingering uncertainty after Tricolor. Additionally, prime issuers offering subordinate classes could see potential spread tightening. With that said, returns in the most liquid areas of ABS are likely to remain subdued given the current level of spreads.
• AAA non-QM retreat +10-15 bps, settle in at +140-145 bps over Treasuries
• As the year wraps up, we review our themes for 2025 from January
• Credit remained strong, HPA underperformed, trade war concerns didn’t materialize
• Given strong demand for credit, AAA non-QM remains the cheapest RMBS option
Not unlike other risk assets, mortgage credit spreads decompressed in November, particularly at the top of the capital structure. As the bid for credit remains strong, bonds further down the cash flow waterfall have traded more range-bound in both the primary and secondary markets, making a compelling argument for AAA paper appearing cheap on a relative basis. For example, the basis – or spread differential – between AAA and BBB non-QM sits near the tightest levels on record (+70-80 bps). A deluge of supply was still generally well absorbed throughout the month, as sponsors brought 16 more non-QM deals to market, though AAAs were the most challenging to sell. Ultimately, spreads for the most senior bonds widened 10-15 bps, with Tier 1/2 names now settling into the 140-145 bps over Treasuries area, roughly in line with the 3-year average.
As we wrap up 2025, the headlines for non-agency RMBS remain largely positive. Record supply –both in originations and securitization – for the most mature mortgage credit sector (non-QM) and its largest growth area (HELOC/CES) demonstrate a healthy and well-functioning post-crisis RMBS
market. Let’s briefly review the 2025 themes we discussed back in January, evaluating their merits with the benefit of hindsight:
1. Underlying credit fundamentals are healthy, and should generally remain so throughout 2025, but more credit impaired borrowers could face debt service pressure.
2. Reversal of HPA tailwind experienced throughout the post-pandemic era – 2-3% maximum growth over the year, fiscal policy uncertainty could weigh on demand.
3. Whether the back bid remains for Agency MBS could heavily influence mortgage credit spreads.
4. Target shorter spread duration profiles – ideally, AAA-A non-QM.
Our assessment heading into the year was that the prevalence of layered risk was still low, especially for non-QM, and credit fundamentals should remain healthy – and they have. Although loss severities have risen slightly higher near the tail end of the year, loans liquidated with a loss inside non-QM trusts have continued to perform well relative to reasonable concerns over this population of borrowers with losses remaining below 1%. Not unlike other asset classes, such as Ginnie Mae mortgages, or subprime auto borrowers, the more credit-impaired non-QM borrowers (< 700 FICO) underperformed over the year, and loans with higher balances have continued to demonstrate a higher incidence of transition into delinquency. Overall, underwriting standards remain relatively strong, with sensible compensating factors in place on riskier loans.
The consensus estimates for national home price appreciation (HPA) settled around 2-3% heading into the year, and we were generally aligned with that figure. Although we only have data available through September at this point, it’s unlikely U.S. housing will reach the lower bound of that range. Unlike the heavily trafficked summer months, winter tends to bring weakened demand. Although financing costs have dipped recently, Bankrate’s national average 30-year mortgage estimate still sits at over 6% as we roll into December. Year-to-date, HPA nationally is just north of 1%, and will likely settle there for the full year. Concerns over a new presidential administration and the potential fallout from a prolonged trade war didn’t materialize, but uncertainty remains over both monetary, and to a lesser extent, fiscal policy. With affordability constrained, a catalyst for further HPA into 2026 seems unlikely. We’ll discuss the topic more next month in our 2026 outlook.
Still, regional, idiosyncratic risk exists. Despite a resilient U.S. economy, further softening in labor and elevated inventory levels could weigh on regional HPA. Exhibit 10 highlights the most active
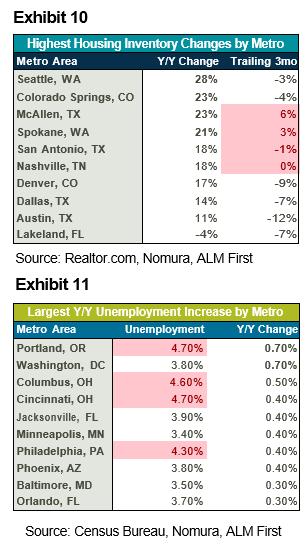
housing inventory markets on a year-over-year (YoY) and trailing 3-month basis, with Western metro areas such as Colorado and the Pacific Northwest seeing among the largest increases YoY. We would expect these areas to underperform on HPA in the short/medium term if the trend continues and could impact issuers with a larger presence there, such as SEMT (Redwood). Further, Exhibit 11 looks at the largest YoY increases in unemployment by major metro area, with Portland leading the way. To complete the picture, we would be less cavalier about loan pools with higher concentrations of the Pacific Northwest and assign a higher probability of default, warranting more risk premium. Moreover, newly enacted immigration policies could further weigh on demand broadly, and then more regionally. West Coast hubs such as the Bay Area, Silicon Valley, and the Pacific Northwest are squarely in the crosshairs given their labor force skew.
The bank bid still has not fully returned for Agency MBS, but it didn’t seem to impact mortgage credit much. With greater sponsorship and market adoption for the largest RMBS product, non-QM, spreads have traded relatively range-bound throughout the year, apart from the immediate aftermath of Liberation Day. In fact, early in the year, AAA bonds touched levels not seen since 2022 (+110 bps over Treasuries). Next year should provide the most legitimate test for mortgage credit in the post-crisis era, for more recently originated loans (2023 and beyond). HPA is generally expected to be anemic, which would mean 2 consecutive years of flat home price growth. Fortunately, most loans are not underwritten with much leverage, but in the bear case scenario, where home prices actually drop, resiliency of homeowners could be tested.
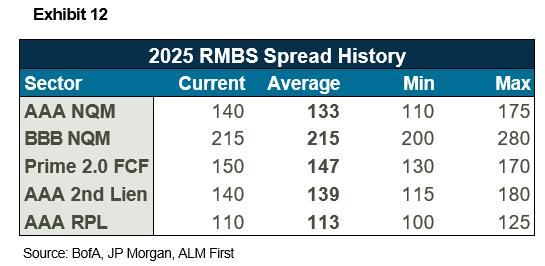
Shortening spread duration was one of our major themes for all risk assets heading into the year, and the same applied to mortgage credit. For ALM First, that generally took the form of senior nonQM as ideal positioning, given their relative cash flow certainty, pro-rata paydown structure, and coupon step-ups that incentivize issuer calls. That theory paid off during April/May as spreads widened considerably from 2025 tights (Exhibit 12) and remains our preferred recommendation heading into 2026 regardless of risk premiums compressing marginally.
As we head into December, our view on RMBS hasn’t changed much. Position defensively both within the capital structure and with superior collateral profiles, given where valuations are. Generally, we believe the probability of loss or delinquency triggers being breached over time is low for the largest mortgage credit product, non-QM. Under that premise, we’re comfortable buying AA or A rated non-QM assuming risk compensation is still adequate relative to the AAA alternative. Based on current conditions, In our view, AAA non-QM remains the most scalable and efficient form of mortgage credit exposure, and among the most attractive assets to add to shortduration IG portfolios.
• IG Corporates saw spread widening into the month-end, leading to underperformance compared to duration-matched treasuries
• Market for IG Corporate debt appears closely aligned with the outlook coming into 2025. Leaving recommendations and the need for beta management unchanged throughout the year
There was no slowing down in issuance for the U.S. Corporate Investment Grade sector in November. The month saw major companies like Alphabet and Amazon issue $17.5 billion and $15 billion, respectively. The current Investment Grade new-issue total sits well above $1.6 trillion in gross issuance, making 2025 the second-highest year for issuance, trailing only 2020’s total. Companies are taking advantage of benchmark rates, which continue to move lower, and credit spreads remain around historically tight levels. Though at the end of the month, spreads did drift 2 bps wider, leading the Bloomberg U.S. Corporate Index to underperform duration-matched Treasuries, by 0.02%. Excess returns year-to-date sit at 0.92% over duration-matched treasuries, putting the sector on track for the third straight year of outperformance.
As the calendar turns to the last month of 2025, we start looking back at the themes for IG Credit from January. Our outlook for IG Credit in 2025 centered on three main themes: rich corporate valuations, a risk of financial deterioration leading to ratings action, and tight spread dispersion across sectors. Nearly a year later, and the same themes remain top of mind for investors in the sector as we review below:
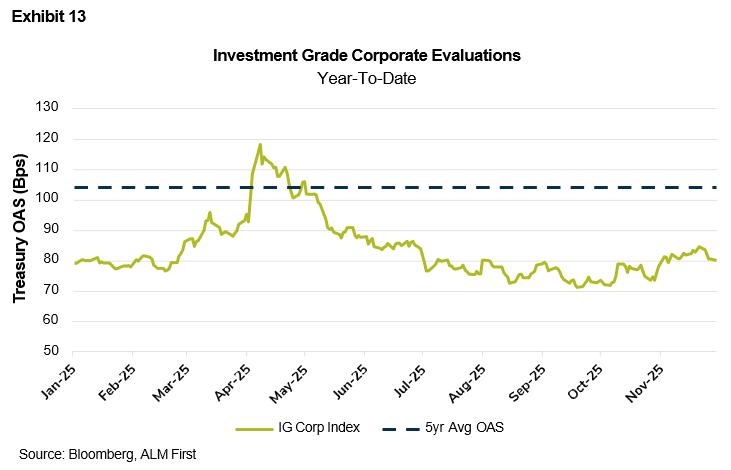
With credit spreads at historically rich levels heading into 2025, the main question was whether they could tighten further. As of November month-end, the sector is close to the same spread level to Treasuries seen at the end of 2024 (Exhibit 13). In April, investors saw a risk-off trade following the tariffs the Trump Administration announced on Liberation Day (April 2nd), which caused corporate spreads to widen above the 5-year average. However, it only took two months for the spreads to return to the level before the tariff volatility. The overall index spread for the second half of 2025 has remained rangebound between 75 and 85 bps, suggesting the ~80 bps level may be the new floor for credit valuations, as the market has only pushed valuations slightly richer. For investors, all-in yields remain high, with the Bloomberg U.S. Corporate Index holding a ~4.80% YTM. The higher yields have helped keep foreign and domestic demand for corporate credit stable and strong.
Second, credit fundamentals continue to drive positive performance as companies improve their balance sheets through earnings growth. This has led to investment-grade upgrades heavily outpacing downgrades year-to-date, 208 to 71 from S&P. Even without upgrades, the 11% earnings growth of S&P 500 companies in the 3rd quarter of 2025 has helped offset concerns and maintain rich levels in corporate debt. In our January commentary, we mentioned that mergers and acquisitions (M&A) activity can trigger negative ratings actions due to the leverage it creates. There has been a pickup in M&A activity, but not enough to make a noticeable difference in credit fundamentals. M&A will remain a key theme in 2026 as activity begins to pick up under the current administration. The expectation is for activity to return to pre-COVID levels, with consumer and healthcare leading M&A issuance.
The third theme for 2025 was the tightness of dispersion in spreads across the IG universe, well below the historical median. Even with one month to go in 2025, spread dispersion remains a critical component of the market, as seen in Exhibit 14, where dispersion in the 7 to 10 year part of the curve has tightened even further from the start of the year. This has led to a difficult environment where the beta, or general market sensitivity, is assumed to be the primary driver of future excess returns. In other words, there is less runway or opportunity for individual names to generate outperformance. Our preference to move up in quality persists as we remain defensive due to the lower opportunity cost. However, idiosyncratic risks remain a key component of any credit-exposed asset. Exhibit 15 displays the year-to-date excess returns, which, though at the sector level, are remarkably similar YTD. The main areas to highlight are the poor performance in both communications and technology. Fallen angels, companies downgraded from IG to HY, can be a significant hit to overall performance and another reason why security monitoring is crucial. Warner Bros Discovery (WBD), the entertainment conglomerate, was relegated to high-yield, which reclassified $31 billion in index-eligible debt and dragged down the sector's overall performance. The other sector that struggled this year has been technology, which has faced recent headwinds from the AI trade, reducing its excess return in 2025.
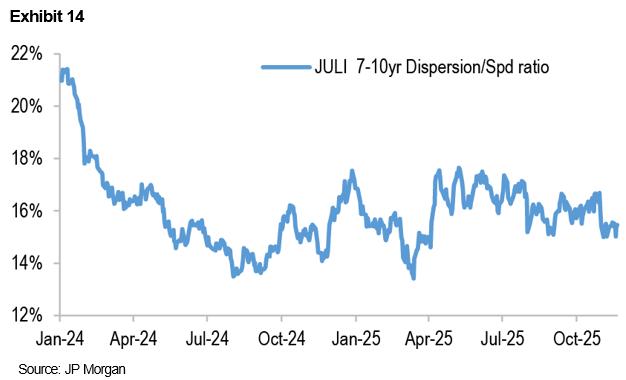
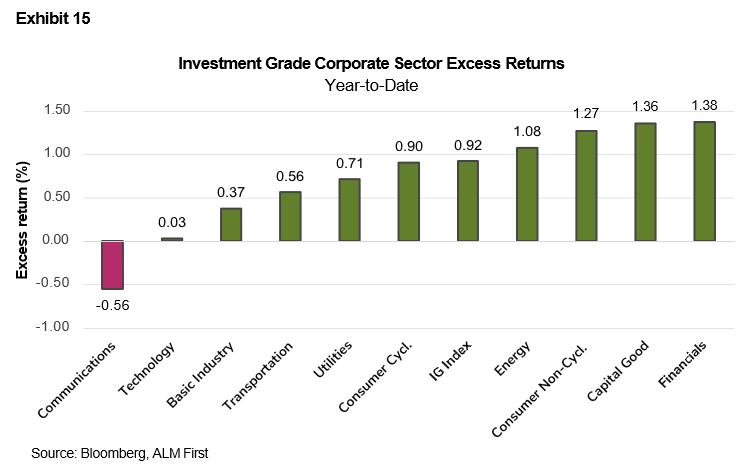
Spreads cheapened in November, though they remain in a tight dispersion across Investment Grade Corporate sectors (Exhibit 16). As mentioned above, beta management will remain a critical component of performance, with spreads remaining near historically rich levels. ALM First continues to recommend overweighting lower-BETA sectors (<1), such as utilities, to stay insulated from external risk-off events. Companies found in these sectors have lower volatility than the overall index and are defensive on the downside. November showed the benefits of this sector selection amid the risk-off trade in the technology sector, driven by AI fears.
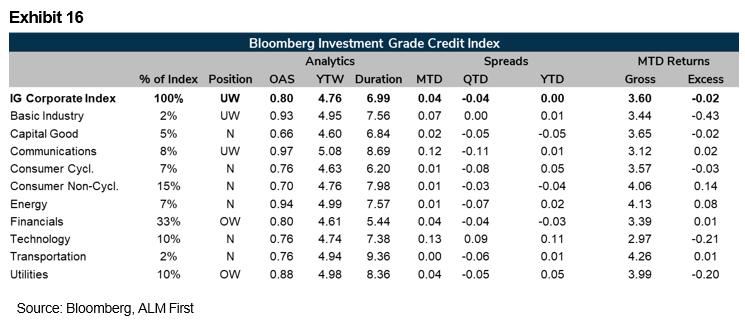
• The rally in benchmark yields in November contributed to positive total returns across the U.S. fixed income spectrum
• Excess returns were mostly negative amid modest spread widening; we express caution in fixed income credit exposure to low-income borrowers
• ALM First’s model portfolios generated positive total returns in November, but excess returns were mixed
Fixed income total returns benefited from a rally in benchmark rates across much of the yield curve in November (Exhibit 17). While top-line returns were generally positive, excess returns versus duration-matched Treasuries were negative for several sectors amid modest spread widening over the month. One of the top-performing sectors since May, 30-year Agency MBS took a breather in November, underperforming Treasuries by 2 bps. On a year-to-date basis, the sector remains the top- performing investment-grade (IG) sector on an excess return basis. Agency 15year MBS also had a strong year in 2025, and it was one of the only IG sectors to outperform Treasuries in November.
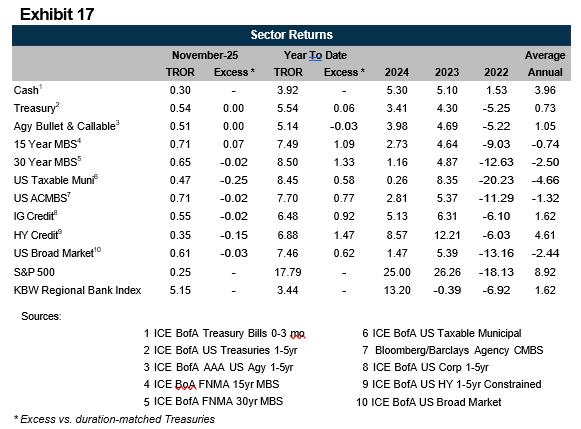
Fixed income spread sectors have performed very well since mid-April when the White House pulled back from the most severe tariff plan. At the same time, markets became more confident in pricing for the path of Fed interest rate policy, both of which contributed to a steady decline in expected rate volatility and tighter spreads. Most sectors are now trading below historical spread averages as we approach year-end, but demand remains relatively strong. Within credit sectors, we continue to be defensive on exposures to lower-income consumer borrowers, who have been more impacted by elevated inflation.
ALM First’s model portfolios all generated positive returns in November, but, like fixed income in general last month, excess returns were mixed (Exhibit 18). The Core Spread Portfolio produced a 0.49% return but underperformed the benchmark by 6 bps. The benchmark is comprised of Treasuries and Agency bullets, both of which benefited from the notable rally in front-end Treasury yields over the month, while modest spread widening weighed on several CSP positions. The Enhanced Liquidity Portfolio outperformed its benchmark by 3 bps in November with a 0.36% total return. The Short Duration Credit Portfolio, comprised of IG corporate bonds with 5-year or shorter maturities, underperformed its benchmark by 8 bps over the month. Year-to-date, the portfolio has produced a 6.83% total return (0.35% excess return), an illustration of how well fixed income credit has performed in 2025.
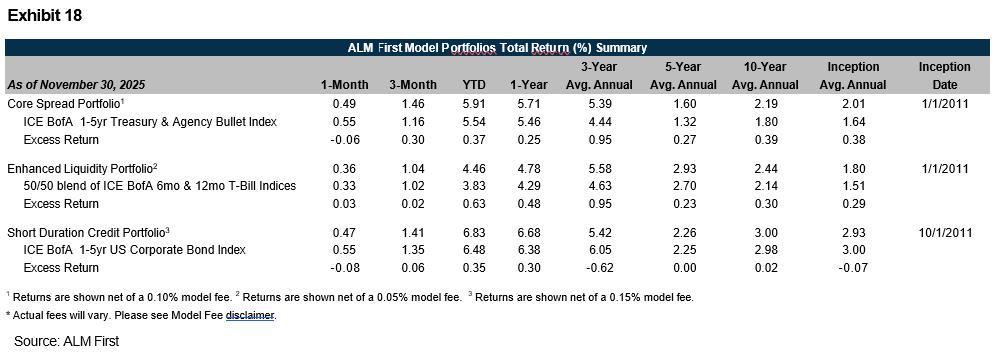
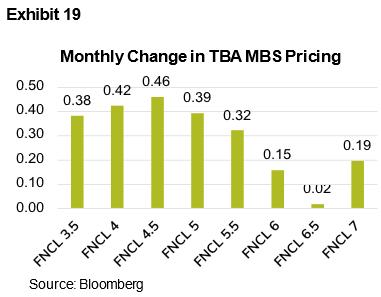
The 10-year U.S. Treasury rate (10CMT) ended the month at 4.01%, 6 basis points lower than at the end of October. The 2year/10-year spread on the Treasury curve steepened 2 basis points over the month of November as the 2-year rate decreased 9 basis points, ending the month at 3.49%. TBA MBS pricing primarily increased across the stack in response to the decrease in interest rates. The 30-year UMBS 5.0% coupon (denoted using the symbol FNCL 5), our most active hedging coupon, increased 0.39 points in price over the month. Exhibit 19 shows the change in TBA MBS pricing, which can be compared to Exhibit 20 showing a similar effect on the Fannie Mae cash loan pricing.
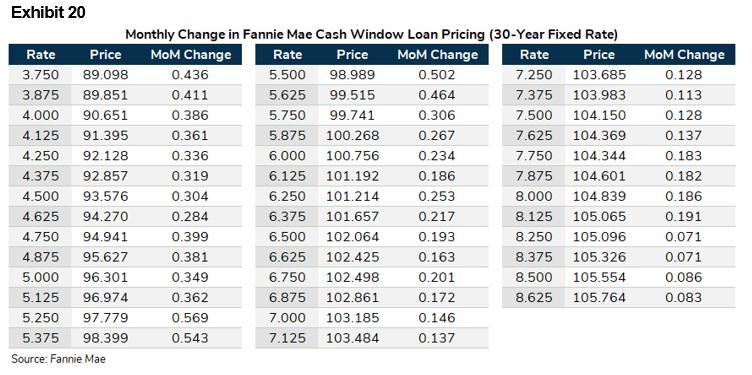
The primary/secondary (P/S) mortgage spread widened by 19 basis points since the end of October, as the mortgage primary rate (the rate a mortgage borrower may receive) increased and the par mortgage bond yield decreased (30-year UMBS yields). The 30-year primary mortgage rate, according to Bankrate, is 6.35%, which is 9 basis points higher than at the end of October. The par yield on 30-year UMBS is 5.01%, 10 basis points lower than at the end of October. The P/S spread is a general barometer of mortgage profitability. It has become increasingly volatile since the beginning of 2022, as interest rate volatility has impacted bond yields and liquidity pressures facing lenders. Exhibit 21 shows the P/S spread from the beginning of 2020, and volatility of the P/S spread clearly visible from the beginning of 2022.
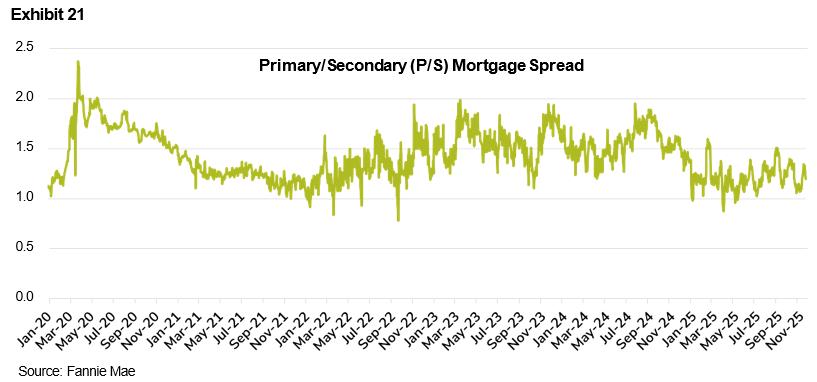
The net change in price (hedge cost) was negative 11 basis points, with an R-squared of 85.6% for the month of November in aggregate. The hedged cost is a net change in value for lenders hedging Fannie Mae and Freddie Mac (FMs) execution using TBA MBS contracts. Year-to-date the hedge cost is -95 basis points, equating to an average of -9 basis points monthly. Total hedge cost over the last twelve months was -106 basis points, representing an average of -9 basis points monthly.
A.SCOTT MACKNIGHT, CEO / PRESIDENT
The overall strategy has not experienced significant alterations since the fourth quarter of 2025. Growth in loans and deposits remains consistent, albeit at a diminished rate. Our overall expansion has been tempered by the demands associated with the core conversion. The extent of training and workforce resources required for this conversion is substantial and will inevitably impact our growth trajectory. Nonetheless, we remain committed to maintaining prudent assetliability management practices to ensure a healthy margin, strong net income, and an optimal capital ratio.
As we progress through this year, let us acknowledge the significance of maintaining equilibrium among the four pillars: leveraging new and existing technologies, ensuring compensation aligns with market rates, offering quality benefits at reasonable costs, and reducing our cost of funds.
The following paragraphs highlight some strategies on the balance sheet and income statement.
• Loans: Overall loan growth is projected to be 1.48%, equivalent to $8.6 million. Residential mortgages and HELOCs will serve as the primary contributors to this growth, followed by commercial real estate loans. Conversely, a decline is anticipated in the vehicle loan sector, largely due to amortization off the balance sheet resulting from past years' indirect lending strategies. We will continue to prioritize direct loans over indirect loans to maintain a 3% profit margin. Lastly, a reduction in commercial equipment loans is expected; however, this may prove advantageous contingent upon economic conditions.
• Investments: The budget indicates a growth of 2.3%, equivalent to $5.5 million. As the Chief Financial Officer aims to maximize our return on investments while addressing our liquidity needs, this sector will be affected by the frequency of Federal Reserve rate reductions. Nevertheless, at this stage, we will continue to invest in government-issued treasuries and mortgage-backed securities to maintain sound investment practices.
• Wholesale Borrowings: Our current strategy is to reduce our borrowings by 9.4%, equivalent to $6.9 million. This objective will be achieved through the amortizing advances implemented in 2025. However, the strategy may be adjusted if more favorable rates from the FHLB become available rather than in the certificate-of-deposit market. Our overarching goal remains to preserve a margin exceeding 3%.
• Deposits: the growth in shares is projected to be 2.6% or $18 million. Please refer to the balance sheet for the complete breakdown. Consumer savings and business checking are the primary contributors to this growth. The deposit group is confident it can achieve these targets through the implementation of various strategies. Examples include developing new deposit products, such as the emergency savings account, increasing balances in attorney accounts, and encouraging business members to transfer their operating accounts to us. These are only some of their strategies. This group convenes monthly to assess its progress and to make necessary adjustments.
• Assets: The net results of these strategies enhance the balance sheet by 1.7%, amounting to $14.8 million. This approach takes into account overall growth, profitability, asset-liability management, and liquidity requirements. In other words, maintaining a prudent and sound strategy as implemented in 2025.
• Net interest income is projected to increase by 6.2%, equating to $1.6 million. The net interest margin is expected to be 3.2% at year-end. The income breakdown is as follows: interest on loans increased by 3.3% to $1.1 million, while interest on investment income remained relatively stable. The increase is attributable to a reduction in the cost of funds. Consumer and business accounts are expected to decrease by approximately 3.7%, or $558,000.
• Noninterest income is projected to decrease by 16%, amounting to $1.2 million. Several factors contribute to this outlook. Firstly, plans are to reduce the overdraft protection fee from $30 to $25 to address the negative effects of inflation on our membership. Secondly, Senators Durbin and Marshall, along with other members of Congress, are advocating for a reduction in interchange fees. Regrettably, if they succeed, interchange revenue will decline; however, fraud costs will remain at their peak. The proposed legislation lacks accountability measures concerning fraudulent activities by merchants. Additionally, there are minor reductions in some other fees, though these are negligible.
• Non-interest expenses have risen markedly due to various contributing factors. The total increase is projected at 13.2%, amounting to $3.3 million. Firstly, personnel costs are expected to grow by 10.4%, equivalent to $1.1 million. This projection does not include the impact of the unusually high vacancy rate experienced over the previous year; as such, market volatility cannot
be reliably predicted for the current year. Additionally, the organization has created several new positions to address the credit union's evolving needs. Secondly, benefits are expected to increase by 57.8%, or $1.4 million. The Chief Financial Officer has previously provided explanations for this escalation. Last year, a $600,000 credit to expense was recognized, allowing the organization to offset expenses and thereby report minimal costs; this adjustment contributed to the overall reported increase. Lastly, office operations, specifically last year’s depreciation expense, was credited in the amount of $500,000 due to an adjustment we made based on the employee retention credit check from the US Government. Other non-interest expenses fluctuated slightly, either up or down, depending on the company's requirements. Overall, these changes are not material.
In Closing, additional assumptions incorporated into the budget warrant consideration. As of the date this budget was formulated in December, a 25-basis point reduction by the Federal Reserve for July was included. At that time, this appeared to reflect the Fed Futures consensus outlook. An equally significant factor is the workforce's capacity to manage the implementation of the core conversion alongside the expansion of the balance sheet. I have emphasized multiple times that the core conversion is highly demanding on our workforce resources; however, as outlined in the introduction, the executive team believed it could be accomplished. Lastly, the volatility of domestic and international political landscapes will influence us in ways that may presently be unforeseen, whether through regulatory changes, economic shifts, or fluctuations in consumer confidence.
As we move into 2026, the budget before you reflects both the strength of our current position and a clear-eyed understanding of the challenges ahead. The exceptional performance realized in 2025 has strengthened our capital base, improved our flexibility, and reinforced the soundness of our strategic direction. While we do not anticipate repeating this level of net income due to anticipated rate reductions and planned investments, most notably the core conversion, we enter the year from a position of confidence, stability, and disciplined financial management. All key ratios remain within policy, and our continued progress toward a 9% net worth ratio underscores our long-term commitment to safety and resilience.
Looking forward, management is focused on executing a balanced strategy that emphasizes sustainable loan growth, prudent funding management, and the preservation of a strong net interest margin, all while maintaining exceptional service to our members. We recognize uncertainties in the economic environment and remain vigilant in monitoring credit risk, expenses,
and liquidity. With a strong foundation, an engaged leadership team, and the Board’s continued guidance, Triangle Credit Union is well-positioned to navigate 2026 thoughtfully and responsibly, ensuring we remain a safe, sound, and member-centric cooperative for years to come.
Respectfully submitted,
A. Scott MacKnight
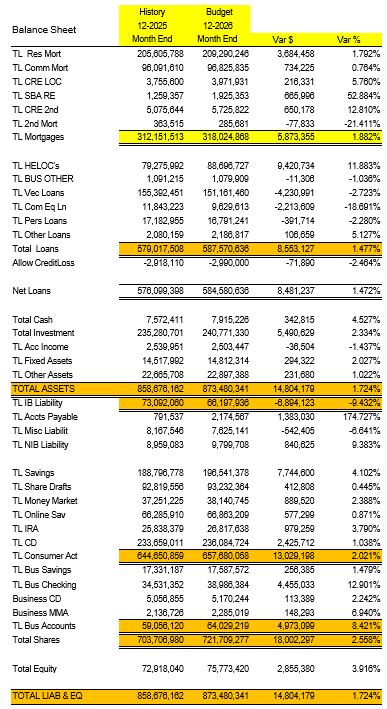
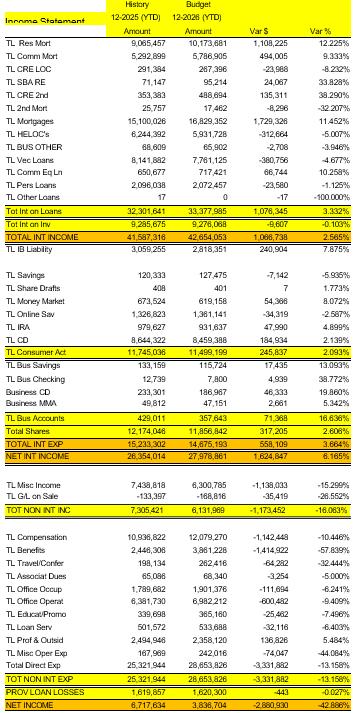
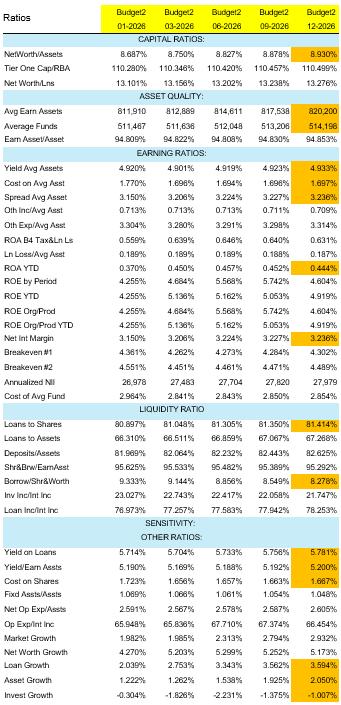
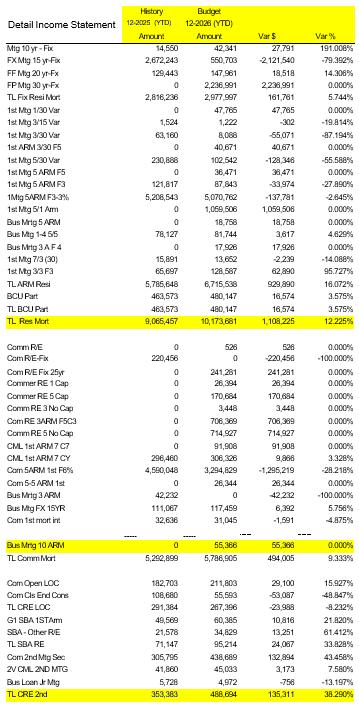
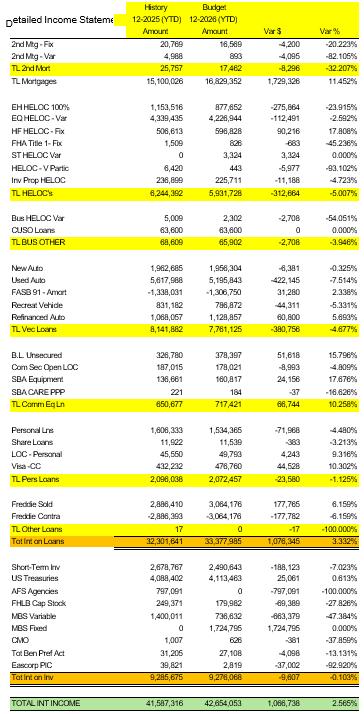
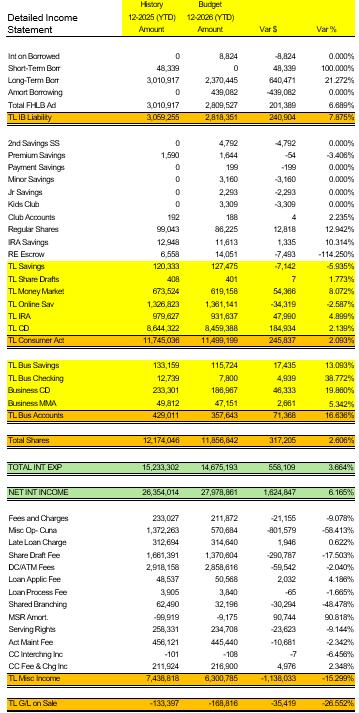
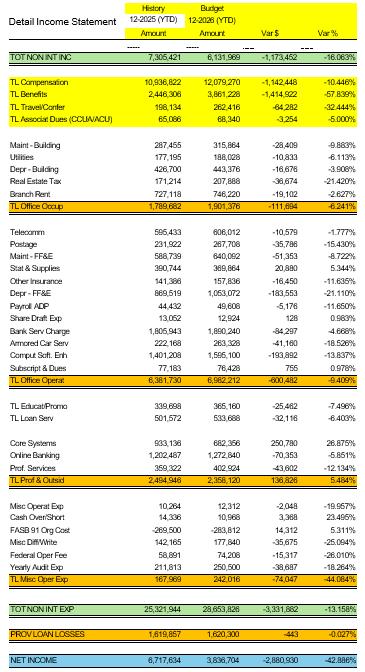
DATA FOR SIX YEARS
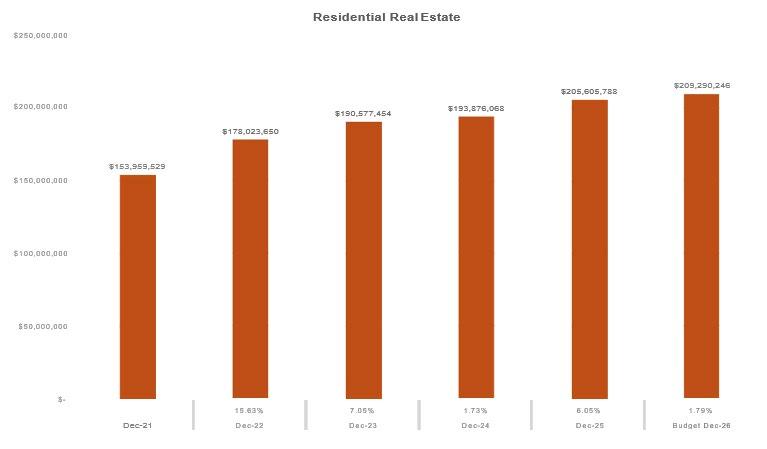
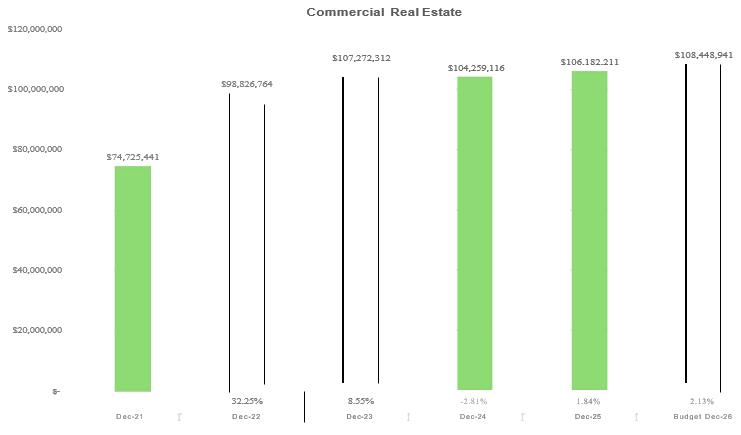
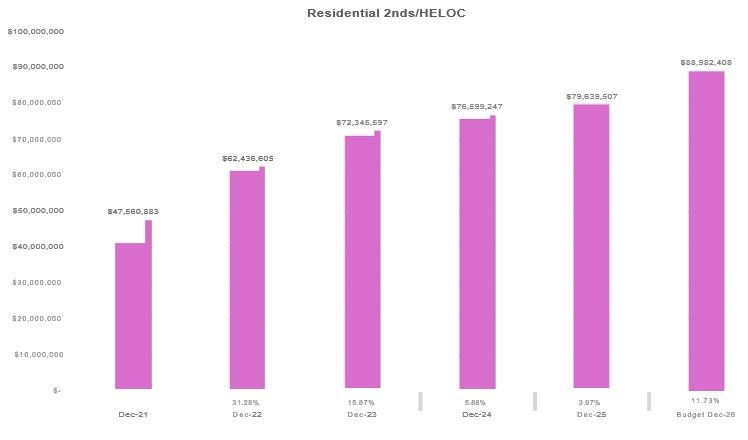
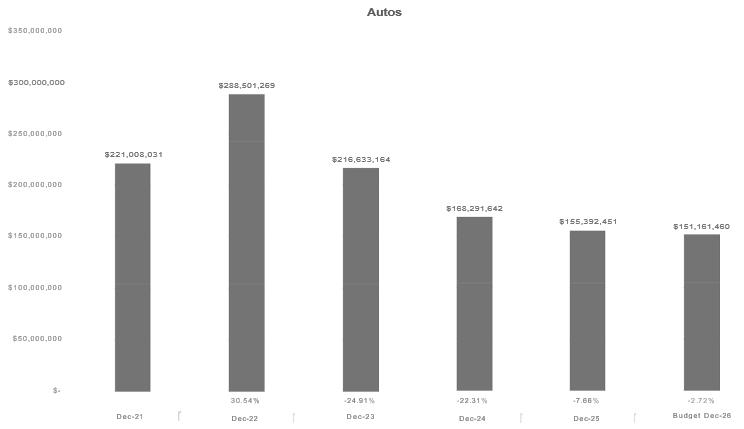
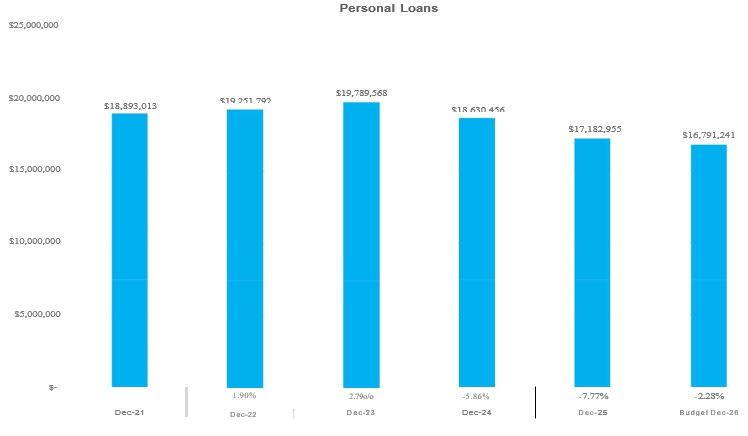
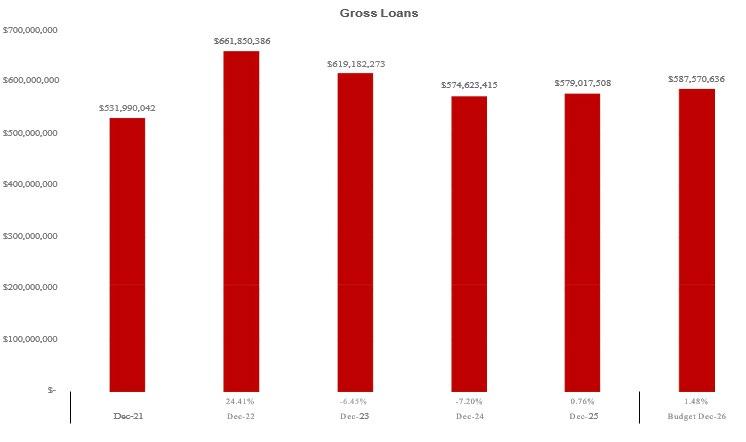
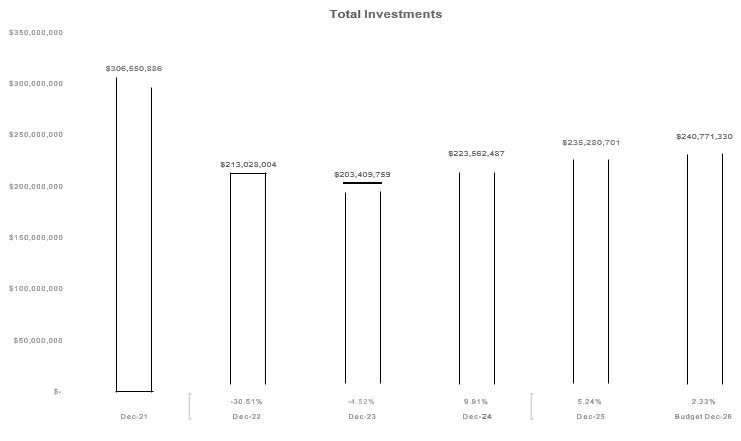
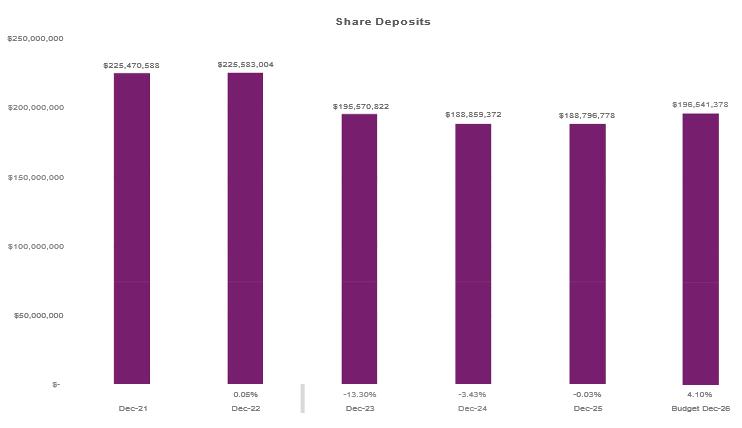
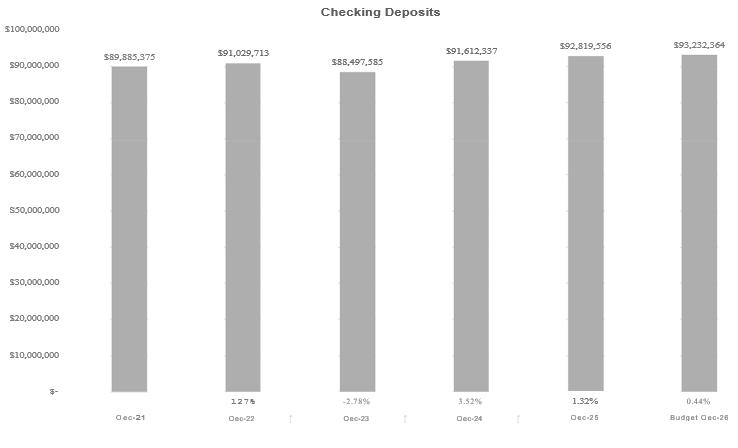
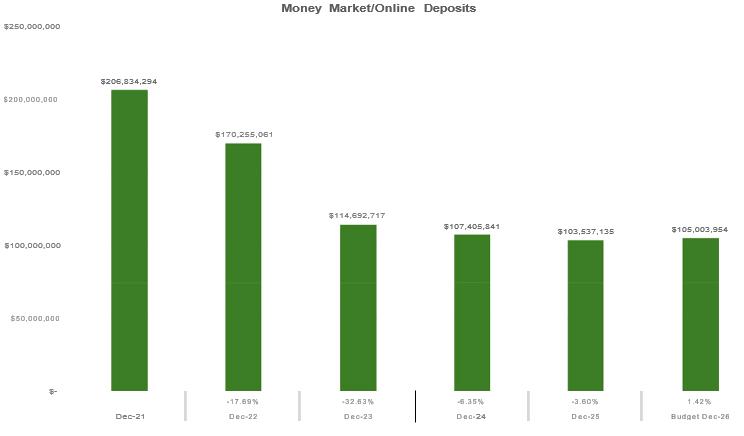
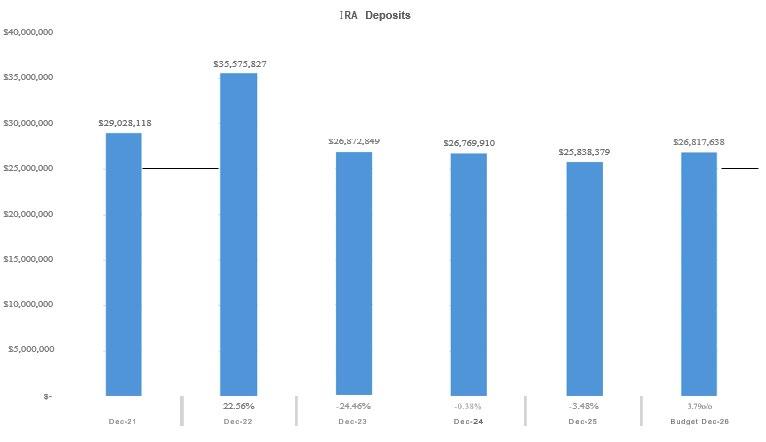
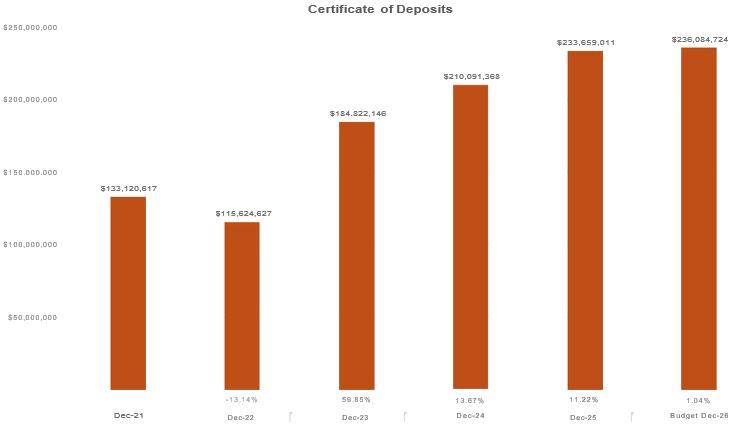
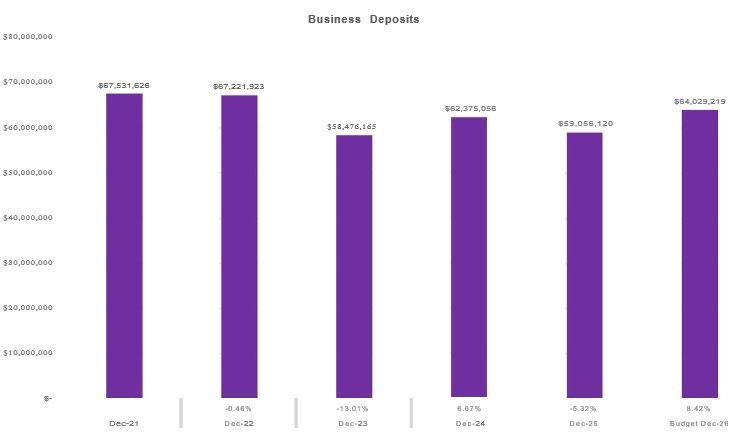
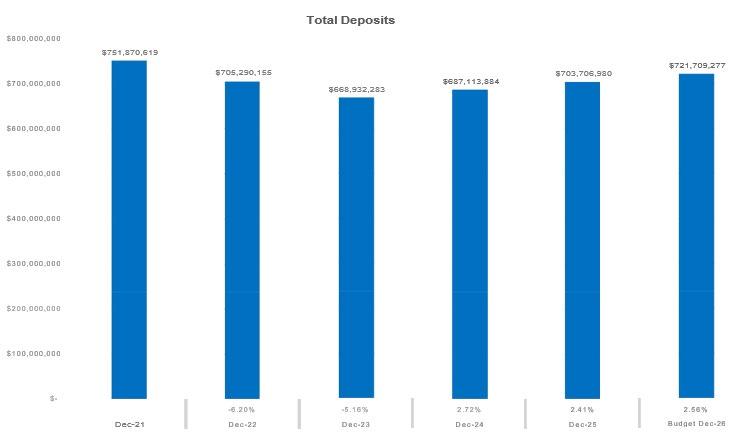
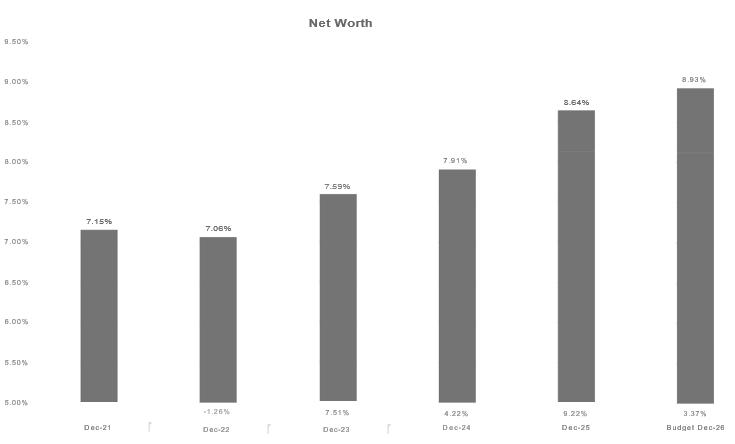
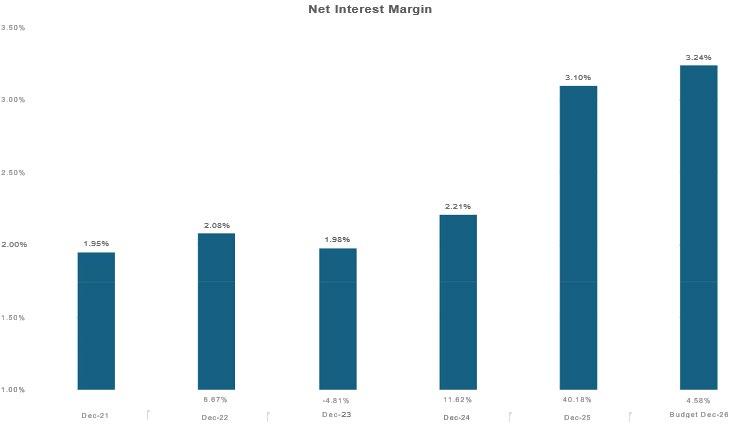
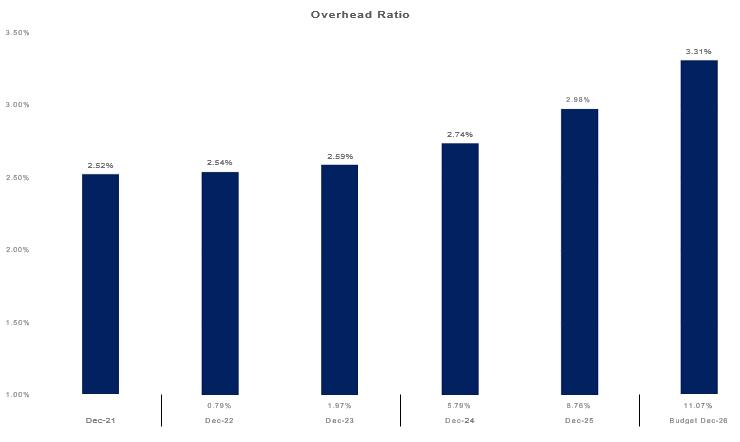
REBECCA THOMAS, CMO
In 2026, Triangle Credit Union’s Marketing, eCommerce, and Member Experience (MX) strategy is focused on driving sustainable growth by aligning with how members discover, evaluate, and engage with financial institutions in a rapidly evolving digital environment. As competition expands beyond traditional banks and credit unions to include fintechs, AI enabled platforms, and embedded financial services, Triangle will differentiate through relevance, trust, and ease of experience not simply expanded channel presence.
Marketing will transition from a channel first approach to a member intent and data driven growth model, using behavioral insights, life stage signals, and market opportunity analysis to guide acquisition, onboarding, and engagement efforts. Financial education platforms such as Triangle University and Making Money Personal will serve as core growth and trust drivers, optimized for AI discovery, video first consumption, and zero click search environments that increasingly influence consumer decision making.
Member Experience (MX) continues to advance a member centric, technology enabled, and insight driven operating model while operating in parallel with the organization’s core conversion initiative, scheduled for May. This strategy builds on a strong foundation of compliance and efficiency initiatives completed in 2025, which eliminated manual processes, mitigated risk, and strengthened organizational readiness entering conversion.
MX successfully led and supported the automation of business account opening, IRA and HSA workflows, and consumer account documentation initiatives that were efficiency and compliance driven, independent of conversion. As conversion progresses and continues post conversion, MX serves as a strategic Subject Matter Expert (SME), ensuring member centric considerations, experience continuity, and insight driven decision making remain embedded while leveraging prior insights and survey refinements to support change and expanded experience optimization.
Supporting technology adoption remains a key priority as Triangle introduces the new core and expands digital capabilities and efficiencies. Marketing, eCommerce, and MX will collaborate closely to ensure new technologies are integrated through experience led design, proactive education, and trust first communication, helping members understand how digital and AI enabled enhancements improve outcomes while preserving access to human support.
Together, these strategic priorities position Triangle Credit Union to increase membership and market share, reduce friction across the member lifecycle, and deepen long‑term relationships by
delivering personalized, seamless, and human‑centered financial experiences throughout 2026 and beyond.
1 – Driving Membership and Market Share
To drive sustainable membership growth in 2026, Triangle Credit Union will shift from channel first marketing to a member intent and data first growth model. Competition is no longer limited to local banks and credit unions; fintechs, AI‑powered financial apps, and embedded finance experiences are redefining how consumers discover and choose financial providers. As a result, visibility, relevance, and trust at the moment of intent are critical.
Marketing will partner with third party strategic advisors and internal analytics teams to continuously assess market opportunity, segment-level profitability, and product relevance. Rather than static annual segmentation, Triangle will evolve toward dynamic, behavior‑based audience modeling, allowing campaigns to adapt in near real time based on member actions, life events, and financial needs.
Throughout 2026, MX will maintain insight continuity by leveraging existing survey data, historical insights, frontline and member feedback, and operational indicators. When survey prioritization resumes, MX will collaborate to build and integrate the loan experience survey within the enterprise database and automate delivery and reporting to ensure scalability, accuracy, and efficiency prior to implementation. Following post conversion stabilization, MX will reintroduce and expand experience measurement including targeted loan, real time, and mortgage specific surveys supporting a more robust, actionable Voice of the Member program.
Growth efforts will prioritize:
• AI informed personalization across acquisition and onboarding journeys, delivering messaging, offers, and education based on behavioral signals rather than demographics alone.
• Machine readable and zero click visibility, ensuring Triangle content is structured to surface in AI search results, voice assistants, and recommendation engines not just traditional SERPs.
• Geographically adaptive messaging, tailoring creative, product emphasis, and community relevance by county and market density.
• Enterprise wide KPI visibility (NPS, CSAT, CES, RR, LTV, LEQI), trend identification across the full member lifecycle and proactive identification of experience risks and opportunities.
Triangle University and the Making Money Personal platform will become core growth engines rather than supporting assets. In 2026, financial education is a trust signal. SEO efforts will expand beyond keywords to include AI discoverability, video indexing, and structured content, positioning Triangle as a primary source for financial guidance across search, social, and AI driven discovery tools.
The Making Money Personal podcast will evolve into a video first, multi format content engine, producing long form conversational episodes alongside short form video clips optimized for YouTube, Instagram Reels, and emerging social discovery channels. This approach aligns with changing consumption habits and supports both brand authority and scalable content reuse.
Youth and teen financial literacy will shift toward short form, mobile native education, using video and interactive formats that meet younger audiences where they already engage. Parent focused education will remain critical, supported through webinars, downloadable resources, and guided digital experiences that reinforce Triangle’s role as a trusted financial partner for families.
Finally, Marketing, eCommerce, and Member Experience (MX) will collaborate with senior leadership to evaluate scalable, digital first product strategies, ensuring Triangle remains competitive as members increasingly compare offerings against non traditional financial platforms. By utilizing KPIs, we will be empowered to make timely, data-driven decisions to support our membership growth initiatives.
While major process inefficiencies are being addressed through automation and core conversion, the ongoing challenge for 2026 is ensuring these solutions continue to deliver seamless, modern, and consistent member experiences throughout the transition. As expectations evolve particularly among digitally focused members, MX must balance change management with experience continuity for both existing and prospective members.
We will maintain a strong Subject Matter Expert (SME) presence throughout core conversion and beyond, ensuring experience consistency, and operational alignment. Through close collaboration
with IT, Operations, Member Services and Compliance, MX will support ongoing optimization of automated workflows while monitoring member and employee feedback to identify improvement opportunities.
MX will continue to collaborate as a trusted SME, partnering cross functionally to optimize automated workflows, ensure system stability, support consistency, and member centric execution across the organization. This includes continued use of electronic forms, workflows, and end to end journey oversight will support consistent adoption and execution across channels, ensuring experience continuity during transition.
Optimization of processes, like opportunities found in Appointment Concierge, continues to be an opportunity for TCU to enhance member convenience, improve branch efficiency, and support a modern, digitally aligned service model. This opportunity will continue to be reviewed for solutions that align with the goals and objectives of Triangle.
As Triangle approaches and completes core conversion milestones, Marketing will play a more active role in:
• Supporting experience‑based loyalty initiatives, such as tiered relationships and bundled value propositions
• Communicating changes clearly to reduce confusion and abandonment
• Reinforcing trust during periods of system and process transition
Cross departmental collaboration will remain foundational, but in 2026 it will be more outcome driven. Shared KPIs tied to effort reduction, satisfaction, and completion rates will ensure that improvements are measured by member impact not internal activity.
Focus groups and targeted qualitative research will continue, but with increased emphasis on digital expectations, trust in automation, and perceived transparency, ensuring Triangle’s evolution aligns with modern member values.
Technology adoption in 2026 is no longer about introducing new tools it is about earning confidence in how technology is used. Members increasingly expect AI enabled speed and personalization, but only when paired with clarity, control, and human support.
Key priorities include:
• Introduce AI strategy to drive growth through relevance, discoverability, and trust. This includes AI search engine optimization, journey optimization, personalization, and automation of measurement.
• Experience led digital enablement, simplifying how members open accounts, complete forms, and manage products across channels.
• Proactive education, using targeted messaging, video walkthroughs, and contextual prompts to help members understand and adopt new capabilities
• Trust first communication, clearly explaining how data, automation, and AI improve outcomes without replacing human support
As Triangle continues building on open APIs and fintech partnerships, Marketing will help position these capabilities not as technical upgrades, but as member centric enhancements faster decisions, fewer steps, and more relevant financial support.
Cross functional project teams will continue to support data cleanup, validation, and testing, recognizing that clean data is foundational to personalization, automation, and AI driven engagement. Technology adoption success will be measured not just by usage, but by reduced effort, improved satisfaction, and increased relationship depth.
In 2026, value creation across Marketing, eCommerce, and Member Experience (MX) is driven by a tightly integrated approach that aligns growth, experience, and technology around member intent. Rather than operating as parallel functions, these teams will collectively orchestrate the end‑to‑end member lifecycle ensuring Triangle Credit Union delivers relevance, ease, and trust at every interaction.
Marketing’s primary role is to drive sustainable growth by ensuring Triangle is visible, relevant, and credible at the moment members are evaluating financial decisions. In an environment increasingly shaped by AI driven discovery, zero click search, and social first research behaviors, Marketing will focus on intent‑based engagement rather than volume‑based campaigning.
Key value drivers include:
• Leveraging behavioral and lifecycle insights to inform acquisition, onboarding, and engagement strategies
• Positioning financial education platforms such as Triangle University and Making Money Personal as core trust and growth engines
• Scaling video first, educational, and machine readable content to support AI discovery, search visibility, and social engagement
• Continuously optimizing campaigns based on performance insights, reducing acquisition costs while improving conversion quality
Marketing will measure success through engagement quality, conversion efficiency, discoverability, and contribution to long term relationship growth not campaign output alone.
eCommerce Value Contribution
eCommerce plays a critical role in transforming interest into action by ensuring digital experiences are intuitive, efficient, and confidence building. As digital channels continue to function as Triangle’s primary “front door,” eCommerce will focus on completion, adoption, and reduced effort, not just availability.
Key value drivers include:
• Optimizing digital journeys for account opening, lending, and self service to reduce abandonment and rework
• Supporting technology adoption through contextual education, guided experiences, and proactive digital support
• Partnering on data readiness and platform modernization to enable personalization, automation, and AI supported insights
• Ensuring trust first digital design by clearly communicating functionality, security, and access to human assistance
eCommerce success will be measured through completion rates, digital adoption, reduced support dependency, and improved member effort scores.
MX ensures that member feedback directly influences how Triangle operates, evolves, and prioritizes improvement. In 2026, MX will continue shifting from episodic feedback collection to continuous experience intelligence, translating insights into measurable action.
Key value drivers include:
• Capturing and analyzing feedback across key digital, lending, and service touchpoints
• Identifying systemic friction and experience breakdowns through trend and sentiment analysis
• Partnering cross functionally to prioritize improvements based on member impact
• Supporting post-conversion initiatives by monitoring experience risk and satisfaction in real time
MX will measure value through reductions in member effort, improvements in satisfaction and advocacy, faster resolution of experience issues, and sustained gains in loyalty metrics.
In 2026, Triangle Credit Union’s communication and delivery approach is designed to reinforce member engagement, support digital adoption, and ensure consistent execution across marketing, eCommerce, and frontline teams. Communications will be delivered through coordinated, data driven campaigns that leverage email, digital advertising, in app messaging, social channels, and targeted remarketing to re engage inactive members, promote relevant products, and drive new membership growth. Delivery is supported by robust performance tracking, including campaign attribution, re engagement measurement, and ongoing optimization of digital spend. Internally, regular training, feature communications, and enablement efforts ensure staff are prepared to confidently support new tools and initiatives. Together, this approach ensures timely, relevant messaging reaches members and employees at the right moments, while measurement and feedback loops enable continuous improvement and alignment with organizational growth and experience goals.
STRATEGIC INITATIVE
DESIRED OUTCOMES/TACTICAL IMPLEMENTATIONS & MEASUREMENTS
TARGETED IMPLEMENTATION DATE(S)
Expand and integrate digital content with increased short form video across multichannel marketing platforms to drive
Desired Outcome: A cohesive, datadriven marketing engine where content fuels performance and performance insights refine content.
Cadence: 1-2 videos per week beginning post conversion
scalable growth, increase brand awareness, and conversion efficiency through a content-led, performance-optimized approach.
1. Short Form Video Platforms: LinkedIn, Instagram Reels, YouTube Shorts
Focus: Finlit and security tips, promotional POVs, and podcast clips to build awareness, engagement, and retargetable audiences
2. Google Performance Max Campaigns: Always-on campaigns using first-party data and content engagement signals to optimize , display (video) and search assets powered by short form content to generate conversions and remarketing
3. Blog Content (SEO & Mid-Funnel Education): Adapted content aligned with video and podcast topics to capture search intent, establish credibility, and support conversion paths
4. Podcast: Weekly money tips and monthly full episodes featuring expert insights and customer storiesRepurpose episodes into short form video, blog content, and ad assets to position TCU as finlit leader.
Measurements/KPIs:
- Awareness: Video views, engagement rate
- Demand: Website traffic, content downloads
- Performance: Cost per conversion, ROAS
As determined by the quarterly promotional plan
Publish 2–4 high-quality, keywordfocused posts per month
Weekly money tips
Monthly full episodes
Bi-weekly shorts
Strategic Initiative
Data Analytics & Dashboards
Implement promo-code tracking within online lending applications to attribute performance by campaign; channel and centralize all codes in a tracking spreadsheet feeding succinctly into infographic dashboards that visualize KPIs (conversion rate, application completion, cost per funded loan, and ROMI) for targeted campaigns. Leverage campaign-level insights to power re-engagement initiatives, including abandoned application follow-ups and Google remarketing, optimizing spend and messaging based on real-time performance data.
- Influence: Assisted conversions and pipeline impact
Campaign Attribution Conversion Rate
What it measures: The percentage of users who complete a funded application after entering a promo code.
Why it matters: Confirms which campaigns and channels are driving qualified borrowers.
Formula: Funded Applications ÷
Promo-Code Applications
Dashboard view: Funnel visualization by campaign/channel.
Abandoned Application Re-engagement Rate
What it measures: The percentage of abandoned applicants who return and complete an application after remarketing or follow-up outreach.
Why it matters: Demonstrates the effectiveness of abandoned-cart reengagement and Google remarketing spend.
Formula: Re-engaged Completions ÷
Total Abandoned Applications
Dashboard view: Before/after comparison with uplift percentage.
Cost per Funded Loan (by Campaign)
What it measures: Total campaign spend divided by funded loans attributed to promo codes. Why it matters: Enables ROI-based budget optimization and quick identification of high-performing campaigns.
Targeted Implementation Date(s)
Promo code analysis and dashboard will be based on promotion and campaign plan
Promotional dashboards highlighting targeted KPIs, will be produced quarterly.
Strategic Initiative
Data Mining for Target Messaging
Data-driven member messaging engagement using Symitar, Arkalytics and Einstein to leverage and deliver personalized, valuefocused product
Desired Outcome/Tactical Implements and Measurements
Increase Member Engagement Through Personalized Messaging Measurement: Lift in open rates, click-through rates, and in-app engagement for targeted campaigns compared to non-personalized messaging.
Improve Product Offer Relevance and Conversion Measurement: Higher conversion rates and product uptake from datadriven offers delivered via Symitar, Arkalytics, and Einstein.
Optimize Marketing Efficiency and Member Experience Measurement: Reduced cost per acquisition and lower opt-out rates, alongside improved response rates from segmented, value-focused messaging.
Targeted Implementation Date(s)
Strategic Initiative
A/B Testing
Enhance A/B testing across multichannel marketing platforms to improve identified KPIs, such as subject lines, copy, graphics, CallTo-Actions (CTAs), and layout/format
Strategic Initiative
Digital Experience Roadmap
Maintain a rolling roadmap for online and mobile banking
Desired Outcome/Tactical Implements and Measurements
Identifying favorable content to improve KPIs across channels for opens, clicks, and conversions.
Target messaging begins in Q2 with data mining integration of Symitar, Arkalytics and Einstein beginning post conversion and ramping up into Q3 –Q4
Targeted Implementation Date(s)
Post conversion for quarterly promotions and campaigns.
Desired Outcome/Tactical Implements and Measurements
A coordinated, member-centric digital experience strategy that drives adoption, reduces friction, improves
Targeted Implementation Date(s)
Ongoing with additional enhancements introduced post
improvements, informed by stakeholder input, member feedback, and eComm ticket trends. Prioritize enhancements that improve usability, security, self-service, and overall member value, with quarterly feature releases and refinements.
staff readiness, and ensures continuous improvement of online and mobile banking capabilities throughout 2026 to include:
Member Communications: Proactively communicate new and enhanced digital features through email, in-app messaging, website banners, and social channels.
Focus messaging on clear member benefits (convenience, speed, security, and control).
Use simple, visual content (short videos, quick tips, FAQs) to drive awareness and adoption at launch and post-launch.
Internal Staff Communications & Enablement: Provide timely internal updates aligned to roadmap milestones so staff are informed ahead of member-facing releases.
Share concise feature briefs highlighting functionality, benefits, and common member questions based on eComm ticket activity.
Equip frontline and support teams with talking points to ensure consistent messaging and confident member support.
Quarterly Training Program: Conduct quarterly training sessions for internal teams focused on new and enhanced eComm products and features.
conversion. Many of these new marketing-type initiatives will require additional support.
Training content prioritized by stakeholder direction and highvolume or recurring eComm tickets.
Emphasize real-world use cases, member benefits, and troubleshooting insights to reduce support volume and improve firstcontact resolution.
Measurements & Feedback Loop: Track feature adoption, digital engagement, and eComm ticket trends post-launch.
Use insights to refine communications, inform future roadmap priorities, and continuously improve the digital experience.
BRIAN LUCE, PARTNER & A. SCOTT MACKNIGHT, CEO / PRESIDENT

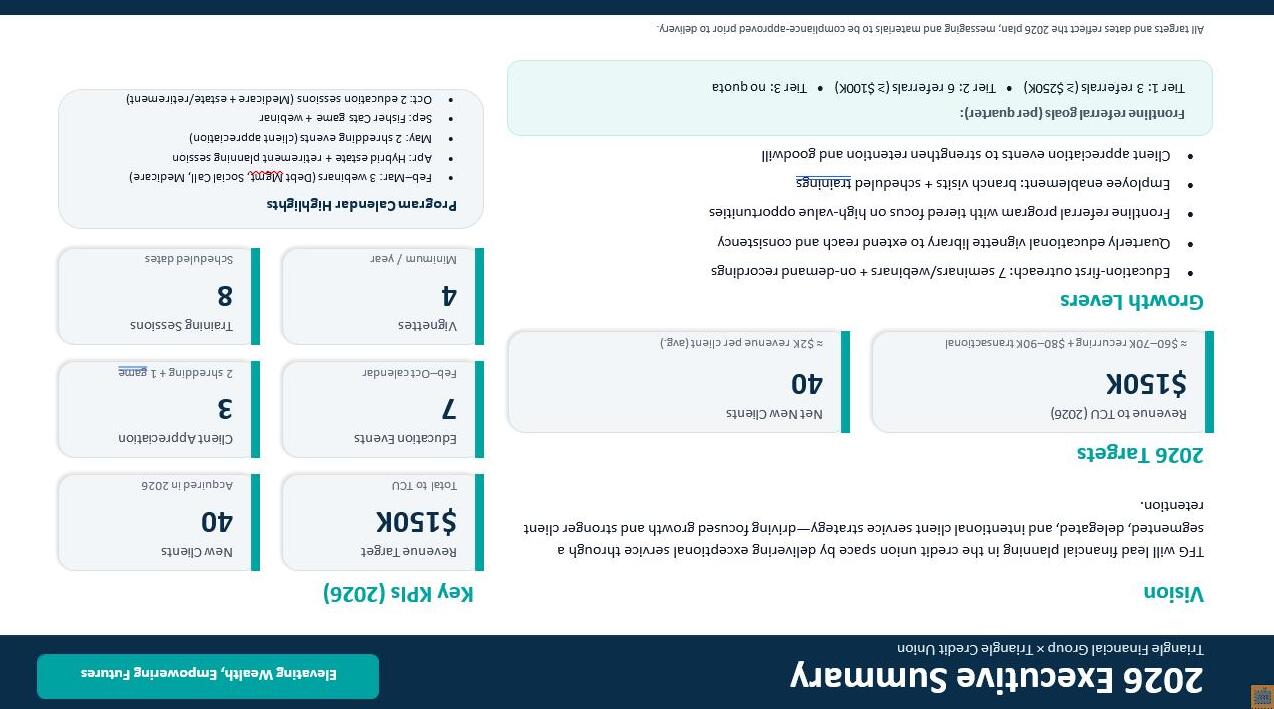
Triangle Financial Group is the premier financial planning entity in the credit union sector, collaborating with our top-ranked partner, Triangle Credit Union. Our dedicated team of advisors provides comprehensive support through a segmented, delegated, and intentional client service strategy, aimed at delivering exceptional service that fosters targeted growth and enhances client retention.
Integrity: Putting others' needs before your own, staying true to yourself by being honest with others, trusting each other to rely on, and remaining loyal to common goals.
Self-accountability: having the work ethic to be productive without having to be micro-managed; being independent to stay focused in the present and aligned to the future vision.
Knowledge: Continuous personal development to be great for others and yourself; the more you know, the more you can show your competency and confidence in what you do.
Teamwork: Having a diverse team of people collaborating to solve challenging problems through creative thinking. Cooperation to leverage individual skills for achieving common goals. All team members work toward a single vision to grow the business.
Philanthropy: The dedication to giving back to improving the community and making the world better.
Overview:
This 2026 Business Plan delineates Triangle Financial Group’s strategic vision to position itself as a premier resource in financial education and planning within the credit union sector, founded on principles of integrity, self-accountability, knowledge, teamwork, and philanthropy. The plan delineates ambitious growth objectives including achieving $150,000 in revenue for Triangle Credit Union and acquiring 40 new clients supported by a comprehensive seminar program, an expanding educational vignette library, enhanced frontline referral strategies, structured training initiatives, and significant client appreciation events. Collectively, these initiatives position the
organization to expand its educational influence, deepen client engagement, and promote sustainable, mission-aligned growth throughout the fiscal year.
Goals
Goal 1: Create $150,000 in revenue for Triangle Credit Union (TCU).
• Current $60,000 – $70,000 recurring
• $80,000 - $90,000 transactional
• Approximately $2,000 in revenue per client
Goal 2: Acquire 40 new clients.
Strategies:
Our library of seminar topics is designed to cater to diverse client needs and enhance financial literacy:
• Financial Literacy
• Retirement Income Planning
• Estate Planning
• Medicare & Social Security Other Potential Topics:
• Year-End Tax Planning (in collaboration with a CPA)
• First-Time Homebuyer Education
• College Planning Education
• Financial Planning for Businesses
• Business Exit Planning
• Business Transition Planning
• College Planning
• Cyber Security
• Common Money Mistakes
• Investment Basics
• Financial Goal Setting
• Becoming Financially Independent
Proposed Calendar
February 2026
• February 25: Debt Management+ Financial Momentum Building (Webinar) – AJ & Brian
March 2026
• March 12: Making a Social Call (Webinar) – AJ & Brian
• March 26: Medicare Planning (Webinar) – AJ & Brian
April 2026
• April 9: Estate Planning and Retirement Planning (Hybrid) – Brian, AJ
September 2026
• September 17: Making a Social Call (Webinar) – AJ & Brian
October 2026
• October 01: Medicare Planning (Webinar) – AJ & Brian
• October 15: Estate Planning and Retirement Planning (Hybrid) – Brian, AJ
To enhance and extend the impact of the seminar and webinar program, we will implement an educational vignette library focused on timely, seasonally relevant financial topics aligned with the evolving needs of our community and clients. The initiative will produce a minimum of one educational vignette per quarter, designed for on-demand consumption and long-term reuse.
This content will complement live educational events by creating a scalable, evergreen resource that reinforces credibility, supports ongoing engagement, and expands the organization’s digital presence. Vignettes will be concise, educational, and practical, allowing individuals to access guidance when and how it is most relevant to them.
Strategic Objectives:
• Extend the reach and lifespan of seminar content.
• Strengthening positioning as a trusted financial education resource.
• Support staff, referral partners, and community outreach efforts.
• Increase visibility and engagement through digital channels.
• Maintain consistent, compliance-approved educational messaging.
Over time, the vignette library will become a durable educational asset that supports business development, enhances client relationships, and reinforces the organization’s long-term commitment to financial education.
3. Frontline Referral Program
Referral Tiers:
• Tier 1: Minimum Deposit $250k (3 per Quarter)
o Incentive: $50 Gift Card & Entry into $250 Quarterly Gift Card Drawing
• Tier 2: Minimum Deposit $100k (6 per Quarter)
o Incentive: $50 Gift Card & Entry into $250 Quarterly Gift Card Drawing
• Tier 3: No Minimum Deposit (No Quota)
o No immediate incentive: upgraded if clients qualify for Tier 1 or 2 after fact-finding.
Program Goal: Ensure all credit union members receive proper financial services while focusing on high-value clients.
4. Training Schedule Monthly Branch Visits
• Duration: 5-10 minutes per branch
• Focus: Sales ideas, referral system overview
Online Employee Training Schedule
• Duration: 45-60 minutes
• Topics: TFG services, identifying good referrals, 3-tier referral system, converting Tier 3 clients to Tier 1 or 2.
• All employees attend one of the March to June Trainings and one of the September to November trainings
• Training Dates:
o 03/13/2026- 9AM
o 04/10/2026- 9AM
o 05/08/2026- 9AM
o 06/12/2026- 9AM
o 09/11/2026- 9AM
o 10/09/2026- 9AM
o 11/13/2026- 9AM
o 12/18/2026- 9AM
Branches:
1. Franklin St.
2. DW Highway
3. Amherst
4. Merrimack
5. Candia Rd.
6. Derry
7. Elm St. (Manchester)
8. St. Joes
9. Call Center, Mortgage, Commercial
5. Client Appreciation Events
Purpose: Strengthen client relationships and promote goodwill.
• Shredding Events:
• May 16: Client Appreciation – Shredding Event (Candia Rd.)
• May 23: Client Appreciation – Shredding Event (Franklin St.)
• Fisher Cats Home Game:
• September 09: Client Appreciation – Fisher Cats Home Game
• Flyer Creation: Design flyers promoting seminars, webinars, and client appreciation events.
• Presentation Development: Prepare compliance-approved presentations for all scheduled topics.
• Wholesaler Coordination: Engage with partners (Allianz, First Trust, Jackson Annuity, etc.) for retirement and estate planning resources.
In summary, this 2026 Business Plan positions Triangle Financial Group to advance its mission as a leading financial education and planning partner within the credit union sector by leveraging its core values, strategic seminar programming, digital educational expansion, enhanced referral systems, and systematic staff training. Through these coordinated initiatives supported by meaningful client appreciation events and deepening collaboration with Triangle Credit Union the organization is poised to strengthen client relationships, drive sustainable revenue growth, and expand its long-term educational impact across the communities it serves. By remaining intentional, client-focused, and growth-minded, Triangle Financial Group is well-equipped to deliver measurable results that reinforce its role as a trusted financial resource throughout 2026 and beyond.
ZIEMBA,
The commercial lending market in New Hampshire is noted for its stability and emphasis on relationships, with local community and regional banks as well as credit unions being the preferred lenders. These institutions prioritize borrowers who demonstrate stable cash flow and an established track record, particularly those seeking loans for owner-occupied properties or industrial assets in southern New Hampshire.
Looking ahead to 2026, the outlook for commercial loans across the state remains steady and resilient. Community banks and credit unions continue to drive relationship-based lending, even amid national economic uncertainty. Although higher interest rates may continue, demand for loans remains strong, and financing is available for projects supported by robust cash flow and solid borrower credentials.
Currently, lenders are concentrating on high-quality loans that show positive cash flow. While some caution persists due to potential economic challenges, the general forecast for commercial real estate, including multifamily, industrial, and retail sectors remains optimistic.
The Commercial Services Department will continue with its current mission of providing highly personal and professional commercial banking services to the small to mid-sized businesses located within our community.
The new budget was developed with the understanding that total loan balances are projected to remain stable in the coming year. The forecast places increased importance on new loan participations, takes into account the effects of a high-interest rate environment, and anticipates potential loan payoffs within our seasoned commercial portfolio. In recent years, the credit union has demonstrated a strong commitment to enhancing the financial well-being of the diverse minority groups within our community.
The New Hampshire office market ended 2025 with modest overall shifts in both vacancies and rental rates, masking sharp changes across property classes and submarkets. Vacancy rose slightly to 13.8% while average rental rates climbed to $21.75 modified gross. Strong small-space demand from medical and professional services tenants provided consistent activity, while officeto-residential conversions reshaped inventory composition, particularly in Class C properties. Companies held existing space while assessing workplace needs, creating a relatively quiet leasing market as most delayed major decisions until lease expirations approach.
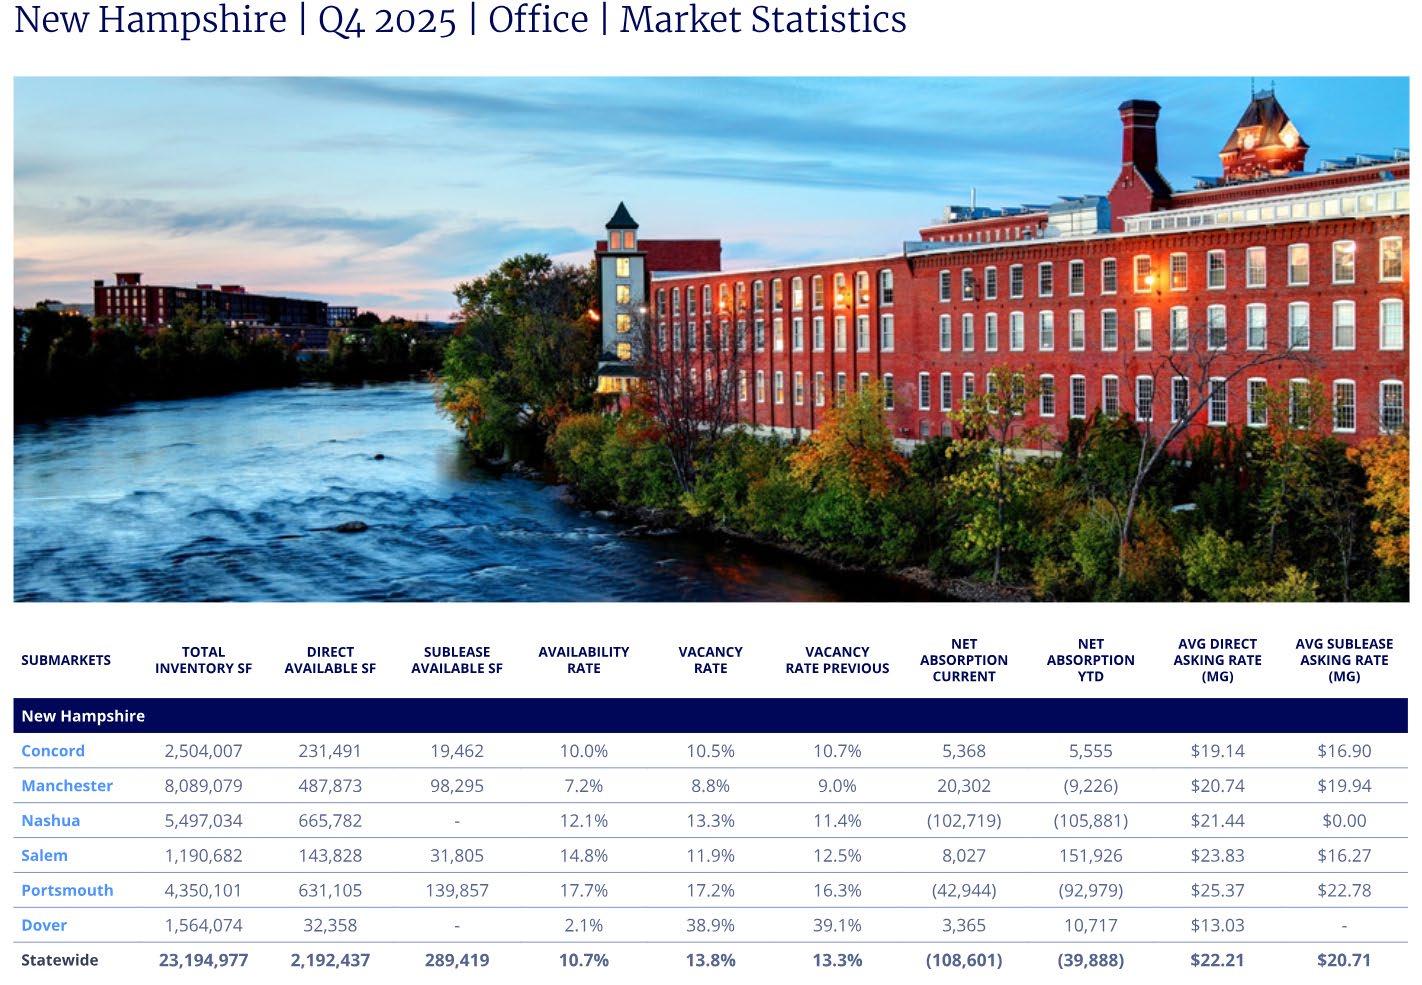
The New Hampshire industrial market closed 2025 with clear category divergence, as warehouse users absorbed over 514,000 SF while manufacturing gave back 635,000 SF. The industrial vacancy rate reached 5.9% and rental rates dropped 2.6% to $11.26 NNN. Investment sales activity surged in the second half of the year, with Q4 transactions averaging $198 PSF as both local and national investors competed for stabilized assets.
• Category Divergence: Warehouse sector absorbed over 514,000 SF while manufacturing gave back 635,000 SF, showing opposite market trends.
• Rate Compression: Pricing gap between property types nearly eliminated, with manufacturing, flex, and warehouse rates now within $0.30 PSF of each other.
• Investment Activity: Notable uptick in sales during second half of 2025, with nearly all properties traded fully occupied.
• Pricing Stabilization: Rate declines slowed in Q4 as prices level off from pandemic highs.
The market's narrative – warehouse fundamentals remain strong with steady small tenant demand, while manufacturing inventory presents value-add opportunities for repositioning – positions both tenants and investors to capitalize on targeted opportunities across New Hampshire's industrial sectors.
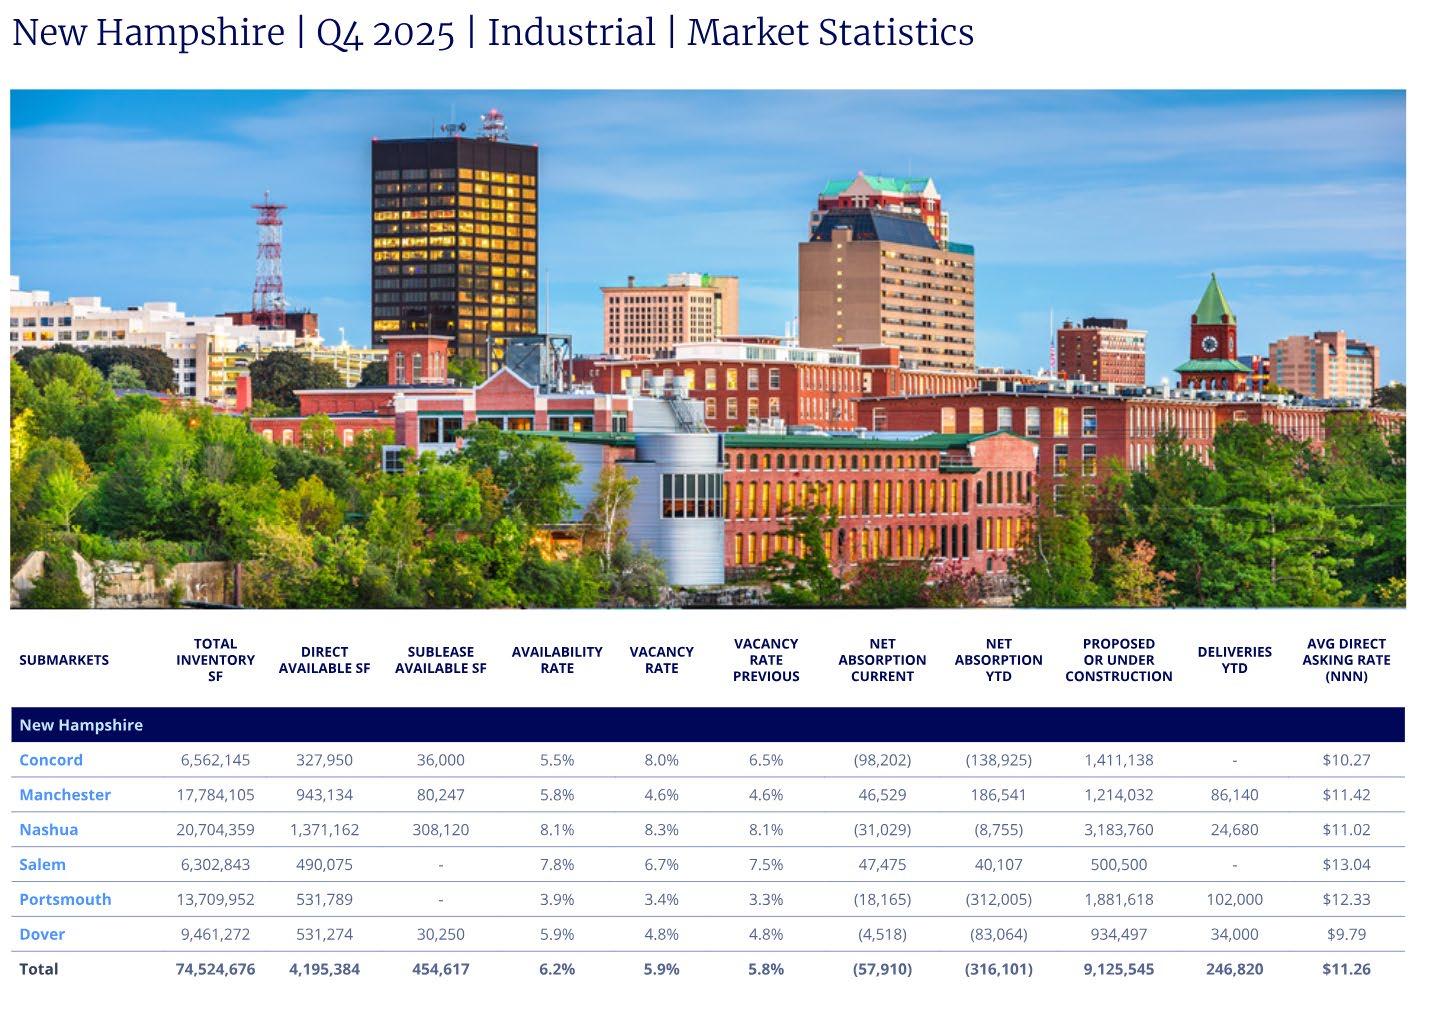
Over the past several years, there has been a strong commitment by the credit union to play an increasing role in safeguarding the financial well-being of the many diverse minority groups located within our community.
The commercial department will continue to seek out new ways to communicate and support these minority groups. Our multilingual commercial loan officer will continue to add minority depth within the department. This individual, working in conjunction with branch networks and armed with loan products/services specifically designed for these minority business groups will allow the credit union to provide a higher degree of support for these communities.
Additionally, inroads into the northern Massachusetts markets in areas such as Lowell, Lawrence, and Haverhill have continued. These areas are expanding and offer a large population of minority business owners including many with Hispanic, or Middle eastern decent. Although much of our current business has been generated through word of mouth, additional campaigns are being
considered. Triangle Credit Union remains an important source of funding for numerous financial initiatives led by minority communities in the southern part of the state.
The commercial department will continue to remain cautious as we venture forward in this everchanging economic environment. The commercial department will continue to remain cautious as we venture forward in this ever-changing economic environment. We must continue to pay close attention to the heightened real estate prices and come to the realization that these higher prices are a direct result of a large disparity in supply and demand within the state. Therefore, we must remain prudent with our loan to value requirements during this unbalanced real estate market.
A substantial increase in supply, higher unemployment figures or the Fed’s continued efforts to combat inflation with monetary policy may provoke demand to diminish and ultimately bring prices tumbling down. Additionally, the Trump administration approach to shrinking the overall size of government and the use of tariffs to influence trade policies may have potential unforeseen consequences as we move forward in this new economy. We must remain observant and ready to pivot if economic changes requires us to do so in the coming months.
Nonetheless, it will be extremely important over the coming months to work closely with our business clientele to support and help reassure them that we are committed towards helping them successfully navigate the economic challenges we are currently experiencing. This may include working to support them in this higher interest rate, inflationary environment. With a sizable portfolio of adjustable-rate loans, many owners will be facing higher overall payments on their current credit obligations.
For a $1 billion asset credit union in New Hampshire, a successful commercial lending strategy for 2026 must balance the pursuit of higher-yield commercial assets with disciplined risk management. This is especially critical following recent volatility in the state's commercial portfolios, where some large institutions have seen sudden spikes in delinquencies.
A substantial increase in supply, higher unemployment figures or the Fed’s continued efforts to combat inflation with monetary policy may provoke demand to diminish and ultimately bring prices tumbling down. Additionally, the Trump administration approach to shrinking the overall size of government and the use of tariffs to influence trade policies has had potential unforeseen consequences as we move forward in this new economy. We must remain observant and ready to pivot if economic changes requires us to do so in the coming months.
Nonetheless, it will be extremely important over the coming months to work closely with our business clientele to support and help reassure them that we are committed towards helping them successfully navigate the economic challenges we are currently experiencing. This may include working to support them in this higher interest rate, inflationary environment. With a sizable portfolio of adjustable-rate loans, many owners may be facing higher overall payments on their current credit obligations.
With the departure of our experienced commercial loan officer, Christine Malloy, it is essential to adopt further measures to maintain consistent support for the business owners who have benefited from Christine's expertise over the years. The appointment of a new AVP of Commercial Services will address the gap created by Christine’s exit and ensure ongoing service excellence.
We will continue to originate SBA loans whenever possible to help minimize risk and continue lending within our established business lending framework.
Additional attention will be given to the SBA 504 loan program which will also be utilized when certain requests warrant this type of lending facility.
Triangle Credit Union’s familiarity with the Small Business Administration and our current designation as an SBA “Preferred Lender” allows the credit union to respond very swiftly to the needs of our business community. This includes funding loans not only for existing members but a sizable number of new business relationships. However, new 2025-2026 SBA loan regulations, particularly under SOP 50 10 8, introduce much stricter eligibility, requiring 100% U.S. citizen ownership, excluding green card holders, and increasing documentation. Key changes also include higher collateral requirements, reinstatement of equity injections, and stricter rules on debt refinancing.
• New Standard Operating Procedures (SOP 50 10 8), effective June 1, 2025, have introduced several changes to lending standards:
• Strict citizenship requirements were implemented, requiring 100% ownership by U.S. citizens, nationals, or LPRs for SBA loans as of March 1, 2026. This altered previous policy that allowed partial foreign ownership.
• The collateral requirement threshold was lowered to $50,000, and a 10% equity injection is now required for startups and changes of ownership.
• Upfront fees for 7(a) and 504 loans were reinstated for loans approved after March 27, 2025.
• In August 2025, an anti-debanking order was issued, directing lenders to cease politicized or unlawful debanking practices.
• A crackdown on the 8(a) Program in January 2026 led to the suspension of over 1,000 firms that failed to meet new financial documentation requirements aimed at identifying "shell companies"
Participation lending is a strategic approach for financial institutions to manage risk and grow their loan portfolios. It allows credit unions to originate larger loans than they could handle individually while staying within their lending limits. By selling loan participations, credit unions can diversify their assets and reduce credit risk to specific customers or communities. This method also enables credit unions to maintain control over important customer relationships and avoid sharing them with competing financial institutions. Participation lending is not a last resort but a deliberate balance-sheet strategy that fits into a modern portfolio management plan.
As a result of prior success, business loan totals, specifically MBL’s, are just below the Federal cap limits. The commercial department will continue to seek other sources of funding to work within this established framework. This will include increased lending activity with not only the Small Business Administration (SBA) and its affiliated programs, but also ongoing loan participations with local credit unions.
Loan participations allow TCU to help better manage regulatory limits and provide a mechanism to manage risks including those associated with interest rates, liquidity, credit and geographic area, while simultaneously enhancing the credit union’s ability to service our membership.
The commercial loan portfolio exhibits loan balances just over $7.8 million. Currently, Holy Rosary, Workers and IC Credit Union have all purchased participation loans from us. It will be our goal to identify and procure additional financially viable credit unions as future participation partners. It is my belief these participations will not only allow for greater loan flexibility dealing with MBL caps but provides a continuing source of income for the credit union’s bottom line for years to come.
The lack of inventory, coupled with the increased migration of new individuals into northern New England, should allow for additional growth in the development of new housing units within the state. It has also been noted that New Hampshire state officials are actively collaborating with towns and cities to address the housing shortage through various initiatives. These legislative actions include zoning Reforms and the reduction of minimum lot size requirements. The commercial department will look to benefit from these favorable developments. We will continue to support our long-standing builder/developer George Razzaboni, who has successfully partnered with the credit union on numerous home construction projects. Additional established area builders may be considered. However, the fluctuating construction costs attributed to shortages in materials and supplies exacerbated by growing number of tariffs will need to be closely monitored. We will work with the marketing and consumer lending department to further develop and define the credit unions home construction program.
The ripple effects of the on-line digital economy has created a demand for warehouse distribution space, cross dock space, small contractor warehouse space, refrigeration space, research and
development space and storage space that although improving cannot be fully met by existing inventory. As a result, the credit union will continue to review and consider these requests which ultimately may lead to additional construction funding for these endeavors.
Our goal in the coming years is to build a strong, income-producing business credit card portfolio while simultaneously strengthening the overall banking relationship with the business members. We have experienced some success with business owners who use our credit card program to help facilitate their daily business activities with employees. We must continue to be cautious in the coming months knowing that unsecured credit cards are the first lending facilities to become delinquent in a challenging and very uncertain economic environment. We will continue to move gradually and responsibly as we add unsecured lines to our commercial portfolio. Additional credit card product types are being considered.
It will be our goal over this coming year to work closely with the AVP of branch operations to identify and train potential candidates at the branch level that would assist the commercial department with the overall servicing of business members on all levels. Additionally, branch, commercial and back-obstacles will continue to be identified and addressed to allow for a more comprehensive process with serving business members. This year we will look to continue increasing efficiencies within the department that will further benefit the branch network and back-office staff. We need to evaluate the current process for servicing small business loan requests under $50,000 and identify more effective and efficient methods for managing these type of requests.
The commercial department will continue to work closely with the Marketing/Ecommerce Department to promote business products. Additional business-related podcasts, in-person events, community sponsorships and online promotion will be the cornerstone of these collaborations.
A comprehensive business service package has strengthened TCU’s business banking platform, adding Treasury Management Services such as ACH, remote and mobile deposit capture, online wire transfers, positive pay, and multi-user capabilities. While these enhancements improve the member experience and support growth in business deposits, product implementation and training challenges persist. Some branch staff remain apprehensive about the new features compared to the previous basic structure. To address this, TCU hired an experienced Business Development officer to collaborate with training teams and front-line staff, ensuring employees receive the necessary guidance and understanding.
An initial meeting between the commercial team and the business development department has established a foundation for potential referrals and clarified mutual expectations.
Finally, as always, we look to continue to grow the commercial department through relationship banking. This process is effective and has been developed within the department over many years. As trust is built and member satisfaction increases, positive word of mouth continues to be our most successful form of advertisement. Building members’ trust comes from what we do best, through direct member contact. We must continue to capitalize on the fact that, as experiences have shown, the membership chooses to do business with TCU because they know and trust us.
Our objective over the next year is to continue to capitalize on the goodwill/support established during our collaborations with our business members during these demanding times. It will be our goal to grow stronger relations with the many new business members who established accounts with the credit union over the past few years.
With escalating competition within our marketplace, it will now be more important than ever to further solidify our business banking relations on all levels, especially with those with strong commercial credit that might be at risk to area competitors.
Roxanne Nelson, VP Lending
The New Hampshire housing market remains steady, with current data indicating a promising forecast for 2026. According to the New Hampshire Association of Realtors (NHAR), there are more homes listed now compared to previous years. Despite this increase, inventory is still insufficient to create an even playing field for both buyers and sellers.
According to experts, New Hampshire's housing market is expected to see a modest 3.9% rise in home prices by 2026. However, areas like Concord may experience a slight drop in property values over the year. Overall, these projections indicate ongoing stability across the state's real estate markets, making New Hampshire appealing for both buyers and sellers in the months ahead. Additionally, sales of more affordable homes have surpassed those of traditional singlefamily houses as buyers seek cost-effective options.
In 2026, the New Hampshire housing market is projected to experience incremental increases in inventory, offering enhanced opportunities for buyers, although supply will remain constrained relative to demand in other regions. Home values are anticipated to appreciate at a measured pace, with coastal areas and commuter markets maintaining higher desirability. Investor activity is expected to remain robust in locations such as Manchester and Nashua.
As of January 2026, home prices in New Hampshire rose by 2.7% year-over-year, reaching a median sales price of $499,100. The volume of homes sold increased by 4.5% compared to the prior year, totaling 12,529 single-family properties. Median days on market declined by 17 days year-over-year, now averaging 42 days. Presently, the average monthly rent in New Hampshire is $2,000.
Mortgage rates in 2026 are widely predicted to hover around the 6% mark, with major forecasts from Fannie Mae, MBA and NAR suggesting little significant downward movement from early levels. While some analysts suggested potential dips below 6% due to softening economy, they are not expected to return to pandemic lows.
• Fed Policy: Potential shifts in leadership and economic strategy could lead to lower rates, depending on inflation expectations and GDP growth.
• Economic Indicators: A weakening labor market may prompt the Federal Reserve to implement rate cuts in 2026, helping to keep mortgage rates lower.
• Market Trends: The "lock-in effect" from higher previous rates continues to impact inventory, but rates are currently at three-year lows.
• As of mid-February 2026, the 30-year fixed-rate mortgage averaged 6.09%, which is decrease from 6.87% a year prior.
First Mortgages are expected to grow by $13.1 million (7.11%) in 2026, driven by new purchases and refinancing efforts targeting non-TCU mortgage holders via multiple marketing channels.
Mortgage loan originators must continue to build relationships with local realtors at their branch’s locations. This is not limited to mortgage loan production, but all products and services provided by TCU. They should participate in branch events and community activities to increase visibility and awareness of mortgage offerings. Originators are also required to review loan applications for potential cross-selling opportunities.
Triangle offers 40-year 5/5 and 5/1 Adjustable-Rate Mortgages designed to make home ownership more affordable, especially for first-time home buyers. As property values rise and rates are expected to fall, this product will help members achieve home ownership.
• Webinars, podcasts, videos, blogs.
• Use of direct mail, website promotions, branch TV displays, mortgage brochures, radio spots, and social media to market the 40 Year ARM to both members and non-members.
• Non-member direct mail offers for refinance.
• Mortgage originators are responsible for engaging in branch activities, representing the organization at community events, establishing new relationships with local realtors, and strengthening existing partnerships. They also expected to participate during branchsponsored meet and greet events.
• Closing Credit – A borrower will receive a $1,000 reduction on closing costs for a home purchase or a $750 reduction on closing costs when refinancing their existing home mortgage from another financial institution.
• Encouraging the promotion of the Mortgage Loan officers and ensuring that signs displaying 'Talk to Our Mortgage Expert' are present and displayed in every branch facility.
The projected loan balance growth for Home Equity Lines in 2026 is estimated at $11.5 million, representing a 14.95% increase. Due to constrained real estate supply and sustained demand within the area, a substantial number of consumers are electing to stay in their existing residences and allocate resources toward property enhancements. The ongoing demand and stable property values create an opportunity to offer new Home Equity Lines of Credit to both current and potential members through the 80% and 100% programs, supporting the achievement of our strategic goals and objectives.
• Distributing emails to members who have opened HELOCs within the past two to five years, encouraging them to consider enhanced usage.
• Employing a variety of marketing techniques aimed at existing HELOCs whose draw periods are scheduled to end within the next six months.
• Providing a $500.00 credit towards closing costs
• Promote through targeted direct mail campaigns, website marketing initiatives, branch television advertising, radio broadcasts, and HELOC brochures distributed to both existing members and prospective clients.
US Household debt has reached a record high 17.96 trillion with lenders facing increased scrutiny of their collections process. Although our current data indicates strong performance in collections, it is essential for the Credit Union to continually seek ways to improve collection strategies. One effective approach is to monitor the Collection Cost Ratio (CCR), which measures the efficiency of collections by dividing total collection costs by total revenue. By comparing our CCR with those of other credit unions of similar sizes, we can assess our relative performance. This benchmark provides a valuable starting point to pinpoint specific areas where improvements may be necessary, ensuring our collection practices remain competitive and efficient.
Loan servicing at TCU is a comprehensive administrative process that begins once a loan is booked and continues throughout the life of the loan. The loan servicing department is responsible for addressing all member inquiries, assisting with late payments, and supporting loss mitigation efforts. This department acts as the primary point of contact for members, ensuring their needs are met promptly and professionally.
At the core of TCU's approach is a commitment to putting members first. The loan servicing team dedicates time to understanding each member's individual needs, preferences, and communication styles. By recognizing that different generations may favor different communication methods, the department strives to remain relevant and responsive to all members.
Continuous training is a key priority for TCU employees within the loan servicing department. Staff members stay informed about the latest products, services, and solutions offered by TCU. Ongoing education empowers employees to provide accurate information and maintain a positive member experience throughout all interactions.
The loan projections for 2026 outlined in this plan are subject to adjustment in response to external economic factors or liquidity constraints. The economy is growing, but unevenly. The job market is softening, but we are not seeing a big pickup in layoffs. Inflation is increasing, likely as businesses pass tariffs through to consumers, but the impact is relatively modest at this point. In total, there is nothing pushing for further rate cuts currently. Political pressure on the Fed to cut rates more continues, but Congressional support for Chair Powell is strong. We expect a new Fed chair to be nominated shortly, but do not expect a marked change in Fed policy given the dissension within the FOMC regarding how and whether to further adjust the monetary policy stance.
Mortgage competition in New Hampshire is intense, driven by critically low housing inventory and high demand, with median home prices hitting records of over $500,000. Buyers face a challenging market with rapid sales, often competing with cash offers from out-of-state buyers.
To sell more mortgages, Triangle must focus on building strong, lasting relationships through consistent, high-value communication with past clients to drive referrals. Implementing technology for seamless, transparent client experience, partnering actively with local real estate agents, and utilizing targeted social media ads to identify potential buyers or refinancers.
The 2026 Mortgage Business Plan reflects a cautious but opportunity-focused outlook shaped by economic uncertainty and an exceptionally competitive housing market. While broader economic conditions remain uneven with softening labor trends, rising inflation pressures, and limited expectations for near-term interest rate cuts the underlying fundamentals of the New Hampshire housing market continue to support sustained mortgage demand, despite historically low inventory and record home prices.
Given these dynamics, success in 2026 will depend less on market expansion and more on strategic execution. Building durable relationships with past clients to drive referrals, delivering seamless and transparent lending experience through technology, and strengthening partnerships with local real estate professionals are critical priorities. Targeted marketing efforts, particularly through social media, will further position Triangle to identify and engage qualified borrowers in a highly competitive environment.
By remaining disciplined, client-focused, and adaptable to external economic and liquidity conditions, Triangle can protect market share and create sustainable growth opportunities within a challenging but active mortgage landscape.
Muhammad Ali, AVP Consumer Lending
Automotive Financing - 2026 Industry Outlook
1. Overall Market Direction: Stable Volumes, Constrained Affordability
Industry analysts broadly characterize 2026 as a year of stability rather than expansion.
• Global light-vehicle sales are expected to remain essentially flat year over year, with S&P Global projecting ~91.8 million units worldwide in 2026, reflecting easing postpandemic volatility but continued affordability pressures.
• U.S. new-vehicle sales are forecast around 16.0 million units, down slightly from 2025 but consistent with a “sustainable” demand level, according to Edmunds.
• PwC similarly notes flattening sales in mature markets as elevated vehicle prices continue to weigh on consumer purchasing power, even as supply conditions normalize.
Financing implication:
Loan and lease volumes are expected to remain steady, but growth will depend more on share capture, dealer relationships, and refinancing rather than broad market expansion.
2. Interest Rates: Gradual Relief, Not a Reset
Interest rates are expected to trend modestly downward in 2026, but analysts caution that this will not fully solve affordability challenges.
• Bankrate projects average new-car loan APRs declining by ~0.3 percentage points in 2026, with 60-month new-car loans averaging roughly 6.4%–7.0%.
• Several forecasts attribute this easing to anticipated Federal Reserve rate normalization following inflation control efforts, though rates remain well above prepandemic levels.
Financing implication:
• Slightly lower rates may stimulate marginal borrowers and refinance activity.
• However, monthly payments remain high due to vehicle prices, meaning credit discipline and LTV management stay critical.
3. Credit Quality & Underwriting Environment
The consensus view is that credit conditions remain tight but stable.
• Elevated vehicle prices and longer loan terms continue to pressure loan-to-value (LTV) ratios, especially in used vehicles.
• Bankrate and refinance market analyses indicate approvals may stay constrained for high-LTV and near-prime borrowers, even as rates ease.
• S&P Global Mobility highlights continued focus on risk segmentation and portfolio resilience across lenders and captives in 2026.
Financing implication: Expect steady delinquency monitoring, selective credit expansion, and continued reliance on pricing for risk rather than volume growth.
Vehicle technology trends directly affect financing structures.
• Battery electric vehicle (BEV) adoption in the U.S. is slowing, largely due to higher prices and uneven charging infrastructure. PwC notes BEVs still carry a 15–20% price premium over ICE vehicles in 2026.
• Hybrid vehicles (HEVs) are gaining traction, offering better total cost of ownership and higher residual values, which supports stronger lease and loan performance.
Financing implication:
• Increased demand for hybrid-friendly loan and lease products.
• EV-specific incentives may continue, but volumes are expected to underperform earlier forecasts.
While inventory levels have largely normalized, affordability remains the central issue.
• Edmunds reports the industry has moved away from heavy incentive-driven volume strategies, settling into a balanced pricing environment without widespread sub vented financing.
• S&P Global points to competitive pressures and regulatory shifts shaping OEM and dealer pricing strategies in 2026.
Financing implication:
• Indirect lenders will continue competing on speed, dealer service, and consistency, not just rate.
• Dealer relationships remain a key differentiator as volumes flatten.
Pulling the outlook together:
• Loan volumes: Flat to modest growth, driven by execution rather than market tailwinds
• Rates: Slight improvement, but affordability remains constrained
• Credit: Stable but cautious; underwriting discipline remains essential
• Opportunities:
o Hybrid and used-vehicle financing
o Refinance activity as rates drift down
o Strong dealer engagement and digital efficiency
Auto Lending (Direct & Indirect)
In FY2025 Triangle’s Auto Lending Program generated 2,569 new loans for $73.5M (717 Direct Auto Loans for $18.4M and 1852 Indirect Auto Loans for $55M), compared to 1,627 new auto loans for $42.3M (635 Direct Auto Loans for $14.7M and 992 Indirect Auto Loans for $27.6M) in FY 2024, resulting in a YoY growth of $31M.
For FY2026, the plan is to pivot from reliance on indirect lending and to build up in-house direct lending production, capabilities, experience and knowledge to increase profitability and to have a more engaged membership base with deeper relationships. As part of this strategy, Consumer Lending will play an integral part in maintaining ownership of online applications, including queue management, remotely closing on applicable loans as well as disseminating loan applications to appropriate branch teams, as and when necessary.
Below are the Direct and Indirect Auto Lending goals for the overall organization:
Strategies
• Direct Lending
o Offer a competitive auto lending program
o Special in-house rates (refi) for auto and RV financing
o Marketing – email, social media, podcast/blogs/site, branch TV, auto brochures
o Support branch staff with cross-sell opportunities
o Regular branch visits – deep dive with BMs to assess performance
o Member appreciation/meet & greet days by branch staff
o Member raffle for loans closed in the branch
o Employee incentives (sprints)
• Indirect Lending
o Dealer visits (auto & RV dealers) once per week
o Virtual touchpoints with dealers throughout the month
o Offer competitive indirect lending program – weekly survey
o Provide quarterly dealer Visa gift card raffle (up to a total of $1,000 max)
o Budget for dealer lunches/events
Unsecured Lending:
Credit Cards:
TransUnion projects only 2.3% year-over-year growth in credit card balances, the smallest increase since 2013 (pandemic year excluded). This marks a return to slower, more disciplined expansion after years of double-digit surges. Balances expected: $1.18T in 2026 (up from $1.16T in 2025).
This moderation is driven by persistent economic uncertainty, tighter lender underwriting, and more cautious consumer spending.
We are currently engaging in internal discussions, and have retained external industry resources to evaluate our current credit card portfolio, the value add it brings to our members and how we can make it a well-rounded program, including diversifying our current product line-up.
Kevin Stang from CUXcel has shared national and local industry trends and data with us to help evaluate our current credit card program. One of his recommendations is to broaden our current credit card offering by introducing a 3rd credit card option in metal form, called Elite Advantage, offering a robust cash back rewards program aimed at capturing a bigger portion of the affluent segment.
As offered in the past years, we have continued with the Holiday Cash version of our personal loans from November 1, 2025 through January 31, 2026. This promotional offering was available for up to an amount of $5,000, under two options:
• Up to 12mo @ 8.99%
• Up to 24mo @ 9.99%
We have set a target to put out a maximum of $2M under these promotional rates.
For the remainder of the year (February 2026 – December 2026) the personal loan offering will revert back to the regular rates and terms:
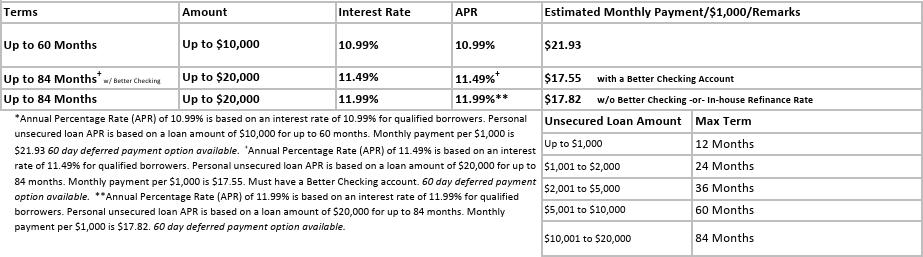
Per current plans, the Holiday Cash offering will be made available to our membership base starting November 1, 2026 and will run through January 31, 2027.
LISA VAN BIENE, COO
Triangle’s 2026 strategic plan positions the organization for disciplined growth, operational modernization, and enhanced member value. Each departmental strategy directly supports our enterprise-wide priorities including branch expansion, member acquisition and retention, core conversion readiness, community engagement, and operational efficiency while ensuring we remain agile and member focused throughout a transformational year. Our teams are united around data driven decision making, cross functional collaboration, and targeted investments that elevate both internal capabilities and the overall member experience.
Operational readiness will be a defining factor in our success. The Member Services, Contact Center, Operations, and Sales & Community Outreach teams have developed aligned strategies that reinforce service excellence, elevate workforce development, expand our physical and digital footprint, and support a successful core conversion. These plans include continued technology modernization, workflow optimization, expanded ITM capabilities, strengthened compliance and business continuity practices, and enhanced analytics that support smarter, faster enterprise decisions. Together, these initiatives underscore our commitment to operational precision, scalable growth, and sustained competitiveness across our markets.
Throughout 2026, we will remain focused on maintaining organizational stability, advancing staff readiness, nurturing strong vendor partnerships, modernizing digital tools, and reinforcing a culture grounded in efficiency, accountability, and continuous improvement. Collectively, this strategy reflects a unified vision that supports Triangle’s long term strength, growth trajectory, and ability to deliver exceptional member experiences.
Looking ahead, we’re committed to putting these priorities into action with focus and teamwork. We’ll stay closely aligned across departments, use clear insights to guide our decisions, and keep improving how we operate. This approach keeps us ready for member needs, supports steady growth, and positions us to handle new challenges with confidence.
Lana Dal Molin, VP Sales & Community Outreach
The Sales & Community Outreach Department will emphasize strategic resource allocation aligned with Triangle’s thematic objectives and budget, increased efficiency across sales and outreach functions, and stronger engagement at community events and training sessions.
Sales & Training Initiatives
Core Conversion Support
• Trainers and product specialists will learn and teach the new Jack Henry Symitar system during the first half of the year.
• Training materials and classes will be updated in the second half to reflect post conversion processes.
• Continue refining the new class format introduced in 2025.
• Adjust curriculum as needed to support evolving sales and service goals.
• Collaborate with COO, AVP of Branch Operations, and Marketing to design and execute promotions aligned with organizational objectives.
• Strengthen communication and strategic alignment with Marketing to ensure unified messaging and execution.
Business Development Officer Focus
• Grow the business deposit base.
• Expand adoption of Treasury Management Solutions.
• Strengthen business lending and deepen community engagement.
• Enhance staff expertise to support long term business relationships.
The department will maintain a steady, relationship focused approach in 2026 to support the core conversion.
• Maintain and strengthen relationships with major partners such as the Town of Nashua, hospitals, and local nonprofits.
• Support leadership participation in community boards.
• Expand and coordinate the Financial Literacy Program.
• Increase employee engagement and participation in community events.
Services
Lisa Van Biene, COO
Member Services will prioritize initiatives that support branch expansion, market growth, and member acquisition and retention, ensuring Triangle remains accessible, competitive, and aligned with member needs.
Branch Expansion Strategy
• Customized Expansion Planning: Partner with CUExcel to develop a tailored expansion plan integrating member demographics, market data, competitive analysis, and product performance.
• Market Reach & Visibility: Identify opportunities in ethnic neighborhoods, high growth corridors, and underserved areas while evaluating competitor presence, driving patterns, and proximity to other financial institutions.
• Spoke Branch & ITM Growth: Deploy small footprint “spoke” branches and ITM kiosks strategically connected to hub branches to increase accessibility and reduce operational costs.
Member Acquisition & Retention
• Collaborate with existing and potential vendors to introduce or enhance products and services that better meet members and business needs.
• Strengthen community presence through ongoing outreach, networking, and partnerships with branch management, commercial services, and the business development officer.
• Conduct monthly Deposit Strategy Team meetings to review performance, accountability, and strategic adjustments.
• Partner with Marketing/eCommerce, Member Experience, and Community Outreach to increase brand visibility, host events, and conduct member surveys.
• Promote digital tools including ITMs, online account opening, payment portals, e signature, and mobile/online banking to create a fast and memorable member experience.
Employee Development
• Train frontline employees for advancement into Branch Specialist roles to improve service quality and internal mobility.
• Develop Subject Matter Experts (SMEs) at each branch and within the Contact Center to support staff and assist members with specialized needs.
Technology & Innovation
• Successful implementation of the Jack Henry Symitar core conversion
• Expansion of ITM remote control capabilities
• Enhancements to online and mobile banking functionality
• Automation opportunities in Operations and Contact Center workflows
• Improved data analytics for decision making and market targeting
• Evaluation of new digital tools to support member self service
Key Performance Indicators
• Net new membership growth
• Digital adoption rates (ITM usage, online account opening, mobile logins)
• Contact Center one call resolution rate
• Business deposit growth
• Branch expansion milestones
• Training completion rates for core conversion
• Community engagement metrics
• Member satisfaction and NPS trends
Risk Assessment & Mitigation
Core Conversion Risk Mitigation: phased training, cross department coordination, enhanced member communication.
Staffing & Turnover Mitigation: cross training, SME development, incentive programs.
Vendor Dependency Mitigation: diversified vendor relationships, ongoing performance reviews.
Technology Adoption Challenges Mitigation: member education campaigns, staff training, simplified digital workflows.
Regulatory/Compliance Changes Mitigation: continuous monitoring, updated training, process reviews.
Budget & Resource Considerations
• Investment in core conversion training and technology
• Resource allocation for branch expansion and ITM deployment
• Increased staffing or reallocation for Contact Center and Operations
• Cost savings expected from automation and improved efficiencies
• Marketing and community outreach budget aligned with growth goals
Member Experience Strategy
• Reduce friction in digital and in branch processes
• Improve survey response rates and NPS
• Enhance accessibility and inclusivity across all channels
• Strengthen member onboarding and early engagement
• Expand financial education resources
Workforce Culture
• Strengthen leadership development pathways
• Increase employee engagement through community involvement
• Improve internal communication and collaboration
Facilities Overview
Our facilities department will play a crucial role in supporting the organization’s strategic direction in 2026, particularly as we expand our branch network and enhance member-facing environments. In alignment with our branch expansion and spoke branch strategy, Facilities will prioritize site readiness, renovation planning, ITM installation support, and ongoing maintenance programs that ensure our branches remain safe, modern, and operationally efficient. Facilities will also partner closely with Operations, IT, and Member Services to ensure all locations are properly equipped for the Jack Henry core conversion and maintain high service standards across both new and existing branches.
Ryan Ruggiero, VP Contact Center & Operations
Contact Center Strategy
The Contact Center will focus on both service excellence and sales performance, supporting Triangle’s budget and member experience goals.
Service Strategy
• Educate members on products and services that strengthen financial well being and deepen relationships.
• Serve as a stabilizing support channel during and after the core conversion.
• Review departmental structure and software to ensure readiness for increased virtual and phone based engagement.
• Capitalize on efficiencies introduced by the new core system.
• Prioritize one call resolution to reduce repeat calls and improve satisfaction.
• Collaborate with IT to finalize remote ITM control capabilities for agents.
• Continuously identify improvements in policies, procedures, and technology.
Sales Strategy
• Develop targeted initiatives that support Triangle’s revenue and growth objectives.
• Expand the Contact Center’s role in identifying member needs and recommending appropriate products and services.
Operations Strategy
Operations will focus on efficiency, compliance, and business continuity.
• Review departmental structure and technology to ensure alignment with organizational needs.
• Cross train employees across operational functions to strengthen continuity and support employee development.
• Evaluate processes for compliance, time efficiency, and impact on member experience.
• Leverage efficiencies from the new core system to optimize resource allocation and ensure critical functions are properly staffed with backups.
• Improve service quality through streamlined workflows and enhanced operational oversight.
Recruitment:
• We are committed to hiring high-quality labor resources, recognizing that our employees are our most valuable asset.
• Our organization’s long-term health relies on consistent practices in hiring, managing performance, providing rewards and recognition, and, when necessary, employee dismissal.
• The recruitment process integrates the themes of being Hungry, Humble, and Smart, as described in The Ideal Team Player. We emphasize these attributes as central to our workplace culture seeking individuals who are eager to learn and grow, demonstrate humility, and exhibit emotional intelligence in their decision-making. These qualities are embedded in our leadership development for both management and emerging leaders, and they shape how we design interview questions and categorize candidates to ensure alignment with TCU’s values and culture.
• We have enhanced our recruitment process by utilizing technology to maintain efficiency during the application process, including the use of virtual interviews. We will continue to offer both virtual and in-person options, introducing in-person interviews as a final step for management-level positions.
• As management becomes more involved in the onboarding process, its scope continues to expand. Onboarding is more than just new hire orientation it extends to employees transitioning to new roles and departments. This process starts with the application and interview, continues through orientation, and involves a handoff from HR to the new department, where job-specific training and relationship-building with the new employee occur.
• On-the-job training plans are established for all positions and serve as a guide for each area or role. These plans provide clarity for both managers and new hires regarding expectations during the initial days and weeks of employment.
• There is a strengthened focus on managing performance expectations and holding staff accountable to the requirements of each position. This accountability can result in employee dismissal if the fit is not correct.
• Retaining high-quality staff remains a priority, and effective communication throughout the employment lifecycle is essential to this goal.
• Employee recognition and rewards are ongoing through our partnership with Terryberry. Employees are able to select gifts at milestone years, and the Gold Star program hosts recognition events to honor those who demonstrate exemplary behavior.
Compensation:
• Our positions are regularly reviewed to ensure correct market placement. We are committed to maintaining fair and equitable pay standards for both current and future employees, which is vital to our retention efforts. As part of our strategy to address today’s economic realities, we continuously evaluate our salary structure to resolve compression issues and have increased our entry-level wage to remain competitive. Additionally, we are focused on addressing compression within pay ranges to actively retain high-quality staff.
• Compensation is an integral part of the total rewards package offered at TCU. Changing market conditions require us to regularly adjust our approach to salary placement within ranges. Over the coming years, we will address the comp-ratio to realign with our intended placement in range philosophy.
• Each year, all employees receive a Total Rewards Statement, which outlines the value of the compensation and benefits provided by TCU. We reinforce the message of our 4 pillars: technology, compensation, benefits, cost of funds.
• Human Resources continues to ensure that our benefit offerings are competitive and pleasing to potential candidates and current employees. We review with our broker during each open enrollment period and update our selections to offer the most economic plans, current and potential employees seek in their benefit packages. This year (plan year 2025-2026) we were fortunate to be able to offer a modest 5% increase for the employee biweekly premium contributions for health, dental and vision insurances. The company absorbed the majority cost increase this year to assist with the effects of the high inflation and supply chain issues with the economy.
• Human Resources will continue to promote and educate the staff on the wellness piece and Specialty medication mail order parts of the benefits package. On a monthly basis, we will forward to the employees, various challenges, healthy living methods, etc. This will continue to help us keep the cost of our benefits at a reasonable level and affordable for all parties.
Human Resources will continue to educate the employees on the assorted options available to them to help keep their medical costs down, such as: Urgent Care, Mail Order Prescriptions, and alternate locations for various low-cost services. We will encourage all employees to take advantage of their benefits and fully understand them. All the educational material is electronically stored on the ADP enrollment portal for review at any time.
• Each year the staff receive a Total Rewards Statement. This would increase communication and clarity regarding employee benefits and their value.
• Management leadership development:
Triangle Credit Union’s organizational structure is designed to promote strong governance, operational excellence, and strategic alignment across all levels of the institution. At the core of this structure is a collaborative leadership model that connects executive management, department leaders, and frontline teams to the credit union’s mission and long-term vision. By clearly defining roles, responsibilities, and reporting relationships, the organization ensures accountability while empowering leaders to make informed decisions that support member service, financial strength, and sustainable growth.
A key strategic goal of this structure is to strengthen leadership across the organization (See Exhibit A for the organizational chart). This involves developing current leaders, identifying emerging talent, and creating succession plans to ensure long-term stability and high performance. Human Resources will collaborate closely with the President & CEO to design and implement leadership development programs, performance systems, and talent strategies that support organizational goals. Through this partnership, Triangle Credit Union will cultivate a culture of ongoing improvement, effective communication, and leadership excellence at all levels.
Executives, Vice Presidents, Assistant Vice Presidents, and Managers will continue their professional learning and are accountable for applying the four disciplines of the Advantage model through TCU’s professional development program led by John Gregoire and Ted Gorski. This is reflected in their annual performance reviews. They will use these skills to deepen their leadership and guide their teams, fostering a culture of learning and adaptability and improving cross-functional collaboration and team leadership. Quarterly training sessions strengthen leadership fundamentals, strategic vision, and personal development.
Expand the knowledge base and communication to support emerging leaders. Mentor and develop high-potential employees. Engage employees in conversations to promote learning in their roles and within the company, helping them understand how their roles and they fit into the organization.
• Employee education/training
Gain insightful feedback from employees by self-evaluations, and external surveys.
Conduct employee feedback survey third quarter 2026.
Reading books, e-learning, Podcasts, Webcasts, one-to-one learning, classroom training, seminars.
• Career Paths and Communication:
o To promote career development, the organization is implementing job targets and providing education to help employees understand internal opportunities, such as those available through the Career Center. By increasing awareness of growth possibilities and expanding knowledge for both current and future roles, employees are empowered to take charge of their career trajectories. Departments are encouraged to focus on internal development by offering cross-training and job shadowing, preparing staff for advancement and new responsibilities. Management is committed to maintaining open channels of communication by conducting regular performance reviews, offering feedback, and providing guidance throughout the year. These efforts ensure employees are informed about their progress and have support for their professional aspirations.
o Succession planning is further supported by specialized software now available to the CEO and executive team. This tool helps leadership define key positions, map out talent pipelines, and document clear pathways for advancement. By identifying both internal and external candidates for potential roles, the organization adopts a proactive approach to talent management. The streamlined interface enables the creation of strategic plans for seamless leadership transitions, safeguarding the organization's future and maintaining operational continuity.
• We have successfully created a workplace to allow remote work from home to increase area reach for applicants to match our culture mindset and values. This is expected to allow a better work life balance for employees and increase retention. Each year, we complete an update to the current staff that are hybrid by refreshing the documentation and pictures of the home area to ensure compliance with the policy. Most business areas are working onsite 3 days a week and all staff are onsite on mandated Wednesdays. There are more in-person meetings on premises to support culture and camaraderie.
• Our new hire orientation and employee on-boarding process for new hires has been converted to virtual expedite the process. HR is working in partnership with department areas will also consider hosting their training and onboarding in the virtual world.
Human Resources Policy and Handbook updates:
The organization is committed to an on ongoing review of internal HR policies and to update and refresh employee handbook. We have finished the handbook for the legal review to remain competitive and compliant. We will also include the Massachusetts legal compliance due to our remote hybrid employees. Once that is complete it will be sent out to all employees and put on Sharepoint, TIA and ADP portals. Next full review policy is in 2027.
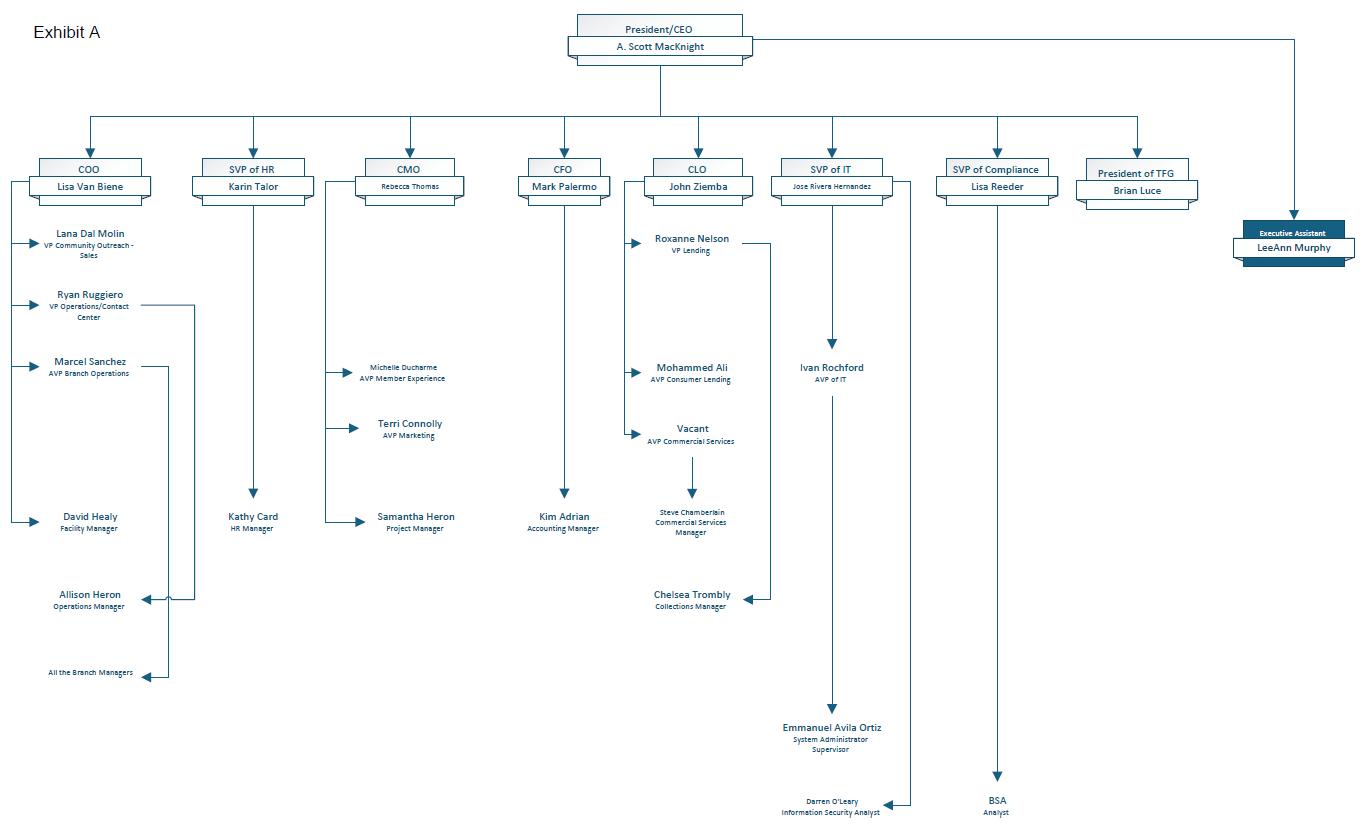
JOSE RIVERA HERNANDEZ, SVP INFORMATION TECHNOLOGY
This five-year (2026-2030) IT Strategic Plan aligns technology initiatives with Triangle Credit Union’s business goals. It focuses on digital transformation, artificial intelligence, cybersecurity, data management, infrastructure modernization, and workforce development to support sustainable growth and exceptional member service.
The 2026 IT Business and Strategic Plan provide a clear framework for technology investments that strengthen security, improve operational efficiency, and enhance member and employee experiences. In recent years, Triangle Credit Union has made significant progress modernizing its infrastructure, strengthening cybersecurity, and expanding digital capabilities, including the implementation of a new disaster recovery environment and a major core system transformation.
Building on this foundation, the plan focuses on leveraging cloud computing, artificial intelligence, automation, and data analytics to support an enterprise-wide approach to technology. These initiatives enable the Credit Union to operate in a secure, transparent, and financially responsible manner while protecting non-public information, member data, and critical technology assets. The strategy emphasizes informed decision-making, collaboration with business partners, and alignment with organizational goals.
To support evolving business needs, employees require modern, integrated, and efficient digital tools. At the same time, increasing cyber threats and aging systems require continued investment in secure, resilient, and scalable technology platforms. Information Technology must balance innovation with capacity, risk management, and workforce development to sustain long-term success.
Guided by the core priorities of digital transformation, member experience, cybersecurity, infrastructure modernization, core system optimization, data governance, and workforce development, IT will deliver responsive and reliable services that drive value across the organization. Looking ahead, IT will continue expanding the use of AI, automation, and analytics to streamline operations, personalize member engagement, and support data-driven decisions ensuring Triangle Credit Union remains secure, compliant, and competitive in a rapidly evolving financial services landscape.
Information Technology initiatives outlined in this plan are designed to align with NCUA guidance, FFIEC cybersecurity expectations, data governance standards, and third-party risk management requirements. All technology solutions will follow established policies for risk assessment, vendor due diligence, change management, data protection, and audit oversight. AI and automation initiatives will include documented governance, human oversight, and controls to ensure regulatory compliance, transparency, and member data protection.
The Information Technology Strategic plan supports the short-term thematic goals for 2026, and long-term goals spanning up to five years and proposes to address these and other challenges by responding to the following goals:
1. Digital Transformation
2. Strengthening Cybersecurity
3. Enhance IT Infrastructure
4. Improve Member and Employee Experience
5. Core Transformation
6. Data Management and Governance
7. IT Workforce Development
8. AI Tools and Automation
• Embed AI-powered automation into lending, operations, and reporting workflows.
• Adopt cloud-native platforms for new applications to improve agility and scalability.
• Expand API-driven integrations to support embedded finance and faster service delivery.
Digital transformation remains central to our strategy, enabling scalable services, rapid deployment, and simplified operations across the enterprise.
• Implement cloud access security broker (CASB), SIEM, and advanced threat detection to monitor critical events and cloud usage.
• Deploy AI-enabled threat detection and anomaly monitoring tools.
• Enhance third-party risk management with continuous vendor monitoring.
• Expand cybersecurity awareness and role-based training for all employees.
Cybersecurity continues to be a foundational requirement to protect member and employee data, support regulatory expectations, and maintain trust. IT strategy will prioritize AI-enabled threat detection, continuous security monitoring, and enhanced third-party risk management. Proactive vendor oversight and comprehensive employee training will strengthen the Credit Union’s security posture and protect sensitive information.
• Upgrade network switches, branch cabling, and remote access to support higher bandwidth and resiliency.
• Modernize infrastructure to support cloud-native and AI workloads, including Hypervisor.
• Ensure high availability and resilience for data, analytics, and digital channels.
• Optimize infrastructure investments based on performance, security, and cost efficiency.
This goal ensures a resilient and flexible technology backbone that can support growth, new services, and stronger security controls.
• Enhance online and mobile banking with improved usability and self-service options, in close collaboration with Marketing to ensure consistent branding, messaging, and member engagement.
• Strengthen collaboration platforms and endpoint standards to support hybrid and remote work, enabling effective cross-departmental coordination.
• Deliver personalized, cross-channel member journeys by leveraging data and analytics in partnership with Marketing and Lending to align digital experiences with product offerings and member needs.
• Expand self-service tools and virtual assistants for members and employees, incorporating Lending workflows and Marketing content to improve adoption and effectiveness.
• Improve internal productivity through automation and modern collaboration tools, reducing manual processes across IT, Marketing, and Lending operations.
By strategically aligning technology initiatives with Marketing and Lending, Triangle Credit Union will deliver cohesive, personalized member experiences while improving staff productivity and operational efficiency. Embedded finance and digital lending capabilities, enabled through secure APIs, will integrate financial services directly into digital journeys, supporting instant, automated, and intelligent loan decisions while maintaining strong compliance and risk controls.
• Complete the transition from Fiserv XP2 to the Jack Henry Symitar core platform, including parameter configuration, data mapping, and validation.
• Leverage the Symitar core platform as a foundation for embedded finance and digital lending.
• Enable real-time integration and API-based services across the ecosystem.
• Ensure data integrity and operational readiness post-core conversion.
Core transformation is a once in a generation change that will simplify product configuration, improve integration, and support future innovation.
• Establish a unified enterprise data platform and data warehouse to deliver accurate, real-time insights across the organization.
• Partner with a robust data analytics and reporting solution to enhance enterprise reporting, dashboards, and self-service analytics for business units.
• Strengthen data governance, quality, lineage, and ownership to support artificial intelligence, advanced analytics, and regulatory reporting.
• Enable predictive analytics to support lending decisions, risk management, and proactive member engagement.
Effective data governance ensures reliable insight, regulatory compliance, and consistent decision making across the organization. The Credit Union will transition from fragmented legacy systems to unified, cloud-native platforms to ensure accurate, real-time access to enterprise data. This modernization will enable predictive insights, support AI and analytics initiatives, and improve scalability, resilience, and regulatory reporting.
• Develop career paths and succession plans to retain key talent and reduce single points of failure.
• Upskill IT staff to manage AI, analytics, cloud, and automation platforms.
• Shift roles from system maintenance to strategic technology enablement.
• Develop succession planning and cross-training to reduce operational risk.
A skilled, motivated IT team is essential for sustaining transformation and supporting our business partners.
• Implement AI copilots and agentic tools to assist staff with repetitive tasks (email drafting, documentation, report creation, call notes, and ticket triage).
• Deploy AI assisted analytics and anomaly detection for fraud monitoring, cybersecurity alerts, and operational risk.
• Pilot member facing AI tools, such as virtual assistants and smarter chatbots, to handle common inquiries and improve 24/7 service while maintaining strong authentication and compliance.
• Establish governance for AI usage, including data privacy, model access, human in the loop review, and vendor risk management.
• Automate Compliance and Risk Management using AI-driven monitoring tools, with focus on any credit union regulatory changes.
These initiatives are intended to improve efficiency across departments (contact center, lending, operations, IT, compliance) while preserving a human centered, relationship-based service model. Triangle Credit Union will evolve from AI experimentation to fully embedded capabilities. Generative AI (GenAI) and machine learning will support virtual assistants, automate routine reporting, and provide personalized financial guidance to members. These capabilities will enhance productivity, improve decision-making, and strengthen member engagement while maintaining strong governance and oversight.
Triangle Credit Union’s IT Strategy focuses on securely enabling growth, efficiency, and superior member experience through disciplined modernization and responsible innovation. Over the next five years, Information Technology will embed artificial intelligence into operations, unify data and cloud platforms, strengthen cybersecurity, and transform digital member experiences while ensuring regulatory compliance and financial stewardship.
The strategy prioritizes investments that deliver measurable return on investment (ROI), reduce operational risk, and improve member outcomes. Core transformation, data governance, and workforce development remain foundational, ensuring technology capabilities scale responsibly. IT will continue partnering with business leaders to deliver secure, resilient, and future-ready solutions aligned with Triangle Credit Union’s mission and values.
SAMANTHA HEROD, PROJECT MANAGER
Triangle Credit Union’s mission is “to identify our existing and potential member needs and meet those needs through progressive, cost-efficient products and services, while maintaining a strong financial position.
COMMUNITY: We are actively involved in our communities by providing resources that promote engagement and success.
DIVERSITY: We welcome all groups and individuals desiring to be part of our mission with the goal to build unity by embracing and supporting all cultures.
SERVICE: We connect with our members and employees by respectfully committing to their needs while adhering to Service Strategies Standards.
1. Hire, develop, and engage employees to retain staff and position Triangle as a longterm top employer.
2. Utilize current resources and adopt technologies to ensure a return on investment through efficiency and growth.
3. Provide positive member experiences that create member value and loyalty, positioning Triangle as their financial institution of choice.
Our projects are categorized into four groups; Work Environment, Delivery Channel, Data Analytics & AI, and Required/Regulatory. Below are the descriptions of each and what the focuses are for our strategic vision of where we are heading as a Company.
Work Environment refers to the continuation of the company wide hybrid workforce that includes both remote work from home and on-site positions. Adopting this philosophy will allow the Credit Union to be more efficient, reduce costs, gain access to a larger talent pool, increase employee satisfaction and retention, improve disaster recovery options, and have a competitive advantage. Delivery Channel refers to the methods of distribution for our services, sources of engagement, and experiences with our members through branch models or technologies that drive acquisition, retention, and profitability.
Data Analytics and AI refers to the collection, cleansing, and study of information gathered from first-party resources that allow us to identify changes to our model to improve functions. AI refers to the use of the conclusions from our data analytics, using technology to automate activities, improving efficiencies and use of resources.
Required/Regulatory refers to the infrastructure projects that we need to complete to support other projects, to meet regulatory compliance, and to enhance our cybersecurity.
The graph below shows how all our projects we implement are tied into our strategic anchors and core values to make sure we are connecting and serving our members and employees to the best of our abilities.
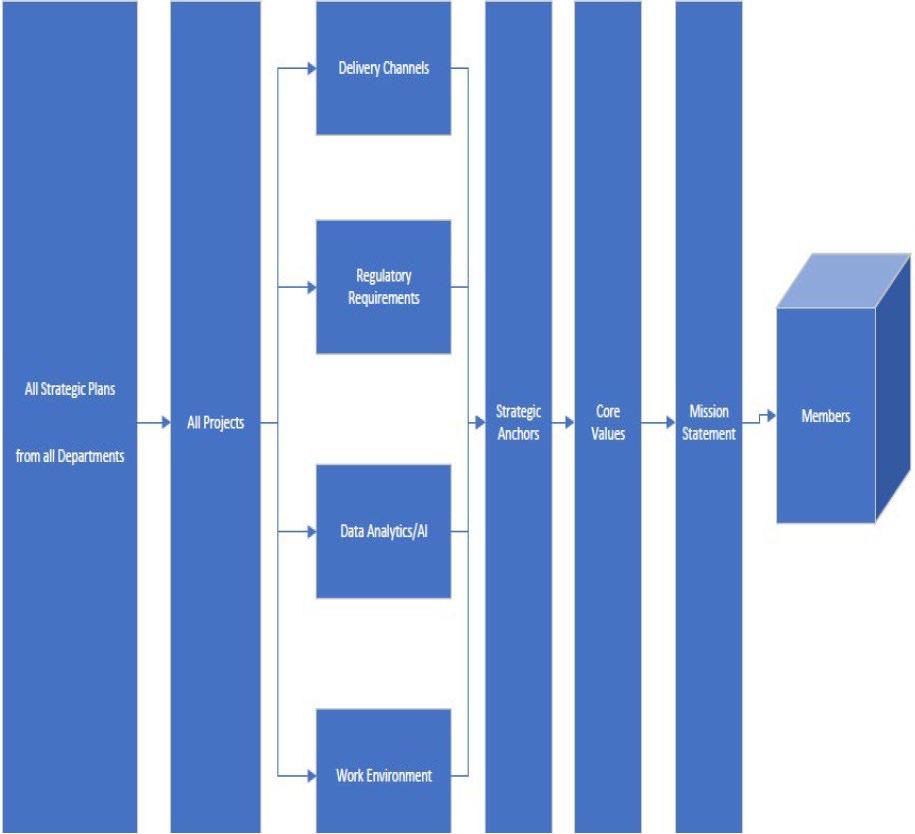
Below is a breakdown of all active projects and how they connect with our core values by assigning them strategic anchors it associates with.
Project Name
No active projects
Project Name
Delivery Channel
Strategic Anchor(s)
N/A
Strategic Anchor(s)
Market and Product Analysis 2, & 3
Project Name
Data Management – Phase 1
Report (Automating reporting) 2
Project Name Strategic Anchor(s)
Core Conversion (Jack Henry) 1,2, & 3
Project Description
Below are high-level overviews of active projects during Q1 and Q2 of 2026
Market and Product Analysis: We are working with a consultant to assist us with evaluating market trends for our products, current and future, to make sure they meet our member’s needs. This data-driven process reduces development risk, informs strategic decisions, and identifies opportunities for us.
Arkatechture: We will be cleaning data for the core conversion and Arkatechture is an important assist to help us with this. Arkatechture is a data warehouse the helps to design, build, and support our data analytics. It will automate reports, create strategic dashboards, and help clean inaccuracies, inconsistencies, or errors of the data we have currently and moving forward.
Data Management Phase 1: We will be cleaning up our SharePoint and OneNote data to make sure there is no duplicate data to decrease our storage and provide the correct permissions in both applications.
FHLB Report (Automating report): We are using our new core system to generate a custom report to automate our Federal Home Loan Bank report.
Core Conversion: We are working on converting our data into the new system as well as configuring the system to fit our needs in every area. We are also working with the vendors we are keeping and having them connect to the new system, so we are ready for our go live date of May 4th 2026.
LISA REEDER, SVP BSA / COMPLIANCE
The Compliance Department operates as an independent function reporting directly to the President/CEO. The department is responsible for regulatory compliance oversight, internal audit coordination, BSA/AML and sanctions compliance, and governance support. Compliance’s role is to identify and manage risk, ensure regulatory requirements are met, protect member trust, and support the credit union’s strategic objectives while maintaining independence.
The department comprises the SVP of Compliance/BSA Officer and two Compliance/BSA Analysts. As regulatory scrutiny from the NCUA, New Hampshire Banking Department, CFPB, and FinCEN continue to increase, Compliance is evolving into a proactive, risk-based partner to all credit union business units.
In 2026, Compliance will continue to monitor federal and state supervisory direction, including shifts toward regulatory streamlining or “deregulation,” and assess the impact of any changes in expectations from federal and state agencies. Compliance will also track federal legislative activity that could affect member products and the credit union’s revenue model, including proposals related to interchange (swipe fee) restrictions such as the Credit Card Competition Act of 2026 and proposals to cap credit card interest rates, including the 10 Percent Credit Card Interest Rate Cap Act. Where relevant, Compliance will provide leadership with timely updates and practical guidance to support planning, implementation, and risk management.
The Compliance Department provides oversight of the audit and regulatory examination process, including examinations conducted by the National Credit Union Administration and the New Hampshire Banking Department. Triangle Credit Union continues to engage the independent auditing firm Shatswell to perform internal audit services. Compliance is responsible for coordinating audit and examination activities, tracking findings and recommendations, ensuring timely and effective remediation by business units, validating corrective action closure, and reporting status, trends, and material issues to senior management, the Supervisory Committee, and the Board of Directors, as appropriate.
Compliance actively supports the mission and fiduciary responsibilities of the Supervisory Committee by serving as a primary liaison for regulatory oversight, examination management, and independent assurance activities. The department coordinates internal and external audits, manages regulatory examinations, and ensures that audit results, examination findings, and management responses are presented clearly, accurately, and in a timely manner to the Supervisory Committee. Through these activities, Compliance helps the Committee fulfill its responsibility to safeguard the integrity of the credit union’s operations, financial reporting, and internal controls, while promoting transparency, independence, and effective governance.
In addition, Compliance plays a critical role in keeping the Board of Directors informed of regulatory, supervisory, and congressional developments as they occur. This includes monitoring changes issued by regulatory agencies such as the NCUA, CFPB, FinCEN, and state regulators, as well as proposed or enacted federal legislation that may impact credit union operations, including changes related to interchange, consumer protection requirements, or interest rate limitations. Compliance evaluates the applicability of these changes, explains their potential operational, financial, and strategic impact on the credit union, and communicates key implications to senior management and the Board. This proactive approach enables informed decision-making, supports effective oversight, and helps ensure the credit union remains compliant while aligned with its strategic objectives.
Compliance training remains a vital part of risk management. Triangle Credit Union uses CUES and other industry resources to deliver role-based training aligned with regulatory and operational risks. This year, Compliance will be more actively involved in evaluating and assigning training related to regulation adherence and examiner expectations. Compliance will also continue providing targeted regulatory updates and management-level education.
The Compliance Department fulfills its role on the Policy Governance Committee by serving as a subject matter expert on regulatory requirements, risk mitigation, and internal controls. It reviews proposed and existing policies to ensure alignment with applicable laws, regulations, and industry standards, and assesses operational and reputational risks. Compliance provides guidance on required updates, monitors regulatory changes that may impact on governance documents, and recommends enhancements to strengthen oversight and accountability. Additionally, the department supports the committee by documenting compliance considerations, facilitating training when needed, and helping establish monitoring and reporting mechanisms to ensure policies are effectively implemented and consistently followed across the organization.
Risk management is integrated throughout Compliance activities. In 2026, Compliance will continue supporting efforts to strengthen and coordinate enterprise risk management practices, improve consistency in risk assessments, and increase visibility into key risks, including credit, market, operational, liquidity, compliance, cybersecurity, and reputational risk.
The BSA/Financial Crimes program remains a vital component of the Compliance function. The program is risk-based and designed to detect, investigate, and report suspicious activity and fraud in accordance with regulatory requirements. Core elements include transaction monitoring, member risk rating, CTR and SAR reporting, beneficial ownership requirements, OFAC screening, and annual training.
In 2026, the primary focus is continued enhancement of transaction monitoring and member risk rating within Verafin. Compliance will continue refining scenarios to improve alert quality and better align monitoring with Triangle’s risk profile. Compliance is also responsible for processing subpoenas, law enforcement requests, and other court-ordered inquiries in a timely and secure manner.
Compliance completes regulatory review of member and product disclosures, including account and loan documents, marketing materials, website content, and other communications. The core conversion has enabled us to streamline forms, eliminate outdated disclosures, and ensure accuracy and regulatory alignment. This effort will continue throughout 2026.
Triangle Credit Union’s 2026 Compliance Business Plan reflects a comprehensive and forwardlooking approach to regulatory oversight, governance support, risk management, and financial crimes compliance. As an independent function reporting to the President/CEO, Compliance plays a central role in anticipating regulatory change, coordinating internal and external audits, supporting the Supervisory Committee and Board, strengthening policy governance, and enhancing enterprise risk management practices. Through proactive regulatory monitoring, disciplined remediation tracking, and meaningful board-level communication, the department helps ensure that oversight responsibilities are fulfilled with transparency, accuracy, and accountability.
At the same time, Compliance continues to evolve as a strategic partner to the organization by reinforcing a culture of compliance through targeted training, strengthening the BSA/Financial Crimes program, refining transaction monitoring, and risk rating processes, and ensuring that disclosures and member communications remain accurate and aligned with regulatory expectations. Together, these efforts position Compliance not only as a control function but as a trusted advisor that protects member trust, safeguards the credit union’s reputation, and supports sustainable growth in an increasingly complex regulatory environment.
A.SCOTT MACKNIGHT, CEO / PRESIDENT
In summary, Triangle Credit Union enters 2026 as an execution-focused year, with the May 2026 core conversion serving as the defining operational priority. The plan calls for the organization to concentrate enterprise capacity on readiness activities training, testing, data preparedness, communications, and cutover planning while protecting service performance and maintaining member trust. At the same time, the organization will continue modernizing how members discover, engage, and transact with the credit union by reducing friction, improving digital and eCommerce experiences, and reinforcing a clear, education-led value proposition that supports adoption of new technology capabilities.
Financially, management is targeting measured balance-sheet growth approximately +1.48% in loans, +2.6% in shares/deposits, and +1.7% in total assets while prioritizing profitability and risk discipline over volume. The budget outlook reflects a continued focus on net interest margin management (3.2% projected at year-end) and disciplined funding and liquidity optimization, including reducing reliance on higher-cost wholesale borrowings as conditions allow. The plan also acknowledges headwinds in noninterest income from planned overdraft fee reductions and potential interchange pressure, as well as higher noninterest expense, driven largely by personnel and benefits, reinforcing the importance of tight cost management during a heavy execution year.
Looking ahead, the credit union’s risk posture supports steady progress, with ALM reporting indicating low earnings risk in rising-rate scenarios but greater sensitivity in declining-rate environments underscoring the need for continued ALCO vigilance around deposit pricing, liquidity buffers, and reinvestment assumptions. Successful delivery will depend on strong governance and reporting cadence for core conversion readiness and post-conversion stabilization, clear escalation of member-impact issues, and timely mid-year reforecasting triggers tied to rate moves, funding mix, and expense trends. With disciplined execution, Triangle Credit Union is positioned to sustain member-centric growth, protect capital and margin, and emerge from conversion with strengthened capabilities that support longer-term competitiveness.
Finally, I wish to extend my appreciation to all top leadership for developing strategic visions that have been integrated into the business plans. Considerable effort and dialogue contributed to the formulation of each individual strategy, thereby enhancing our overarching objectives. To clarify, top leadership includes executives, vice presidents, and assistant vice presidents.
Respectfully submitted,
A. Scott MacKnight