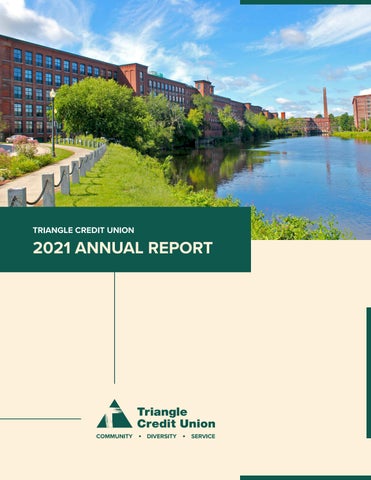
TRIANGLE CREDIT UNION
2021 ANNUAL REPORT
PRESIDENT’S MESSAGE So often we focus on past accomplishments in the annual report, but this year I would like to take us in a new direction, a direction for the future. While we achieved many accomplishments in 2021, including navigating the challenges that follow a pandemic, we are ready to focus on goals for our 83rd year, and I would like to share them with you. First, in terms of improved member experience, we have significant developments in our digital banking platforms, particularly in mobile banking. Our enhancements in this area include mobile online account opening, advanced chat features that will allow our representatives to access screenshare technology, a robust payment portal for convenient payment options, and a new business banking platform that we will begin building before the end of the year. Second, our core values of Community, Diversity and Service will continue to guide our endeavors in financial literacy and support for the communities we serve. We will increase the number of Homebuyer webinars, which now includes a Spanish Homebuying webinar. As our membership base becomes more diversified, we are excited to introduce Conexion Latina con TCU, a Spanish language Zoom-based monthly panel discussion that will cover budgeting, decreasing debt, the importance of insurance, and how to plan for your financial future. Third, we have fostered an environment of professional development within the Credit Union that will continue into 2022 and beyond. We are committed to offer extensive, career-building training initiatives within the organization. As such, our staff will participate in programs such as Emerging Leaders, Young Professionals Network and internal training initiatives designed to develop employees at all levels and make them trailblazers for tomorrow. I am excited about what is on the horizon and believe we are positioning the Credit Union for growth and future success and look forward to implementing the strategies that will achieve our organizational goals. On behalf of myself and the Senior Management Team, I want to thank our employees for their daily commitment to service excellence, the Board of Directors and Supervisory Committee for their continued guidance, and our members for your support—you have many financial service choices, and we’re glad you choose Triangle Credit Union. Sincerely, A. Scott MacKnight CEO/President
COMMUNITY
We are actively involved in our communities by providing resources that promote engagement and success.
CHAIR’S MESSAGE Although it was another year in which we navigated a pandemic, 2021 realized incredible successes as an organization. We continued to support non-profits across the communities we serve, and we introduced new initiatives to provide diverse educational opportunities and enhanced services for our members. From Trunk-or-Treat events to soup kitchen donations, our team pulled together to aid our communities this year. We were pleased to return to the Nashua Goes Back to School event supporting students with resources for a healthy and successful educational year. We returned as volunteers for the Salvation Army of Greater Nashua’s Annual AppleFest and donated to their Angel Tree Tag program during the holidays. Then, with overwhelming participation from our members, monetary donations were awarded to Meals on Wheels, City Year, and Harbor Homes in our “’Tis the Giving Season” campaign. We thank you for your involvement. Triangle Credit Union welcomed two new, bi-lingual Board Directors, Lillian Rodriguez and Adeel Tahir, further ensuring our leadership reflects a diverse membership. Triangle expanded financial literacy programs to include a Homebuyer Webinar in Spanish, while also planning for the inception of our new “Conexion Latina con Triangle Credit Union,” a Spanish-language virtual financial forum held monthly in 2022. As members continued to embrace self-service options like online and phone banking, our contact center saw a sharp increase in support requests. To ensure we continued to provide the needed assistance, we overhauled our phone system, introduced a new chat feature within online banking that includes after-hours messaging, and added the ability to make an appointment. We continue to identify and prioritize enhancements and additions to our services to ensure our members have a great experience with Triangle. Thank you to the Board of Directors, Supervisory Committee, and the dedicated Triangle Credit Union staff for ensuring 2021 was a successful year. A special thank you to our members for continuing to choose Triangle Credit Union for your financial needs. Margo Compagna Board Chair
We welcome all groups and individuals desiring to be part
DIVERSITY
of our mission with the goal to build unity by embracing and supporting all cultures.
TREASURER’S REPORT On behalf of the Board of Directors, I am pleased to report Triangle Credit Union ended fiscal year 2021 in a strong financial position despite a challenging year. Loan originations in 2021 were $215.0M, with several external factors which impacted consumer and commercial lending during the year. While there was a low inventory of new and used homes in the housing market, existing homeowners took advantage of historically low interest rates, leading to an increase in loans of $73.6M. An increase in home equity lines of credit (HELOC) loans of $30.3M exceeded the budget goal of $30M and the sale of mortgages to Freddie Mac of $33.7M was also a positive factor. Limited inventory of new and used vehicles in the auto market contributed to a decrease in new vehicle lending of $8.1M, while used vehicles increased $5.4M. Some business members took advantage of government issued tax credits, which resulted in a $7.2M decline in commercial mortgage and equipment loans. Overall, the Credit Union ended the year with a loan balance of $532.0M, a decrease of $25.0M or -4.47% compared to the prior year. While lending was down, growth in investments offset the shortfalls in interest income. Deposit growth was strong, ending the year with a balance of $751.9M, an increase of $49.0M or 6.97% over the prior year. Checking balance increased $3.5M to $89.8M; Online Savings increased $13.1M to $100.0M; and Money Market accounts saw the largest increase of $27.5M to end the year at $107.0M. Total shares during 2021 increased by $50.0M or 6.97% from the prior year. Total assets increased 6.11% to $877.3MM. Net income for the year was $3.4 million, primarily a result of a decrease in overall operating expenses and an increase in non-operating income. The Credit Union continues to maintain a low delinquency ratio of 0.24% and a charge-off ration of 0.10% at yearend; both ratios are below industry standards. On behalf of the Credit Union, I would like to express my sincere thanks and appreciation to our elected officials, committee members and volunteers for their dedication and support to the management team, as well as our employees for their continued service to our members. Respectfully submitted, David Fredette Treasurer
We connect with our members and employees by respectfully
SERVICE
committing to their needs while adhering to Service Strategies Standards.
SUPERVISORY COMMITTEE The members of the Supervisory Committee want to thank you for your continued loyalty in making Triangle Credit Union your choice for all your financial services. Thanks to you, TCU has grown and changed with the times from our diverse staff to being on the cutting edge with new products and services. The Supervisory Committee takes many steps to earn and keep your trust such as, our constant review and confirmation of both the accuracy and integrity of TCU’s financial statements, and our policies and procedures. We take this seriously and we keep TCU’s financial strength and security as our primary goal so that you know your funds are protected. To that end, this past year our biennial verification of the full membership of Triangle Credit Union was performed. This was done using members of our staff and was overseen by the Supervisory Committee. The verification review was found to be consistent with the returns in previous years with nothing out of the ordinary. Once again, this year, there were no complaints received from our members. Our internal reviews are done by Shatswell, MacLeod & Company, P.C. Each review is a comprehensive audit of our policies and procedures. We track these audits and review them during our meetings with the appropriate TCU managers. We also contract with Baker Newman Noyes to conduct an independent audit of our financial statements. They certified that for the past year we were in full compliance with, “generally accepted accounting principles” and that our financial statements were correct. This past year has been challenging, but thanks to our exceptional leadership and staff, TCU has remained strong. As Chair of the Supervisory Committee, I am pleased to report to you that we are in excellent financial condition. This could not have been accomplished without your continued trust and support and the hard work of our employees, officers, Board of Directors, and members of the Supervisory Committee. Respectfully submitted, Ed Lecius, Chair Derek Danielson Richard Lavoie Jack Monahan Ron Rioux
AWARDS
WINNER
WINNER
Readers’ Choice
Readers’ Choice
2021
2020
BALANCE SHEET - 5 YEAR HISTORY ASSETS OTHER LOANS
2017
2018
2019
2020
2021
$233,578,105.90
$264,214,787.94
$274,173,894.69
$247,872,996.34
$242,420,691.43
FIRST MORTGAGES
$186,217,876.31
$182,889,177.63
$184,258,582.66
$164,006,621.01
$151,491,688.05
BUSINESS/COMMERCIAL LOANS
$73,204,637.74
$82,710,530.75
$88,261,397.94
$98,325,158.11
$91,139,238.43
$1,557,816.59
$1,973,804.99
$2,557,470.29
$1,809,061.25
$1,293,216.76
SECOND MORTGAGES HOME EQUITY
$56,188,865.14
$57,038,230.72
$52,882,255.95
$44,885,727.36
$45,651,969.41
TOTAL LOANS
$550,747,301.68
$588,826,532.03
$602,133,601.53
$556,899,564.07
$531,996,804.08
LESS RES. FOR LOAN LOSSES NET LOANS
($1,931,371.74)
($2,051,118.51)
($2,306,217.07)
($2,803,145.38)
($2,291,083.18)
$548,815,929.94
$586,775,413.52
$599,827,384.46
$554,096,418.69
$529,705,720.90
$209,374.91
$174,227.04
$83,420.21
$120,202.85
$19,429.19
CASH: DUE FROM BANKS TELLER/VAULT CASH
$5,740,055.52
$3,752,870.74
$4,298,605.86
$4,146,348.95
$4,272,688.60
CHECKS IN PROC OF COLL.
$3,215,669.53
$3,336,863.77
$1,971,771.75
$1,628,835.32
$2,436,624.60
$35,592,688.28
$31,376,192.60
$43,006,595.04
$48,683,286.77
$165,689,952.31
CORPORATE & FHLB
$7,096,886.11
$3,002,078.29
$22,726,772.32
$162,256,255.71
$127,533,269.97
SAVINGS. CERTIFICATES
$9,854,379.37
$7,865,212.49
$6,978,212.49
$18,157,010.63
$9,574,082.16
INVESTMENTS: AGENCY & US SEC.
CORPORATE BONDS & EQUITIES
$31,928,020.26
$23,101,894.62
$15,616,613.95
$5,557,850.68
$3,572,056.21
TOTAL INVESTMENTS
$84,471,974.02
$65,345,378.00
$88,328,193.80
$234,654,403.79
$306,369,360.65
PREPAID EXPENSES
$2,300,972.69
$1,508,090.34
$1,876,408.48
$2,501,943.33
$4,475,900.63
ACCRUED INCOME
$1,571,730.84
$1,531,992.51
$1,678,936.97
$1,361,877.28
$1,378,929.80
FIXED ASSETS
$9,230,743.06
$9,929,732.64
$11,477,097.51
$11,439,974.15
$10,776,449.60
NCUA INS. FUND
$5,029,114.94
$5,243,305.76
$5,409,404.31
$6,061,098.93
$6,705,324.93
OTHER ASSETS
$4,860,644.71
$4,869,691.71
$5,978,224.15
$10,600,069.28
$11,104,732.68
PROPERTY IN PROCESS OF LIQ. TOTAL ASSETS
$89,145.31
$43,820.00
$404,943.25
$151,698.18
$34,887.98
$665,535,355.47
$682,511,386.03
$721,334,390.75
$826,762,870.75
$877,280,049.56
$817,063.56
$1,120,033.14
$1,444,093.25
$1,123,069.62
$1,412,380.72
LIABILITIES ACCOUNTS PAYABLE TAXES PAYABLE
$8,881.19
$11,676.57
$9,704.59
$9,934.66
$37,346.67
BILLS PAYABLE
$322,267.13
$362,756.45
$954,277.05
$917,282.24
$1,040,328.25
$59,514,987.43
$68,709,011.42
$70,935,035.68
$64,554,493.90
$60,450,000.00
$1,861,231.78
$1,531,915.36
$1,781,191.90
$3,179,203.94
$3,583,500.23
SHARE DRAFTS
$52,750,967.73
$55,220,152.61
$59,644,750.38
$86,356,302.19
$89,885,374.95
IRA'S
$36,080,522.66
$36,558,456.92
$40,291,035.86
$39,117,860.62
$36,110,306.37
CERTIFICATES
$182,780,861.46
$186,332,653.09
$210,883,642.88
$177,412,673.64
$133,120,617.12
REGULAR SHARES
$189,937,732.77
$188,328,181.92
$191,117,139.81
$263,634,310.45
$318,270,132.12
MONEY MARKET
$63,745,853.17
$62,713,496.21
$57,412,289.38
$79,441,538.24
$106,952,562.09
BORROWED FUNDS OTHER LIABILITIES DEPOSITS:
BUSINESS ACCOUNTS
$30,594,211.30
$32,900,143.07
$34,690,452.92
$56,929,843.79
$67,531,626.03
$555,890,149.09
$562,053,083.82
$594,039,311.23
$702,892,528.93
$751,870,618.68
REGULAR RESERVE
$8,198,842.64
$8,198,842.64
$8,198,842.64
$8,198,842.64
$8,198,842.64
UNDIVIDED PROFIT
$41,380,470.69
$45,068,346.39
$48,640,775.59
$51,178,533.98
$54,530,868.46
TOTAL SHARES CAPITAL:
UNREALIZED GNS/LSS ON INVEST. UNREALIZED PENSION OBLIGATIONS TOTAL CAPITAL TOTAL LIABILITIES & CAPITAL
$411,883.96
($428,634.76)
$221,934.82
$331,688.84
$1,373,756.91
($2,870,422.00)
($4,115,645.00)
($4,890,776.00)
($5,622,708.00)
($5,217,593.00)
$47,120,775.29
$48,722,909.27
$52,170,777.05
$54,086,357.46
$58,885,875.01
$665,535,355.47
$682,511,386.03
$721,334,390.75
$826,762,870.75
$877,280,049.56
PROFIT & LOSS STATEMENT - 5 YEAR HISTORY 2017
2018
2019
2020
2021
INTEREST ON LOANS
$19,821,450.83
$21,335,167.22
$24,351,644.78
$23,394,281.72
$20,917,232.30
INCOME FROM INVESTMENTS
$1,033,907.70
$1,522,326.18
$1,736,288.54
$1,294,278.36
$830,416.82
SHARE DRAFT FEES
$1,323,152.32
$1,421,509.00
$1,472,203.50
$1,089,463.46
$1,201,506.59
DEBIT CARD/ATM FEES
$2,212,367.83
$2,417,814.74
$2,474,766.23
$2,728,269.87
$3,318,890.21
ACCOUNT MAINTENANCE FEES
$521,982.37
$517,149.73
$511,423.58
$509,727.97
$512,591.70
OTHER FEE INCOME
$1,061,957.27
$1,161,676.06
$1,376,417.63
$2,061,534.95
$1,477,450.66
$25,974,818.32
$28,375,642.93
$31,922,744.26
$31,077,556.33
$28,258,088.28
COMPENSATION
$8,484,503.57
$8,444,747.51
$9,222,282.83
$10,655,606.60
$9,751,057.28
EMPLOYEE BENEFITS
$2,351,645.44
$2,714,599.25
$3,065,707.38
$3,103,110.73
$3,297,020.54
TRAVEL AND CONFERENCES
$193,315.68
$219,019.27
$176,446.34
$62,515.48
$82,089.27
ASSOCIATION DUES
$48,276.97
$52,187.74
$53,318.73
$54,531.09
$56,198.64
OFFICE OCCUPANCY EXPENSES
$1,313,539.61
$1,432,928.99
$1,489,620.92
$1,703,158.76
$1,691,335.96
OFFICE OPERATIONS EXPENSES
$4,081,351.50
$4,259,179.73
$4,688,656.67
$5,021,107.94
$5,501,294.21
ADVERTISING & PROMOTION EXPENSES
$279,399.28
$262,204.47
$264,131.17
$208,200.84
$213,332.48
LOAN SERVICING EXPENSES
$345,612.44
$328,486.76
$410,920.56
$439,343.77
$367,735.13
PROFESSIONAL AND OUTSIDE SERVICES
$326,015.13
$430,940.46
$709,001.80
$361,563.21
$586,196.01
PROVISION FOR LOAN LOSSES
$720,000.00
$762,000.00
$839,000.00
$1,117,000.00
($102,420.11)
FED. SUPERVISION & EXAMS
$220,411.30
$157,609.85
$162,202.96
$180,463.34
$275,846.53
CASH OVER AND SHORTS
$7,209.34
($3,167.07)
($841.28)
$3,657.18
$2,446.44
ANNUAL MEETING EXPENSES
$4,646.05
$9,057.61
$6,217.07
($4,720.13)
$100.00
MISC OPERATING EXPENSES
$223,407.98
$95,774.68
$284,343.39
$53,127.74
$144,145.52
FASB 91 ORIGINATION COST
($480,953.01)
($506,168.23)
($498,339.82)
($571,219.15)
($535,546.84)
TOTAL OPERATING EXPENSES
$18,118,381.28
$18,659,401.02
$20,872,668.72
$22,387,447.40
$21,330,831.06
INCOME (LOSS) FROM OPERATIONS
$7,856,437.04
$9,716,241.91
$11,050,075.54
$8,690,108.93
$6,927,257.22
GAINS (LOSSES) ON INVESTMENTS
$176,996.79
$0.00
$711,568.60
($600,020.15)
($3,395.70)
GAINS (LOSSES) ON DISP. OF ASSETS
($15,883.71)
($585.01)
$25,907.98
($21,073.64)
$108,404.32
$209,905.48
$58,616.68
$247,364.24
$2,279,936.23
$764,682.21
$0.00
$351,404.60
$0.00
$0.00
$0.00
$371,018.56
$409,436.27
$984,840.82
$1,658,842.44
$1,553,602.68
INCOME (LOSSES) BEFORE DIVIDENDS
$8,227,455.60
$10,125,678.18
$12,034,916.36
$10,348,951.37
$8,480,859.90
INTEREST ON BORROWED FUNDS
$1,546,404.58
$1,362,120.66
$1,689,201.38
$6,294,698.66
$3,815,576.77
DIVIDENDS
$4,033,268.41
$5,075,681.82
$6,773,285.79
$1,516,494.32
$1,312,948.65
NET INCOME (LOSS)
$2,647,782.61
$3,687,875.70
$3,572,429.19
$2,537,758.39
$3,352,334.48
INCOME
TOTAL OPERATING INCOME OPERATING EXPENSES
NON-OPER. GAINS (LOSSES)
GAINS (LOSSES) ON SALE OF MORTGAGES NCUA IMPAIRMENT/ASSESSMENT FEE EXPENSES ON O.R.E.O. TOTAL NON-OPERATING GAINS (LOSSES)
KEY OPERATING STATISTICS - 5 YEAR HISTORY 2017
2018
2019
2020
2021
National Ave as of 6/2021
LOAN DELINQUENCY RATIO
0.3%
0.2%
0.3%
0.6%
0.2%
0.4%
YIELD ON AVERAGE LOANS
3.6%
3.7%
4.1%
4.0%
3.8%
4.4%
YIELD ON AVERAGE INVESTMENTS
1.4%
2.0%
2.3%
0.8%
0.3%
0.8%
RETURN ON INCOME/AVERAGE ASSETS
4.0%
4.2%
4.6%
4.0%
3.3%
3.5%
COST OF FUNDS/AVERAGE ASSETS
0.9%
1.0%
1.2%
1.0%
0.6%
0.5%
GROSS SPREAD
3.2%
3.3%
3.3%
3.0%
2.7%
3.0%
OPER. EXPENSES/AVERAGE ASSETS
2.8%
2.8%
3.0%
2.9%
2.5%
2.8%
NET INCOME/AVERAGE ASSETS
0.4%
0.6%
0.5%
0.3%
0.4%
0.2%
CAPITAL/ASSETS (NET)
7.4%
7.4%
7.6%
6.9%
7.0%
10.0%
DEPOSIT GROWTH (%)
7.7%
1.1%
5.7%
18.3%
7.0%
16.4%
LOANS
76.3%
75.2%
76.3%
75.3%
74.0%
62.2%
INVESTMENTS
4.0%
5.4%
5.4%
4.2%
2.9%
6.3%
ALL OTHER
19.7%
19.5%
18.3%
20.6%
23.0%
31.5%
CD'S / TOTAL DEPOSITS
32.9%
33.2%
35.5%
25.2%
17.7%
15.1%
IRA'S / TOTAL DEPOSITS
6.5%
6.5%
6.8%
5.6%
4.8%
4.9%
CHECKING / TOTAL DEPOSITS
9.5%
9.8%
10.0%
12.3%
12.0%
20.0%
SAVINGS / TOTAL DEPOSITS
34.2%
33.5%
32.2%
37.5%
42.3%
36.6%
MONEY MARKET / TOTAL DEPOSITS
11.5%
11.2%
9.7%
11.3%
14.2%
21.8%
BUSINESS DEPOSITS / TOTAL DEPOSITS
5.4%
5.9%
5.8%
8.1%
9.0%
1.6%
SOURCES OF INCOME % OF TOTAL
DEPOSIT MIX
SUPERVISORY COMMITTEE Standing (left to right): Richard Lavoie, Committee Member; Ed Lecius, Chairman Seated (left to right): Ron Rioux, Committee Member; Jack Monahan, Committee Member; Derek Danielson, Committee Member
BOARD OF DIRECTORS
Margo Compagna
Robert Demers
Mark Richardson
Rebecca MacLennan
David Fredette
Chairman
1st Vice President
2nd Vice President
Secretary
Treasurer
Bob Duhaime
David Degulis
Lillian Rodriguez
Adeel Tahir
Director
Director
Director
Director
Lisa VanBiene
John Ziemba
Pamela Ford
SVP Commercial Services
SVP Lending
SENIOR MANAGEMENT
A. Scott MacKnight
Mark Warner
CEO/President
EVP/Chief Financial Officer SVP Member Services
Rebecca Thomas
Karin Taylor
SVP Marketing
SVP Human Resources
MANAGEMENT
Jose Rivera Hernandez David Helie
Kathy Card
Sharon Kikutis
Karen A. Wood
VP of Data Services Franklin St., Nashua, NH
Facilities Manager Temple St., Nashua, NH
H.R. Manager Temple St., Nashua, NH
AVP Operations Temple St., Nashua, NH
VP of Finance/Controller Temple St., Nashua, NH
Ryan Ruggiero
Seana Hill
Judith Ulloa
Nathalie Mena
Lisa Ward
Contact Center Manager Temple St., Nashua, NH
Branch Manager Franklin St., Nashua, NH
Branch Manager Route 101A, Amherst, NH
Branch Manager Windham Rd., Derry, NH
Branch Manager Candia Rd., Manchester, NH
Jamie Balsamo
Marcel Sanchez
Lyn Anderson
Angelica Resto
Terri Connolly
Branch Manager Temple St., Nashua, NH
Branch Manager DW Hwy, Merrimack, NH
Branch Manager Elm St., Manchester, NH
Branch Manager St. Joseph Hospital & DW Hwy, Nashua, NH
Marketing Manager Temple St., Nashua, NH
Lana Constantino AVP of Community Outreach & Sales Franklin St., Nashua, NH
IN LOVING
MEMORY
Ronald Rioux November 17th, 1943 – February 2nd, 2022 Ron Rioux of Nashua, NH passed away on February 2, 2022. Ron was a visible fixture in the Nashua area for decades and worked most his career at Nashua Corp. on Franklin Street. Ron was a long-standing member of Triangle Credit Union, where he dedicated his service as a Supervisory Committee Member for 13 years. As a credit union, we were honored to have Ron as a member and as part of the Supervisory Committee; he will be remembered fondly and missed dearly.
trianglecu.org (603) 889-2470 Amherst - Derry - Manchester - Merrimack - Nashua
NMLS# 528721