HEALTHY STREETS
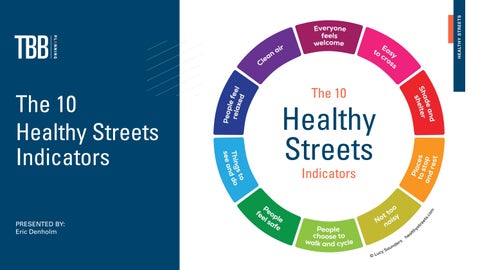
The 10 Healthy Streets Indicators PRESENTED BY: Eric Denholm
The 10
Healthy Streets Indicators
Everyone Feels Welcome
The 10
Healthy Streets INDICATORS
• Places to spend time and converse • Activity reflects diversity of local community • Children play without adult supervision • Ownership of the street by community
Photo Location: Seattle
Easy to Cross
The 10
Healthy Streets INDICATORS
• Avoiding severance • Direct, quick and convenient • side-street priority • Waiting less than 30 seconds to cross • People walk slowly at their own pace
Photo Location: Perth
Shade and Shelter
The 10
Healthy Streets INDICATORS
• Trees, awnings, colonnades • Use of street whatever the weather • People walk slower in hotter environments • Concentrate shade where people spend time, eg. seating, bus stops, waiting to cross • Be mindful of wind tunneling created by buildings
Photo Location: Portland
Places to Stop and Rest
The 10
Healthy Streets INDICATORS
• Regular opportunities to stop every 5 to 10 minutes - publicly accessible • Space for walking and lingering (refer nsw guidelines) • Needs of ALL people - eg. Not just hipsters • Comfortable places where people want to socialise • Located in view from private dwellings/ businesses • Includes places to park bikes, securely
Photo Location: San Francisco
Not too Noisy
The 10
Healthy Streets INDICATORS
• Reduced stress and anxiety for users and inhabitants • Low speed and low traffic volumes • Prioritising places where ppl spend time and interact • Adjoining private buildings leave windows/doors open • No motorist’ aggression (horns, revved engines, brakes) • Be mindful of deliveries and waste collection and alternatives for denser environments
Photo Location: Seattle
People Choose to Walk and Cycle
The 10
Healthy Streets INDICATORS
• Arresting the physical inactivity crisis • People choose to walk, cycle and public transport if it is more attractive than driving • Cannot have it all - we need to think about places that concede a lower level of service for vehicles in order to prioritise people • Plan for future land use and adequate space for people • Do people driving use their full attention Photo Location: Bristol
People Feel Safe
The 10
Healthy Streets INDICATORS
• Perception of safety - how does traffic make ppl feel • Street lighting addressing pavement for people, not just road carrigeway for cars • The thought of vehicle collision is not worrying • People cycling or driving do not engage in risky or aggressive manoeuvres • Antisocial behaviour; safety at night too • Is waiting for a bus scary or isolating? Photo Location: Barcelona
Things to See and Do
The 10
Healthy Streets INDICATORS
• Visually appealing • Opportunity to interact with art, nature, people, local shops and services • evidence of human activity and interactions • Streets that are interesting are less of a chore to walk • Do private dwellings/businesses offer any ‘gifts’ to the street - front gardens, window displays etc. • Well kept landscaping
Photo Location: San Francisco
People Feel Relaxed
The 10
Healthy Streets INDICATORS
• Comfortable ‘outdoor rooms’ - proportionate scale • Clean, safe, not too loud • Enough space for all users • Appropriately peaceful or lively given context • Cycling surfaces free of defects, drainage pits, tree litter • Cars crossing footpaths (driveways / crossovers)
Photo Location: Toronto
Clean air
The 10
Healthy Streets INDICATORS
• Brake particulates and rubber from tyres • Air quality affects vulnerable and disadvantaged the most • People walk and cycle for short trips - the low speed neighbourhood / travel time paradox • Mix of heavy vehicles utilising the street • Designing out aggressive behaviour
Photo Location: Vancouver