




What are Property, Plant and Equipment?
Property, Plant and Equipment, also known as fixed assets are tangible items which are held for use in the production or supply of goods or services or for administrative purpose. In order to fall within the definition of fixed assets, apart from above criteria, it is further required that such tangible items should be expected to be used during more than one period. The cost of an item of property, plant and equipment etc. is recognized as an asset, if and only if :
The cost of an item of property, plant and equipment etc. is recognized as an asset if and only if :
(a
(b)the cost of an item can be measured reliably.
Accordingly, after initial investment in PPE, any subsequent cost incurred is also added to the cost of fixed assets, provided, if above two conditions are satisfied.

Major spare parts and standby equipment which are expected to be used for more than one period, also forms part of plant and machinery.
Certain items of PPE may not directly increase the future economic benefits to an entity but may be necessary for an entity to obtain the future economic benefits from
other assets. These assets also form part of PPE. For example, environmental compliance related equipment in a chemical manufacturing unit.
Fixed assets are known as “Property, Plant and Equipment” in a case where Indian Accounting Standards (Ind AS) applies. IndAS16-Property,Plant& Equipment, deals with the same. Further, as per amendment in schedule III (Preparation of Financial Statements) to the Companies Act, 2013, the “fixed asset” is replaced with “Property, Plant and Equipment”, w.e.f. 11th Oct., 2018.
Fixed asset is a non-current asset, and accordingly in the balance sheet shown under the head non-current assets.
Depreciation is the systematic allocation of the depreciable amount of an asset over its useful life. Accordingly, the amount of depreciation is provided for the use of the assets, as an item of expenditure in the statement of profit & loss. Depreciation is a non-cash item, as it is an allocation of the cost of an asset in the statement of profit & loss out of the amount of fixed assets already acquired. Accordingly, the net amount of fixed assets (after depreciation) is shown in balance sheet.
Depreciation is calculated on the basis of cost of an asset, less its residual value. Useful life of an asset is defined in terms of asset’s expected utility to the entity. The following factors are taken into consideration, while determining useful life: —
(a) expected usage,
(b) expected physical wear and tear,
(c) technical obsolescence and
(d) legal limits on use of the asset.
Where there is a change in fair value of the fixed assets, the revaluation model is applied. Fair value is the price that would be received when an asset is sold. Fair value is not necessarily the market price. Do you know?
In case of an entity to which Ind AS does not apply fixed assets is known as “Property, Plant & Equipment and Tangible Assets”. In case of an entity to which Ind AS applies, the fixed asset is known as “Property, Plant & Equipment”. The classification for the same is required to be given as under :
CHAPTER 1
I. Property, Plant & Equipment
(i
(a) Land;
(b) Buildings;
(c) Plant and equipment;
(d (e) Vehicles;
(f
(g) Others (specify nature).
(ii) Assets under lease are to be sepaassets
I. Property, Plant & Equipment
(i
(a) Land;
(b) Buildings;
(c) Plant and equipment;
(d (e) Vehicles;
(f (g) Bearer Plants;
(h) Others (specify nature).
(
ii) Assets under lease are to be sepaassets
Schedule III to the Companies Act, 2013, requires submission of separate information of the gross and net amount of each class of fixed assets being Property, Plant and Equipment at the beginning and end of the Balance Sheet date. It further requires to separately disclose the amount of addition, disposals, acquisition through business combination, other adjustments like impairment losses or reversals separately, including change due to revaluation of 10% or more.
With effect from 1st April, 2014, based on IFRS approach, the depreciation charge has been rationalized by amending Schedule II under section 123 of the Companies Act, 2013. Accordingly, the useful life of an asset has been fixed in the Schedule II to the Companies Act, 2013. With respect to major fixed assets, the useful life has been fixed as under: —
(a) Building (other than factory building) RCC frame- 60 years
(b) Building (other than factory building) other than RCC frame- 30 years
(c) Factory Building- 30 years
(d) - 15 years
(e) - 25 years
(f) Furniture and Fixtures - General- 10 years
(g) Motor Vehicle - Cars- 6 years
(h) - 5 years
(i) - 10 years
(FordetailspleasereferScheduleIItotheCompaniesAct,2013availableon websiteofMCA)
With effect from 1st April, 2014, it has further mandated to follow the useful life of fixed assets, as per said Schedule II to the Companies Act, 2013. If a company is adopting some different benchmark for useful life other than that prescribed in schedule II, necessary disclosure is required to be made in the notes.
The analysis of fixed assets as well as addition to fixed assets are important, as it is found in some cases that entity is showing certain fixed assets as well as addition to fixed assets in a particular year, but the economic benefit of such fixed assets or addition made to fixed assets were not found.
It is also seen that there may be huge amount of investment into fixed assets but the economic benefit commensurate with the amount of investment is not found. The analysis of fixed assets revolves around the amount of investment and economic benefit from such investment.
It is elementary that no prudent businessman will invest substantial resources in fixed assets without looking into the benefits which are going to accrue to the business by use of such fixed assets. For example, the investments in plant and machinery and factory building are directly related to higher production as well as higher manufacturing sales. Investment in land may be for long-term capital appreciation or for future requirement of the land in business. Therefore, the investment in land may not result into immediate resources to the entity.
Generally, it is found that where an entity is showing financial stress in the business, the addition to fixed assets is used as a mode of obtaining fresh term loan from financial institutions. The intention behind such term loan may be to use the funds in the business rather than for “Real” addition to fixed assets. It is also found sometimes that “addition to fixed assets” is used as a route to divert resources/funds. There may not be genuine or a real requirement of addition to fixed assets in a given case and therefore; by showing addition to fixed assets, the amounts/funds are diverted from the business under the guise of “addition to fixed assets”. The issue becomes more critical, when such purchases of fixed assets are found to be from a related party.
Therefore, a proper and detailed analysis of investment in fixed assets should be done: What are the various fixed assets? What are the types of fixed assets? The total amount of investment, additional amount of investment in fixed assets during the year under consideration needs to be looked into and the
CHAPTER 1
Property, Plant and Equipment – Tangible
same should match the nature of business, type of business, volume of business etc. The overall profitability, the capacity and utilization of the existing facilities and related party details of purchases of fixed assets can also bring insight for the purpose of analysis of fixed assets.
In the Chart No.1, the stepwise approach is explained for the purpose of decoding of fixed assets and to find out early warning sign or strength or insight, wherein each action of decoding is linked to its objective: —
Steps
1Find out the nature of business and/or manufacturing and/or servicing
2Find out the volume of business
3 the amount of gross block in each cate-
4Compare the amount of gross block of
5
6Look at the overall amount of investment assets is commensurate with the rev-
7Look at the details of related party accounts by way of purchases from related party
8Compare the result of step-6 with step-7
9Find out the amount of loan taken by By comparing the loan amount with results of step-6, can indicate the possible diversion of funds
(ChartContd.)
Property, Plant and Equipment – Tangible CHAPTER 1
(Chart1-Contd.) Steps 1026 of key#4)cates early warning sign
11Compare the overall manufacturing ca-
Case Analysis - 1
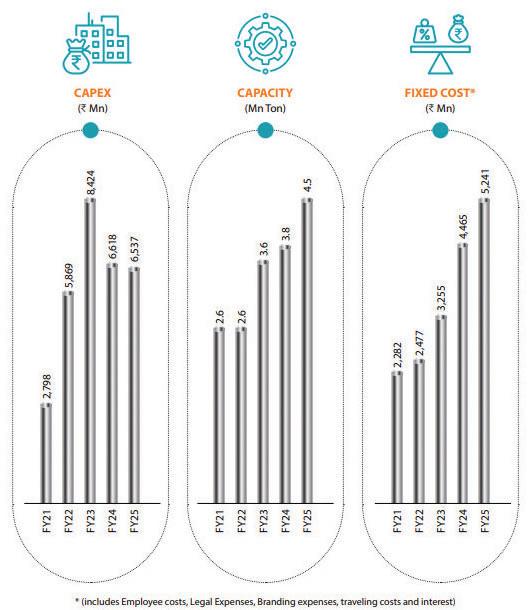
APL Apollo Tubes Limited – India’s number 1, Structural Steel Tube Player with a Pan – India manufacturing footprint having 11 manufacturing facilities (source – www.apapollo.com), in its annual report for FY 2025, as available on the website of the company stated to have made substantial investment into plant & machineries and capacity, as per the Box 1: –BOX 1
CHAPTER 1
Analysis
Property, Plant and Equipment – Tangible
5 years the company has made a Capex (Investment into Fixed Assets of ` 30,246 Mn i.e. ` 3,025 Crores. As a result of this the Capacity has increased from 2.6 Mn Ton to 4.5 Mn Ton. and required to be seen.
products/manufacturing sales.
Before looking into the amount of actual increase in sale of products/ manufacturing sales, the amount of investment made into plant & is provided in the Box 2:—
BOX 2
DETAILS OF ADDITION TO PLANT & MACHINERY (` in crores)
FY 2022FY 2023FY 2024FY 2025 1,6731,7471,7311,937 Net Block of Property Plant and Equipment 1,2961,2801,1981,315 Plant and Machinery -Opening Balance 8251,2541,3291,308 44711067185 -Sales/Transfer of Plant and Machinery (18)(36)(88)(20) -Closing Balance of Plant and Machinery 1,2541,3291,3081,473
Analysis
` 809 Crores.
derived out of such investment is crucial to understand the same. and object of such investment is to enhance manufacturing capacity, as
CHAPTER 1
Property, Plant and Equipment – Tangible
as to upkeep the working of plant & machineries. Therefore, in the Box 3 below, the details of total sales, and revenue from BOX 3 (` in crores)
From the above details as provided by the company in its Statement of -
ucts has increased from ` 11,210 Crores to ` 13,945 Crores. Therefore, the increase in sales in absolute value is of ` 2,735 Crores from FY 2022 to FY 2025.
In terms of percentage the sale of products has increased by 24% from FY 2022 to FY 2025, as against investment in plant & machineries of ` 809 Crores, which is about 98% of the opening block of plant & machineries as at 1st April, 2021.
period of 4 years is of 98%, as against which increase in sale of products is about 24%. This is the way; one should look into the issue pertaining
Not only that one should also look into the fact about the nature of sales,
Products”. Meaning thereby the same does not necessarily indicate that it is the sale of the goods, which has been manufactured by the company. Therefore, having deep drive further it is found that on the face of the
CHAPTER 1
Property, Plant and Equipment – Tangible
The Division II to Schedule III of the Companies Act requires a separate
Therefore, it appears that the sale of products as per above Box 3, include the sale of traded goods, purchases of which has been shown separately. In the following table if purchases of stock-in-trade if excluded, what would have been the manufacturing sales (by use of plant & machinery), are provided:—
(` in crores)
FYTotal Sale of Products Purchases of Stock-in-trade Sales from Manufacturing
FY 202211,21085910,351
FY 202313,8761,34312,533
FY 202413,4761,75811,718
FY 202513,9452,77311,172
The above true analysis indicates that the actual increase in manufacturing sales over the period of 4 years is about 8% and not 24%. The 24% is the overall increase in sales, which include the sales of traded goods (which has no use of plant & machineries).
The increase in sales of manufacturing of goods is found to be of ` 821 ` 809 Crores (which is 98% of the opening gross block of plant & machineries).
Not only that the amount of power & fuel also indicates almost same
` 118 Crores in FY 2022 has increased to ` 140 Crores in FY 2025, i.e. an increment of about 18%, in terms of amount.
Sum up
To sum up the amount of ` 3,025 Crores increased by the company APL Apollo on Capex, which included a major amount of ` 809 Crores on plant & machineries over a period of 4 years ending 31st March, 2025, has resulted into increase in Sales of R. 2,735 Crores, over the period of 4 years. Thus, the Capex could not be seen into increased production.
One of the underline principle of this book, while decoding Balance Sheet, is to interlink the various details, which are inter related, so as to understand the relevance/usefulness of the said line item of the balance sheet, as in above case analysis. Not only interrelation, but other similar details analysis, also
helps one to clearly understand the same and logically conclude, as I have done in this case analysis of a steel manufacturing company that major part of increase in sale of products, is found out of the traded goods and not by way of goods manufactured – by use of plant and machineries – out of the addition made, as a part of Capex. This finding is also supported by the fact that amount of Power and Fuel has been almost found to be similar, in spite of increase in sale of products, as the same was out of sale of traded goods and not due of manufacturing.
This case analysis pertains to a company, Uttam Galva Steel Ltd. whose name was appeared in the second list of loan defaulters, issued by Reserve Bank of India on 30th August 2017. Since, by now we know that this company has already defaulted in repayment of borrowings from banks in the year 2017 and therefore, this case analysis has been taken, to convey my readers that, it is likely in cases of addition to plant & machinery not resulting into increased production, to face the liquidity crunch. As substantial amount of investment into plant and machineries or any fixed assets, uses the resources in the nature of funds. These funds are either borrowed funds (from banks, financial institutions etc) or from internal accruals. In either case it is use of substantial funds and thus, has bearing on the life of company, as in this old case, which has already gone under bankruptcy, and that is why selected to explain the issue in the hand.
The Note No.11 of the Audited Financial Statements for FY 2016, the details of fixed assets and depreciation as on 31st March, 2016 has been provided. The details are as per Box 4:—
BOX 4
(Box4-Contd.)
(A)6,108.18455.730.646,563.271,426.16229.750.441,655.474,907.804,682.03 (B) Intangible Assets
TOTAL (B)23.39--23.394.704.68-9.3814.0118.68
TOTAL (A+B)6,131.57455.730.646,586.661,430.86234.420.441,664.854,921.814,700.71 YEAR 5,240.741,246.72355.866,131.571,233.54205.388.071,430.864,700.71-
Analysis
` 437 crore and as a result, the closing gross block of Plant & Machinery is ` 5,286 crores as on 31st March 2016. As explained hereinabove in Chart 1 under the head “How to analyze” company as provided in note 19 is given.