BY THE NUMBERS
2025
1
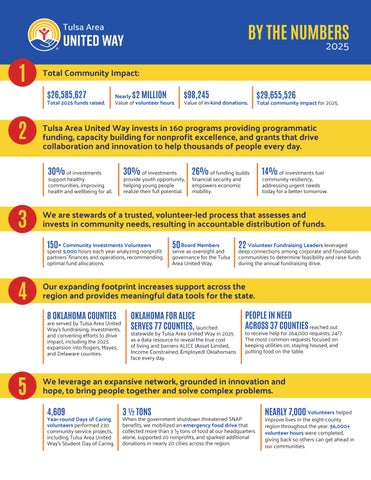
Total Community Impact: $26,585,627
Total 2025 funds raised.
2
Nearly $2 MILLION Value of volunteer hours.
support healthy communities, improving health and wellbeing for all.
30% of investments
provide youth opportunity, helping young people realize their full potential.
spend 5,000 hours each year analyzing nonprofit partners’ finances and operations, recommending optimal fund allocations.
Total community impact for 2025.
26% of funding builds financial security and empowers economic mobility.
14% of investments fuel
community resiliency, addressing urgent needs today for a better tomorrow.
50 Board Members
serve as oversight and governance for the Tulsa Area United Way.
22 Volunteer Fundraising Leaders leveraged
deep connections among corporate and foundation communities to determine feasibility and raise funds during the annual fundraising drive.
Our expanding footprint increases support across the region and provides meaningful data tools for the state. 8 OKLAHOMA COUNTIES
are served by Tulsa Area United Way’s fundraising, investments, and convening efforts to drive impact, including the 2025 expansion into Rogers, Mayes, and Delaware counties.
5
$29,655,526
We are stewards of a trusted, volunteer-led process that assesses and invests in community needs, resulting in accountable distribution of funds. 150+ Community Investments Volunteers
4
Value of in-kind donations.
Tulsa Area United Way invests in 160 programs providing programmatic funding, capacity building for nonprofit excellence, and grants that drive collaboration and innovation to help thousands of people every day. 30% of investments
3
$98,245
OKLAHOMA FOR ALICE SERVES 77 COUNTIES, launched
statewide by Tulsa Area United Way in 2025 as a data resource to reveal the true cost of living and barriers ALICE (Asset Limited, Income Constrained, Employed) Oklahomans face every day.
PEOPLE IN NEED ACROSS 37 COUNTIES reached out
to receive help for 264,000 requests, 24/7. The most common requests focused on keeping utilities on, staying housed, and putting food on the table.
We leverage an expansive network, grounded in innovation and hope, to bring people together and solve complex problems. 4,609
Year-round Days of Caring volunteers performed 230 community service projects, including Tulsa Area United Way’s Student Day of Caring.
3 ½ TONS
When the government shutdown threatened SNAP benefits, we mobilized an emergency food drive that collected more than 3 ½ tons of food at our headquarters alone, supported 20 nonprofits, and sparked additional donations in nearly 20 cities across the region.
NEARLY 7,000 Volunteers helped
improve lives in the eight-county region throughout the year. 56,000+ volunteer hours were completed, giving back so others can get ahead in our communities.
2025 FINANCIALS FUNDING FROM 21% Foundations & Grants 28% Corporations
INVESTED IN
30% Healthy Communities
51% Employees/ Individuals
REVENUES
Campaign and Other Contributions Collection Loss Provision Net Investment Return In-Kind Contributions Grant Income Other
30% Youth Opportunity
26% Financial Security
14% Community Resiliency
2025
2024
$ 27,025,033
$ 27,378,828
1,018,583
955,605
(584,595) 108,409
255,000 437,687
(607,828) 127,071 33,741
1,019,477
$ 28,260,117
$ 28,906,894
2025
2024
Youth Opportunity
$ 6,130,860
$ 6,153,343
Financial Security
5,201,942
5,222,036
Total Revenues
EXPENSES
Program Services
Healthy Community
5,945,076
Community Resiliency
1,300,485
Innovative Grant Funding
225,000
Collaborative Grant Funding Other Special Funding Ntech 211
Community Impact
Total Program Services
Management and General Expense Fundraising Costs
925,000
5,989,105 1,298,977 825,000 225,000
930,273
1,088,433
956,433
999,988
377,650
1,690,984
$ 23,683,703 1,575,145
2,468,265
366,794
1,344,590
$ 23,513,266 1,606,855
2,689,426
$ 27,727,113
$ 27,809,547
Change in Net Assets
533,004
1,097,347
Unrestricted Change in Net Assets
599,617
(1,079,340)
$ 10,489,574
$ 9,889,957
Total Expenses
Change in Restricted Net Assets
Unrestricted Net assets, Beginning of Year Unrestricted Net Assets, End of Year
(66,613)
9,889,957
Fundraiser revenue recorded will not match fundraiser revenue announced due to timing of when pledges are received and recorded.
2,176,687
10,969,297