

ThecapstonestudioattheUniversityofMichiganprovidesanactivelearningexperienceonurgent planningproblemsandsupportsorganizationsandcommunitypartnersthatlacktheresourcesnecessary toundertaketheseproblems Ourcapstoneclass,composedof12Master’sofUrbanandRegional Planninggraduatestudentsintheirfinalsemester,participatedinacollaborative,client-basedprojectthat mirrorsreal-worldplanningworkasaculminationofourdegree Weconductedthisprojectinpartnership withourclient,theSitingResourceCenter(SRC),anationalinitiativethatsupportsstakeholdersin renewableenergysitingandpermitting.OurprojectaimedtosupportSRCinprovidingeffectiveand informedguidancefordecision-makersrelatingtorenewableenergysiting Toachievethisgoal,we focusedonimprovinghowexistingknowledgeisorganized,interpreted,andappliedinplanningcontexts, withparticularattentionpaidtomakingcomplexandfragmentedinformationmoreaccessibleand decision-relevantforplanners,localgovernments,andcommunities
Inthisproject,weproducedastructuredsetofresourcestosupportSRC’sinformationhub,including addingresourcestoacurateddatabaseandaseriesofplanning-orientedfactsheets Theresearchdatabase SRCdevelopedusingAirtablecompilesvettedsourcesorganizedbytopic,technology,andmetadatatags, enablinguserstoefficientlyfilterandassessinformationbasedoncredibility,relevance,andapplicability Overthecourseofthesemester,weaddedanadditional444resourcestothedatabase
Inparallel,wedeveloped26factsheetsaddressingpriorityquestionsrelatedtorenewableenergysiting. Thesetopicsspanawiderangeofrenewableenergyplanningconcerns,includingenvironmentalimpacts (e.g.,wildlife,soilandwatersystems),communityandeconomiceffects(e.g.,costsandbenefits,senseof place),infrastructureandsafetyconsiderations(eg,noise,firerisk,andaviationinterference),and governanceandlifecycleissues(eg,permittingauthorityanddecommissioning) Eachfactsheet synthesizesexistingresearch,identifiesareasofconsensusanduncertainty,andhighlightslimitsof applicability,whilealsoincorporatingaplanner-orientedperspectiveonhowtheseissuescanbe understoodandaddressedinpractice Wealsoresearched18additionaltopics
Acrosstopics,wefoundthemainchallengeinrenewableenergysitingisthedifficultyofsynthesizing fragmented,context-dependentknowledgeintoformsthatsupportdecision-making Effectivesynthesis requiresinterpretingvariability,uncertainty,andtrade-offsinwaysthatareaccessibleandactionablefor planners Atthesametime,weencounteredkeylimitations,includingunevenevidenceacrosstopics, particularlyforemergingtechnologiessuchasbatteryenergystorage,andtheinherenttensionbetween simplifyingcomplexissuesandpreservingnecessarynuance.Thesefindingsunderscoretheneedfor toolsthatbridgetechnicalknowledgeandplanningpractice,whileremainingtransparentabout uncertaintyandcontext-specificapplicability.
Astheworldtransitionsawayfromusingfossilfuels,whereandhowwebuildcleanenergyinfrastructure isextremelyimportant Renewableenergydevelopment,especiallysolar,wind,andbatteryenergystorage systems(BESS),isonthepathtoincreaseyearafteryearduetocostcompetitivenessandstronger climateactiongoalsfrombothstateandlocalgovernments.Asaresult,morecommunitiesarebeing approachedtohostthesetechnologies Localgovernmentsandplanners,however,areoftenreactingto proposedprojectsunderatighttimelineandfaceheavypressurefromboththedeveloperandcommunity members,whomayhaveconflictingopinions [1][2] Astrongsourceofobjective,balancedinformationon renewableenergysitingcouldhelpplannersastheyworktoresolvedeveloperandcommunityconflicts
Localgovernmentsandresidentsmaybesupportiveoforopposedtorenewableenergyintheir communityforavarietyofreasons.Aswithallnewlandusesinanarea,communitymembersoftenhave questionsaboutthechangesthedevelopmentwillcreateinthecommunity,suchastechnicalandtax questions,andsafety,environmental,andaffordabilityconcerns.[3][4] Whilethereisanabundanceof resourcesonthesetopics,theyareoftenscatteredandhardtofind,complexandtechnical,and inconsistentacrossdifferingstatecontexts
Informationisoftenorganizedintechnology-specificsiloesandtheheavilytechnicallanguageincludes complexjargonandcategorizationsthatareincomprehensibletoalayaudience.Relevantacademic articlesmaybepublishedin alargenumberofdifferentacademicjournalshiddenbehindpaywalls. Resourcesaboutruralutility-scalerenewablesforplannersmaybebasedonwhichtechnologiesaremost relevantforthepublishingorganization’sregion,ormaybehardtofind.Thismaybebecausethe“urban” biasinurbanplanningoftenneglectsdevelopmentalimpactsinruralareas [5]Ageneralsuspicionofcity plannersorothercityofficialsmayexistinsomecommunitiesandcanmakeithardertoestablishtrust [6] Furthermore,residentsmaynottrustanysourcethattheythinkisconnectedtoadeveloper,andsome peopleinruralcommunitiesmaynottrustuniversityresourceseither [7]
Increasingtheavailabilityofeasy-to-understandresourcesaboutrenewableenergycanhelptrusted sourcessuchasextensionofficesornationalresearchlaboratories,answerthesequestionsandcreate moreinformeddialogue.Beyondanswerstoquestions,communitiesareofteninterestedinwhatactions theycantaketoenhancethepositivesandlimitadverseimpactsofdevelopment Thisisakeyrole plannersoftenplay,andakeyplacewhereourexperienceasplannerscancontributetothischallenge.
Urbanplanningistheprocessofdesigning,developing,andimplementinglandusepolicy,infrastructure, andfinancialtoolstoimprovequalityoflife,sustainability,andefficiencyincities.Urbanplannerstake onamultitudeofroleswithinandoutsideofcitygovernmentstoaddressfuturelanddevelopmentissues Plannersveryoftenfocusoncumulativeimpacts,futuretrends,andtradeoffswhenconsideringfuture developmentandlanduseincommunities.
Historically,urbanplanninghasoperatedwithatop-downapproach,withcityofficialsholdingthe decision-makingpowerratherthanplannersorcommunitymembers.[8] Thisprocesshasresultedinsevere
harmdonetomarginalizedcommunities,throughurbanrenewal,redlining,andsinglefamilyzoning. Today,urbanplannersusedata-driven,place-basedinsights,andresidentfeedbackgainedthrough communityengagementstrategiestodefinecommunitygoalsandoutlineapathtoachievethem Planners canrespondtopreviousdecisionsthatresultedinharm,suchasreconnectingmarginalizedneighborhoods dividedbyhighwaysorrequiringaffordablehousingintheircity Overall,theyfacilitatecommunity change,growth,anddevelopmenttohelpresidentsthrive [9]
Urbanplanningisaninterdisciplinaryfield,drawingonavarietyoffocusareastodirectfuture developmenttosupporthealthy,sustainable,andequitablecommunities Differentfieldsinclude environmentalstudiesandscience,publichealth,architecture,sociologyandpolicy,andmore.Planners arenotlimitedtooneprofession,andworkinavarietyofdifferentsectors Althoughtraditionallythought ofascitystaff,plannersexistinnon-profitorganizations,likeCommunityDevelopmentOrganizations, privateconsultingfirms,andresearchinstitutions.[10]Additionally,cityplannersengageincomprehensive planningbyproducingacomprehensiveormasterplanofacityorneighborhoodthatdiscusseslong-term landuseanddevelopmentgoals.Inthisplan,theyoutlinestepstoimplementsocial,physical,and economicinfrastructurebasedonthecommunity’spriorities,oftenbydiscussingtheroleofzoningand budgeting [11] Plannersarealsoinvolvedinshapingpermittingandzoningprocessesandrequirementsfor differenttypesoflanduse.Tomeetcitygoals,plannersoftenfocusonhousing,transportation,economic development,sustainability,andneighborhoodplanning
Regardlessoftheirfocus,plannerstranslatecomplex,technicalinformationforthepublicandorganize communityengagementstolearnwhatresidentscareabout,whatchangestheywanttoseeintheir neighborhoods,andwhatproblemsexist.Althoughofficiallyoperatedthroughthecitygovernment,urban planningrequiresinputfromallmembersofthecommunityandcity,andisanopenprocesstoany residentwhocaresaboutwhathappensintheircommunity Urbanplannersprovidekeyinsightsand expertisewhenengagingwithanyformoflanduseordevelopmentandempowercommunitiesto prioritizetheirvaluesandconcerns
TheSitingResourceCenter(SRC)beganoperationsin2026,foundedbyformerU.S.Departmentof Energyemployees Itservesasanindependentproviderofscience-basedresourcestoaddresscomplex sitingandpermittingquestionsforutility-scalesolar,wind,andbatteryenergystorage(BESS)projects SRCaimstoaddresstheobstaclefragmentedandcontext-dependentresearchandknowledgeon renewableenergycreatesforlocaldecision-makersfacinganewenergyprojectintheircommunity SRC maintainsastrictnon-advocacystance,meaningitdoesnotlobbyfororagainstspecificprojectsor policies.Instead,thecenterfocusesonclarifyingwhatisknown,whatisuncertain,andwhatcontextis relevanttoinformevidence-baseddecisions Itsprimaryvaluepropositionistosavetimeandresources for"on-the-ground"trustedorganizations-suchascooperativeextensions,localuniversities,and independentnonprofits-thatdirectlyengagewithcommunitiesandareoftenstretchedtoothintoconduct theirownresearch [12]
SRC’smissionistostreamlinethewaystakeholdersfind,understand,andapplytechnicalandpolicy informationonrenewableenergysitingandpermitting.Bycuratingandtranslatingfragmentedresources, thecenteraimstomakeitfasterandeasiertobringthebestavailableknowledgeintoreal-world decisions.Toachievethis,SRCsynthesizesandcontextualizescredibleresourcesfor"trusted messengers"workingwithlocalplanners Keyinitiativesincludethedevelopmentofavettedresource databaseofsitingmaterialsandadirectoryofexpertstoconnectpractitionerswithrelevantexpertise Ultimately,SRCworkstoensurethatpermittingdecisionsaremoreinformedandtransparentthrough improvedaccesstotrustedinformation
OurclassaimedtosupporttheSRCinstreamlininghowstakeholdersfind,understand,andapply technicalandpolicyinformationinrenewableenergysitingandpermittingdecisions,particularlyinrural communitiesandlocalgovernmentcontexts Assoon-to-beurbanplanninggraduates,webroughta planningperspectivetothesediscussionsbyclarifyinghowlocalconditions,landusetradeoffs, governancestructures,andcommunityconcernsshapesitingoutcomesinpractice.Throughourwork,we soughttoensurethatsitingandpermittingdiscussionsaregroundedintrustworthyandfactual informationthatclearlydistinguisheswhatisknown,whatisuncertain,andwhatcontextmattersfor decision-making,sothatplannersandlocaldecision-makerscanmakemoreinformedandpractical choicesbasedontheirneeds
Wehadfourkeyobjectivestoachievethisgoal:
● Compilereliableinformationofcommonquestionsduringthesitingandpermittingof utility-scalesolar,wind,andbatterystorage,pullingfromvarioussources,intoastructuredand searchabledatabaseusingAirtable,asoftwareanddatabasemanagementplatform Thisdatabase containsresearch,policydocuments,andotherrelevantmaterials,organizedbytopic,technology, andmetadatatagstoenableefficientfilteringandretrieval.
● Assesstheapplicabilityofthecollectedinformation,accordingtoitsauthors,perspectives, audiences,reliability,accuracy,bias,geographicortechnologicalspecificity,andusefulness
● Synthesizethisinformationintofactsheetsthataresimple,direct,andunderstandabletosupport SRC’seffortstoenablestakeholderstounderstandboththesubstanceofthisinformationandhow itcanbeappliedindecision-making
● Provideaplanners’perspectiveonhowlocaldecision-makerscanaddresscommonsitingissues orconflicts,explainingwhytheseissuesexistandthecommonwaystoresolvethem.
Ourtopicswereselectedfromabroaderbankoffrequentlyaskedquestions(FAQs)aboututility-scale solar,wind,andbatteryenergystoragesystems(BESS).TheseFAQswereoriginallydevelopedthrough theCommunity-CenteredSolarDevelopment(CCSD)projectandlaterexpandedbySRCtocovera
widerrangeofsitingandpermittingquestionsacrosssolar,wind,andBESS.[4][13] Thequestionbank reflectscommonconcernsraisedbycommunitiesandlocalofficialsduringrenewableenergysiting processes
Inselectingprioritytopics,wefocusedonquestionswithstrongrelevancetoplanningandlocal decision-makingandourpersonalinterests Thisincludedissuesrelatedtolanduse,environmental impacts,zoningandpermittingconditions,communityimpacts,infrastructure,andhealthandsafety.We alsoaimedtodistributetopicsacrossdifferentareasofconcernsothattheoverallprojectwouldaddressa broadsetofquestionscommonlyraisedinsitingandpermittingdiscussions
Aftergroupdiscussionandclientreview,ourfinalsetoftopicscoveredmultipledirections,including landuseandenvironmentalcontext,wildlifeimpactsandmitigation,soilsandgroundwater,economic andcommunityimpacts,infrastructureandreliability,regulatoryandplanningissues,andhealthand safetyconcernssuchascontaminationrisksandextremeweatherperformance.Ourresearchfocused primarilyonutility-scalewind,solar,andBESS,whicharethemaintechnologiesreflectedintheSRC questionbank.AppendixAoutlinesthetopicschosenbystudentsandtheassociatednumberofresources addedtoAirtable.
Thefoundationforthisprojectwastheprocessofsearchingforandevaluatingthereliabilityoftechnical resourcesonprioritytopics Ourtaskinvolvedcollectingrelevantmaterialstoourprioritytopicand organizingtheinformationinastructuredwaythatsupportsfuturefiltering,searching,and decision-making.
Weapproachedresourcefindingasastructuredanditerativeprocess.Beforeenteringmaterialsinto Airtable,weusuallystartedwithbroadsearching,readingandsavingpotentialsources,tobuildaninitial understandingofthetopic.Thisearlysearchintentionallyincludedawiderangeofsources,inorderto capturediverseperspectivesandidentifykeythemesandwasnotlimitedtoorganizations,authors,or researchdeemedreliableoraccurate Afterourinitialresearch,weevaluatedsourcesbasedoncriteria suchascredibility,scientificgrounding,andrelevancetotheresearchquestions.Weeachcarefully analyzedourindividuallycollectedresearchtofindthetrustedandreliablesourcesforinclusioninthe factsheets Inchoosingsourcestoinformthedevelopmentofthefactsheets,weconsidereddiverse sources,includingacademicarticles,policyreports,andmaterialsfromorganizations,andpaidparticular attentiontothereliabilityofsources
Effectiveresourcefindinginvolvedarobustprocesstocollectandorganizeknowledgeintoastructured systemforlongtermuseandcollaboration.WhenenteringresourcesintoAirtable,wefolloweda consistentstructureprovidedbySRC.Eachentryincludedkeymetadatafields,suchassubject,resource type,geography,publicURL,andnotes LinkingtooriginalwebpagesanduploadingPDFfilescan improveaccessibilityandtraceability.Atthesametime,weaddedtagstosupportfuturefilteringand search
Inthisprocess,weactedassynthesizers,notasoriginalinterpretersorcreators.Wemainlyused secondarysynthesisreportssuchassummariesfromuniversities,governmentagencies,andresearch institutions,insteadofanalyzingprimarysourcessuchasstatelawsonebyone Thisapproachallowedus tocompareclassificationsacrossdifferentsources,andidentifysimilaritiesanddifferences.
Beforeconductingtargetedresearch,wedesignedastructuredpeerreviewsystemandcritiqueworkflow tomakethebestuseofclasstimewhendevelopingthefactsheets Thesepeerreviewsessions,called milestonesessions,occurredfourtimesduringtheprojecttimeline.Teammemberswithsimilarresearch topicswereorganizedintothreereviewgroupsoffourstudentsthatremainedconsistentthroughoutthe semester Thecreationofteamsallowedforrotatingpeerreviewoffactsheetdrafts,andspacetodiscuss trustedcommunication,clarifyresourceapplicability,andaskresearchandsynthesisquestions.This processallowedfortailoredfeedbackoneachindividualfactsheetfromadifferentpeereachmilestone andspaceforimportantconsiderationstoemerge Thepeerreviewprocessstreamlinedourfactsheet production.
Milestonesessionsfunctionedasstructuredpeerreviewcheckpointsthroughoutthesemester Ateach milestonesession,wedraftedworkinadvanceandreceivedpeerfeedbackalignedwithspecificreview objectives Reviewobjectivesincluded(1)questionframingandscope,(2)synthesisandevidence quality,(3)structure,tone,anduseability,and(4)integratingexternalfeedback Wediscussedfeedback withineachreviewgroupandparticipatedinfull-classdiscussionstoidentifykeyissues,makedecisions, anddeterminenextstepsforourwork Discussiontopicsraisedrangedfromtheformatandorganization, useofgraphics,appropriatetoneandcommunicationstrategies,anddefiningtheplanner’sperspective Specifically,wediscussedwhatthe“planner’sperspective”meansinthecontextofenergysiting, includinghowplannersinterprettechnicalinformation,whatkindsofquestionstheyneedtoaskfor energyprojects,andhowcomplexregulatoryinformationcanbetranslatedintoaccessibleguidancefor planningpractice.Duringthesesessions,wemadesignificantprogressinunderstandingthescopeand structureofthefactsheetsandhowtoimproveclarityandtrustworthinessforourtargetaudience
Non-milestonesessionsfocusedonfactsheetproduction,researchcoordination,andprojectalignment. Thesesessionsprovidedtimeforeachofustoshareresearchupdatesandresourceswiththeentireclass andfindalignmentinfactsheetdevelopment.Furthermore,wecreatedascheduleforone-on-one consultationswiththeinstructorandclientwhereweraisedresearchgapsandlimitations,synthesis issues,andfactsheetformatandcommunicationquestions Wegainedguidanceonfactsheetorganization andformat,reliablesources,andsectionsneedingmoredevelopment.Inadditiontofactsheet development,non-milestonesessionsprovidedspacefordiscussiononevolvingprojectobjectivesand tasks
Toevaluatetheeffectivenessandpracticalvalueofourfactsheets,weorganizedameetingwith professionalsfromtheEnergyLandUseEducationNetwork(ELEN),adiversegroupofprofessionals whointeractdirectlywithlocalgovernmentofficialsinmakinginformed,evidence-baseddecisionson energyplanning,siting,andpermitting.Theengagementwasdesignedtocollectfeedbackfrom
practitionersonhowthesematerialsworkasdecisionsupporttools.Italsohelpedtestwhereour interpretationsalignwithordivergefromreal-worldimplementationexperience,particularlyinrelationto planningpractice
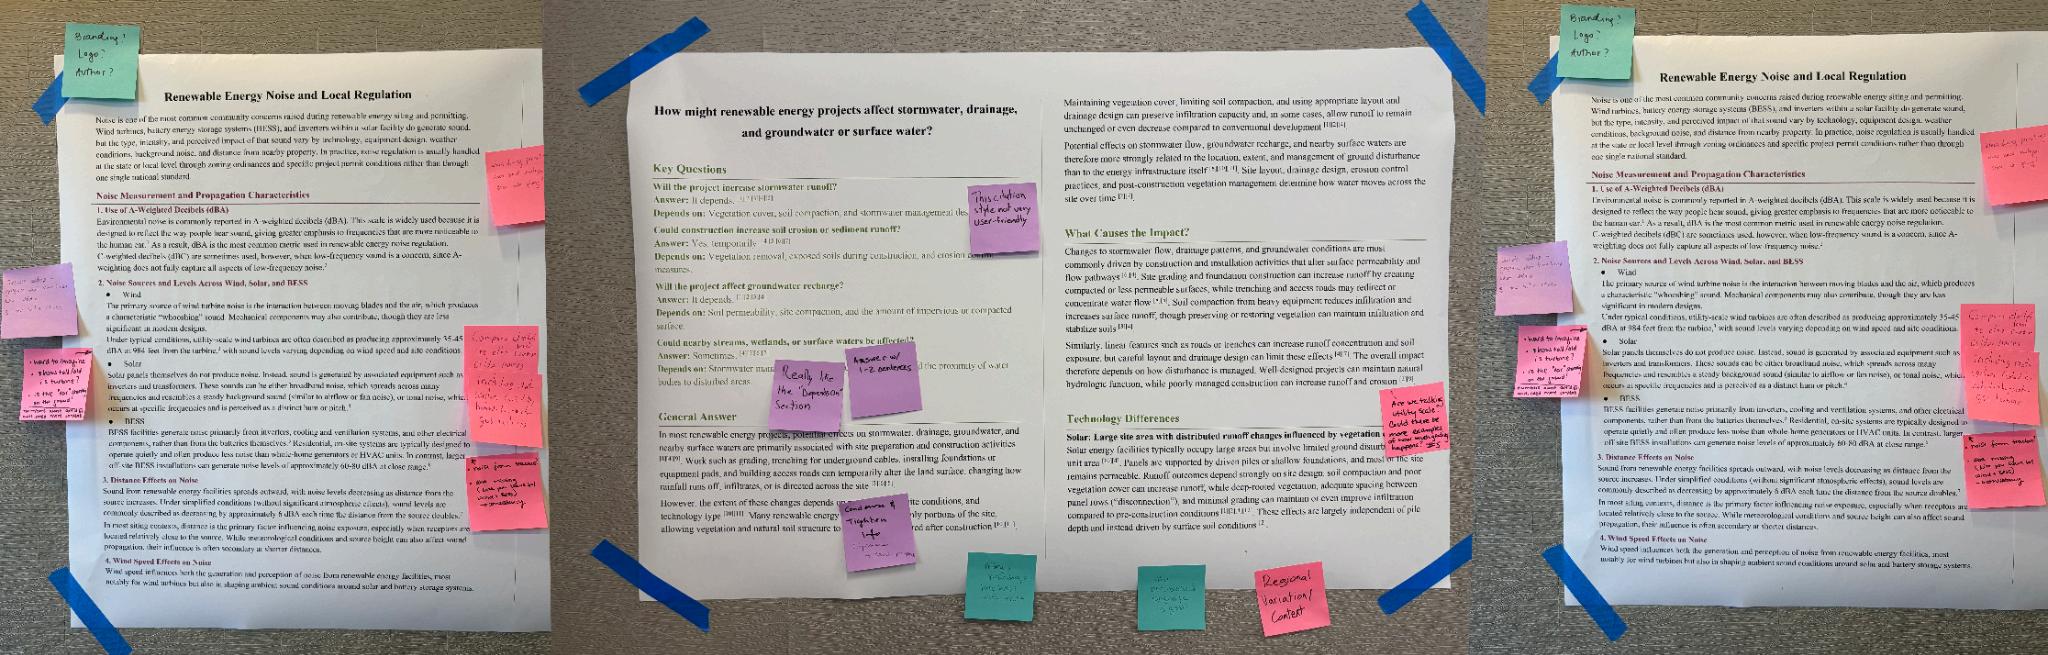
Duringthesession,threefactsheets,eachwithadifferenttopicandslightlydifferentformat,were presentedaslargepostersatthreediscussionstations.Professionalsrotatedthroughthestationsinsmall groups,spendingapproximately15minutesateachstation Ateachstop,participantsweregiventimeto firstreadandannotatethefactsheets,followedbygroupdiscussion Thisinteractiveformatencouraged morespecific,comparable,andcontext-basedfeedback.
Ateachstation,studentsfacilitateddiscussionandtooknotes.Participantsprovidedwrittenfeedback usingthreedifferentcolorsofstickynotes,eachcorrespondingtoanevaluationcategory:trustandtone, clarityandusability,anderrorsoromissions(seeAppendixB) Thismethodallowedustosystematically collectqualitativeinsightsandidentifykeythemesthatappearedacrossdifferentgroups.Inadditionto writtencomments,weencouragedparticipantstodiscusstheirperspectives,whichgenerateddeeper qualitativeinsights.Seethefollowingimagesforprofessionalsprovidingfeedbackduringtheengagement session.
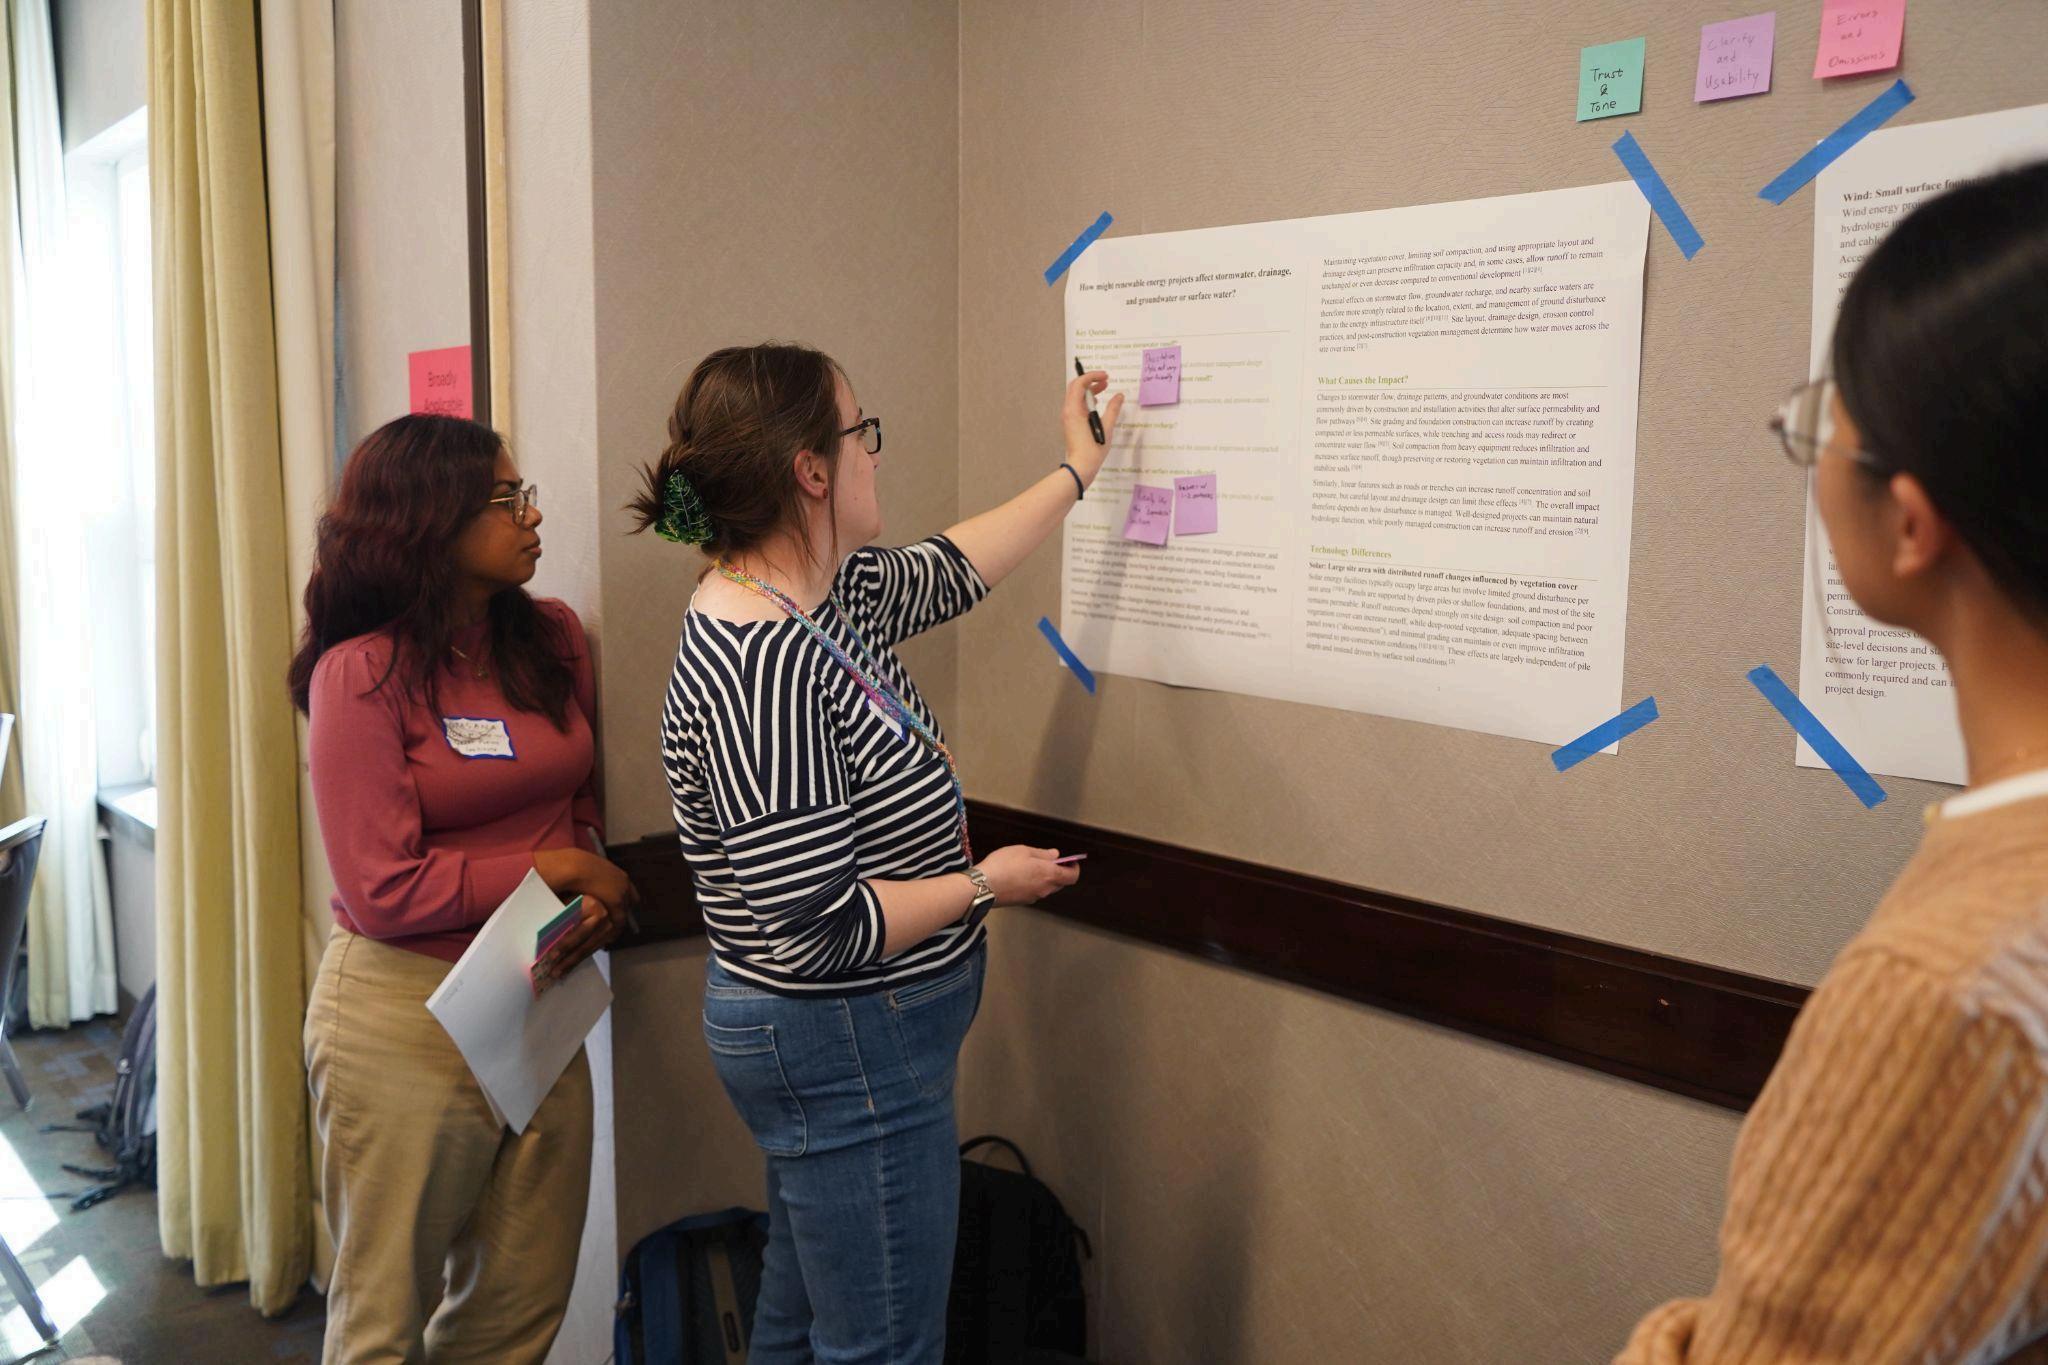
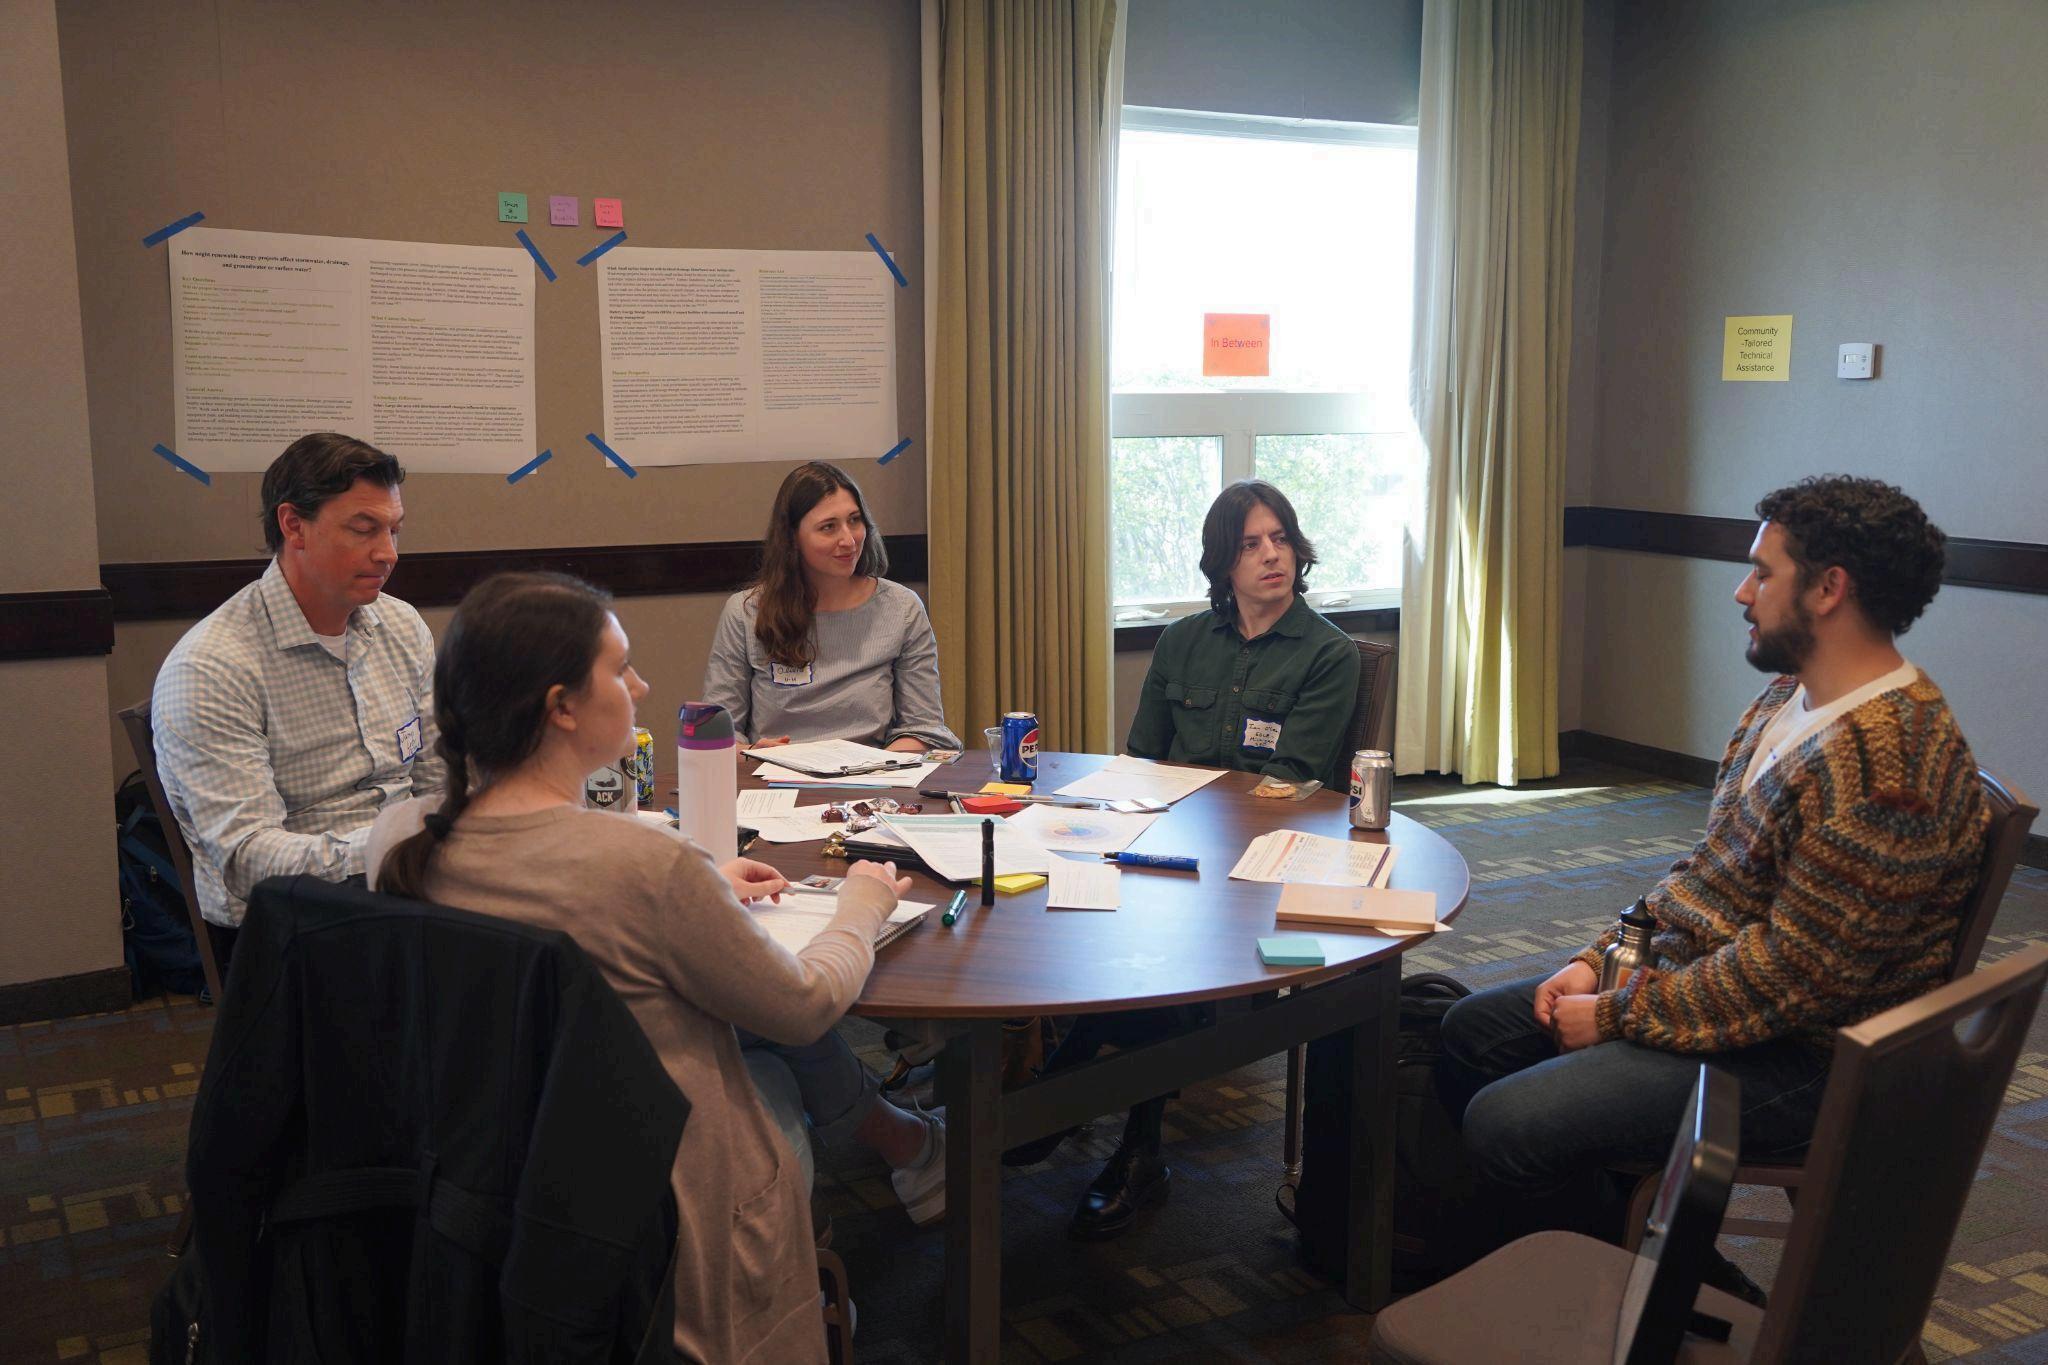
Image 2. Professionals participating in large-group discussion following factsheet feedback. Toensureindependentandunbiasedfeedback,eachroundbeganwithacleanfactsheet,asweremoved allpreviouscommentswrittenonthestickynotes Thispreventedparticipantsfrombeinginfluencedby earlierresponsesandimprovedthereliabilityofthefeedback.Studentsdocumenteddiscussionsand photographedannotatedmaterialstopreservekeyinsights.
Thesessionconcludedwithawhole-groupdiscussion,whereparticipantsreflectedonsharedstrengths, gaps,andareasforimprovementacrossallfactsheets Thisfinaldiscussionfocusedonusability,clarity, andapplicabilityinplanningpractice,andprovidedvaluableinputforrefiningthefinaloutputs.
Overthecourseoffourmonths,weachievedthepreviouslystatedgoalandobjectives Weconducted researchon33topics,coveringamajorityofthesitingandpermittingtopicsprovidedbytheclientacross threerenewableenergytechnologies(solar,wind,andbatterystorage)(seeAppendixA) Wecontributed 462resourcestotheSRCdatabaseinAirtable,includingtechnicalreports,peer-reviewedmanuscripts, guidebooks,andmore.Furthermore,weproducedatotalof26factsheetsfortheclientandpotentialusers (seeAppendixC) Finally,weproducedthisreportsummarizingtheprocess,lessonslearned,and reflectionsandrecommendations.WepresentedthisinformationinternallytotheTaubmancollege communityandexternallytotheclient.Thereport,factsheets,andpresentationwillbedeliveredtothe client
Duringtheresearchprocess,wereliedonarangeofstrategiestoidentifyrelevantsources Guidedby clientrecommendations,weusedscholarlysearchenginesforpeer-reviewedmanuscripts,traditional Googlesearchesfortechnicalreportsandguidancedocuments,andreferenceswithinexistingsources Differenttoolsserveddistinctpurposes:databasessuchasGoogleScholarandWebofSciencewere effectiveforidentifyingacademicandtechnicalstudies,whilegeneralsearchenginesweremoreuseful forlocatingpractitioner-orientedmaterials,includingpolicyreports,guidebooks,andorganizational publications.Aparticularlyeffectivestrategywas“referencechaining,”inwhichwefollowedcitations fromtrustedsourcestoidentifyfoundationalstudies,widelycitedreports,andtechnicalstandardsthat maynotappearininitialkeywordsearches LargeLanguageModelbasedtoolswerealsousefulforinitial orientationandidentifyingstartingpoints,althoughtheiroutputsrequiredcarefulverification.Together, thesestrategiesensuredbroadcoverageacrossbothacademicresearchandpractice-orientedguidance
Atthesametime,evaluatingthecredibilityofsourcesprovedtobeoneofthemostchallengingaspectsof theprocess.Asindividualsnewtotheenergyfield,wefounditdifficulttoassessthetrustworthinessof organizationsandpublishingentities,especiallygiventhewiderangeofmaterialsproducedby governmentagencies,industrygroups,andnonprofitorganizations.Thishighlightedtheneedforamore systematicapproachtoevaluatingcredibility Inpractice,wereliedonasetofkeycriteria,includingthe typeoforganization(eg,government,academic,industry,oradvocacy),thepresenceandqualityofcited evidence,transparencyinmethodsordatasources,andwhethertheinformationwasconsistentwith findingsfromotherindependentsources Assessingcredibilityoftenrequiredcross-checkingmultiple sourcesratherthanrelyingonasingledocument.
Acrossdifferenttopics,welearnedeffectivesynthesisrequiredstructuringknowledgetosupport understanding,comparison,andapplication Fromaplanner’sperspective,organizinginformationby issueorimpactpathwayratherthanbyenergytechnologyaloneprovidesthemostusefulstructure. Plannerstypicallyneedtoevaluatehowdifferentprojectsmayaffectlandusecompatibility, environmentalresources,infrastructure,communityconcerns,andregulatoryreview,soanissue-based structurewouldimproveeasewhencomparingtechnologieswithinthesamecontext.Thisapproach wouldreduceredundancywhendifferenttechnologiesraisesimilarplanningconcerns,suchasdrainage, soildisturbance,orgrid-relatedimpacts.Atthesametime,technology-specificsectionsarestillnecessary whenimpacts,regulatoryframeworks,ormitigationstrategiesdiffersubstantiallyacrosstechnologies,as inthecaseofwildlifeimpactsorlanduseintensity Inpractice,thesereflectionssuggesttheclearest approachforcommunicatinginformationforplanningpurposesisahybridone:organizecontent primarilyaroundplanningissues,whileincorporatingtechnology-specificdiscussionwheredistinctions areimportantfordecision-making
Anotherimportanttakeawaywasthatoursynthesisrequiredinterpretingandcontextualizinginconsistent information Inseveralcases,differentsourcesprovidedvaryingestimatesorclassifications,suchas land-useintensityorcommunitybenefitmechanisms.Ratherthanidentifyingasingle“correct”answer,it wasmoreusefultoexplainhowthesedifferencesarise,whetherfromvariationsindefinitions, measurementmethods,orgovernancestructures Inaddition,effectivesynthesisinvolvedclearlyguiding
thereaderthroughcomplexinformationbydefiningkeyterms,explainingrelationshipsbetweenpiecesof evidence,andmakingexplicitconnectionsbetweendataandtheirpracticalimplications.Thisapproach ensuredkeyinsightswereclearlycommunicatedandapplicableindecision-makingcontexts
ThroughtheengagementwithEnergyLandUseEducationNetwork(ELEN),oneofthemostimportant lessonswashowtomakeinformationclear,usable,anddirectlyrelevanttopracticeacrossdifferent geographicregions Acrossallthreeroundsofdiscussionanddifferentstations,therewasstrongand consistentfeedbackthatusersneedtobeabletoquicklyidentifykeypointsandunderstandtheirpractical implications.Expertsrepeatedlyemphasizedthatfactsheetsshouldbeeasytoscanwithconcisestructure, clearorganization,andimmediatelyvisibletakeaways
Atthesametime,somedifferencesinfeedbackhighlightedtheneedtobalanceclaritywithsufficient detail.Whilemanyparticipantssuggestedsimplifyingexplanations,othersemphasizedtheimportanceof includingspecificdata,examples,orcontext,suchasmeasurablevaluesorreal-worldscenarios This discrepancysuggeststhateffectivecommunicationnecessitatescarefulselectiononwhatlevelofdetailis mostusefulfortheintendedaudience
Severalspecificimprovementsemergedfromthisfeedback First,plainlanguageexplanationswere consistentlypreferredovertechnicalterms,particularlyforcomplextopicslikeBESSorregulatory frameworks.Forexample,ratherthanpresentingnoiselevelsonlyas“55dBA,”participantssuggested translatingthisintomoreintuitivecomparisons,suchasrelatingittofamiliareverydaysoundsor visualizinghowsoundchangeswithdistance.Thistypeoftranslationmakesabstractnumericalor technicalinformationmoreunderstandableandmeaningful.
Second,participantshighlightedtheimportanceofvisualelements,suchascharts,images,anddiagrams, tomakeabstractconceptseasiertounderstand Acrossmultiplerounds,therewasrepeatedfeedbackthat numericaldataaloneisoftendifficulttointerpretwithoutcontext,andthatgraphicscanhelpconvey relationshipsmoreeffectively(e.g.,visualizingdecommissioningtimelinesasstep-by-stepprocesses,or usingchartsanddiagramstoexplaincomplexsystems,liketheelectricalgrid)
Anotherkeytakeawaywastheimportanceofspecificityandactionabledetail.Feedbackindicatedthat vaguedescriptions,suchasgeneraltimelinesorprocesses,werelessusefulthanclearlybreakingdown stepsorprovidingconcreteexamples,evenifthoseconcreteexamplesmaynotbegeneralizabletoall situations.Inaddition,therewasstrongemphasisonclarifyingstakeholderrolesandresponsibilities, includingwhatplanners,localgovernments,anddeveloperscandoinpractice,includinginstateswith state-levelsitingauthority
Morebroadly,theengagementreinforcedthatfactsheetsshouldclearlyanswerthequestionof“sowhat?” Inotherwords,theyshouldexplainhowtheinformationmightinformplanningdecisions,shape communityengagement,orinfluencelocaloutcomes.Thisincludesmakingaclearerdistinctionbetween backgroundinformationandpracticalrecommendations,andensuringthateachfactsheethelpsthereader understandwhatactionsornextstepsmayfollowfromtheinformationprovided
Finally,feedbackhighlightedtheimportanceofhowsourcesandcitationsareusedtosupportthisgoal. Participantsemphasizedtheneedtorelyonmorerecentandup-to-datesources,particularlygiventhe rapidlyevolvingnatureofrenewableenergytechnologiesandregulations.Theyalsonotedthatthelevel andpresentationofcitationsshouldbetailoredtotheintendedaudience:fewerandmoresimplified referencesmaybeappropriateforgeneralaudiences,whilelocalofficialsandpractitionersmayrequire moredetailedsourcingandlinkstooriginaldocumentstosupportdecision-makingandfurtherinquiry.
Integratingtheplanner’sperspectiveshiftedthefocusfromtechnicaldescriptiontodecision-oriented thinking Welearnedplanning-orientedmaterialsneededtotranslatetechnicalinformationintopractical questionsandactions,especiallyforuserswhomaynothavespecializedexpertiseinenergysystems.In practice,thismeantconnectingtechnicalconceptstofamiliarplanningtools,suchaszoningordinances, comprehensiveplans,speciallandusepermits,overlaydistricts,andsetbackrequirements Ratherthan presentinginformationinisolation,weaimedtoshowhowthesetoolscanbeusedtoregulateproject siting,manageimpacts,andguidedecision-makingatthelocallevel
Ourfactsheetshighlightedplanningtools,participationprocesses,andhowregulationsshapeoutcomes Theplanner’sperspectiveprovidedactionablestepsandkeypointstailoredtocommunity-specific contexts.Theseincludeidentifyingwheretechnicalconsiderationsentertheplanningprocess(e.g.,during zoningupdatesorpermitreview),whatquestionstoaskdevelopers,andhowtoincorporatecommunity concernsintolocalplanningandzoningdecisions.Integratingthisperspectiveandfindingtheappropriate levelofspecificitywasimportant,giventheplace-basednatureofplanning.Theseconsiderationswere drawnfromarangeofsourcesandsynthesizedintopracticalguidanceforuseinplanningcontexts
Forexample,intopicssuchastaxationorcommunitybenefits,simplydescribingpolicieswasnot sufficient.Instead,itwasmoreeffectivetohighlightplanningtoolsandregulatorymechanisms,suchas tax-relatedprovisions,developmentagreements,ordecommissioningrequirements,andhowtheycanbe incorporatedintoordinancesorpermittingconditionstomanagerisksandsupportimplementation Similarly,inenvironmentalandwildlife-relatedtopics,ouranalysisemphasizedearly-stageplanning actions,suchassiteselection,overlayzoning,andpre-constructionsurveyrequirements,whichcanbe embeddedinplanningdocumentstoguidedecisionsbeforeimpactsoccur
Integratingtheplanner’sperspectivehighlightedtheneedtoclearlydefinerolesandresponsibilities acrossstakeholders.Toeffectivelydefinetheplanner’sperspectivefordifferenttopics,weclarified importantactorsandtheactionstheycantakeatdifferentstagesoftheplanningandpermittingprocess Thisincludeddistinguishingbetweenresponsibilitiesofplanners,localgovernments,developers,and stateagencies,particularlyincontextswheresitingauthorityissharedoroverlapping
Finally,thisperspectivehighlightedtheimportanceofsupportingdifferentlevelsofexpertise.Asnotall plannersarefamiliarwithrenewableenergysystems,effectivematerialsneedtobothintroducekey conceptsandtranslatethemintoplanning-relevantterminologyandtools,ensuringthattheinformationis accessiblewhilestilldirectlyapplicabletozoning,permitting,andlong-rangeplanningdecisions.
Inthisproject,wefacedanimportantlimitationinaddressingtopicswhereanswersvarysubstantially acrossregions,states,andlocaljurisdictions Asfactsheets,bynature,needtoremainconciseandbroadly usable,theycannotfullycapturethegeographicvariationandlocalspecificitythatshapehowtheseissues ariseinpractice.Forexample,thefactsheetonBESSfiresafetycouldnotfullyaddresstherangeof relevantissuesbecauseapplicablecodes,standards,andregulatoryrequirementsareshapedbydifferent jurisdictionalcontextsandinvolvemultiplestakeholders.Similarly,communicatingtheimpactofnoise requiredsimplifyingtechnicalandregulatoryinformation,whichlimitedhowfullyregionalvariationand regulatorynuancecouldbecaptured
Othertopicswerelimitedbytheavailability,consistency,andscopeofexistingevidence,which constrainedhowfarthefactsheetscouldgoindrawingconclusions.Inthefactsheetoneconomicbenefits andcosts,thediscussionofBESSwaslimitedbydatathatisstillevolvingandlesspredictablethandata onwindorsolar Inwildlifeimpacts,especiallyforoffshorewind,limitedresearchandinconclusive evidenceonpopulation-leveleffectsmeantthatthesynthesiscouldnotprovidestrongerconclusions.The land-usetopicfacedsimilarconstraints,asdifferentsourcesuseddifferentland-useestimatesanddidnot alwaysdefinetheirscopeormeasurementstandardsclearly.Long-termevidenceonfarmlandimpactsand post-projectrecoveryalsoremainslimited,whichconstrainedhowconfidentlythefactsheetcouldspeak tothoseissues
Sometopicsweredifficulttotranslateintoclearplanningguidancebecausetheavailableresearchwas limited,uneven,ornotcloselyalignedwithdecision-makingneeds.Forexample,thefactsheetonvisual impactscouldidentifyanimportantareaofconcern,butthelimitedandunevenresearchbasemadeit hardertoprovideconcreteguidanceonhowtheimpactmightbemitigated Thetopicofgridreliability andlocalresiliencefacedsimilarlimits,giventhelackofconsistentresearchonthecausesofpower outagesandhowdifferenttypesofoutagesaffectreliability Intheenvironmentalimpactstopic,available materialsweremorehelpfulindescribingsite-leveleffectsthaninsupportingbroaderplanningdecisions aboutcumulativeorwatershed-scaleimpacts.
Takentogether,thesetopic-levellimitationspointtoseveralbroadergapsacrosstheproject.Themost prominentwasthetensionbetweenclarityandnuance:manyfactsheetsneededtocondensetechnical, legal,orenvironmentalcomplexityintoashortandusableformat,butdoingsomeantleavingout uncertainty,regionalvariation,orcontext-specificdetail.Morebroadly,theprojectalsohadlimitedability
toaddressalltopicswiththesamelevelofdepth,confidence,andpracticalspecificity,particularlywhere existingresearchisuneven,contextdependent,orlessconnectedtoreal-worlddecision-making.
Whilethedatabaseremainsacentralfocusofthiswork,werecommendthattheSRCcontinuesto producesimplifiedfactsheets,astheseareessentialforsynthesizingthematerialinthedatabasefor non-technicalaudiences.Factsheetscouldactasentrypointsintocomplexandtechnicaltopicsforusers withoutpreviousknowledgeandguidesfornavigatingrelevantresourceswithintheresourcedatabase.In thissense,thefactsheetsdevelopedthroughourcapstoneprojectcanbeanearlymodelforfuture navigationmaterialsthathelpusersmovefrombroadquestionstomoretargetedresources.SRCmay consideracontinuedpartnershipwithauniversity,whosenamerecognitionandlogomaybemoretrusted thanSRC’s AuniversitypartnershipcouldincreasethetrustinSRCasaneworganizationfeltbythe targetaudienceofenergyprofessionals.
Furthermore,werecommendSRCexpandtheboundaryofknowledgepresentinthedatabase While energy-focusedresourcesremaincentral,ourresearchshowedthatmaterialsnotdirectlyframedas “energy”resourcesstillprovidecriticalinsightintoplanningprocesses,consultationrequirements, communityengagement,trust-building,legalprocedures,andrelatedlocalconcerns Forexample,the topicconcerningculturalresources,historicsites,andTribalculturalplacesresultedinsourcespertaining torespectfulandeffectivecollaborationongenerallanduses,ratherthanspecificenergyissues Likewise, currentregulatoryandresearchframeworksoftenemphasizemeasurable,technical,orsafety-driven concerns,whilevisual,perceptual,andcommunity-experienceimpactsarelessstandardizedandtherefore easiertooverlook Forthesetopics,SRCshouldbemoreintentionalaboutinterdisciplinarity Incorporatingresourcesfromadjacentfieldssuchasenvironmentalpsychology,architecturaldesignand socialsciencecouldhelpthedatabasebecomemorecomprehensiveandhuman-centered.Including resourcesfocusingonothersimilartechnologiescouldprovideusefulguidanceforemerging technologies,likeBESS,insitingandpermittingissues.
Inthelongterm,SRCcanfurtherdeveloptheAirtabledatabasefromasimpleresourcedatabaseintoa guidedknowledgesystem.Overtime,therecouldbetwocomplementaryforms:asearchableand well-curateddatabasewithauser-friendlyinterfaceandclearpathwaysintospecifictopics,and potentiallyanAIchatbotthatcanrespondtousers’naturallanguagebyextractinginformationfromthe databasewhilemaintainingtransparentcitationsand“human-in-the-loop”toreducehallucinationsin crucialissuessuchaslawsandpolicies.
Wefoundourcollaborativeworkflowtobeastrongapproachforresearchcoveringdiversetopics.The combinationofindividualresearch,groupdiscussion,andpeerreviewhelpedusidentifyunclear explanations,redundancies,andgapsinlogic Reviewingoneanother’sworkatdifferentstagesmadeit
easiertorefineourarguments,seethesameissuefrommultipleperspectives,andshareusefulresources andknowledgeacrosstopics.
Atthesametime,weconsistentlyencounteredchallengesintheresearchprocess Evenwhenliteratureon atopicwasabundant,themaindifficultywassynthesizingfragmentedinformationacrossmanydifferent kindsofsources Wefoundthatthemosteffectiveapproachwastobuildanindependentlogical frameworkfirstandthenintegratesupportingmaterialsintoit,ratherthanfollowingthestructureofany singlereferencetooclosely.Ourresearchprocessworkedbestwhenstartingwithfoundationalresources fromtrustedmessengerslikeuniversities,cooperativeextensions,andnationallaboratoriesandthen supplementingwithmaterialsfromothersources.Specificinstitutionsthatprovedparticularlyvaluable includetheNationalRenewableEnergyLaboratory,PacificNorthwestNationalLaboratory,andthePenn StateExtension
Anotherrecurringchallengewassourcereliabilityandbias.Inrenewableenergyresearch,manyhighly visiblematerialscamefromutilities,industrygroups,developers,oradvocacy-orientedorganizations whoseperspectivesarenotneutral.Also,academicworkcouldinvolvemethodologicallimitationsor case-specificconstraints.Wefounditdifficulttodeterminewhichsourcesweremosttrustworthy, especiallywhentechnicalinformationextendedbeyondtherenewableenergyfielditself Asdiscussedin theearliersectiononlessonslearnedfromliteraturereviewandsynthesis,werecommendSRCdevelops amoresystematicframeworkforevaluatingsourcereliability,bias,transparency,andintendeduse This frameworkmayincludestandardizedcriteriaforevaluatingaresourcebasedonthepublishing organization’smission,funding,likelyperspective,andmethodologicallimitations.Thestandardized frameworkcouldsupportbothinternalresearchpracticesandfuturepublic-facingdatabasedesign
WealsoreflectedontheroleofAItoolsinresearch.AIwasgenerallyhelpfulfororientation, summarizingliterature,improvingclarity,andlocatingspecificinformationwithinlongtexts However, wefoundAImuchlessreliableforverifyingtechnicaldetails,interpretingnuancedregulatory distinctions,generatingtrustworthycitations,orsynthesizingcomplexarguments.Forexample,inthe researchonlandrequirements,AIwasusefulforquicklylocatingestimatesofhowmanyacresareneeded perMWforrenewableenergyprojectsinlongreports.However,itwaslessreliablewhenconnectingthe numberswiththecontext,definitionsandtechnicaldetailsinthereports,ormakingin-depthcomparisons acrossresources Inpractice,AItoolsshouldberegardedassupporttools,andtheiroutputrequires carefulcheckingagainstoriginalsources.ThissuggeststhatfutureworkflowshouldincorporateAI selectively.AIcansignificantlyimprovetheefficiencyofresearchandsynthesisforSRC,andmay empowerthedatabasetobemoreaccessibleandusefulinthefuture,butasanorganizationfocusedon reliableinformationandknowledge,humanjudgmentandverificationremainessentialwhenengaging anyAItools
Tocontributetotheresourcecollection,wehaddirectaccesstoSRC’sprivateAirtabledatabase We understandSRCisstilldevelopingthepublic-facingdatabaseandconsideringdifferentformatsand structuresforexternalusers Ourfollowingsuggestions,basedonourexperiencewiththepreliminary, privatedatabase,shouldbeconsideredforthefuturedesignoftheprivateandpublicdatabases AsSRC
willcontinuetoprovideindividualsupport,theirefficientandeffectiveuseofthedatabaseisessentialfor theircontinuedsuccess.
Reflectingonouruseofthedatabase,werecommendmakingthedatabaseeasiertonavigateforfirst-time ornon-expertusers,aswellasSRCemployees.Usersmaybecomeoverwhelmedassomanyresources arelistedontheinterfacewithoutenoughguidance Toaddressthis,SRCcouldconsiderprioritizingkey materials,creatingcuratedpathwaysthroughmajortopics,improvinglistpresentation,anddevelopinga userguideormanualthatexplainshowtosearcheffectivelyandinterpretresults.Website-basedoverview pagesortopic-specificlandingpagescouldalsohelpusersunderstandwheretostart
Asaclass,westruggledwiththelimitedsearchingfunctionality.Wefoundthatrequiringexactspelling, punctuation,orapostrophescreatesunnecessarybarriers,especiallywhenusersonlypartiallyremembera titleorphrase.Moreflexiblesearchtoolswouldmakethedatabasesubstantiallymoreaccessible. Includingsemanticandquestion-basedsearchallowsuserstoenternaturallanguageratherthanrelying onlyonexactkeywordsorpredefinedcategories AImayhelpenablethiskindofretrieval,aswellas recommendrelevantresourcesbasedonsearchterms,andmayevendevelopintoachatbotproposedat theendoftherecommendationsforSRC’sgoals.WhileAItoolscouldplayausefulroleinclassification, summarization,tagging,andretrievalinthedatabase,theymayintroducenewconcernsaboutreliability, bias,transparency,andusertrust.AI-supporteddatabasefeaturesshouldbedesignedtoenhance discoverabilitywhilepreservingclearmetadata,visiblecitations,andtransparentsourcecontext
Differentresourcetypescurrentlyappearatasimilarleveleventhoughtheydiffersubstantiallyin purpose,rigor,credibility,andintendeduse.Metadatasuchasorganizationanddocumenttypeishelpful butmaynotbeenoughforuserstoquicklyunderstandhowasourceshouldbereadorhowmuchweight toplaceonit.SRCshouldthereforeconsideraddingsimpleindicatorsorcategoriesthatdistinguish betweenempiricalresearch,policyanalysis,practitionerguidance,advocacymaterials,andothersource types Itmaybeusefultosurfacesource-contextmetadatarelatedtoreliability,bias,ormethodological limitationssothataccessibilityofsourcesinthedatabasedoesnotcomeattheexpenseoftrust.
Inaddition,taggingcouldbeexpandedforlessstandardizedandsubjectivedimensionssuchas perceptual,experiential,orcommunity-facingimpacts.Thesetagswouldrepresenttheperceivedimpact ofrenewableenergyprojectsbycommunitymembers,ratherthanthetechnicalandfactualoutputsbythe infrastructure Clearertaggingintheseareaswouldmakeiteasierforuserstolocateresourcespertaining totheimpactfeltbythecommunity,ratherthantheimpactcreatedbytheproject,allowingformore balanceddecision-makingandeffectiveandtrustworthypubliccommunication
Conclusion
Wemadetwoprimarycontributionstosupportrenewableenergysitingdecisionsinthisproject.First,we substantiallyexpandedSRC’sAirtabledatabase,morethandoublingthenumberofcuratedresourcesin theexistingcollectionandprovidinganearlysurgeinthedepthandbreadthofavailableinformation. Second,wedevelopedaseriesofplanning-orientedfactsheetsthatsynthesizekeyquestionsacross environmental,community,infrastructure,andgovernancetopics Thesefactsheetsfunctionasa replicablemodelfortranslatingdatabasecontentintomoreaccessible,decision-orientedformats. Together,theseoutputsstrengthenboththesubstanceandusabilityofSRC’sknowledgebase
Acrossourwork,severalconsistentpatternsemerged.Manycommonlyraisedconcerns,suchasimpacts onsoilsandwatersystems,wildlife,noise,landuse,infrastructure,andsafety,aretypicallylocalizedand shapedbysiteconditions,projectdesign,constructionandoperationalpractices,andtechnologytype In mostcases,theseimpactscanbeanticipatedandmanaged,buttheirsignificancevariesacrosslocal contextsandprojectscales Atthesametime,outcomesarestronglyinfluencedbyregulatoryframeworks andplanningtools,includingpermittingprocesses,setbackandzoningrequirements,environmental review,safetystandards,andfinancialassurancemechanismssuchasdecommissioningbonds.These systemsoftenprioritizemeasurableandtechnicalrisks,whileleavingmorecontext-dependentissues, suchasvisualimpacts,communityexperience,andbenefitdistribution,lessconsistentlyaddressed
Inaddition,severaltopicshighlightedthatimpactsaresite-specificandinstitutionallyshaped.Variations insitingauthority,taxstructures,communitybenefitmechanisms,andemergingstandards(eg,for batterystorage)leadtounevenoutcomesacrossjurisdictions.Together,thesefindingssuggestthat effectivedecision-makingdependsoninterpretinghowimpactsinteractwithlocalconditions,stateand localgovernancestructures,andplanningtools Thisreinforcesthecentralroleofplannersintranslating technicalknowledgeintocontext-specificstrategies,balancingtrade-offs,andguidingearly-stage decisionssuchassiteselection,designrequirements,andcommunityengagement
Inthefuture,severalareasmaybefurtherdevelopedtoenhanceSRC’sresourcehub.Theseinclude improvingdatabaseusabilitythroughmoreflexiblesearchfunctionsandclearerorganization,aswellas developingsupportinginterfacessuchaswebpages,userguides,orcuratedpathwaystohelpusers navigateresources.Itmayalsobeusefultostrengthenhowresourcesareinterpretedbyincorporating summaries,clearercategorization,andindicatorsofreliabilityorbias Inaddition,thescopeofresources couldbeexpandedtoincludetopicssuchascommunityengagementandconsultationprocesses,and factsheetsmaycontinuetobedevelopedasawaytoguideusersthroughthedatabase.
[1]LawrenceSusskind,etal.,“SourcesofoppositiontorenewableenergyprojectsintheUnited States,” Energy Policy, June2022,https://doi.org/10.1016/j.enpol.2022.112922
[2]XavierdeSouzaBriggs,LinneaJackson,andKaterinaOskarsson,“Thecleanenergy revolutionisheadedthroughruralandtribalcommunities.It’stimetochoosetherightpath,” Brookings, March2024, https://www.brookings.edu/articles/the-clean-energy-revolution-is-headed-through-rural-and-trib al-communities-its-time-to-choose-the-right-path/
[3]ChristyGoldfuss,“NotJustTalk:Next-LevelCommunityEngagementinRenewable Energy,” National Resources Defence Council, July2024, https://www.nrdc.org/bio/christy-goldfuss/not-just-talk-next-level-community-engagement-rene wable-energy.
[4]DouglasBessette,JosephRan,BenHoen,KarlHoesch,JakeWhite,SarahMills,andRobi Nilson,“CommunityCenteredSolarDevelopment(CCSD)StudyInterviews,” Energy Markets & Planning, June2023, https://emp.lbl.gov/publications/community-centered-solar-development.
[5]KathrynFrank,MichaelHibbard,MarkShucksmith,MatthewTonts,HualouLong,Yingnan Zhang,andHemalataC.Dandekar,“ComparativeRuralPlanningCultures,” Planning Theory & Practice, 2020,https://doi.org/10.1080/14649357.2020.1853438.
[6]JamesR.G.Kirk,“LandscapeofDistrust:PoliticalTrustAcrossAmerica’sUrban-Rural Divide,” American Politics Research, August2024, https://doi.org/10.1177/1532673X241273220
[7]KatherineJ.Cramer,“AttitudesTowardPublicInstitutionsandPublicEmployees,” The Politics of Resentment: Rural Consciousness in Wisconsin and the Rise of Scott Walker, March 2016.
[8]JuneManningThomas,“RacialInequityandEmpowerment:NecessaryTheoretical ConstructsforUnderstandingU.S.PlanningHistory,” Making the Invisible Visible: A Multicultural Planning History, 1998.
[9]“WhatisPlanning?”AmericanPlanningAssociation, https://www.planning.org/aboutplanning/
[10]“WhereDoPlannersWork?”AmericanPlanningAssociation, https://www.planning.org/choosingplanning/where/.
[11]“21stCenturyComprehensivePlan:Role,”AmericanPlanningAssociation, https://www.planning.org/planning/2016/mar/role/#:~:text=Comprehensive%20plans%20are%20 policy%20documents%20that%20help,such%20as%20a%20Public%20Art%20Master%20Plan*
[12]“SitingResourceCenter,”SitingResourceCenter,accessedApril10,2026, https://www.sitingresource.org/.
[13]DouglasBessetteandJacobWhite,“SupportingCommunity-CenteredSolarDevelopment: AGuidetoHostingCommunityConversationsaboutLarge-ScaleSolarDevelopment,” Michigan State University, December2024, https://www.canr.msu.edu/resources/supporting-community-centered-solar-development
Shengrui Chang ispursuinghergraduatedegreeinUrbanandRegionalPlanning Herresearchinterests includeenergyplanningandspatialdataanalysis.Shehasworkedonprojectsrelatedtoregional developmentanalysis,environmentalpolicyanalysis,andenvironmentalandhumanperception.Inthis project,shefocusedonrenewableenergysitinganddecommissioning
Yuyang Ding isaMasterofUrbanandRegionalPlanningstudentattheUniversityofMichigan Hehas workedonprojectsrelatedtohousing,landuse,andtransportation.Inthisproject,hefocusedspecifically onfiresafetyconsiderationsforBESSandgotmorefamiliarwithenergysitingandstoragetechnologies
Subah Iqbal isgraduatingwithaMasterofUrbanandRegionalPlanningdegreefromtheUniversityof Michigan,whereherinterestsflourishedinthebuiltenvironment,withinterestareasinurbanlanduse planning,sustainabledevelopment,transportationandspatialanalysis.Withabackgroundinarchitecture, sheispassionateaboutcreatingandplanningspacesthatspeaktothehumanexperience Inthisproject, shetookonquestionsconcerningthevisualimpactsofrenewableenergyprojectsonlandscapes,aswell asmoregroundingconcernsonsafetyandsetbacksforaircraftradarandnavigationsystemsandice sheddingfromwindturbines
Nathan Jindra isaMasterofUrbanandRegionalPlanningstudentattheUniversityofMichigan, studyinghousingandenergypolicyandtheirrelationshiptoeconomicdevelopment.Hehasexperiencein publichousingandrefugeeresettlement,andhopestoworkinacity’shousingdepartment,witha multifamilyhousingdeveloper,orwitharenewableenergydeveloper Inthisproject,hefocusedonsiting authority,communitycontrol,andpermitsforcleanenergy.
Makenna Litteral ispursuinghergraduatedegreesinUrbanandRegionalPlanningandEnvironmentand SustainabilityattheUniversityofMichigan ShehasparticipatedinAgora,astudentpublishedjournal, andtheRadicalPlanningInitiative,astudent-ledclass,whilecompletinghergraduateeducation Followinggraduation,Makennahopestocontinueworkinginenergyandtheplanning-sustainability intersection Inthisproject,shetookprimaryresponsibilityforthesectionongridreliabilityandlocal resilience.
Shuyang Shi ispursuinghergraduatedegreeinUrbanandRegionalPlanningattheUniversityof Michigan.Herresearchinterestsfocusonurbananalyticsandtransportationplanning,withanemphasis onusingdata-drivenapproachestounderstandurbansystems Shehasexperienceinspatialdataanalysis, GIS,andtravelbehaviormodeling,includingaccessibilityanalysisandtransportation-relatedquantitative analysis.Inthisproject,shefocusesonnoiseimpactsandregulationsrelatedtorenewableenergy facilitiesandcontributestoresearchonsitingwithinlanduseplanningandonfacilityoperations
Jeewon Suh isamaster’sstudentinUrbanandRegionalPlanningattheUniversityofMichigan Her researchinterestsfocusonurbaninformaticsandsustainability,withanemphasisonusingdata-driven approachestounderstandurbansystems Withabackgroundindatascience,sheappliescomputational andanalyticalmethodstoaddresscomplexurbanandenvironmentalchallenges Shehasexperiencein spatialdataanalysis,GIS,andclimatevulnerabilityassessmentconsulting.Inthisproject,herresearch focusesonlocalinfrastructurecapacity,zoningregulations,sitingpermits,andcommunityexpectations duringtheconstructionofenergyinfrastructure.
Xiaoyu Tao isamaster’sstudentinUrbanandRegionalPlanning.Herresearchfocusesonplanning analysisandtransportationplanning.Beforestartingthisdegree,shegainedprofessionalexperience workingasanurbanplannerandaconsultant Currently,sheworkspart-timeforanon-profit organization,wheresheusesdataanalysistohelplow-incomepeoplewiththeirdailycommutes.Forthis project,sheprovidesacomprehensiveanalysisoftheeconomicbenefitsandcostsofrenewableenergy whileofferingpracticaltoolsforplannerstomanagelocaltaxes,propertyvalues,andcommunity outcomes.
Junyi Wang isaMasterofUrbanandRegionalPlanningstudentattheUniversityofMichigan.Her interestsincludeurbaninformaticsandhousingequity,withafocusondata-drivenapproachesand geospatialanalysisandvisualization Throughthisproject,sheexploredcommunitybenefitmechanisms inutility-scaleenergyprojects.
Xuan Wang isamaster’sstudentinUrbanandRegionalPlanningattheUniversityofMichigan.Her researchinterestsincludeurbaninformatics,transportationplanning,andurbanrenewal Priortothis,she workedasaplanner,gainingextensiveexperienceinurbandataanalysis,urbanrenewal,travelbehavior analysis,andhigh-densityurbandevelopment.Inthisproject,shefocusesontheimpactofrenewable energyonwildlife,exploringwhatthoseimpactsareandhowtheycanbemitigated
Meilin Yang isaMasterofUrbanandRegionalPlanningstudentattheUniversityofMichigan.Her researchinterestsfocusontransportationbehavior,climateadaptation,andurbandataanalytics Shehas workedonprojectsrelatedtoclimateadaptationandurbanmobilityanalysis.Inthisproject,shetook primaryresponsibilityforthesectiononenvironmentalimpactsofrenewableenergyprojects.
Rongjia Zhang ispursuingherMasterdegreeofUrbanandRegionalPlanningattheUniversityof Michigan.Herresearchinterestsincludeurbaninformatics,transportation,landuse,andtheapplicationof newtechnologiesinurbancontext ShehadaninternshipinJLL,participatedinstrategyandconsulting jobsfocusedonAIanddigitaltransformation,andgainedexperiencerelatedtoAI-powered knowledgebase.Inthisproject,shedidresearchonaseriesofland-usetopicsofrenewableenergy, includinglandrequirements,farmlandloss,agrivoltaics,andbrownfielddevelopment
(tobeupdatedlater)
Number Topic
1 Howmuchlanddoesautility-scalesolar,wind,or BESSprojecttypicallyrequire?Whatdoesthe footprintlooklikeontheground?
2 Whyisn’ttheprojectbeingbuiltondisturbedland (brownfields,landfills,mines,industrialsites) insteadoffarmlandorrangeland?
3 Howmuchfarmlandwillneedtobecoveredby solarpanelstodecarbonizemystate?Whatabout theUS?
4 Canwegrowcropsundersolarpanels (agrivoltaics)?Whycan’twebothfarmand generateelectricityonthesameland?
5 Howwilltheprojectaffectbirds,bats,largegame, andotherwildlife?
6 Howcanadverseimpactstowildlifebeavoidedor mitigated?Howcanpositiveeffectsforwildlifebe promoted?
7 Howwilltheprojectaffectsoils,groundwater, stormwater,anddrainageonandoffsite?
8 Howwilltheprojectchangethelookandfeelofthe community(views,lighting,landscapecharacter, senseofplace)?
9 Whataretheeconomicbenefitsandcoststothe community,andwhoreceivesthem?
10 Whathappenstoagriculturalproductionandthe localagriculturaleconomyiflandisconvertedfor solar,wind,orBESS?
11 Howmanyjobsarecreated(constructionvs operations),aretheylocal,andwhatstandards apply?
12 Whatcommunitybenefitsaretypicalfor utility-scaleprojects,andhowaretheydeveloped, structured,andenforced?
RongjiaZhang 12
RongjiaZhang 2
RongjiaZhang 9
RongjiaZhang 6
XuanWang 28
XuanWang JunyiWang 19
MeilinYang 16
SubahIqbal 17
XiaoyuTao 24
XiaoyuTao 15
MeilinYang 6
JunyiWang 12
14
15
16
Willlocalelectricitybillsgodownifwehosta project?Ifnot,whynot?
NathanJindra 6
Howwilltheprojectaffectlocalresilienceand reliability(outages,emergencypower,microgrids)? Makenna Litteral 15
Howwilltheprojectaffectroads,traffic, emergencyservices,andlocalinfrastructure capacity? JeewonSuh 15
Howareculturalresources,historicsites,andTribal culturalplacesidentifiedandprotected?
27 17
Whomakesthepermittingdecision(localboardvs statesitingauthority)forrenewableenergy projects? NathanJindra 27
18
Whatistherationaleforvariouszoningregulations (setbacks,soundforalltechnologies)andwhat evidenceisthereforwhatisappropriate?
20 Howdoesrenewableenergysitingconnecttostate, local,orregionallanduseplanningforagriculture, housingdevelopment,naturalresourceuseand protection,etc.?
21 Whatconditionsarecommonlyattachedtositing permitsandhowaretheyenforced?
23
Howloudarewindturbines,solarinverters,and BESSfacilities?Whatstandardsapply?
24 Aretheretoxicmaterialsinsolarpanels,wind turbines,orbatteriesthatcouldcontaminatesoilor water?
26 Whatiswindturbineshadowflicker,whois affected,andhowisitpredictedandmitigated?
28 Whatarethefireandemergencyresponserisksfor solarandBESS,andwhatcodes/standardsgovern safety?
30 Dosolarpanelscauseglareproblemsforneighbors, drivers,oraviation,andhowisglareevaluated?
31
JeewonSuh 15
ShuyangShi 16
JeewonSuh 15
ShuyangShi 19
XuanWang 8
YuyangDing 8
YuyangDing 14
YuyangDing 5
Canwindturbinesthrowiceorshedblades,and whatdoesthatmeanforsetbacksandsafety? SubahIqbal 13
32 Canwindturbinesinterferewithradaroraviation, andwhatreviewsarerequired?
SubahIqbal 15
Howdodeveloperschoosesites,andwhat constraintsarescreenedoutearly(environmental, social,grid,landownership)?
ShengruiChang 9 37
Whatshouldthecommunityexpectduring construction(timeline,traffic,noise,dust,roaduse, localdisruption)?
JeewonSuh 15 39 Whathappensattheendoflife,andhowdo communitiesensurethesiteisrestored?
ShengruiChang 11 40
Whatfinancialassurancesareusedtoguarantee decommissioningandcleanupiftheowneris insolventordisappears?
44 Howdosolar,wind,andbatterystoragefacilities operateonaday-to-daybasis?
46
Howdotheseprojectsfitintotheelectricgridand affectreliability?
ShengruiChang 9
ShuyangShi 15
Makenna Litteral 19
● Trust&Tone
○ Whatmakesthisfactsheetfeeltrustworthyornot?Whatwouldincreaseyourconfidence inusingit?
○ Whichspecificwordsstriketherightorwrongtone?
● Clarity&Usability
○ Doesthisfactsheetansweryourquestionsaboutthetopic?Whatismissing?
○ Howusefulisthepresentationofresourcesinthefactsheetcurrently?
○ Whatimpactsyourunderstandingofthisfactsheetmost?(i.e.language,images/diagrams, citations,etc)
● Errors/Omissions
○ Howconsistentistheinformationpresentedwithwhatyouknowaboutthetopic?
○ Whatothersourceswouldbeuseful?
○ Doesthe“planner’sperspective”applyinyourplace?Whatothersuggestionsmightyou give?
● Whatissomethingallfactsheetsdidwell?Whatissomethingtheydidnotdowell?
● Whatisonethingthatstoodouttoyouacrosstheboardinallofthefactsheets?(trust,content, readability/design,applicability)
● Howwouldyouplantousesuchafactsheet?Whoistheaudience?
○ Howwouldyoumodifyitfordailyuse?
Willrenewableenergyprojectsdisturbsoilsoraffect vegetationandlong-termsoilhealth?
Howmightrenewableenergyprojectsaffect stormwater,drainage, andgroundwaterorsurface water?
Whatchemicalsarepresentonsite,andhoware spills,fires,orotheremergenciespreventedand managed?
Dorenewableenergyprojectshavecumulativeor watershed-scaleimpactsonwatersystems?
SettingTheRules:Zoning&Setbacks:WhatIsthe RationaleforSetbacks,NoiseStandards,andZoning Rules?
End-of-LifeMaterialManagement:Reuse, Recycling,andDisposalofSolarPanels,Wind Turbines,andBatteries
Created by Rongjia Zhang
April 2026
Land is a central consideration in the deployment of utility-scale renewable energy projects. Land requirements vary widely across technologies. Those numbers are not directly comparable unless the underlying definitions of area and unit are clear. Distinguishing different ways of measurement, as well as recognizing components of project footprint and factors influencing land-use efficiency, would help local decision makers to evaluate siting and minimize disturbance to the land.
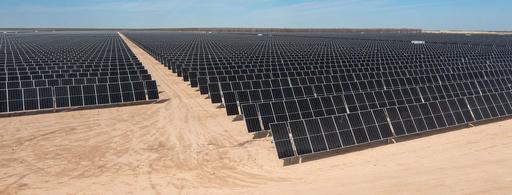
Tierra Bonita Solar Project, Girvin, TX
Source: https://www.mortenson.com/projects/tierra-bonita-solar-project
AreaDefinitions
Utility-scale solar land use is commonly measured in three different ways:
Siteboundary/totalarea: land enclosed by the project boundary, often close to the fenced operational site.¹
Directordisturbedarea: land directly occupied by solar arrays and related infrastructure such as roads, substations, and service buildings.¹
Array-onlyarea: the land visibly occupied by the PV array block itself, often mapped from aerial or satellite imagery.²
Packing Factor: the ratio of panel array footprint to that of the entire facility.
An evaluation of 719 solar PV facilities shows a median and capacity-weighted average packing factor of 74% and 75%.³
Solar projects can be rated in MWdcorMWac. MWdc refers to the direct-current capacity of the solar modules. MWac refers to the alternatingcurrent capacity at the inverter output. The relationship between the two is often described by the inverterloadingratio, or ILR, also called the DC:AC ratio. A representative ILR value for utility-scale PV is 1.34.⁴ Any conversion between acres/MWdc and acres/MWac depends on the assumed ILR unless both ratings are explicitly reported in the source. This is another reason why solar land-use statistics are often not directly comparable across reports.
Some commonly cited U.S. sources suggest the following benchmarks of solar land intensity: NREL analyzed about 30 large PV projects (>20MW) in 2012 and reported about 7.5 acres/MWac for fixed-tilt and 8.3 acres/MWac for one-axis tracking on a total area basis.¹
For array-onlyarea, LBNL analyzed 736 utility-scale PV plants in 2019 and reported median power densities of 0.35 MWdc/acre for fixed-tilt and 0.24 MWdc/acre for tracking systems, equivalent to about 3.7 acres/MWac and 5.6acres/MWac, respectively.²

Industry guidance from SEIA gives a general rule of thumb of about 5–7 acres per MW for utility-scale solar.⁵
A Virginia study of 94 operating solar facilities in 2024 reported an average and median disturbed area ratio of 6.93 acres/MWac.⁶
Another key distinction is between capacitybased and generation-based land metrics. Acres perMW measures land per unit of installed capacity. Acres per GWh measures land per unit ofelectricity actually generated.
Capacity Factor: measures actual annual electricity output relative to the theoretical maximum output if the plant ran at full rated capacity all the time.⁴
Higher-capacity-factor projects generate more electricity per MW, so they require less land per unit of energy, even if their acres/MW value is similar. U.S. utility-scale PV capacity factors vary widely, from roughly 21.4% in lower-resource areas to 34.0% in the best sites, with a historical median around 24%.⁴ Tracking systems and better solar resources generally increase capacity factor. For planning, this means two solar projects with similar acres/MW may have very different land efficiency per unit of electricity generated.
Technologychoiceandlayout(fixedvs. tracking): Tracking systems usually require larger row spacing to manage self-shading, which can increase acres per MW compared withfixed-tilt systems.² However, fixed-tilt systems use more land than 1-axis tracking on a generation basis, due to tracking technologies having higher capacity factors.¹
Ground coverage ratio:
Ground Coverage Ratio (GCR): the share of ground area within the array block that is covered by the horizontal projection of the PV rows.⁷
Typical GCRs imply that a large share of land inside the array block remains as inter-row space rather than panel surface. For tracking systems, typical ground coverage ratios are about 0.25–0.40; for fixed-tilt systems, about 0.40–0.50.² Optimal GCR depends strongly on latitude and acceptable shading/yield loss. Lower ground coverage ratios generally mean wider spacing between rows and lower capacity density per acre.⁷
Module efficiency and module wattage: Higher-efficiency modules can increase the amount of capacity installed on a given land area.²
Site constraints and setbacks: Wetlands, buffers, slope, and other unbuildable conditions can reduce the buildable share of a parcel and increase total acres per MW.⁸
Interconnection and off-site infrastructure: Gen-tie corridors, access roads, and other associated facilities can add to the broader project footprint.⁹
Temporary construction disturbance and mitigation requirements: Construction staging areas and off-site mitigation land can increase project-associated land needs beyond the long-term operational footprint.⁹
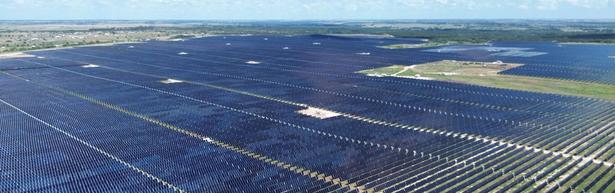
Source: https://www.mortenson.com/projects/markum-solar
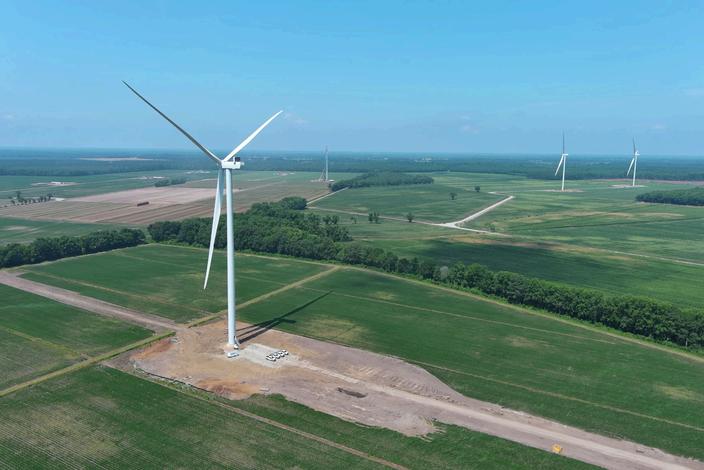
Timbermill Wind Project, Chowan, NC
Source: https://www.wunc.org/environment/2024-12-13/north-carolinaland-wind-farm-timbermill-chowan-county
Quantifyingthe area of a wind power plant is challenging given the discontinuous nature ofits configuration. “Area” includes not only land directly disturbed by installation of the turbines, butalso the surrounding area that potentially maybe impacted.¹⁰ According to a widely cited technicalreport of National Renewable Energy Laboratory¹⁰, there aretwo general types of “areas” considered.
Totalwindplantarea: Generally, the total area of a wind power plant consists of the area withina perimeter surrounding all of the turbines in the project. However, the perimeter is highly dependent on terrain, turbine size, current land use, and other considerations such assetback regulations. There is no uniform definition of the perimeter or boundary surrounding a wind power plant. The boundary could be defined based on the required turbine spacing as a function of rotor diameter, or use a standardized setback from turbines at the edge of a project. For each project, total area is defined through project applications or otherdocumentation.¹⁰
Permanentdisturbancearea: land with disturbances lasting the life of the project, occupied bywind turbinepads,access roads, substations, service buildings, andother infrastructure which physicallyoccupy land area, or createimpermeable surfaces.¹⁰
Temporarydisturbancearea: land with temporary impacts from plant construction, associated with temporary constructionaccess roads, storage,and lay-down.After plant construction is completed, theseareas will eventually returnto their previous state.¹⁰
Wind projects usually occupy a very large total project area while directly impacting only a small share of that land. The vast majority of the land inside the project often remains available for agriculture, grazing, or other compatible uses.¹⁰ The amount of land impacted by a long-term footprint at a specific site would vary depending upon a number of factors, including site terrain and project design.¹¹ The area directly impacted is typically less than 1% of the total wind project area.¹²
According to the NREL report evaluating 172 modern large wind power plants (>20MW)in 2009¹⁰, here are thebenchmarks ofwindplant land intensity:
For totalarea, the average is 84acres/MW, with about 80% of projects falling between roughly 25 and124 acres/MW.
For permanentdisturbancearea,the average is 0.74acres/MW, with about 80% of projects below roughly1 acre/MW
For temporarydisturbancearea,the average is 1.73acres/MW.
Two wind projects with the same nameplate capacity can produce different amounts of electricity because of different capacity factors. Capacity factors of wind projects depend on wind resource quality, turbine technology, and project design. The average capacity factor of wind projects in 2025 is 34.2%.¹³
Turbinespacingandwake-loss management: Wind turbines must be spaced across a large area to reduce aerodynamic wake losses, which is one of the main reasons project boundaries are so large.¹⁰
Terrainandroaddesign: Steep or complex terrain often requires more road length, more cut-and-fill work, and larger construction areas, increasing permanent disturbance per MW. Projects that can use existing farm or ranch roads typically have lower disturbance than projects that require extensive new road building.¹⁰
Environmentalconstraintsandsetbacks: Wetlands, wildlife habitat, buffers, and local setback requirements can push turbines farther apart or force more circuitous layouts, increasing land requirements.¹⁴
Turbinesizeandprojectconfiguration: Larger turbines may reduce the number of turbines needed for a given project capacity, but land-use outcomes do not follow one simple universal pattern because spacing, terrain, and road needs can still dominate.¹⁴
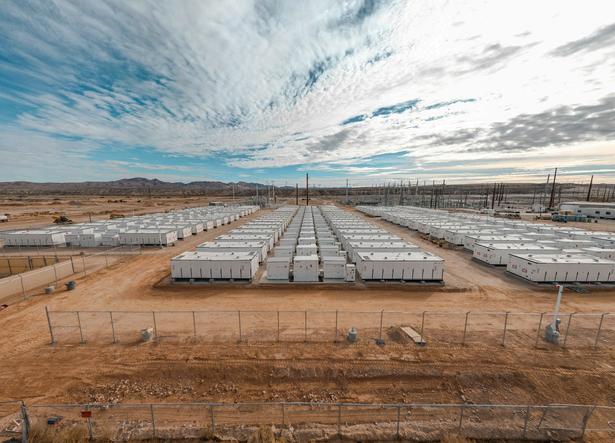
For BESS, MW represents the power rating, or how fast the system can charge or discharge. MWh represents the energy capacity, or how much electricity the system can store. Duration in hours is MWh divided by MW, representing that BESS projects can provide energy services at their maximum power capacity for that timeframe.
BESS projects are generally designed to deliver their full rated power for durations ranging from 1to4hours, with emerging technologies extending this to longer durations to meet evolving grid demands.¹⁵ A longer-duration system usually needs more battery units or containers, which can increase the total site footprint.
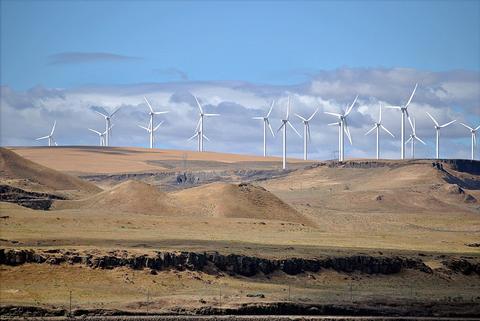
Shepherds Flat Wind Farm, OR
Source: https://www.mortenson.com/projects/markum-solar
BESS generally requires much less land than solar and wind. Grid-scale BESS is modular and has limited infrastructure needs, which enables siting in many settings including close to existing commercial/industrial areas.¹⁶
Hereare some benchmarks of BESS land intensity:
A typical standalone off-site BESS often requires 0.03–0.1acres/MW.¹⁷
ForDTE’s Trenton Channel BESS Project, the 220 MW, 4-hour BESS will be located in11 acres of total project area.¹⁸ The land intensity is approximately 0.05acres/MW and 0.0125acres/MWh.
Calpine built the Nova Power Bank, a 680 MW, 4-hour duration BESS on a brownfield site in Menifee, CA. It is one of the largest standalone battery storage facilities in the world and stretches over 43 acres with about 1,200 battery enclosures.¹⁹ The land intensity is approximately 0.063acres/MW and 0.016 acres/MWh.
The cost and performance of the battery systems arebased on an assumption of approximately one cycle per day. Therefore, a 4-hour device has an expected capacity factor of 16.7% (4/24 = 0.167), and a 2-hour device has an expected capacity factor of 8.3% (2/24 = 0.083).²⁰ This means a BESS project may look very landefficient on an acres/MW basis, but the land required per unit of delivered annual energy depends heavily onhow often the battery is used.
SiteLocation: Industrial districts, brownfields, or parcels adjacent to substations / transmission can reduce new lineconstruction and land disturbance.¹⁷
Batterychemistryandconfiguration:
Compared to widely deployed lithium-ion batteries, flow batteries are suited for longer durations (4–12+ hours), but they occupy morespace with a significantly lower energy density.²¹
Stormwaterapproach: On-site basinsvs. distributed infiltration can change howmuch land becomes dedicated stormwaterspace.²²
Constructionstagingandlaydownyards: Requiring a temporary laydownareaand verified restoration can reduce permanent land take.²²
Setbacks,buffers,berms,andlandscaping: These areoften one of thelargestdriversof total site acreage because theyareheavily shaped by localordinances andsite-plan conditions.
Planners and local decision makers can use the following checklist to make wiser land-use planning and permitting decisions:
Standardizehowlanduseis evaluated
Require applicants toclearlyreport which landmetricthey are using, such as total site area, disturbedarea, array-only area, permanent disturbance, or temporary disturbance.
Avoidcomparingprojectsusing a single headline acreagenumber without checking whether the definitions are actually comparable.
Consider capacity factors when comparing projects, since similar acres/MW values can still produce very differentoutcomes in termsof actual electricity generation.
Check whether larger land requirements are being driven by technology choice, row spacing, turbine spacing, stormwater design, road layout, or battery configuration. Identify how much of the footprint is shaped by local setbacks, buffers, berms, landscaping, wetlands, slopes, habitat constraints, or access requirements. Distinguish between long-term occupied land and land that may remain compatible with other uses.
[1] Ong, S., Denholm, P., Heath,G.,Margolis,R.,&Campbell,C. (2013). Land-Use RequirementsforSolarPowerPlantsinthe United States. National RenewableEnergy Laboratory. https://research-hub.nlr.gov/en/publications/land-userequirements-for-solar-power-plants-in-the-united-states/
[2] Bolinger, M., & Bolinger,G. (2022).LandRequirementsfor Utility-Scale PV: An EmpiricalUpdateonPowerandEnergy Density. IEEE Journal of Photovoltaics,12(2),589-594. https://ieeexplore.ieee.org/document/9676427
[3] Hu, S., Sun, Y., Hernandez, R.R.,Valanarasu,J.M.J.,Patel,V.M., &Jordaan, S.M. (2025). Quantifyingland-usemetricsforsolar photovoltaic projects in the westernUnitedStates. Communications Earth & Environment,6. https://www.nature.com/articles/s43247-025-02862-5
[4] National Laboratory of the Rockies.(2024).2024Annual Technology Baseline. https://atb.nrel.gov/electricity/2024b/utilityscale_pv
[5] Solar Energy Industries Association.(n.d.).LandUse&Solar Development. https://seia.org/initiatives/land-use-solardevelopment/
[6] Pitt, D., Berryhill, A., & Ciminelli,J.(2024).RE-EVALUATINGTHE LAND USE IMPACTS OF UTILITYSCALESOLARENERGY DEVELOPMENT IN VIRGINIA.VirginiaDepartmentofEnergy. https://www.energy.virginia.gov/renewableenergy/documents/ReEvaluating%20Land%20Use%20Impacts%20of%20UtilityScale%20Solar%20-%20FINAL.pdf
[7] Tonita, E.M., Russell, A.C.J., Valdivia,C.E.,&Hinzer,K.(2023). Optimal ground coverage ratiosfortracked,fixed-tilt,andvertical photovoltaic systems for latitudesupto75°N.SolarEnergy,258, 8-15.
https://www.sciencedirect.com/science/article/pii/S0038092X2300 2682
[8] Washington State Department of Ecology. (2025). Final Programmatic Environmental Impact Statement for Utility-Scale Solar Energy Facilities in Washington State. https://ecology.wa.gov/regulations-permits/sepa/cleanenergy/programmatic-eis
[9] Renew Development HoldCo LLC, & Clearway Energy Group LLC. (2024). Mosey Solar Project PLAN OF DEVELOPMENT. https://www.blm.gov/sites/default/files/docs/202410/BLM_NV_SNDO_Mosey-Trout-Canyon-POD.pdf
[10] Hand, M., Ong, S., & Jackson, M. (2009). Land Use Requirements of Modern Wind Power Plants in the United States. National Renewable Energy Laboratory. https://researchhub.nlr.gov/en/publications/land-use-requirements-of-modernwind-power-plants-in-the-united-s/
[11] Bureau of Land Management. (2005). Wind Energy Final Programmatic Environmental Impact Statement (EIS). https://windeis.anl.gov/documents/fpeis/
[12] U.S. Department of Energy. (2015). Wind Vision: A New Era for Wind Power in the United States.
https://www.energy.gov/cmei/systems/wind-vision
[13] U.S. Energy Information Administration. (2026). Capacity Factors for Utility Scale Generators Primarily Using Non-Fossil Fuels.
https://www.eia.gov/electricity/monthly/epm_table_grapher.php? t=epmt_6_07_b
[14] U.S. Fish & Wildlife Service. (2012). Land-Based Wind Energy Guidelines. https://www.fws.gov/media/land-based-wind-energyguidelines
[15] National Renewable Energy Laboratory. (2022). Storage Futures Study: Key Learnings for the Coming Decades. https://www.energy.gov/cmei/storage-futures-study-keylearnings-coming-decades
[16] Twitchell, J.B., Powell, D.W., & Paiss, M.D. (2023). Energy Storage in Local Zoning Ordinances. Pacific Northwest National Laboratory. https://www.pnnl.gov/publications/energy-storagelocal-zoning-ordinances
[17] Graham Sustainability Institute. (2024). PLANNING & ZONING FOR BATTERY ENERGY STORAGE SYSTEMS. University of Michigan. https://graham.umich.edu/project/bess-guide
[18] U.S. Department of Energy. (2024). CX-270751: DTE Electric Company Trenton Channel Battery Energy Storage System Project. https://www.energy.gov/nepa/articles/cx-270751-dteelectric-company-trenton-channel-battery-energy-storage-systemproject
[19] CALPINE. (n.d.). Nova Battery Storage Projects. https://www.calpine.com/battery-storage-projects/nova-batterystorage-projects/
[20] National Laboratory of the Rockies. (2024). Annual Technology Baseline. https://atb.nrel.gov/electricity/2024b/utilityscale_battery_storage
[21] Jackman, T. (2025). Overview of Battery Energy Storage Systems. Oregon Department of Energy. https://www.oregon.gov/energy/facilitiessafety/facilities/Council%20Meetings/2025-05-16-EFSC-Item-CStaff-Report-Battery-Storage-Technology-Overview.pdf
[22] Snowshoe BESS, LLC. (2024). Application to the Minnesota Public Utilities Commission for a Site Permit. https://puc.eip.mn.gov/sites/default/files/202505/Application%20%281%29.pdf
Created by Rongjia Zhang
April 2026
As the United States expands utility-scale solar to meet decarbonization goals, concerns have grown over whether solar development on farmland could threaten agricultural production and food security. This factsheet examines that debate by comparing the land requirements of solar with the scale of U.S. farmland, explaining why productive farmland is often attractive to solar developers, and assessing whether this poses a meaningful risk to the food system. It also reviews key strategies for reducing conflict between solar and agriculture, including development on disturbed land, low-impact solar practices, and agrivoltaics that allow some forms of farming and energy production to coexist on the same land. Overall, the evidence suggests that while solar’s total land footprint is relatively small at the national scale, siting and management choices matter greatly for protecting prime farmland, sustaining farm viability, and minimizing long-term impacts on agricultural land at the local level.
If we take too much land out of food production for solar projects, will we be able to feed ourselves?
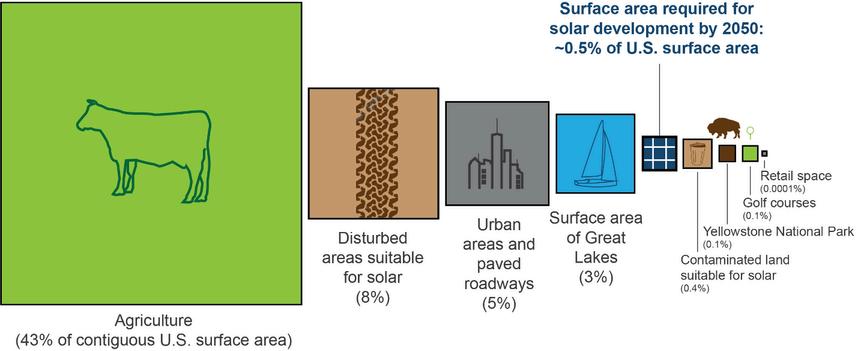
The U.S. Department of Energy (DOE) and National Renewable Energy Laboratory (NREL) ’s Solar Futures Study assumes the U.S. electric grid becomes 95%decarbonizedby2035 and 100% decarbonizedby2050. To achieve these levels of decarbonization, solar would need to account for 45%ofelectricitygeneration in 2050 with other zero-carbon energy sources—especially wind energy—supplying the rest. According to the study, in 2050, ground-based solar PV deployment will require about 10.3millionacres
of land, equivalent to 0.5%ofthecontiguous U.S.surfacearea.¹
Another estimate is from Net-Zero America by Princeton University. To meet the goal of netzeroemissionsin2050, utility-scale solar projects will require 9.5millionacres of land in the scenario of minimizing total energy-system cost, or 15.1millionacres of land in the scenario that renewable energy supplies 100% of primary energy.²
Total land in the 48 contiguous states is nearly 1.9 billion acres, and approximately 874million acresarefarmland in 2025.³ Modeling done by American Farmland Trust (AFT) projects that 83% of new solar built by 2040 could be sited on agricultural lands.⁴ The American Clean Power Association (ACP) points out that even if all new solar predicted by DOE in Solar Futures Study are to be built on farmland, the new development would affect lessthan1.2%ofcurrent farmland. As a result, they conclude that the farmland solar occupies is too small to significantly affect food supply in the U.S.⁵
Primefarmland refers to land that has the best combination of physical and chemical characteristics for producing food, feed, forage, fiber, and oilseed crops and is also available for these uses.⁶ Marginalfarmland refers to less productive land that often shifts in and out of cultivation and is often more environmentally sensitive than highly productive land.⁷ According to USDA, the U.S. has about 876.5 million acres of farmland in 2024³ and 313.7 million acres are prime farmland⁸, so the percentage of prime farmland is approximately 36%. About 65% of the prime farmland is used as active cropland.⁸
Highly productive farmland such as USDAclassified prime farmland is often a first-choice site for utility-scale solar because it tends to be sunny, flat, dry, cleared, and close to grid infrastructure and population centers.⁹ Almost half of the new solar built on agricultural lands by 2040 will be located on the most productive land for producing food and crops.⁴ Some agricultural economists and agronomists argue that taking even small amounts of the best cropland out of production for solar development and damaging valuable topsoil impacts future crop potential in the United States.¹⁰
However, a recent research finds little correlation between the share of prime farmland and solar development on parcels, but solar development was more likely on farmland that is not prime but categorized as “important” by state or local officials. Using three indices of farmland quality, however, there’s a slight negative correlation between farmland quality and solar development. The findings suggest solar is not disproportionately sited on parcels with high-quality farmland but is more likely on farmland categorized as important for agricultural production.¹¹
GIS analysis of ACP shows that utility scale solar currently occupies less than 0.1% of prime farmland in 36 states and less than 0.01% of prime farmland in 12 states. Nationally, the state average is just 0.07%ofprimefarmland used by solar. Only California and Rhode Island exceed 0.25% of prime farmland currently used for solar.⁵ USDA reported that among rural solar projects installed from 2012 to 2020, 43%were oncropland and 28%wereonpasture-range land.¹²
U.S. farmers already dedicate approximately 40 millionacres to corn for ethanol each year, equivalent to about 4.5% of farmland.⁵ Utilityscale solar can produce the same energy as corn ethanol using about 1/31asmuchland.¹³ Wisconsin, for example, could meet its carbonfree goals using 240,000–285,000 acres of solar, less than one-third of the land currently used for ethanol.¹⁴
To protect farmland, American Farmland Trust (AFT) SmartSolarprogram recommends policymakers, developers, and decisionmakers to prioritize solar siting on the built environment and land not well suited for farming, including rooftops, irrigation ditches, brownfields, and marginal lands.⁴ In the Smart Solar Siting report for New York, AFT proposes a three-step solar siting framework to minimize impact on prime farmland: first, classify projects based on impacts to higher-quality soils; second, use mitigation fees to discourage conversion of prime farmland; third, allows discounts when developers incorporate measures such as agrivoltaics or other actions that support continued farm viability.¹⁵
Developing solar on disturbed land can reduce pressure on agricultural land and support broader redevelopment goals by putting
contaminated properties back into productive use.¹⁶ At the same time, disturbed sites are often harder to build on than greenfield sites because site conditions such as contamination location, topography, flood zones, and parcel dimensions can reduce the developable area and affect project viability. Environmental cleanup, flood risks, and other climate-related concerns must be considered during planning for these sites.¹⁷
At the federal level, the Environmental Protection Agency (EPA) ’s RE-PoweringAmerica’sLand Initiative promotes renewable energy redevelopment on contaminated lands, landfills, and mine sites and provides mapping, identification, and development resources.¹⁸ As contamination can create additional legal and transactional complexity, EPA has published liability guidance specifically for renewable energy on potentially contaminated properties.¹⁹ For landfill sites in particular, EPA has developed a dedicated best-practices document because these projects face common technical challenges that require additional coordination among municipalities, developers, communities, and regulators.²⁰
Low-impact solar development is about designing, building, operating, and eventually decommissioning projects in ways that minimize long-term harm to land, soil, water, and agriculture.²¹ USDA specifically recommends managing solar sites around four soil-health principles—maximize soil cover,biodiversity, and living roots, and minimize soil disturbancey—so that farmland soils remain functional during the life of the project and are more likely to remain suitable for future agricultural use.²²
General practices of low-impact site preparation²³ include:
Existing vegetation is left intact or is replaced with low-growing native vegetation species or crops. Vegetation that supports habitat of pollinator species is encouraged. Existing topsoil is left in place to allow for the successful growth of native vegetation and to promote soil health post-decommissioning of the solar project.
Natural contours of land are worked into the design and configuration of the solar project, with minimal if any land grading required. Lower land footprint for foundations of vertical support structures, by instead using driven piles.
Agrivoltaics, the combination of agriculture and solar energy on a single plot of land, is one of the fastest-growing applications of solar today. The American Farm Bureau endorsed agrivoltaics for its potential to support livestock, crop production, and pollinator habitats while protecting farms and diversifying farmer income.²⁴ In U.S. practice, the most common solar grazing involves sheep; applications with crops grown under elevated panels or between panel rows are still rare.¹²
Agrivoltaic benefits depend on climate and crop type, and that some crops may benefit from shade and reduced evaporation while others may not.²⁵ High-value crops such as leafy
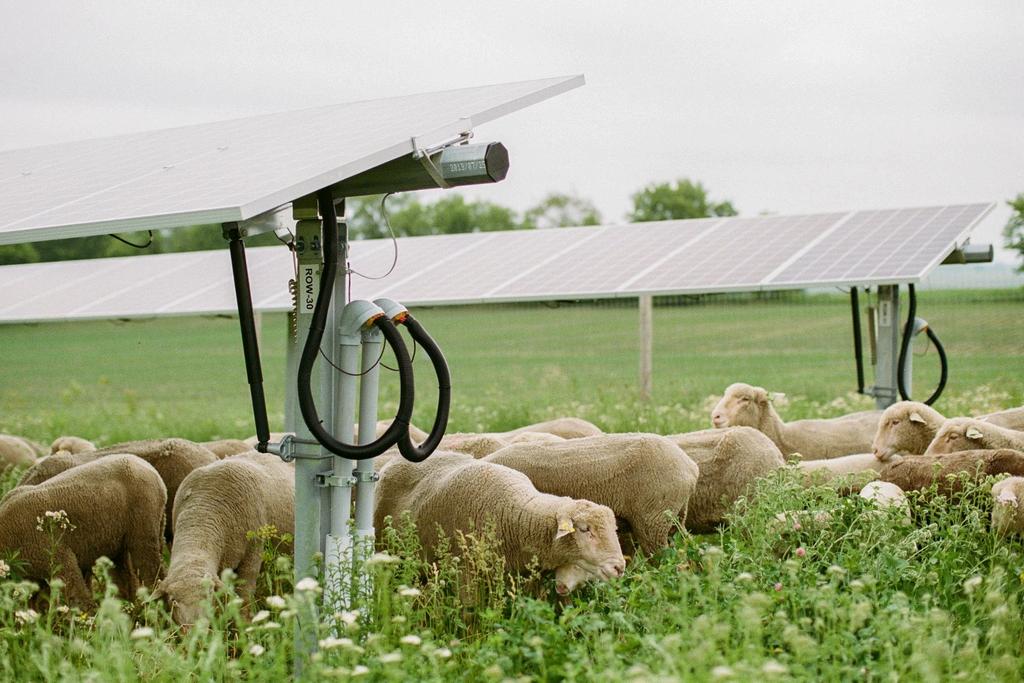
Source: https://www.cannonvalleygraziers.com/solar-grazing
greens, broccoli, peppers, strawberries, and blueberries thrive in reduced light conditions.²⁶ Agrivoltaics can be especially helpful in some drier regions by reducing water demand.²⁷ In practice, crop-based agrivoltaics is currently most compatible with hand-harvested or smallmachine-harvestedcrops, unless the project is intentionally designed with greater heightand spacing for larger farm equipment.²⁸ As a result, these applications are most commonly found on small solar farms.
Solar grazing is expanding rapidly: more than 129,000 acres of solar sites are now managed by 113,000+ sheep across500 projects in 33 states.²⁹ This practice can reduce the need for mowing and other traditional vegetation management tools,lowering maintenance costs forsolar projects. Sheep benefit from the shade andshelter provided by solar panels.²⁶ Sheep are much more common than cattle in solar grazing because most standard utility-scale panel heights canaccommodate sheep, while cattle usually require elevated panels and reinforced structures to protect both the animals and the array. If grazing is planned, systems should be designed so that wires, conduit, electrical boxes, andother equipment are inaccessible to animals, which becomes harder with larger livestock.²²
Planners and local decision makers can use the following checklist to better deal with the conflict between solar and farmland:
Clarify what your community is trying to protect most: primefarmland, overallfarm viability, renter accessto land,disturbed-land reuse, orrapid clean energy deployment.
Match your approachto youractual authority.Some communities can act through zoning, permitting, orhostcommunity agreements, whileothers may need to rely more on state review processes, local plans, and negotiated mitigation.
Classify farmland based on productivity and otherimportant characteristics. Search for available siteswith lowerconflictthan farmland.
Require mitigation and conservation forland when projects affecthigherquality farmland or activefarm operations.
Where appropriate, promote agrivoltaics orother designsthat help maintain agricultural use. Require low-impactsite design and management.
Make decommissioningand restoration part of the approval process fromthe beginning solandhas a more credible path back to agriculture after the project ends.
[1] Office of Energy Efficiency&RenewableEnergy.(2021).Solar Futures Study. U.S. DepartmentofEnergy. https://www.energy.gov/sites/default/files/202109/Solar%20Futures%20Study.pdf
[2] Princeton University. (2021).Net-ZeroAmerica. https://netzeroamerica.princeton.edu/the-report
[3] National Agricultural StatisticsService.(2026).FarmsandLand in Farms. U.S. Departmentof Agriculture. https://esmis.nal.usda.gov/publication/farms-and-land-farms
[4] American Farmland Trust.(n.d.).SmartSolar℠onFarmland and Ranchland. https://farmland.org/files/aft_smart-solarhandout-general-d-(1).pdf
[5] The American Clean PowerAssociation.(2026).Utility-scale Solar on Farmland by the Numbers. https://cleanpower.org/resources/utility-scale-solar-on-farmlandby-the-numbers/
[6] Natural Resources ConservationService.(2015).National Resources Inventory (NRI) Glossary.U.S.Departmentof Agriculture. https://www.nrcs.usda.gov/sites/default/files/202210/NRI_glossary.pdf
[7] Lubowski, R.N., Classen,R.,&Roberts,M.J.(2006).Agricultural Policy Affects Land Use andtheEnvironment. U.S.Departmentof Agriculture. https://www.ers.usda.gov/amberwaves/2006/september/agricultural-policy-affects-land-use-andthe-environment
[8] Farm Service Agency. (2024).DraftProgrammatic Environmental Assessment-FarmStorageFacilityLoan(FSFL) Program. U.S. Departmentof Agriculture. https://www.fsa.usda.gov/sites/default/files/202412/FSFL%20PEA%20Draft%2011.08.24.pdf
[9] Levy, S., & Winter, E. (2024).RecommendationsforStateand Local Governments to AdvanceSmartSolarPolicy.American Farmland Trust.
https://farmlandinfo.org/publications/recommendations-forstate-and-local-governments-to-advance-smart-solar-policy/ [10] Huffstutter, P.J., & Walljasper,C.(2024).Insight:Assolar capacity grows, some of America'smostproductivefarmlandisat risk. Reuters. https://www.reuters.com/world/us/solar-capacitygrows-some-americas-most-productive-farmland-is-risk-2024-0427/
[11] Winikoff, J.B., Maguire,K., Tanner,S.J.,Deol,S.,&Weilert,T. (2026). Cashing out? Farmlandqualityandtheadoptionofutilityscale solar energy. Renewable Energy,259. https://www.sciencedirect.com/science/article/pii/S096014812502 6904
[12] Maguire, K., Tanner, S., Winikoff,J.B.,&Williams,R.(2024). Utility-scale solar and wind developmentinruralareas:Land cover change (2009–20). U.S.DepartmentofAgriculture. https://www.ers.usda.gov/publications/pub-details?pubid=109208
[13] Sturchio, M.A., Gallaher,A.,&Grodsky,S.M.(2025). Ecologically informed solar enablesasustainableenergy transition in US croplands.ProceedingsoftheNationalAcademy of Sciences of the United StatesofAmerica,122(17). https://www.pnas.org/doi/10.1073/pnas.2501605122
[14] Mathewson, P., & Bosch, N. (2023). Corn Ethanol vs. Solar Land Use Comparison. cleanwisconsin. https://www.cleanwisconsin.org/corn-ethanol-vs-solar-land-usecomparison/
[15] Levy, S., Ruiz-Ramón, M., Winter, E. (2022). Smart Solar Siting on Farmland: Achieving Climate Goals While Strengthening the Future for Farming in New York. American Farmland Trust. https://farmlandinfo.org/wp-content/uploads/sites/2/2022/01/NYSmart-Solar-Siting-on-Farmland_FINAL-REPORT_1.31.22.pdf
[16] Michigan Department of Environment, Great Lakes, and Energy. (n.d.). Brownfield Redevelopment. https://www.michigan.gov/egle/about/organization/remediationand-redevelopment/brownfields
[17] United States Environmental Protection Agency. (n.d.). Site Conditions and Feasibility. https://www.epa.gov/re-powering/siteconditions-and-feasibility
[18] United States Environmental Protection Agency. (n.d.). REPowering America’s Land. https://www.epa.gov/re-powering [19] United States Environmental Protection Agency. (2012). REPowering America's Land - Siting Renewable Energy on Potentially Contaminated Properties: Liability Considerations. https://www.epa.gov/enforcement/fact-sheet-re-poweringamericas-land-siting-renewable-energy-potentially-contaminated [20] United States Environmental Protection Agency. (2022). Best Practices for Siting Solar Photovoltaic on Municipal Solid Waste Landfills https://www.epa.gov/re-powering/best-practices-sitingsolar-photovoltaics-municipal-solid-waste-landfills-0
[21] The Nature Conservancy. (2023). Principles of Low-Impact Solar Siting and Design.
https://www.nature.org/content/dam/tnc/nature/en/documents/2 023SolarGuidanceTNCNC.pdf
[22] Natural Resources Conservation Service. (2024). Conservation Guidance for Utility-Scale Solar Projects. U.S. Department of Agriculture.
https://intranet.usda.gov/sites/default/files/media/documents/NR CS_ConservationGuidance_USSP_121024.pdf
[23] InSpire. (n.d.). Low-Impact Solar Development Strategies Primer. https://openei.org/wiki/InSPIRE/Primer
[24] Achard, S. (2025). Farm Bureau Endorses Agrivoltaics in Major Policy Shift at 2025 AFBF Convention. iGrow News. https://igrownews.com/farm-bureau-endorses-agrivoltaics-inmajor-policy-shift-at-2025-afbf-convention/
[25] Boyd, M. (2023). The Potential of Agrivoltaics for the U.S. Solar Industry, Farmers, and Communities. U.S. Department of Energy. https://www.energy.gov/cmei/systems/articles/potentialagrivoltaics-us-solar-industry-farmers-and-communities
[26] Solar Energy Industries Association. (2026). Solar & Agricultural Land Use. https://seia.org/research-resources/solaragricultural-land-use/
[27] Climate Hubs. (n.d.). Agrivoltaics: Pairing Solar Power and Agriculture in the Northwest. U.S. Department of Agriculture. https://www.climatehubs.usda.gov/hubs/northwest/topic/agrivolt aics-pairing-solar-power-and-agriculture-northwest
[28] Doubleday,K. (2024). Introduction to the 3-Part Agrivoltaics Knowledge Series. The National Renewable Energy Laboratory. https://docs.nlr.gov/docs/fy24osti/90584.pdf
[29] American Solar Grazing Association. (2025). United States Solar Grazing 2024 Census. https://solargrazing.org/2024-solargrazing-census-report-now-available/







Created by Meilin Yang, April 2026
Key Questions
Do renewable energy projects disturb soils or remove vegetation?
Yes, especially during site preparation and construction, when grading, trenching, and equipment use can disturb soils and remove existing vegetation. However, sites are often re-vegetated or stabilized after construction. [1][2][11]
Do these changes affect long-term soil health?
It depends. Long-term soil conditions are influenced by whether soils are compacted, left exposed, or restored with vegetation. In some cases, soil moisture and ecological function can recover or even improve compared to the pre-development state with appropriate management. [1][8][9][10]
Are impacts on soils and vegetation permanent?
Not necessarily. Many impacts are temporary and occur during construction, while long-term conditions depend on post-construction management such as vegetation restoration, erosion control, and limiting ongoing disturbance. [1][3][4]
Renewable energy projects can disturb soils and affect vegetation, particularly during site preparation and construction. Activities such as grading, trenching, and the use of heavy equipment can remove existing vegetation, compact soils, and alter surface conditions. [1][11] These changes may temporarily affect soil structure, water infiltration, and erosion patterns, especially if soils are left exposed or highly disturbed. [2][11]
However, these impacts are not unique to renewable energy development and are broadly comparable to those associated with other land use developments, such as residential or commercial construction. [3][4] In many cases, the extent of disturbance depends more on how a site is prepared and managed than on the energy technology itself. [3][6] Renewable energy facilities, particularly solar and wind, often maintain largely permeable ground surfaces, and the intensity of disturbance per unit area can be similar to or lower than that of more intensive development. [5][6]
Long-term effects on soil health and vegetation depend primarily on post-construction conditions and management practices. Sites are commonly stabilized or re-vegetated after construction, and
maintaining vegetation cover can help restore soil structure, reduce erosion, and support ecological function over time. [1][3][4] In some contexts, especially where vegetation is retained or reintroduced, renewable energy installations may even improve soil moisture retention and support plant growth by altering microclimatic conditions such as shading and evapotranspiration. [8][9][10]
Overall, while renewable energy projects can cause short-term disturbance to soils and vegetation, long-term impacts are highly dependent on site design, vegetation management, and soil conservation practices. [1][11] With appropriate planning and implementation, many impacts can be minimized or avoided, allowing projects to maintain or recover key soil functions. [1][4][5]
Impacts on soils and vegetation are primarily driven by ground disturbance and changes to land cover during site preparation and construction. Activities such as grading, excavation, and trenching can disrupt soil structure and remove existing vegetation, exposing soils to erosion and altering surface conditions. [1][11]
Soil compaction from heavy equipment is another key factor, as it can reduce soil porosity and infiltration capacity, increasing the likelihood of surface runoff and limiting root growth. [2][11] In addition, the installation of foundations, access roads, and underground cables can create localized areas of disturbance that remove or fragment existing vegetation and strip or mix topsoil layers. [1][11] These changes can reduce root stabilization, expose bare soil to erosion, and slow the recovery of soil structure and long-term soil health if disturbed areas are not properly restored. [1][2][11]
Vegetation removal plays a critical role in shaping soil outcomes, as it reduces root stabilization, decreases evapotranspiration (the process by which water is transferred from soil to the atmosphere through evaporation and plant transpiration), and leaves soils more vulnerable to erosion and moisture loss. [8][11] Where vegetation is not restored, these effects may persist over time, particularly in areas with frequent disturbance or limited soil recovery. [1][3]
However, the same processes can also support recovery or improvement when managed appropriately. Re-vegetation and the use of ground cover can stabilize soils, enhance infiltration, and reduce erosion risks, as well as help regulate soil temperature and moisture conditions. [1][3][4] In some cases, especially where vegetation is maintained or reintroduced under solar arrays, shading can reduce evapotranspiration and increase soil moisture, supporting plant growth and soil function. [9][10]
As summarized in Table 1.1, many of these impacts are closely linked to specific construction activities and land management practices and can be minimized through targeted planning and site design measures.
Impact What Causes It What Planners Can Do
Soil disturbance Grading, excavation, trenching during construction
Soil compaction Heavy equipment and repeated site access
Vegetation loss Clearing for infrastructure and site preparation
Increased erosion risk Exposed soils and reduced root stabilization
Drainage disruption Roads, trenches, and foundations altering flow paths
Minimize grading; limit disturbance footprint
Restrict equipment use; designate access routes
Preserve existing vegetation; revegetate after construction
Use erosion control measures; establish ground cover quickly
Maintain natural drainage patterns; incorporate drainage design
Solar: Large site area but shallow, distributed disturbance
Solar energy facilities typically occupy relatively large land areas, but most infrastructure is installed near the ground surface. Solar panels are commonly supported by shallow foundations or driven piles that require limited excavation, with disturbance concentrated in narrow rows for foundations, trenches, and access routes. [1][11] As a result, large portions of the site between panel rows often remain permeable and can be maintained or restored with vegetation, reducing long-term soil disturbance and supporting soil stability. [1][8]
Wind: Small footprint with deeper, localized disturbance
Wind energy projects have a much smaller direct land footprint but require deeper excavation for turbine foundations. Construction of turbine pads, underground electrical connections, and access roads can create localized areas of soil disturbance at each turbine location. [5][7] However, because turbines are widely spaced, most of the surrounding land remains undisturbed and can continue to support existing land uses such as agriculture or grazing, limiting overall impacts on soils and vegetation. [5]
Battery Energy Storage Systems (BESS): Compact sites with concentrated disturbance
Battery energy storage systems generally occupy compact sites and involve disturbance that is limited to the facility footprint. Construction typically includes equipment pads, foundations for battery containers, and associated electrical infrastructure within a confined area. [6][8] As a result, soil and vegetation impacts are usually concentrated and spatially limited, although they may
involve more complete surface coverage within the site boundary compared to solar or wind facilities. [6]
Impacts on soils and vegetation are primarily addressed through zoning, permitting, and site plan review. Local governments can influence outcomes by regulating grading, limiting disturbance areas, and requiring vegetation retention or restoration through land use controls and project design standards. [3][4]
Planners typically require erosion and sediment control plans, stormwater management plans, and site stabilization measures to reduce soil disturbance and prevent long-term degradation. These tools can help preserve topsoil, maintain soil structure, and ensure timely re-vegetation after construction. [1][3]
At the project level, planners can prioritize minimizing ground disturbance, protecting existing vegetation, and maintaining natural drainage patterns. Clear requirements for vegetation management and post-construction maintenance are especially important for supporting longterm soil health and site stability. [1][4]
[1] National Renewable Energy Laboratory. (2021). PV-SMaRT best practices for stormwater management at solar sites. https://a.storyblok.com/f/120093/x/e6555939eb/pv-smart-best-practice.pdf
[2] National Renewable Energy Laboratory. (n.d.). PV-SMaRT: Solar photovoltaic stormwater management research and testing. https://www.nlr.gov/solar/market-research-analysis/pv-smart
[3] Center for Rural Affairs. (2020). Siting utility-scale solar and wind in Iowa: A guide for local governments. https://betterenergy.org/wp-content/uploads/2020/08/Solar_and_Wind_in_Iowa_Siting_Guide-1.pdf
[4] Center for Rural Affairs. (2020). Siting utility-scale solar and wind in Minnesota: A guide for local governments. https://betterenergy.org/wp-content/uploads/2020/08/Solar_and_Wind_in_Minnesota_Siting_Guide-1.pdf
[5] National Renewable Energy Laboratory. (2021). Land-based wind energy siting: A foundational and technical resource. https://docs.nrel.gov/docs/fy21osti/78591.pdf
[6] U.S. Department of Energy. (2021). Solar futures study. https://www.energy.gov/sites/default/files/202109/Solar%20Futures%20Study.pdf
[7] U.S. Department of Energy. (2015). Wind vision: A new era for wind power in the United States. https://www.energy.gov/sites/default/files/2015/03/f20/wv_full_report.pdf
[8] Argonne National Laboratory. (n.d.). Solar energy environmental considerations. https://solareis.anl.gov/guide/environment/
[9] Hassanpour Adeh, E., Selker, J. S., & Higgins, C. W. (2018). Remarkable agrivoltaic influence on soil moisture, micrometeorology and water-use efficiency. PloS one, 13(11), e0203256.
[10] Barron-Gafford, G. A., Pavao-Zuckerman, M. A., Minor, R. L., Sutter, L. F., Barnett-Moreno, I., Blackett, D. T., ... & Macknick, J. E. (2019). Agrivoltaics provide mutual benefits across the food–energy–water nexus in drylands. Nature Sustainability, 2(9), 848-855.
[11] Yavari, R., Zaliwciw, D., Cibin, R., & McPhillips, L. (2022). Minimizing environmental impacts of solar farms: a review of current science on landscape hydrology and guidance on stormwater management. Environmental Research: Infrastructure and Sustainability, 2(3), 032002.
[12] Wang, F., & Gao, J. (2023). How a photovoltaic panel impacts rainfall-runoff and soil erosion processes on slopes at the plot scale. Journal of Hydrology, 620, 129522.
[13] Liu, H., Wu, C., Yu, Y., Zhao, W., Liu, J., Yu, H., ... & Yetemen, O. (2023). Effect of solar farms on soil erosion in hilly environments: A modeling study from the perspective of hydrological connectivity. Water Resources Research, 59(12), e2023WR035067.
[14] Ma, B., Yang, J., Chen, X., Zhang, L., & Zeng, W. (2023). Revealing the ecological impact of low-speed mountain wind power on vegetation and soil erosion in South China: A case study of a typical wind farm in Yunnan. Journal of cleaner production, 419, 138020.
Created by Meilin Yang, April 2026
Key Questions
Will the project increase stormwater runoff?
Answer: It depends. [1][2][3][4][5]
Depends on: Vegetation cover, soil compaction, and stormwater management design.
Could construction increase soil erosion or sediment runoff?
Answer: Yes, temporarily. [4][5][6][7]
Depends on: Vegetation removal, exposed soils during construction, and erosion control measures.
Will the project affect groundwater recharge?
Answer: It depends. [1][2][3][4]
Depends on: Soil permeability, site compaction, and the amount of impervious or compacted surface.
Could nearby streams, wetlands, or surface waters be affected?
Answer: Sometimes. [4][5][6][7]
Depends on: Stormwater management, erosion control practices, and the proximity of water bodies to disturbed areas.
General Answer
In most renewable energy projects, potential effects on stormwater, drainage, groundwater, and nearby surface waters are primarily associated with site preparation and construction activities. [8][4][9] Work such as grading, trenching for underground cables, installing foundations or equipment pads, and building access roads can temporarily alter the land surface, changing how rainfall runs off, infiltrates, or is directed across the site [3][6][5]
However, the extent of these changes depends on project design, site conditions, and technology type [10][11] Many renewable energy facilities disturb only portions of the site, allowing vegetation and natural soil structure to remain or be restored after construction [10][11]
Maintaining vegetation cover, limiting soil compaction, and using appropriate layout and drainage design can preserve infiltration capacity and, in some cases, allow runoff to remain unchanged or even decrease compared to conventional development. [1][2][4]
Potential effects on stormwater flow, groundwater recharge, and nearby surface waters are therefore more strongly related to the location, extent, and management of ground disturbance than to the energy infrastructure itself. [8][10][11] Site layout, drainage design, erosion control practices, and post-construction vegetation management determine how water moves across the site over time [2][7]
Changes to stormwater flow, drainage patterns, and groundwater conditions are most commonly driven by construction and installation activities that alter surface permeability and flow pathways. [6][4] These types of impacts are not unique to renewable energy projects; similar effects are observed in residential and commercial development. In many cases, the intensity of disturbance per unit area is comparable to, or lower than, other forms of development, particularly where projects maintain permeable surfaces and vegetation cover.
Site grading and foundation construction can increase runoff by creating compacted or less permeable surfaces, while trenching and access roads may redirect or concentrate water flow [8][5] Soil compaction from heavy equipment reduces infiltration and increases surface runoff, with studies showing that compaction can reduce infiltration capacity by more than 50% in disturbed soils [3][4], though preserving or restoring vegetation can maintain infiltration and stabilize soils.
Similarly, linear features such as roads or trenches can increase runoff concentration and soil exposure, but careful layout and drainage design can limit these effects. [4][7] For example, maintaining vegetative cover, particularly with deep-rooted species, can significantly reduce erosion and runoff by improving soil structure and water infiltration. [4][12]
The overall impact depends on how disturbance is managed. As shown in Table 2.1, many impacts can be avoided or minimized through proactive planning measures such as site design, vegetation management, and erosion control practices. [2][9]
Impact What Causes It
Increased runoff
Soil compaction, grading
What Planners Can Do
Limit grading, preserve vegetation
Soil erosion Exposed soil during construction Require erosion control plans
Reduced infiltration Impervious surfaces
Drainage disruption Roads, trenches
Set permeability standards
Control layout & drainage design
Solar: Large site area with distributed runoff changes influenced by vegetation cover Solar energy facilities typically occupy large areas but involve limited ground disturbance per unit area. [10][4] Panels are supported by driven piles or shallow foundations, and most of the site remains permeable. Runoff outcomes depend strongly on site design: soil compaction and poor vegetation cover can increase runoff, while deep-rooted vegetation, adequate spacing between panel rows (“disconnection”), and minimal grading can maintain or even improve infiltration compared to pre-construction conditions [1][2][4][12] These effects are largely independent of pile depth and instead driven by surface soil conditions. [2]
Wind: Small surface footprint with localized drainage disturbance near turbine sites
Wind energy projects have a relatively small surface footprint but can create localized hydrologic impacts during construction. [8][9][13] Turbine foundations, crane pads, access roads, and cable trenches can compact soils and alter drainage pathways near each turbine [8][14]. Access roads are often the primary source of runoff changes, as they introduce compacted or semiimpervious surfaces and may redirect water flow. [8][13] However, because turbines are widely spaced, most surrounding land remains undisturbed, allowing natural infiltration and drainage processes to continue across the majority of the site [9][10][11]
Battery Energy Storage Systems (BESS): Compact facilities with concentrated runoff and drainage management
Battery energy storage systems (BESS) typically function similarly to other industrial facilities in terms of water impacts [7][15][16] BESS installations generally occupy compact sites with limited land disturbance, where infrastructure is concentrated within a defined facility footprint. As a result, any changes to runoff or infiltration are typically localized and managed using standard best management practices (BMPs) and stormwater pollution prevention plans (SWPPPs). [7][15][16][17] As a result, stormwater impacts are generally confined to the facility footprint and managed through standard stormwater control and permitting requirements. [7][15][17]
Stormwater and drainage impacts are primarily addressed through zoning, permitting, and environmental review processes. Local governments typically regulate site design, grading, vegetation management, and drainage through zoning and land use controls, including setbacks, land designations, and site plan requirements. Projects may also require stormwater management plans, erosion and sediment control plans, and compliance with state or federal permitting systems (e.g., NPDES, State Pollutant Discharge Elimination Systems (SPDES), or Construction General Permits for stormwater discharges).
Approval processes often involve both local and state levels, with local governments leading site-level decisions and state agencies providing additional certification or environmental review for larger projects. Public participation, including hearings and community input, is commonly required and can influence how stormwater and drainage issues are addressed in project design.
[1] National Renewable Energy Laboratory. (n.d.). PV-SMaRT: Solar photovoltaic stormwater management research and testing. https://www.nlr.gov/solar/market-research-analysis/pv-smart
[2] National Renewable Energy Laboratory. (2021). PV-SMaRT best practices for stormwater management at solar sites. https://a.storyblok.com/f/120093/x/e6555939eb/pv-smart-best-practice.pdf
[3] National Renewable Energy Laboratory. (2021). PV-SMaRT: Solar photovoltaic stormwater management research and testing (Technical report NREL/TP-7A40-78591) https://docs.nrel.gov/docs/fy21osti/78591.pdf
[4] Yavari, R., Zaliwciw, D., Cibin, R., & McPhillips, L. (2022). Minimizing environmental impacts of solar farms: a review of current science on landscape hydrology and guidance on stormwater management. Environmental Research: Infrastructure and Sustainability, 2(3), 032002.
[5] Wang, F., & Gao, J. (2023). How a photovoltaic panel impacts rainfall-runoff and soil erosion processes on slopes at the plot scale. Journal of Hydrology, 620, 129522.
[6] U.S. Environmental Protection Agency. (n.d.). Stormwater discharges from construction activities. https://www.epa.gov/npdes/stormwater-discharges-construction-activities
[7] U.S. Environmental Protection Agency. (2021). Developing your stormwater pollution prevention plan: A guide for industrial operators https://www.epa.gov/sites/default/files/202103/documents/swppp_guide_industrial_2021_030121.pdf
[8] National Renewable Energy Laboratory. (2009). Land-based wind energy siting: A developer’s guide (NREL/TP500-45834) https://docs.nrel.gov/docs/fy09osti/45834.pdf
[9] Nazir, M. S., Ali, N., Bilal, M., & Iqbal, H. M. (2020). Potential environmental impacts of wind energy development: A global perspective. Current Opinion in Environmental Science & Health, 13, 85-90.
[10] Center for Rural Affairs. (2020). Siting utility-scale solar and wind in Iowa: A guide for local governments. https://betterenergy.org/wp-content/uploads/2020/08/Solar_and_Wind_in_Iowa_Siting_Guide-1.pdf
[11] Center for Rural Affairs. (2020). Siting utility-scale solar and wind in Minnesota: A guide for local governments https://betterenergy.org/wp-content/uploads/2020/08/Solar_and_Wind_in_Minnesota_Siting_Guide1.pdf
[12] Liu, H., Wu, C., Yu, Y., Zhao, W., Liu, J., Yu, H., ... & Yetemen, O. (2023). Effect of solar farms on soil erosion in hilly environments: A modeling study from the perspective of hydrological connectivity. Water Resources Research, 59(12), e2023WR035067.
[13] Bošnjaković, M., Hrkać, F., Stoić, M., & Hradovi, I. (2024). Environmental impact of wind farms. Environments, 11(11), 257.
[14] Ma, B., Yang, J., Chen, X., Zhang, L., & Zeng, W. (2023). Revealing the ecological impact of low-speed mountain wind power on vegetation and soil erosion in South China: A case study of a typical wind farm in Yunnan. Journal of cleaner production, 419, 138020.
[15] U.S. Environmental Protection Agency. (n.d.). Industrial stormwater guidance https://www.epa.gov/npdes/industrial-stormwater-guidance
[16] U.S. Environmental Protection Agency. (2015). Multi-sector general permit (MSGP) monitoring guide. https://www.epa.gov/sites/default/files/2015-11/documents/msgp_monitoring_guide.pdf
[17] U.S. Environmental Protection Agency. (2015). MSGP frequently asked questions https://www.epa.gov/sites/default/files/2019-11/documents/msgp_q-a_sept2015.pdf
What chemicals are present on site, and how are spills, fires, or other emergencies prevented and managed?
Created by Meilin Yang, April 2026
Are hazardous chemicals stored on site?
Answer: Usually limited.[1][2]
Includes: Transformer oil, lubricants, coolants, and battery electrolytes, depending on the type of energy project.
Could chemical spills occur during construction or operation?
Answer: Sometimes. [2][3]
Sources: Fuels, oils, and maintenance fluids from equipment and vehicles.
How are spills prevented or contained?
Answer: Through standard containment and management practices. [3][4][5]
Measures: Spill prevention plans (SWPPP), and routine inspection.
Is there a risk of fire or explosion?
Answer: Generally low, but higher for battery systems. [1]
Drivers: Electrical faults, overheating, and thermal runaway in battery storage.
Could accidents affect nearby communities or the environment?
Answer: Unlikely in most cases. [4][6][7]
Controls: Site design, containment systems, and emergency response planning.
Renewable energy facilities may involve small quantities of fuels, lubricants, coolants, or other operational fluids used during construction, equipment operation, or maintenance. These materials are typically associated with construction equipment, electrical components, and battery systems. [1][2] As a result, projects generally include procedures and infrastructure designed to prevent chemical releases and manage potential spills or emergencies. [3][4]
In most cases, the quantities of chemicals present on site are relatively limited compared with many other industrial or energy facilities. Many renewable energy technologies operate primarily through electrical or mechanical systems and require only small amounts of operational fluids. [2]
Construction activities may involve temporary use of fuels or hydraulic fluids to power construction equipment, which are typically managed through standard safety practices. [3][4]
Potential risks related to spills, fires, or other emergencies are therefore usually associated with equipment handling, storage, and maintenance rather than the normal operation of the energy technology itself. [2][3] Facilities commonly implement spill prevention measures, containment systems, monitoring procedures, and emergency response plans to reduce risks and manage incidents if they occur. [4][5][6]
Potential chemical or safety risks at renewable energy sites are most commonly associated with equipment operation, maintenance activities, and construction practices. During construction, fuels, lubricants, hydraulic fluids, and other materials may be used to operate heavy equipment or install project infrastructure, and improper handling or equipment failure could result in localized spills. [2][3]
During project operation, some equipment components may contain fluids such as transformer oils, lubricants for mechanical parts, or cooling fluids for electrical systems. Battery energy storage systems may also contain battery electrolytes and related cooling or fire protection systems, which are typically stored within enclosed equipment designed to prevent leakage or environmental exposure. [1][2]
Fire or emergency risks may arise from electrical equipment, battery systems, or mechanical components if faults occur. Modern renewable energy facilities are typically designed with monitoring systems, automatic shutdown mechanisms, and fire suppression measures to manage these risks. [1][6] The likelihood and severity of potential incidents depend largely on equipment design, safety systems, operational procedures, and emergency response planning at the facility. [1][4]
Solar photovoltaic facilities generally involve very small amounts of chemicals during normal operation. Panels contain sealed materials and do not require fuels or fluids to generate electricity. [2] Limited quantities of lubricants, transformer oils, or cleaning materials may be used for equipment maintenance, and spill risks are typically associated with maintenance activities or
electrical equipment. [2][3] Fire risks are generally low and primarily related to electrical faults rather than chemical hazards. [1]
Wind: Mechanical systems using lubricants and hydraulic fluids
Wind turbines contain mechanical components such as gearboxes, bearings, and hydraulic systems that require lubricants and hydraulic fluids. These materials are typically contained within sealed nacelles at the top of turbine towers. [2] Maintenance activities may involve servicing or replacing these fluids, and while spills are uncommon, equipment failures or maintenance activities could create localized risks. [2][3] These risks are typically managed through standard containment and maintenance procedures. [3]
Battery Energy Storage Systems (BESS): Systems with dedicated safety controls
Battery energy storage systems contain battery modules, electrical equipment, and cooling systems within enclosed containers or buildings. These systems may involve battery electrolytes and related materials. [1] Because batteries store large amounts of energy, BESS facilities typically include monitoring systems, thermal management, and fire suppression systems designed to detect abnormal conditions and manage potential fire or system failures. [1][6] As a result, risks are more closely associated with system failures or abnormal conditions than routine operation. [1]
Risks related to chemicals, spills, and emergencies are primarily addressed through permitting, site plan review, and compliance with environmental and safety regulations. Local governments can require spill prevention measures, and clear procedures for handling fuels, oils, and other materials as part of project approval. [3][4]
Planners typically rely on established regulatory frameworks, such as stormwater and industrial permitting programs, which require spill prevention and control plans (e.g., SWPPP) and regular inspection and monitoring. These tools help ensure that materials are properly stored, handled, and contained, and that any releases are quickly identified and addressed. [4][5][6]
At the site level, planners can prioritize safe equipment layout, adequate setbacks, and access for emergency response. Clear requirements for monitoring, maintenance, and emergency response planning are especially important for managing risks associated with battery systems and other critical equipment. [1][6][7]
[1] Pacific Northwest National Laboratory. (2023). Energy storage safety strategic plan and roadmap (PNNL36330). https://www.pnnl.gov/main/publications/external/technical_reports/PNNL-36330.pdf
[2] National Renewable Energy Laboratory. (2009). Land-based wind energy siting: A developer’s guide (NREL/TP-500-45834). https://docs.nrel.gov/docs/fy09osti/45834.pdf
[3] U.S. Environmental Protection Agency. (n.d.). Stormwater discharges from construction activities. https://www.epa.gov/npdes/stormwater-discharges-construction-activities
[4] U.S. Environmental Protection Agency. (2021). Developing your stormwater pollution prevention plan: A guide for industrial operators https://www.epa.gov/sites/default/files/202103/documents/swppp_guide_industrial_2021_030121.pdf
[5] U.S. Environmental Protection Agency. (n.d.). Industrial stormwater guidance https://www.epa.gov/npdes/industrial-stormwater-guidance
[6] U.S. Environmental Protection Agency. (2015). Multi-sector general permit (MSGP) monitoring guide https://www.epa.gov/sites/default/files/2015-11/documents/msgp_monitoring_guide.pdf
[7] U.S. Environmental Protection Agency. (2015). MSGP frequently asked questions https://www.epa.gov/sites/default/files/2019-11/documents/msgp_q-a_sept2015.pdf
Created by Meilin Yang, April 2026
Key Questions
Do renewable energy projects have cumulative impacts at the watershed scale?
Answer: Sometimes. [1][2][3]
Depends on: Project density, spatial distribution, and watershed characteristics.
Could renewable energy development change watershed-scale runoff?
Answer: It depends. [1][4][5]
Drivers: Land disturbance, vegetation cover, and stormwater management.
Could projects affect downstream streams, wetlands, or lakes?
Answer: Sometimes. [1][2][5]
Pathways: Sediment transport, altered drainage, and surface flow connectivity.
What factors influence cumulative watershed impacts?
Answer: Several factors. [1][2][3][6]
Includes: Project scale, siting patterns, hydrological connectivity, and mitigation measures.
General Answer
Renewable energy projects typically affect land and water conditions at the site scale, with most environmental changes occurring within project boundaries. [1][4] Construction activities such as grading, trenching, and infrastructure installation can temporarily alter soil conditions, vegetation cover, and local drainage patterns, influencing how rainfall is distributed, infiltrated, or conveyed across the site. [1][4]
However, water systems operate at a broader spatial scale, where runoff, sediment transport, and hydrological processes are shaped by conditions across entire watersheds. [1][2] As a result, potential impacts at the watershed scale are more closely associated with the combined influence of multiple projects within the same drainage area. [1][3]
In many cases, renewable energy facilities disturb only a portion of the land within a project site, and vegetation or permeable surfaces are retained across large areas. [1][4] Because of this, hydrologic effects are often localized and manageable at the individual project level. [1][4]
Potential watershed-scale impacts therefore depend primarily on the density, distribution, and cumulative extent of development rather than on any single facility. [1][3][6]
Potential cumulative impacts on watershed systems arise when multiple land disturbances occur within the same drainage area. [1][3] Construction activities associated with renewable energy development such as soil disturbance, vegetation removal, and modification of surface drainage can alter runoff generation and sediment transport at the site scale. [1][4]
When similar disturbances occur across multiple sites within a watershed, their combined effects may influence runoff patterns, sediment movement, and hydrological connectivity at a broader scale. [1][2] In particular, increased connectivity between disturbed areas and drainage networks can amplify the movement of water and sediment beyond individual project boundaries. [2]
Changes to runoff and sediment transport are the primary mechanisms through which cumulative impacts may occur. [5] Disturbed soils are more susceptible to erosion until vegetation is reestablished, and concurrent construction across multiple sites may temporarily increase sediment loads or alter flow conditions within the watershed. [1][5]
However, these effects are often mitigated through stormwater management practices, erosion control measures, and vegetation restoration. [4][7][8] Such practices are designed to maintain infiltration, reduce runoff velocity, and limit sediment transport, helping to prevent impacts from extending beyond the project scale. [1][4]
Solar: Larger areas with distributed disturbance
Solar energy facilities often occupy relatively large land areas, but disturbance is typically partial and distributed. [1][4] Infrastructure is installed close to the ground surface, and vegetation is often maintained or restored between panel rows. [1][4] As a result, hydrologic changes are generally diffuse and moderated by remaining vegetation and soil infiltration capacity. [1]
Wind: Small footprint with dispersed disturbance
Wind energy projects have a relatively small surface footprint, with disturbance concentrated at turbine foundations, access roads, and underground connections. [3][7][8] Large areas between turbines typically remain in existing land uses such as agriculture or grazing. [7][8] Because of this
dispersed pattern, wind projects generally have limited influence on watershed-scale hydrologic conditions. [3]
Battery energy storage systems are typically located on compact sites where infrastructure is concentrated within a defined footprint. [7][8] Land disturbance is spatially limited, and potential watershed-scale effects are generally minimal and managed through standard stormwater and site design practices. [7][8]
Cumulative and watershed-scale impacts are primarily addressed through regional planning, permitting, and stormwater management requirements. [7][8] While individual projects are reviewed at the site level, planners can consider how multiple projects within the same watershed may interact, particularly in areas with high development pressure. [7][8]
Tools such as stormwater management plans, erosion and sediment control requirements, and phased construction can help limit the extent and timing of disturbance across a watershed. [1][5] Coordinating project siting, minimizing overlapping construction activities, and maintaining vegetation cover are key strategies for reducing cumulative impacts. [1][4]
At a broader scale, planners can incorporate watershed-based approaches by evaluating project density, preserving natural drainage systems, and prioritizing low-impact site design. [5][7] These approaches help ensure that localized disturbances do not translate into larger-scale changes in runoff, sediment transport, or downstream water systems. [1][3]
[1] Yavari, R., Zaliwciw, D., Cibin, R., & McPhillips, L. (2022). Minimizing environmental impacts of solar farms: a review of current science on landscape hydrology and guidance on stormwater management. Environmental Research: Infrastructure and Sustainability, 2(3), 032002
[2] Liu, H., Wu, C., Yu, Y., Zhao, W., Liu, J., Yu, H., ... & Yetemen, O. (2023). Effect of solar farms on soil erosion in hilly environments: A modeling study from the perspective of hydrological connectivity. Water Resources Research, 59(12), e2023WR035067.
[3] Trainor, A. M., McDonald, R. I., & Fargione, J. (2016). Energy sprawl is the largest driver of land use change in the United States. PloS one, 11(9), e0162269.
[4] National Renewable Energy Laboratory. (2021). PV-SMaRT best practices for stormwater management at solar sites https://a.storyblok.com/f/120093/x/e6555939eb/pv-smart-best-practice.pdf
[5] Lee, S. (2019). Erosion and Storm Water Runoff: sPower Solar Farm Project: Watershed Environmental Analysis. https://scholarship.richmond.edu/geography-capstone/48/
[6] U.S. Department of Energy. (2021). Solar futures study. https://www.energy.gov/sites/default/files/202109/Solar%20Futures%20Study.pdf
[7] Center for Rural Affairs. (2020). Siting utility-scale solar and wind in Iowa: A guide for local governments https://betterenergy.org/wp-content/uploads/2020/08/Solar_and_Wind_in_Iowa_Siting_Guide-1.pdf
[8] Center for Rural Affairs. (2020). Siting utility-scale solar and wind in Minnesota: A guide for local governments. https://betterenergy.org/wp-content/uploads/2020/08/Solar_and_Wind_in_Minnesota_Siting_Guide-1.pdf
Author : Subah Iqbal
Utility-scale wind projects alter landscape character through height, consistent form and motion, and nighttime aviation lighting. Visual impact is not determined solely by whether turbines are visible, but by how they contrast with the existing landscape, how many are seen, from what distance, and under what lighting conditions. This fact sheet outlines how wind projects may change the look and feel of a community and how those changes can be evaluated and mitigated.
Turbine Height, Scale, and Motion
Wind turbines introduce tall, regularly spaced vertical forms into predominantly horizontal landscapes. Blade rotation adds movement, which increases visual attention even when turbines are not physically dominant.
Visual impact depends on¹:
Contrast against open sky versus forested or visually complex backdrops
Number of turbines visible
Viewer distance
Landscape sensitivity
(e.g., scenic value, landscape character, and existing development context)
How far are turbines visible?
The Wind Visual Impact Threshold Distances (WindVITD) framework provides useful reference bands for how turbines tend to be perceived ¹:
Visible to the unaided eye: > 36 miles under optimal conditions
Likely noticed by casual observers: > 23 miles
Distance where turbines become visually dominant (~10 miles): Turbines may draw and hold visual attention and become a dominant feature in the landscape
Aviation Lighting and Sense of Place
Aviation obstruction lighting is required for tall structures such as wind turbines to ensure aircraft safety, typically regulated by the Federal Aviation Administration (FAA). While these systems are designed for aviation safety, they can signi cantly alter how landscapes are experienced at night, particularly in rural or dark-sky settings.
A wind turbine’s aviation obstruction lighting can signi cantly alter nighttime landscape character, particularly in rural or dark-sky settings, and has been identi ed as one of the most frequently reported visual concerns by nearby residents.¹ Even small red ashing lights can increase the perception of industrialization, reduce perceived darkness, a ect night-sky quality, and change the rural character of an area.
Scotland’s Nature Agency guidance emphasizes that nighttime e ects must be assessed independently, and that daytime ndings cannot simply be assumed to carry over.2 Aviation obstruction lighting is designed for safety but can introduce visible light into otherwise dark landscapes. For observers on the ground, the brightness, frequency, and timing of these lights can significantly influence how wind projects are perceived at night. ³

Aviation lighting assessments for visual impact note: “Worst-case” photomontages may use maximum emitted intensity3
Apparent brightness varies with distance, angle, and atmospheric conditions3
For observers on the ground, the most perceptually sensitive period is dusk and dawn, when both landform and lighting are visible simultaneously³
Full darkness produces a di erent visual experience than transitional twilight conditions.
Aircraft Detection Lighting Systems (ADLS) reduce visual impacts by keeping turbine lights o and activating them only when aircraft are nearby. These systems typically rely on radar or transponder-based technology installed around the wind facility to detect approaching aircraft. Under FAA guidance, turbine lights are activated only when an aircraft enters the surrounding airspace, generally within about 3 nautical miles of the project and below approximately 1,000 feet above the tallest turbine.4
By limiting when lights are turned on, ADLS signi cantly reduces nighttime visual presence and minimizes continuous ashing experienced by nearby communities. While not required in all projects, ADLS is increasingly used in the U.S. to reduce community concerns related to continuous nighttime lighting.
Continuous lighting (lights blinking)
ADLS normal state (o ) No visible lights until aircraft detected
(“VIEWSHED STACKING”)
Wind development often occurs in areas where multiple projects are present or proposed. As a result, visual impact is not limited to a single project, but to how multiple projects are experienced together within the same view.
Research on wind energy acceptance has shown that visual impacts, including the number and arrangement of turbines, are a key factor in how communities perceive projects.5
Cumulative visual impact considers how multiple wind projects appear together within the same landscape, rather than evaluating each project in isolation. Key factors include the number of turbines visible within a single view, whether turbines overlap or break the skyline, and the horizontal extent they occupy across the field of view Together, these factors can increase visual complexity and perceived prominence, even when individual turbines may not be visually dominant on their own.
Cumulative Zone of Theoretical Visibility (ZTV) mapping shows where multiple wind projects may be visible at the same time, identifying areas of overlapping visibility across developments. ZTV analysis typically begins with a bare-ground model and may incorporate additional layers, such as vegetation and buildings, to better re ect real-world conditions. As more projects are included, cumulative ZTV complexity increases, making visual impact assessment and interpretation more challenging for planners and decision-makers.2
However, visibility alone does not determine visual impact. Cumulative visual impact also depends on how multiple projects are experienced within the same view. This includes the number of turbines visible against the skyline, the horizontal eld of view they occupy, the degree of overlap between projects, and whether turbines appear clustered or scattered.2
To support consistent evaluation, cumulative impacts are often assessed using the same viewpoints across di erent scenarios. This includes comparing baseline (existing conditions), individual projects, and combined project scenarios to understand how visual conditions change over time.
Visual impacts can be reduced through careful siting, con guration, and lighting strategies. Research on wind energy landscapes emphasizes that visual impact is strongly in uenced by skyline interaction, visual order, and the overall coherence of turbine layouts.6
Developers can reduce visual impacts by siting turbines to minimize skyline disruption and avoid sensitive viewing areas. Turbines on ridgelines often break the horizon and increase visual contrast, making them more prominent over long distances. Projects should be placed where turbines remain below the skyline from key vantage points and outside the approximate 10-mile preeminence zone to reduce visual dominance.¹
4.2
The arrangement of turbines strongly in uences how projects are perceived. Visual impact is reduced when turbines are organized into coherent, legible patterns rather than scattered across the landscape. Consistent spacing, uniform turbine size, and alignment help maintain visual order and allow the eye to read the project as a single composition rather than a collection of unrelated elements.6
In contrast, irregular spacing, variation in turbine size, or expansion across multiple ridgelines can create visual clutter and increase perceived complexity. Clustering turbines into distinct groupings and limiting horizontal spread can help reduce this e ect and improve overall landscape integration.
4.3
Lighting and turbine visibility at night can signi cantly in uence how projects are experienced. Continuous aviation lighting can introduce a sense of industrialization into otherwise dark landscapes, particularly in rural or low-light environments.
Mitigation strategies such as Aircraft Detection Lighting Systems (ADLS) reduce these impacts by keeping lights o under normal conditions and activating them only when aircraft are detected nearby.4 Additional measures, including synchronized ashing and dimming where permitted, can further reduce perceived visual clutter and improve nighttime landscape quality.
5.1 Viewshed (ZTV) Mapping
Zone of Theoretical Visibility (ZTV) mapping is used as a screening tool to identify where turbines may be visible across the landscape. ZTV outputs are typically presented as maps showing areas of potential visibility based on terrain.
However, visibility alone does not determine visual impact. ZTV does not account for factors such as distance, atmospheric conditions, vegetation, or how turbines are perceived within the landscape.2
5.2 Wirelines
Wirelines are simpli ed visualizations that show the outline of turbines from a speci c viewpoint, without textures or color. They are used to test turbine height, scale, and skyline interaction within the landscape. Because they clearly show geometry and positioning, wirelines are particularly useful for evaluating cumulative e ects and understanding how multiple projects may appear within a single view.2
Photomontages simulate realistic views of wind projects by inserting turbines into photographs from selected viewpoints. These visualizations must follow standardized camera and projection methods to ensure accuracy. Night simulations may incorporate aviation lighting and mitigation measures such as ADLS or dimming. However, static images cannot fully represent turbine motion or changing atmospheric conditions.3
Wireline (geometry and skyline interaction)
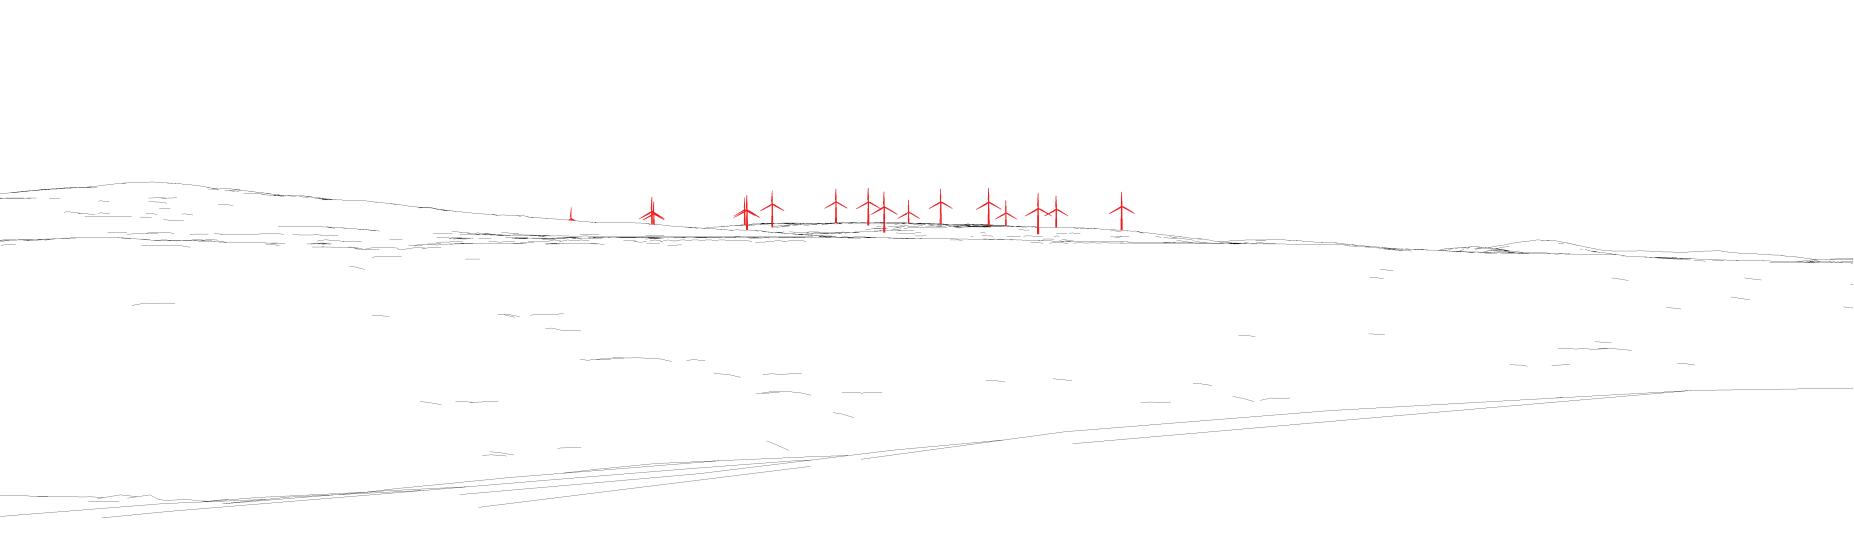
Photomontage (simulated visual impact)
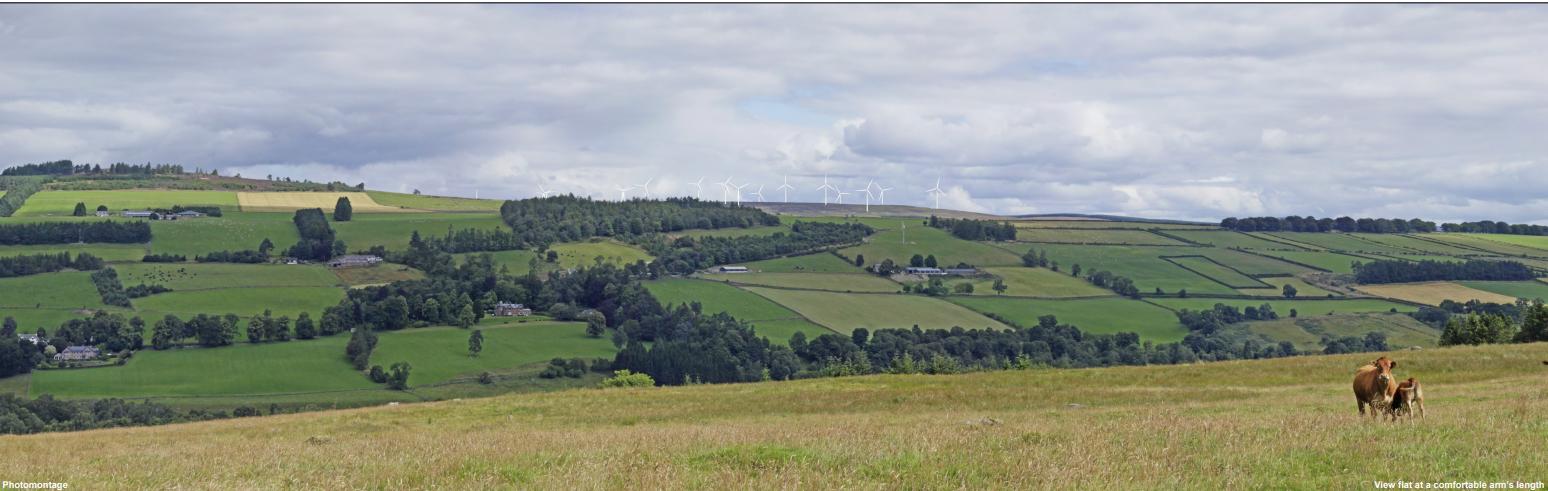
Proactive planning can help identify and address visual concerns early, rather than reacting to community opposition after project proposals are introduced.
Visual impacts are not xed. They can be shaped through planning decisions, project design, and the tools used to evaluate them.
During Project Review :
Identify sensitive viewpoints, including residential areas, scenic corridors, and culturally signi cant landscapes
Use ZTV mapping to understand where turbines may be visible, and photomontages to assess how they will appear
Evaluate both daytime and nighttime conditions, particularly where dark-sky character is valued
Engage communities early through public meetings, visual simulations, and clear communication about potential visual changes
In siting and design decisions:
Avoid ridgelines and skyline breaks where turbines would become highly prominent
Encourage clustering and coherent layout patterns to reduce visual sprawl
For mitigation and project conditions:
Limit lighting to what is required under FAA standards and encourage applicants to include Aircraft Detection Lighting Systems (ADLS) where feasible
Encourage synchronized ashing and dimming strategies where permitted
Evaluate cumulative impacts by assessing how multiple projects may appear together in the same viewshed
Field veri cation is used to compare modeled results with real-world conditions. Scotland’s Nature Agency’s guidance emphasizes that the most reliable understanding of visual impact comes from viewing landscapes at the actual viewpoint and scale.2
In addition to standard methods, planners may incorporate advanced 3D visualization tools to improve public understanding and decision-making.
Use computer programs such as Rhino and Enscape work ows to model terrain, turbine placement, and lighting conditions
Test multiple siting scenarios, including ridgeline placement and cumulative layouts
Use Virtual Reality or immersive visualization to communicate scale and visibility to non-expert audiences
Architectural research on view quality, occupant perception, and well-being suggests that visual experience is in uenced by factors such as content, clarity, and contextual conditions, rather than visibility alone.7 These concepts can help inform how visual impacts from energy infrastructure are experienced from speci c viewpoints. These tools should be used as supplemental methods, supporting, not replacing, standardized photomontages and eld-based assessment.
International guidance is often referenced due to the limited availability of standardized U.S. visual assessment frameworks.
Bureau of Land Management. (2013). Wind Visual Impact Threshold Distances (WindVITD). U.S. Department of the Interior.
https://blmwyomingvisual.anl.gov/docs/WindVITD.pdf
NatureScot. (2017). Visual Representation of Wind Farms: Guidance.
https://www.nature.scot/doc/visual-representation-wind-farms-guidance
Landscape Institute. (2019). Landscape and Visual Impact Assessment, Technical Appendix 5.2: Aviation Lighting Night-Time Impact Assessment.
https://projects.statkraft.co.uk/globalassets/0/.uk/0--projects/wind/appin/planning-application-documents/volume-4/volume-4---te chnical-appendix-5.2---aviation-lighting-night-time-impact-assessment.pdf
Federal Aviation Administration. (2024). Advisory Circular 70/7460-1M Change 1: Obstruction Marking and Lighting.
https://www.faa.gov/documentLibrary/media/Advisory_Circular/AC_70-7460-1M_Change_1.pdf
Rand, J. (2017). Thirty Years of North American Wind Energy Acceptance. Energy Research & Social Science.
https://www.sciencedirect.com/science/article/pii/S2214629617301275
Pasqualetti, M., Gipe, P., & Righter, R. (2002). Wind Power in View: Energy Landscapes in a Crowded World. Academic Press.
https://books.google.com/books/about/Wind_Power_in_View.html?id=ppoYj2YNR98C
Ko, W. H., et al. (2022). Window View Quality: Why It Matters and What We Should Do. LEUKOS.
https://www.tandfonline.com/doi/epdf/10.1080/15502724.2022.2055428?needAccess=true
Author : Subah Iqbal
Utility-scale solar energy projects can signi cantly alter landscape character through their scale, surface coverage, and re ective materials. Unlike wind turbines, which introduce vertical movement, solar facilities are experienced as expansive, ground-oriented developments that reshape how land is visually organized and perceived. Visual impact is not determined solely by whether solar panels are visible, but by how they contrast with the surrounding landscape, how much of the view they occupy, and how they are experienced from speci c viewpoints.¹ This fact sheet outlines how solar development may a ect visual quality and how those impacts can be evaluated and mitigated.
Scale, Surface Coverage and Visual Contrast
Utility-scale solar facilities are characterized by large spatial footprints, continuous surface coverage, and highly geometric panel arrangements. These features can introduce strong visual contrast with surrounding landscapes, particularly in rural or natural settings. Solar development is often perceived as a transformation of land use, replacing vegetated or agricultural surfaces with uniform, engineered elds.¹
Visual impact is in uenced not only by whether solar arrays are visible, but by their scale, pattern, and degree of integration with the surrounding landscape. Larger installations and those that contrast strongly with existing land cover tend to be perceived as more visually prominent.2
Brightness, Viewing Angle and Projections
Solar panels are designed to absorb sunlight, but a portion of incoming radiation is re ected. Under certain conditions, this re ected light can produce glare that is visible to nearby observers.
Glare is not constant. Its intensity and visibility depend on panel tilt, sun angle, and viewer position. As a result, glare typically occurs during speci c times of day and seasons, rather than continuously.
The potential for glare is also shaped by surrounding context. Viewing angle, distance, and existing land cover in uence whether re ected light is noticeable or disruptive to receptors such as nearby residents, road users, or aviation corridors.¹
Site Boundaries and Supporting Infrastructure
Solar facilities introduce additional visual elements beyond panel arrays, including fencing, access roads, inverter stations, and associated infrastructure. These features contribute to the overall perception of industrialization and can increase visual contrast with surrounding land uses.¹
Edge conditions are particularly important in shaping how solar development is experienced. Abrupt transitions between solar arrays and adjacent landscapes can heighten visual contrast, while more gradual transitions, such as vegetation bu ers or integration with existing land patterns, can reduce perceived impact.2
Multiple Facilities and Landscape-Scale Change
Visual impact is not determined solely by individual solar installations, but by how multiple facilities are experienced within the same landscape. As more projects are developed, cumulative visibility can increase visual complexity and alter overall landscape character, even when individual facilities are not dominant.2
Cumulative impact depends on the extent of landscape occupied, the distribution of facilities, and how they are perceived together within a single eld of view. This includes the proportion of the view occupied and the degree to which installations appear cohesive or fragmented.3
Temporal Visibility and Research Gaps
Solar facilities are primarily experienced during daytime conditions, as their visibility depends on sunlight and surface re ectivity. Unlike wind energy infrastructure, solar projects do not introduce aviation lighting and therefore have limited nighttime visibility.
However, co-located battery energy storage systems (BESS) introduce additional built infrastructure, including battery enclosures, inverters, and control equipment. These elements may contribute modest visual presence regardless of time of day and can include features such as security lighting or industrial structures that persist beyond daylight hours.6
While BESS typically has a smaller visual footprint than generation infrastructure, existing research on its visual impacts remains limited, particularly in relation to nighttime landscape character.
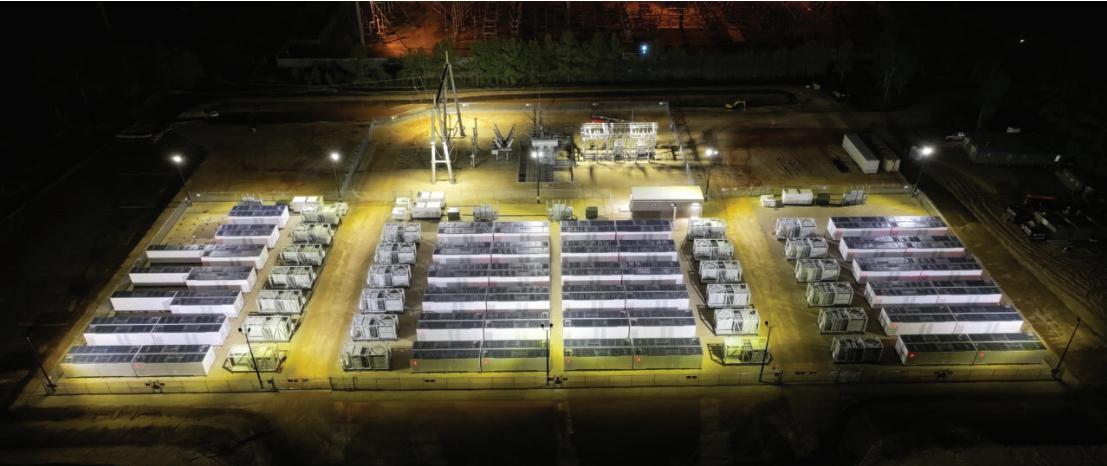
Visual assessment of solar and BESS development relies on a combination of analytical and representational tools. Zone of Theoretical Visibility (ZTV) mapping is commonly used to identify where facilities may be visible across the landscape. However, visibility alone does not determine visual impact, as it does not account for perceptual or contextual factors.²
Photomontages provide more realistic representations by inserting solar infrastructure into photographs from selected viewpoints, allowing viewers to understand how projects may appear in real-world conditions. These visualizations must follow standardized methods to ensure accuracy.²
Field veri cation remains essential for understanding actual visual experience, allowing planners to assess how solar and BESS infrastructure is perceived at true scale.²
In addition to eld observations and photomontages, planners may use advanced visualization tools to assess how solar and BESS facilities are perceived under di erent lighting conditions. Solar glare simulators (e.g., glint and glare analysis tools used for rooftop and utility-scale PV7) model the path of re ected sunlight from panel surfaces toward speci c receptors, helping identify when and where glare may occur based on panel tilt, sun angle, and viewer position.
These tools can evaluate seasonal and hourly variation in glare conditions, supporting more informed siting and design decisions. Combined with 3D modeling work ows (e.g., Rhino + Enscape), solar path analysis, and visibility assessments from sensitive viewpoints, they allow planners to test scenarios and communicate potential impacts to non-expert audiences.
As with wind energy, these methods are most e ective when used as complementary tools alongside standardized photomontages and eld-based assessment.
Visual impacts from solar and BESS development are shaped not only by physical characteristics, but by planning decisions related to siting, layout, and evaluation methods. While these impacts cannot be fully eliminated, they can be reduced through the following considerations :
During Project Review :
Identify sensitive viewpoints, including residential areas, scenic corridors, and culturally signi cant landscapes
Use ZTV mapping to understand where solar facilities may be visible across the landscape
Use photomontages to assess how projects will appear from representative viewpoints
Evaluate both daytime conditions (visibility, contrast) and time-dependent e ects such as glare at sensitive receptors
In siting and design decisions:
Identify sensitive viewpoints, including residential areas, scenic corridors, and culturally signi cant landscapes
Use ZTV mapping to understand where solar facilities may be visible across the landscape
Use photomontages to assess how projects will appear from representative viewpoints
Evaluate both daytime conditions (visibility, contrast) and time-dependent e ects such as glare at sensitive receptors
For mitigation and project conditions:
Limit glare impacts at sensitive receptors through siting, orientation, and design adjustments
Encourage screening, bu ering, and layout strategies that reduce visibility from key viewpoints
Consider exible conditions for BESS-related lighting to minimize nighttime visibility
Encourage applicants to demonstrate visual outcomes using consistent viewpoints and standardized methods
Evaluate cumulative visual impacts by assessing how multiple projects may appear together within the same landscape
Sullivan, R., & Abplanalp, J. (2013). Utility-Scale Solar Energy Facility Visual Impact Characterization and Mitigation Study. Argonne National Laboratory, U.S. Department of Energy. https://www.anl.gov https://blmwyomingvisual.anl.gov/docs/SolarVisualCharacteristicsMitigation_Final.pdf
Rodrigues, M., Montañés, C., & Fueyo, N. Assessment of Visual Impact of Renewable Energy Facilities. https://www.sciencedirect.com/science/article/pii/S0195925509001280
Sánchez-Pantoja, N., et al. (2018). Aesthetic Impact of Solar Energy Systems. Renewable and Sustainable Energy Reviews.
https://www.sciencedirect.com/science/article/pii/S1364032118306695
Hidalgo-León, R., et al. (2017). Battery Energy Storage Systems Overview. https://www.scribd.com/document/917084173/Hidalgo-Leon2017-BESS
Filho, A. V. M. L., et al. (2023). PV + BESS Systems Study. https://www.mdpi.com/2032-6653/16/3/147
Business Wire. (2023). Key Capture Energy 100MW BESS Facility in Texas. https://www.energy-storage.news/key-capture-energy-begins-operations-for-100mw-texas-bess/ Wu, B. (2025). Best Glint and Glare Simulators for Rooftop PV. Anernstore. https://www.anernstore.com/blogs/diy-solar-guides/glint-glare-simulator-rooftop-pv
Author : Subah Iqbal
Wind turbines operate in a wide range of environmental conditions, including cold climates where ice can accumulate on turbine blades. In some cases, turbines may also experience rare mechanical failures such as blade damage or detachment. These events raise important questions about public safety, setback distances, and how risks are managed in planning and permitting. Although these risks are generally low, they are not zero. As a result, modern wind energy projects rely on a combination of engineering design, operational controls, and risk-based planning approaches to minimize potential impacts to nearby people and infrastructure.1
Ice can accumulate on turbine blades during cold weather conditions and may later fall or be projected outward.
Ice shedding occurs when ice falls from stationary or slowly rotating blades.
Ice throw occurs when turbines are operating, and rotating blades project ice outward due to centrifugal force and wind conditions.2
The distance ice can travel depends on several factors, including turbine size, blade tip speed, wind conditions, and the shape of the ice. Observed ice fragments are often found within approximately 100 meters, but modeling studies used for risk assessment can estimate distances of several hundred meters under certain conditions.³
Because ice throw distances vary, setback requirements are not always based on a single xed number. Instead, two general approaches are used4:
Conservative setbacks based on xed distances and signage
Risk-based approaches that map safety zones based on acceptable levels of risk
Risk-based models (such as IceRisk) produce spatial “safety zones” that re ect di erent levels of exposure, such as areas for workers, roads, or public access.3
For example, one modeled case identi ed a “critical distance” of approximately 220 meters, beyond which risk becomes negligible under most conditions.4
Modern turbines use a combination of detection systems and operational controls to reduce risks from icing.
Detection Methods
Ultrasonic ice sensors detect changes in vibration frequency caused by ice accumulation6
Power curve monitoring identi es unexpected drops in performance6
Comparisons between heated and unheated anemometers to identify icing conditions6
Detection reliability can vary, and delays may result in temporary power losses before mitigation systems activate.7 When icing conditions are detected, turbines typically trigger one or more operational controls to reduce risk and protect equipment.
Turbines may be shut down or curtailed during icing conditions6
Access to turbine areas may be restricted through signage or barriers6
Operational protocols guide sta responses during icing events6
Blade heating systems may be used in some cases, although cost can limit widespread adoption6
Major mechanical failures, such as blade detachment, are rare in modern wind turbines. Advances in design, manufacturing, and certi cation have signi cantly reduced failure rates compared to earlier generations.1
When failures do occur, damaged components are more likely to remain attached rather than fully separating.1
Common contributing factors include1:
Control system interference or overspeed conditions
Lightning strikes
Manufacturing defects
Modern turbines are designed with redundant safety systems, including independent braking systems and pitch control mechanisms, to prevent uncontrolled rotor motion.9
Safety zones for wind turbines are increasingly de ned using probabilistic risk assessment methods.3
Risk-based models generate probability contours for fragment travel
Zones are linked to acceptable risk thresholds for di erent activities
Safety distances may vary for pedestrians, workers, and vehicle occupants
Example risk-based zones may include:
Inner zones (higher restriction)
Middle zones (moderate exposure, e.g., roads)
Outer zones (negligible risk)¹0
These approaches align with the principle that wind energy projects should not signi cantly increase public risk above everyday background levels.²
Apply setbacks based on risk modeling rather than xed rules
Consider land use intensity (e.g., low vs high public activity areas)
Limit access in higher-risk zones
During Project Review : For mitigation and project conditions:
Require site-speci c risk assessments for icing and blade failure
Identify proximity to roads, trails, and public access areas
Evaluate turbine size, tip speed, and local climate conditions
Require operational controls for icing conditions
Ensure signage and public awareness measures are in place
Encourage monitoring and adaptive management strategies
Garrad Hassan Canada Inc. (for CanWEA). (2007). Recommendations for Risk Assessments of Ice Throw and Blade Failure in Ontario.
https://voute.bape.gouv.qc.ca/dl/?id=00000389388
Biswas, R., Taylor, J., & Salmon, J. (2012). A Model of Ice Throw Trajectories from Wind Turbines. Wind Energy.
https://onlinelibrary.wiley.com/doi/epdf/10.1002/we.519
Bredesen, R. E., & Ausland, L. (2012). Methods for Evaluating Risk Caused by Ice Throw and Ice Fall (IceRisk methodology). Kjeller Vindteknikk / Lloyd’s Register.
https://windren.se/IWAIS_p/IWAIS2015/IWAIS2015_pa/38_13_03_Paper_Bredesen_Methods_for_evaluating_risk_caused_by_ice _throw_and_ice_fall_from_wind_turbines_and_other_tall_structures.pdf
Rogers, A. L., Slegers, N., & Costello, M. (2012). A Method for De ning Wind Turbine Setback Standards. Wind Energy.
https://onlinelibrary.wiley.com/doi/epdf/10.1002/we.468
Parent, O., & Ilinca, A. (2011). Anti-icing and De-icing Techniques for Wind Turbines: Critical Review. Cold Regions Science and Technology.
https://www.sciencedirect.com/science/article/pii/S0165232X10000108
Author : Subah Iqbal
Wind turbines are tall structures with rotating blades that can interact with aviation systems, radar networks, and telecommunications infrastructure. These interactions occur in two primary ways: through physical obstruction of airspace, and through electromagnetic e ects on radar and signal-based systems. Physical impacts arise because turbines extend into navigable airspace because turbines extend into navigable airspace and may a ect airport approach or departure surfaces. As a result, proposed wind energy projects are typically evaluated through aviation obstruction review processes to ensure safe aircraft operations. At the same time, rotating turbine blades can re ect radar signals and produce Doppler returns that radar systems may interpret as moving objects1. Depending on turbine location, terrain, and radar type, these e ects can create clutter, false targets, or reduced detection capability.1 Because these interactions are highly dependent on site-speci c conditions, they are typically assessed during project planning and permitting.
Wind turbine impacts on aviation and radar systems are not uniform and cannot be evaluated based on visibility alone. Instead, they depend on a combination of factors including turbine height, blade movement, terrain conditions, radar sensitivity, and line-of-sight relationships between turbines and surrounding infrastructure.
Radar systems, for example, may detect turbine re ections at considerable distances, particularly when turbines are located within direct line-of-sight of the radar beam.1 Similarly, turbines located near airports or navigation aids may require additional review2 to ensure that they do not interfere with ight paths or signal reliability.1
Because of these complexities, aviation and radar impacts are typically evaluated on a case-by-case basis3, with coordination between developers, planners, and relevant regulatory agencies.
Wind turbines can a ect multiple aviation and communication systems depending on their location and surrounding infrastructure. These impacts vary by system type and are typically evaluated through a combination of aviation review, radar assessment, and project-speci c analysis.3
System
Aircraft airspace Physical obstruction
Navigation aids (VOR / ILS)
Air
Weather
Military
Signal re ection or distortion
Radar clutter or false targets
Clutter or beam blockage
Reduced surveillance performance
FAA obstruction evaluation
Aviation safeguarding review
Radar impact study
Radar coordination
Defense consultation
Adjust turbine height/location
Setbacks from navigation aids
Layout optimization
Siting outside radar beam
Project-speci c modeling
Radar impacts are strongly in uenced by line-of-sight conditions between turbines and radar systems. When turbines are located within the radar beam1, they can re ect signals back to the radar receiver and create areas of shadowing5 behind them where detection performance may be reduced.
Terrain also plays a signi cant role. Elevation changes, vegetation, and built features can either block or expose turbines to radar systems, a ecting how signals propagate across the landscape. As a result, siting decisions often consider both turbine placement and surrounding topography to minimize potential interference.
Wind turbine impacts on aviation and radar systems are evaluated through coordination between planners, developers, and regulatory agencies.
Local governments play an important role during the permitting process by identifying potential con icts early and ensuring that appropriate studies are conducted.
This often includes screening projects for proximity to airports and navigation aids, consulting FAA obstruction evaluation processes when height thresholds are exceeded, and requiring applicants to assess radar line-of-sight interactions where relevant.
Project developers are typically responsible for conducting aviation and radar impact assessments during site selection and design. Early coordination with FAA and radar operators allows developers to identify potential con icts and adjust turbine layout, height, or placement before construction.
Aviation and radar authorities evaluate whether proposed turbines may a ect airspace safety, navigation systems, or radar performance. This includes reviewing potential impacts on airport safeguarding surfaces, navigation aids such as VOR and ILS, and radar detection systems.
If turbines are determined to be potential aviation hazards, the Federal Aviation Administration (FAA) may require lighting or marking to ensure aircraft safety.6 These requirements are typically based on turbine height, location, and proximity to airports or ight paths.
At the local level, ordinances often limit lighting to FAA minimum standards in order to reduce visual impacts on surrounding communities. Where multiple FAA-compliant options are available, local governments typically prefer the least visually intrusive alternative, such as steady red lighting instead of high-intensity white strobe lighting.6
Potential radar impacts can often be reduced through a combination of siting strategies and technical mitigation measures. Preferred approaches focus on avoiding impacts through project design, such as locating turbines outside radar line-of-sight7, maintaining appropriate distances from radar systems, and adjusting turbine layout to reduce radar cross-section.
When siting adjustments are not su cient, radar-side mitigation strategies may be used. These include signal processing techniques, clutter ltering4, adaptive scanning methods, and, in some cases, supplemental radar systems. Because these solutions can be complex and system-speci c, early coordination between developers and radar operators is critical.
Impacts to aviation and radar systems are not xed and can often be addressed through early planning decisions, project design, and coordination with relevant agencies. Local governments play an important role in identifying potential con icts and ensuring that appropriate review processes are followed.3
During Project Review :
Identify projects located near airports, navigation aids, or known radar systems
Require applicants to complete aviation obstruction evaluations where applicable
Encourage early coordination with FAA and radar operators
Evaluate potential impacts based on turbine height, location, and surrounding terrain
In siting and design decisions:
Avoid turbine placement within radar line-of-sight where feasible
Maintain appropriate distances from navigation aids such as VOR and ILS
Consider terrain and elevation to reduce exposure to radar systems
Encourage layouts that minimize signal re ection and interference
For mitigation and project conditions:
Require compliance with FAA lighting and marking requirements
Encourage use of the least visually intrusive lighting options where permitted
Require developers to address potential communication or signal interference
Consider radar mitigation strategies where impacts cannot be avoided
De la Vega, D., Matthews, J. C. G., Norin, L., & Angulo, I. (2013). Mitigation Techniques to Reduce the Impact of Wind Turbines on Radar Services. Energies https://www.semanticscholar.org/paper/Mitigation-Techniques-to-Reduce-the-Impact-of-Wind-Vega-Matthews/296a9b2b014 614c59ea6acd017f66cf4b20158ba
Air Law Group. (2023). Clearing the Air: Wind Turbines and Aviation Law. https://airlawgroup.com/wind-turbines-and-aviation-law/
Roegers, T. (2024, December). Radar Interference Mitigation: A Review. Preprints. https://sciety.org/articles/activity/10.20944/preprints202412.2182.v1
Angulo, I., et al. (2013). Impact Analysis of Wind Farms on Telecommunication Services. Renewable and Sustainable Energy Reviews. https://www.sciencedirect.com/science/article/pii/S1364032114000100
Fraunhofer Institute for High Frequency Physics and Radar Techniques (FHR). (2012). An Overview of Wind Turbine Interference Research Activities. https://ieeexplore.ieee.org/document/9135658
Federal Aviation Administration (FAA). (2020). Obstruction Evaluation and Airport Airspace Analysis (OE/AAA) Guidance. https://www.transportation.gov/resources/individuals/privacy/obstruction-evaluationairport-airspace-analysis-oeaaa
Crane, R. K. (1980). Radar Systems Engineering. McGraw-Hill. https://books.google.com/books/about/Introduction_to_Radar_Systems.html?id=YvsiAAAAMAAJ







Created by Junyi Wang, April 2026

Utility-scale energy and infrastructure projects can bring both opportunities and potential burdens to the communities where they are proposed, creating a wide range of local impacts. In response, a variety of community benefit mechanisms have been developed to help ensure that local communities receive tangible benefits from proposed developments while addressing potential burdens.
Several types of agreements are used in development projects to negotiate and formalize community benefits. The sections below introduce several commonly used mechanisms.
CBAs are legally binding agreements negotiated between developers and community coalitions or organizations, outlining benefits provided in exchange for community support or non-opposition to a project. Communities may receive a combination of monetary and non-monetary benefits, such as local hiring commitments, infrastructure investments, or community programs.
Example
Project: Aqua Ventus Offshore Wind Project (Monhegan, Maine)
Community benefits in this agreement include:
Funding for local energy and broadband infrastructure
Annual payments to the municipality
Local hiring opportunities and training
Scholarships for Monhegan residents through the University of Maine
CBA Toolkit by PolicyLink
CBA Template by Fair Shake
CBA Example Worksheet by Fair Shake
Guidance on effective messaging for CBA
Practical guidance for CBA negotiations
GNAs are typically voluntary agreements between a developer or facility operator and nearby residents, community groups, or neighboring communities. They are often used to address site-specific impacts a proposed or existing project may have on nearby communities, such as noise, traffic, pollution, visual impacts, or operational practices. In some renewable energy contexts, GNAs may also involve neighboring landowners who do not host project infrastructure on their property but are compensated because of the project’s proximity and its potential effects on their land or living environment
Example
Project: Rhone-Poulenc Chemical Plant (Manchester, Texas)
Community benefits in this agreement include:
Community input into environmental and safety auditing
Attention to nuisance and quality-of-life concerns such as odors, noise, and traffic
Ongoing oversight through a community advisory structure
A legally binding agreement incorporated into the facility’s permit
HCAs are legally binding agreements between a developer and the municipality or local governing body where a project will be sited. These agreements often include financial payments, host community funds, infrastructure improvements, or other commitments intended to address local impacts and support community priorities. Because host municipalities often play a central role in local siting and project approvals, HCAs can become an important way to formalize both project-related mitigation and broader local benefits. In some jurisdictions, similar arrangements may be implemented through broader development agreements or other project approval agreements, depending on state and local law.
[10][11][13]
Example
Project: Duane Arnold Energy Center Restart Project (Linn County, Iowa)
Community benefits in this agreement include:
Annual Host Community Funds payments to Linn County
Funding for emergency preparedness and public safety services
Support for infrastructure maintenance and local government functions
PILOT agreements are negotiated fiscal arrangements in which project developers make payments to local governments instead of, or in addition to, property taxes These agreements are commonly used in large infrastructure or energy projects and can provide a flexible source of revenue for host jurisdictions In some cases, PILOTs may also provide greater tax certainty for developers by fixing payment terms over time.
PILOTs are often discussed alongside community benefit mechanisms because they can generate financial resources for communities affected by development. However, they primarily function as tax or revenue tools rather than agreements centered on community representation, mitigation, or oversight. This distinction matters because PILOT revenues are usually controlled through government budgeting processes, rather than through community-led negotiation or project-specific oversight structures For that reason, this fact sheet treats PILOTs as related but distinct from CBAs, GNAs, and HCAs
Although these mechanisms all aim to deliver benefits to communities, they do not operate in the same way. Some are negotiated directly with community groups, while others are structured through local governments or fiscal arrangements These differences matter because they influence who helps define the benefits, who makes decisions about how they are used, and how clearly affected communities are represented in the process.
[13][14]
The following framework highlights key distinctions in how community benefit mechanisms are negotiated, how benefits are structured and governed, and what types of justice concerns may arise in practice.
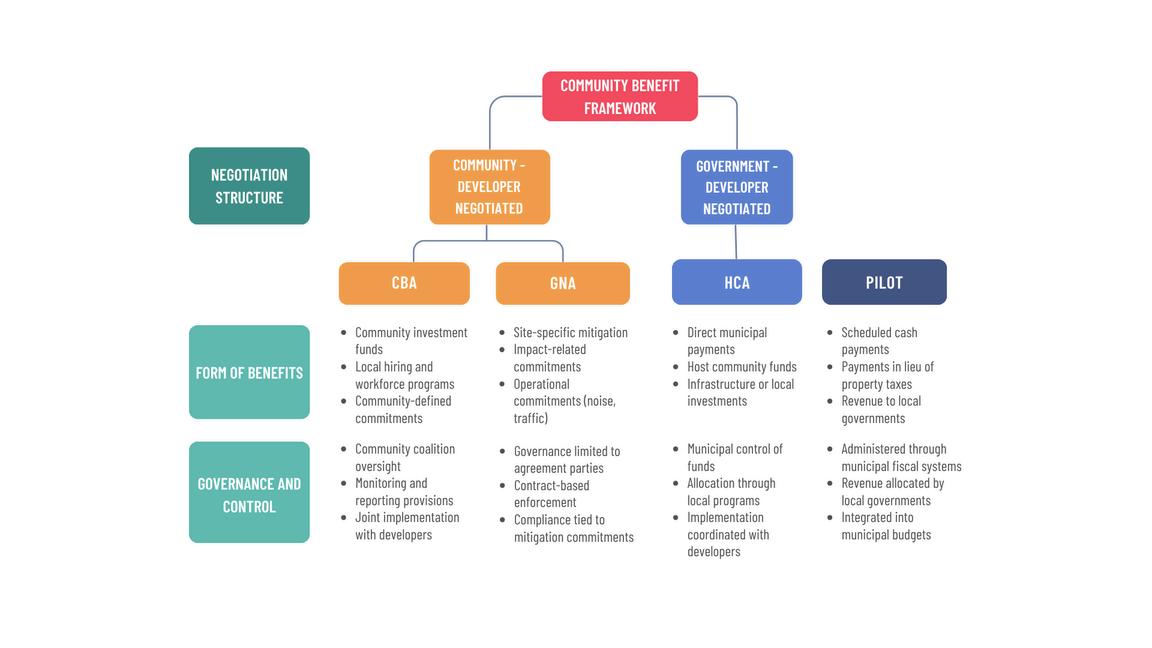
Theformofbenefitsvariesacrossmechanisms,rangingfromsite-specificmitigationmeasurestobroader financialcontributionsandcommunityinvestmentprograms
CBAscommonlyincludecommitmentsrelatedtocommunityinvestmentfunds,localhiringorworkforce developmentprograms,environmentalmitigation,affordablehousingorpublicamenities,andother community-definedpriorities
GNAsoftenfocusonsite-specificmeasuresaddressingnearbyimpacts,suchasnoisereduction,traffic mitigation,visualimpacts,operationalrestrictions,environmentalmonitoring,orcommunityaccessto informationaboutfacilityoperations.
HCAsmayincludeabroadersetofnegotiatedcommitmentsbetweendevelopersandhostlocal governments,suchasdirectfinancialcontributionstothemunicipality,hostcommunityfunds, infrastructureimprovements,roaduseprotections,emergencyservicesupport,orotherlocal investments
PILOTagreementstypicallyinvolvescheduledpaymentstolocalgovernmentsinlieuofpropertytaxes. Ratherthanspecifyingproject-levelmitigationorcommunityprograms,theyprimarilyprovidefiscal revenuethatcansupportlocalgovernmentfunctionsorotherpublicpurposes. [1][15][17]
Governancestructuresdeterminewhoadministersbenefitsandwhoholdsauthorityoverhowthosebenefits areallocated,monitored,andused.
CBAsofteninvolvegovernancestructuresthatincludecommunitycoalitions,nonprofitpartners,or designatedoversightcommitteesAgreementsmayincludemonitoring,reporting,orimplementation provisionstohelpensurethatnegotiatedcommitmentsarecarriedout.
GNAsaretypicallygoverneddirectlybytheagreementparties,withcompliancetiedtospecific mitigation,monitoring,oroperationalcommitmentsnegotiatedbetweendevelopersandnearby residentsorcommunitygroups.Becausetheyoftenaddresshighlylocalizedimpacts,oversightmay remaincloselytiedtothesignatoriesthemselves
HCAsgenerallyplacegovernancewiththehostmunicipalityorlocalgoverningbody,whichmayallocate fundsthroughmunicipalprograms,communityfunds,infrastructureplanning,orotherpublicinitiatives. Thismeansbenefitsareoftenadministeredthroughlocalgovernmentprocessesratherthanby communitycoalitionsalone.
PILOTagreementsaretypicallyadministeredthroughmunicipalfiscalsystems,withrevenuesintegrated intolocalgovernmentbudgetsorotherpublicfinancearrangementsAsaresult,decisionsabouthow PILOTrevenuesareusedusuallydependongovernmentalbudgetingprocessesratherthanprojectspecificoversightstructures.
Differencesinnegotiationstructuresandinstitutionalarrangementsmayalsoraisedistinctjustice considerations.Theseconcernsoftenrelatetohowbenefitsaredistributedandhowcommunitiesare representedinnegotiations.
Ingovernment-developernegotiatedmechanisms,justiceconcernsoftencenterondistribution Because benefitsareadministeredthroughlocalgovernments,decisionsabouthowrevenuesareallocatedaremade throughmunicipalprocesses Asaresult,benefitsmaybedistributedacrossthebroaderjurisdictionrather thandirectedtowardtheareamostdirectlyaffectedbyprojectimpacts Thismeansthatthecommunities livingclosesttoprojectimpactsmaynotalwaysreceivebenefitsinproportiontotheburdensthey experience.
Incommunity-developernegotiatedmechanisms,justiceconcernsoftenrelatetorepresentation.Because theseagreementsrelyoncommunityorganizationsorgroupsofresidents,questionsmayariseaboutwho representsthecommunityinnegotiationsandwhetherallaffectedstakeholdersareincludedintheprocess. Thiscanaffectboththelegitimacyoftheagreementandconfidenceinhowcommunityprioritiesare defined.
[6][18][21]
Fromaplanningperspective,communitybenefitmechanismsprovidetoolsforlinkinglarge-scale developmentwithlocalprioritiesandcommunityoutcomes.Throughthesemechanisms,plannersandlocal governmentscanhelpstructurehowprojectbenefitsaredefined,negotiated,anddistributed.
[18][19]
Inpractice,plannersworkwithinlegalandinstitutionallimitsthatdeterminewhichbenefitslocal governmentscanrequirethroughpermittingandwhichmustbenegotiatedseparately.Thismeansthattheir roleisoftennotsimplytoaddbenefits,buttohelpidentifywhichtoolsarelegallyandpracticallyavailablein agivensetting-suchasCBAs,HCAs,GNAs,orPILOTs-andhowthosetoolscanbeusedinatransparentand workablewaytoaddresslocalpriorities Insomecases,thisalsoinvolvesrecognizingthatagreementswith neighboringlandownersmayfunctionnotonlyasresponsestoprojectimpacts,butalsoasarrangementsthat canshapesitingflexibilityandinfluencewhoistreatedasaparticipatingordirectlyaffectedparty Fromthis perspective,plannersmayhelpcommunitiesdistinguishbetweenbenefitsthatcanberequiredthrough formalapprovals,benefitsthatmustbenegotiatedseparately,andbenefitsthatdependmoreheavilyonlocal political,fiscal,orgovernancearrangements
[11][20]
[1] U S Department of Energy (2024) Frequently asked questions about CBAs URL
[2] PolicyLink (2020, October) CBA toolkit URL
[3] Fair Shake (n d ) Community benefits agreement template URL
[4] Fair Shake (n d ) Community democracy river: Community benefit agreements URL
[5] Partnership for Working Families & SPIN Project (2007) Words that work: Communications messaging for community benefits agreements. URL
[6] Partnership for Working Families (2016, January) Common challenges in negotiating community benefits agreements- and how to avoid them URL
[7] Morford, J M , & Baldwin, A (2013, October 11) Using good neighbor agreements to address community complaints about industrial operations OSB Environment and Natural Resources Section, Environmental Law: Year in Review
[8] Kenney, D S , Stohs, M , Chavez, J , Fitzgerald, A , & Erickson, T (2004, August) Evaluating the use of good neighbor agreements for environmental and community protection: Final report. Natural Resources Law Center, University of Colorado School of Law. URL
[9] Lewis, S , & Henkels, D (1996) Good neighbor agreements: A tool for environmental and social justice Social Justice, 23(4), 134-151
[10] Spitzer, D A , Salkin, P E , & Bookser, M (2009) Host community agreements for wind farm development New York Zoning Law and Practice Report, 9(5)
[11] Adelman, D E (2025, December 2) Overcoming the economic and legal barriers to local acceptance of renewable energy projects SSRN URL
[12] Moore-Bloom, R (2024, September 26) Ensuring communities benefit from the clean energy transition Clean Energy Transition Institute. URL
[13] Riedl, D , Carlsen, W, Said, E , Saha, D , Adcox, G , & Fraser, C (2025, March 26) Community benefits frameworks: Shortcomings and opportunities for greater impact World Resources Institute URL
[14] Clean Air Task Force (2023, September) Community benefits programs & clean energy URL
[15] Lavine, S , Pecego, A , Shen, W, & Yang, B (2023, November) Community benefits agreements: Case studies, federal guidelines, and best practices Clean Air Task Force URL
[16] Moore-Bloom, R (2025, July 24) Community benefits agreements: Opportunities, barriers, and best practices Clean Energy Transition Institute. URL
[17] Great Plains Institute (2025, February) Community benefits agreements for solar development resource guide URL
[18] Sotolongo, M (2024, June) White paper: Community benefits policy and energy justice Initiative for Energy Justice URL
[19] Blair, J J A , et al (2025, October) Building community power: Community benefits agreements across the global energy supply chain Climate and Community Institute URL
[20] Fazio, C A , & Wallace, J (2010) Legal and policy issues related to community benefits agreements Fordham Environmental Law Review, 21(3), 543-559.
[21] De Barbieri, E W (2017) Do community benefits agreements benefit communities? Communities & Banking, 28-31 URL
Reliability is a characteristic of the entire electrical grid, requiring adequate resource availability, effective monitoring and control of energy supply, and resiliency. Resilience is the ability of the grid to withstand extreme conditions, recover quickly, and support critical infrastructure. Greater diversity in energy sources and proper planning can improve reliability of the entire system, while local resilience improves with greater grid reliability and behind-the-meter projects and strategies. The impact a new energy project will have on the grid depends on how it connects to the grid (either through the transmission or distribution system). If reliability is a priority of a community, there are certain questions to consider and urban planning steps they can take to increase local resilience
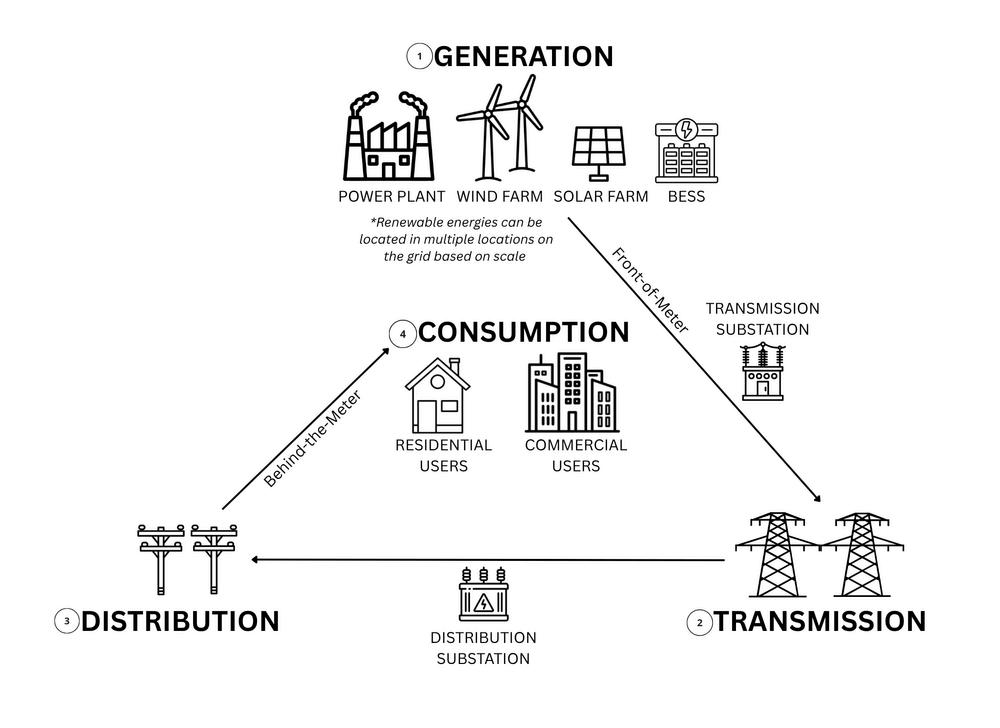
Figure 1. The traditional flow of electricity through the grid flows from generators through transmission and distribution lines to the consumer Note renewable energies (especially battery storage) can be located in multiple locations on the grid based on scale, especially at the generation and distribution levels This diagram is not comprehensive and created from synthesis of multiple sources.
The electrical grid has three main components: generation, transmission, and distribution. Visit the U.S. EIA website for more detailed information.
1.Generation is where electricity is produced. At this level, energy is generated by utilityscale projects that connect to the transmission grid, where the energy will be shared throughout the grid and across the country. Small-scale projects connect to the distribution grid.
2.Transmission uses high-voltage power lines to transport electricity across the country. Transmission substations increase the voltage level before travel to ensure efficient transmission. This network spans hundreds of miles and is supported by tall metal towers.
3 Distribution is the direct delivery of electricity to consumers. The network is made up of local networks and infrastructure, such as power lines supported by wooden poles seen along residential streets. Distribution substations lower the voltage of the transmitted electricity to usable levels for individual consumers.
Individual wind turbines harness the kinetic energy of wind with their blades that connect to a generator. This generator converts the kinetic energy into electrical energy. Power is consolidated from individual turbines at a central substation near the farm, where the voltage is increased.
Visit the U.S. DOE website to learn more.
Individual solar panels harness the heat energy from the sun to concentrate solar radiation to produce direct current electricity. Arrays, or several connected panels, are connected to the electrical grid. An inverter converts direct current electricity to alternating current electricity, in preparation to enter the grid.
Visit the U.S. DOE website to learn more.
Battery energy storage systems (BESS) capture energy generated by other sources to be used later. This energy can be used when renewable energy resources are not available (e.g., charge with solar during the day for battery use at night). There are many different types of batteries that can be used, each with different impacts to reliability.
Behind-the-meter BESS stores power that can be used directly by the building where the battery is located. These systems vary in size based on how much load the customer has from a small residential BESS to a BESS for a large manufacturing facility. Depending on grid connection, they can charge from on-site, behind the meter solar or from the grid.
[2]
Front-of-the-meter BESS are utility-scale batteries that store energy from power generation facilities on the grid, rather than for a particular building.These systems charge during high-production and lowdemand, and discharge during lowproduction and high-demand. Off-site BESS requires interconnection to the transmission (largest projects) or distribution grid (smaller projects).
Hybrid BESS are co-located with power generation facilities, like wind or solar systems. They often share the same point of interconnection to the grid as the power generation facility. [3]
Planner’s Note
Allow for distributed, hybrid systems (wind-solar-battery storage) throughout the community, including in residential areas, in zoning ordinances to increase resiliency and reliability benefits.
Some important actors in grid reliability and function include:
The North American Electric Reliability Corporation develops and enforces mandatory reliability standards for planning and operating power systems.
The Federal Energy Regulatory Commission (FERC) regulates the transfer of electricity and electric grids spanning multiple states.
A regional transmission organization (RTO) is an electric transmission system operator that coordinates, controls, and monitors a multi-state electric grid An independent system operator (ISO) is an organization formed at the recommendation of FERC It has the same responsibilities as a TSO, but usually operates within a single U.S. state. Both TSOs and ISOs are responsible for maintaining grid stability and reliability.
Grid operators allocate energy resources based on demand, schedule power generation to maintain a balanced system, and manage the variability of renewable energy generation in real-time. They generally don’t control the electrical load on the grid.
How does the electric grid balance electricity supply and demand in real time?
The grid balances electricity load in real-time by coordinating electricity generation and consumption to ensure grid stability and reliability. Regional balancing authorities, including electric utilities and regional transmission organizations, ensure electricity supply constantly matches power demand Fossil fuel power plants can be intentionally turned to meet high demand or low renewable energy production. Renewable sources can be curtailed, or shut off deliberately when production exceeds demand.
Important to know: peak load hours can change seasonally and regionally, but are often afternoon to evening times. Visit the U.S. EIA to learn more.
Important to know: the inclusion of BESS reduces the need to shut off renewable sources
How do grid operators manage the variability of solar and wind generation?
Variability and intermittent generation is an inherent quality of solar and wind generation, but does not mean they are inherently unreliable Sun and wind availability is mostly predictable at the time scales (e.g., 4-24 hours ahead) that grid operators are scheduling power generation. As a result, grid operators use weather forecasts to schedule in wind and sun availability, rather than only reacting to what becomes available.
Important to know: energy supply can exceed energy demand. When grid operators can’t integrate extra energy, operators intentionally reduce power production. This happens regardless of technology type.
Important to know: high-speed wind days pose challenges to the entire grid. Wind turbines can shut down at high-wind speeds to prevent unnecessary strain on the turbine and be removed from service, resulting in the actual wind energy output being lower than planned Utilities can preserve reliability by implementing improvements to prepare for windy days and ensure stabilization.
Planner’s Note
Require plans from developers and utilities on how they have weatherized and strengthened the projects in the face of changing weather risks and conditions.
How does battery storage reduce strain during peak demand?
BESS plays a critical role in accommodating higher levels of wind and solar generation on the grid. It reduces the impacts of curtailment by storing excess electricity production, increasing efficiency of renewable energy sources, and easing the variability. Batteries also engage in a process called arbitrage, where they store electricity when prices are low and release it into the grid when prices are high. This balances electricity supply and demand.
How does renewable energy affect the reliability of the electrical grid and local resilience?
Renewable energy sources enhance grid reliability at all levels, especially when paired with BESS Whether they benefit the overall grid or the local community depends on how the system is connected to the grid.
Utility-scale projects that connect to the transmission grid do not have a large impact on local reliability and resilience Instead, they increase overall reliability and resilience of the power grid, benefitting consumers in multiple communities. The power generated by a wind or solar farm that connects only to the transmission grid will not be accessible by local consumers and the local community
Small-scale projects that connect to the distribution grid can create power accessible to the local community, through distributed energy resources (DER) and microgrids. Microgrids are a local electrical grid with specific boundaries that can disconnect from the larger grid
Behind-the meter solar and storage installations allow certain facilities to function when distribution lines are down. When located on-site or connected to a microgrid, behind-the-meter projects can keep essential services running Wind and solar farms are not suitable energy sources for individual buildings when disconnected from the grid unless they have additional equipment, like energy storage. It could lead to inconsistent power and damaged equipment
Planner’s Note
Update local ordinances and zoning code to facilitate the addition of renewables and improve ease for small-scale projects to connect to distribution lines.
Reliability is a characteristic of the entire electricity system, not a characteristic of individual households or energy types. Relying on only one energy source will not lead to local or national grid reliability and resilience, whether it is renewable or not. Individual wind or solar projects alone often cannot improve resiliency, as they normally cannot operate when the grid is down.
How will a renewable energy or BESS project affect outages?
Outages occur when electricity supply and demand in the grid fall out of balance. This can mean a physical infrastructure disturbance (e.g., a downed power line) or human error in managing the power mix. Although sources interpret outage data differently, most agree that around 90% of power outages are due to failure in the distribution system. Climate Central reports that 80% of U.S. power outages are due to weather-related events.
Many outages can be avoided with proper planning. For example, the Texas grid failure in 2021 was rooted in the failure to winterize their infrastructure, leading the power plants–particularly natural gas and wind energy–to fail. Furthermore, the California blackouts in 2020 were rooted in the grid operator’s failure to adjust to the evolving power mix, leading to the demand for power to exceed planning targets. Most outages are not due to problems inherent to any specific energy source and can be mitigated with proper planning.
Renewable energy can withstand extreme weather and enhance grid resilience during extreme hot- and cold-weather conditions. Solar provides energy during extreme heat and drought, when conventional energy sources may struggle due to the lack of access to water. Some researchers argue that a 100% clean, renewable energy system (wind-watersolar and battery) would improve reliability and lower power outage occurrences.
Can the community access power locally during an emergency?
Communities may have access to emergency power from renewable sources depending on the type of outage (e.g., damage to distribution lines) and how the project is connected to the grid. If a power line is down, front-of-the-meter energy cannot provide accessible power to others on the distribution line. On the other hand, microgrids powered by small-scale renewable projects can provide emergency power, usually for on-site use.
What role does battery storage play in outages and emergencies?
The community may be able to access BESS power during an emergency depending on the kind of BESS located in the community, how it connects to the grid, and if it is on- or off-site
On-site BESS can help keep essential services running during outages and emergencies. It can stabilize voltage levels during brownouts for the connected consumer BESS connected to the distribution grid can sometimes provide electricity to the local community and consumers in the immediate vicinity if the portion of the line can be isolated.
Important to know: BESS power during outages depends on the amount of charge before the outage and requires special switching and control systems.
Off-site and transmission-connected BESS benefits the grid overall through voltage support, managing peak loads, and balancing power demand and generation It does not provide benefits exclusive to the host community.
[8]
Planner’s Note
Identify critical loads and infrastructure in your community and create an emergency response plan. Update zoning to facilitate the development of distributed energy or behind-the-meter resources near critical infrastructure.
What impact do microgrids have on local resilience?
Microgrids are miniature, localized electric grids that power a small area or number of buildings and disconnect from the main grid to operate autonomously. Small scale projects connected to a microgrid may provide more consistent, safe power during an emergency. Because they can operate when the grid is down, they can help strengthen grid resilience, mitigate grid disturbances, and support quicker system recovery. Distributed energy resources (DER), like rooftop solar panels, backup batteries, and emergency generators, make microgrids a more widespread, obtainable option, as energy production is more easily obtained and sited in neighborhoods.
Specific systems allow for local power access during power outages. Wind turbines and solar panels incorporated into a local microgrid can provide backup sources of power during grid outages. BESS contributes to resilience, especially when paired with a local power source on a community microgrid.
Microgrids can aid in “black start” processes, turning power on after the grid has gone down. To come back online, electrical generators require an external battery to restart. Utilities create black start plans to restart these generators. Communities with a microgrid could use small generators to begin start-up processes on their own and provide capacity to bring larger generators back online.
Planner’s Note Consider these examples of successful microgrids and explore how to build one in your community.
Much of reliability planning will be out of reach of local planner’s scope, but there are actions one can take to increase local resilience and reliability benefits If reliability is a concern in your community, the following questions and considerations, including the notes throughout this factsheet, provide essential starting points for updating local siting policy to reflect this concern Overall, local planners can invest in and ease the development of local energy resources and systems that can ensure energy service during utility grid failures.
Understand the technicalities of the project being proposed (connection to the grid, type of BESS, etc.)
Ask for reliability benefits from the developer (such as a hybrid project).
Create community education initiatives on reliability impacts of renewable energy and what can be done individually, locally, and regionally/nationally. Engage with community members on their reliability concerns to best understand the issues in the community.
Create initiatives and designate funding for individual users to build their own behindthe-meter systems.
Require redundancy in energy sources and/or system operations (such as redundancy in network switches)
How will the energy project be connected to the electricity grid? There are different benefits based on the connection
Who is the balancing authority in my community/region? There may be initiatives to lower peak demand Additionally, microgrids can act as balancing authorities
Where are the distribution/transmission lines in my community? Developers will want to build generation projects as close to the connection to the grid as possible, impacting those land owners.
What kind of BESS is being proposed/built? Is it being proposed alongside a power generation facility? Not all batteries provide the same reliability benefits. Consider what kind of BESS is being proposed/built by the developer and if it is being proposed alongside a power generation facility Hybrid systems (wind-solar-battery) have significantly higher resilience than traditional, single system projects.
Does your state have legislation requiring a certain amount of electricity storage? If so, consider incentivizing and improving ease of BESS development in local ordinances
What is the role of the RTO, ISO, and utility in your community? Visit FERC’s website and your local utilities website to learn more about reliability and resilience initiatives.
Created by Makenna Litteral
Organization
Federal Energy Regulatory Commission
National Laboratory of the Rockies
RTOs and ISOs
Community Resilience Options
Union of Concerned Scientists Power After the Storm
ICF Resources
Community Energy Resilience Planning for Extended Power Outages
American Society of Civil Engineers America’s Infrastructure Report Card
GridLab Grid Reliability in the Clean Energy Transition
Find more information on the nation’s RTOs and ISOs.
This report highlights potential actions a community can take to increase resilience. It includes options at different scales and additional planning resources.
This report analyzes the impact of extreme weather events on power outages in the US. They recommend key resilience-building strategies.
This report identifies common energy resilience needs and outlines solutions It provides an introduction to key concepts and descriptions of additional resources and strategies.
This report provides a letter grade to different aspects of America’s infrastructure, including energy. ASCE releases a report card annually.
GridLab has published several reports on issues pertaining to renewable energy and electricity This report provides an in-depth explanation on how the grid functions, the definition of reliability, and a primer on the basics of planning a reliable grid
[1] Michelle Solomon and Sara Baldwin, “Grid Reliability in the Clean Energy Transition,” GridLab, 2025, URL
[2] Thomas Bowen and Carishma Gokhale-Welch, “Behind-The-Meter Battery Energy Storage: FAQs,” Greening the Grid, 2021, URL
[3] Tyler Augst et al , “Planning & Zoning For Battery Energy Storage Systems,” Michigan State University, University of Michigan, 2025, URL
[4] NREL, “What is Power System Curtailment?” National Laboratory of the Rockies, 2024, URL.
[5] Marta Lafuente-Cacho et al , “State of the Art For Solar and Wind Energy-Forecasting Methods for Sustainable Grid Integration,” Current Sustainable/Renewable Energy Reports, 2025, URL
[6] Jacob P. Aho et al., “Controlling Wind Energy for Utility Grid Reliability,” American Society of [7] “Lessons Learned,” North American Electric Reliability Corporation, URL
[8] Jessica Garcia, “FAQs about Community-Level and Large-Scale Battery Energy Storage,” Union of Concerned Scientists, 2021, URL.
[9] “Battery Energy Storage Systems Report,” U S Department of Energy, 2024, URL
[10] Brian Levite et al , “Community Energy Resilience Planning for Extended Power Outages,” ICF Resources, 2023, URL.
[11] Teddy Gonzalez and Jillian Knox, “In the Dark: The Scapegoating of Renewables After Grid Failures,” Natural Resources Journal, 2023, URL
[12] “America’s Infrastructure Report Card,” American Society of Civil Engineers, 2025, URL.
[13] Clifford Krauss et al., “How Texas’ Drive for Energy Independence Set It Up for Disaster,” New York Times, 2021, URL
[14] Ivan Penn, “Poor Planning Left California Short of Electricity in a Heat Wave,” New York Times, 2020, URL
[15] “Solar Integration: Distributed Energy Resources and Microgrids,” U.S. Department of Energy, URL.
Utility-scale solar and wind projects can significantly affect local roads, particularly during construction Battery storage (BESS) projects typically have more limited road impacts When properly planned, these impacts are temporary and manageable, and developers are typically responsible for all repair and restoration costs Further, over a project's lifetime, renewable energy generates substantial local tax revenue that can directly fund road maintenance and county infrastructure This fact sheet addresses the most common questions communities face when evaluating renewable energy proposals, with a focus on road impacts, developer responsibilities, and the long-term fiscal benefits that offset short-term disruption.
Q: How does renewable energy construction affect local roads?
A: Construction of utility-scale solar and wind projects significantly increases heavy vehicle traffic on local roads; the road impact of battery storage projects is typically more limited by comparison The degree of road damage depends on several interconnected factors:
● Seasonality: Roads are far more vulnerable during the spring thaw, when frozen subgrade soils thaw unevenly, reducing load-bearing capacity. Heavy vehicles during the freeze-thaw cycle can cause rutting and base failure that would not occur in summer or fall.1
● Soil conditions: Clay-heavy or poorly drained soils are particularly susceptible Saturated subgrades can fail under repeated axle loads even within legal weight limits. Sandy or well-drained soils typically recover more readily 1
● Daily vehicle counts: Cumulative load, not individual trip weight alone, determines pavement fatigue High-frequency haul routes significantly accelerate surface wear 1
Q: Who is responsible for repairing road damage caused by construction?
A: Developers are generally responsible for road damage caused during construction Road Use Agreements (RUAs), formal contracts between developers and local governments, are the primary legal mechanism for assigning this responsibility and ensuring accountability
Key components of a strong RUA include the following, according to Westwood Professional Services in their document on Road Use Agreements: How to Reduce Risk Exposure:
● A pre-construction road condition survey conducted by an independent engineer
● A performance bond covering each road mile affected by construction traffic
● Specific, measurable restoration standards, not vague language like 'prior condition'
● A defined post-construction inspection timeline and sign-off process
Missouri Case Study (Adair County, 2025)
Adair County, Missouri, entered a Road Use Agreement with the Morris Solar project, requiring road restoration to 'prior condition' as reported by KTVO News, November 10, 2025. When restoration fell short of expectations, the county negotiated a $225,000 settlement, equivalent to roughly $8,000 per affected road mile, and completed repairs itself. 5
✭ Vague RUA language transfers risk to the county Specific, enforceable standards and an adequate performance bond are essential before any construction begins

As part of the conditional use permit or special use permit process, planners could consider requiring a Road Use Agreement (RUA) as a condition of project approval, not as an afterthought. This means incorporating RUA requirements directly into local zoning ordinances or renewable energy overlay districts before any project is proposed, so expectations are established in advance.
Planners are not expected to draft the RUA themselves, but they play a critical coordinating role, bringing together the developer, the county highway engineer, and the county attorney early in the review process Raising road impact questions at the pre-application stage gives the county far greater negotiating leverage than waiting until a project is already designed
Q: Why do wind projects pose unique road challenges?
A: Many wind turbine components are classified as Oversized/Overweight (OSOW) cargo, presenting challenges that go well beyond typical heavy vehicle impacts:
● A single nacelle transport truck can reach 218,000 lbs, far exceeding the load capacity of most rural roads and bridges 4
● Modern blades exceed 200 feet in length; a single turbine requires approximately 7 specialized trailers (typically 3 for blades, 1 for the nacelle, and additional loads for the tower and hub) 4
● Each state traversed requires a separate OSOW permit and a bridge engineering evaluation 2
● Route surveys, bridge assessments, and access road reinforcement can add weeks to the pre-construction timeline 2
Some rural access roads cannot support these loads and must be reinforced or bypassed before construction The developer typically bears the costs for road upgrades, which should be clearly specified in the Road Use Agreement
Q: What might planners require from wind developers regarding transportation?
A: To minimize road impacts, planners might consider requiring developers to submit a detailed haul route plan as part of the permit application 2 , including the following:
1 A route survey identifying all weight-restricted bridges, low-clearance structures, and sharp turns
2 Bridge load assessments conducted by a licensed structural engineer
3. Proposed road and bridge upgrades with cost estimates and responsibility clearly assigned
4. A restoration plan with a timeline, performance bond, and sign-off requirements
5 Oversized/Overweight permit documentation for each state or jurisdiction traversed
Wind energy projects present infrastructure challenges that planners should anticipate during the land use review OSOW component transport is not merely a logistics issue; it is a land use and infrastructure impact that warrants specific conditions of approval in the site plan review or conditional use permit process
Planners could require developers to submit a complete haul route plan as part of the permit application, identifying all affected roads and bridges, proposed road upgrades, and who bears each cost This ensures the financial burden falls on the developer, not the county
More proactively, planners might consider updating the comprehensive plan or transportation element to identify road network vulnerabilities, particularly weight-restricted bridges and low-capacity rural roads, before wind projects are proposed. Early identification shifts the county from a reactive to a proactive position. Coordinating with the county highway engineer and neighboring jurisdictions is essential, as haul routes frequently cross municipal boundaries.
** Key Resource: NREL Transportation of Large Wind Energy Components (DOE, 2016)
Q: Are there ways in which renewable energy projects improve local roads?
A: Yes Renewable energy projects improve local roads primarily through the long-term tax revenue they generate via property taxes or PILOT agreements over a 20-40 year project life Road funding is rarely formally earmarked from these revenues, but road maintenance is a common local government priority and a frequent beneficiary of renewable energy tax receipts When a Road Use Agreement is in place to cover construction-related damage, these tax revenues represent a net fiscal benefit to the county, not a zero-sum tradeoff against repair costs, making renewable projects a long-term asset to local road infrastructure.
State Examples
Iowa (Howard County)
Illinois (Paxton)
Minnesota (Statewide)
Wind turbines generated $2 7 million in property taxes in 2024, representing 14 5% of the county's total budget, funding schools, public safety, and road maintenance 7
Wind tax revenue provided approximately $40,000 per year over 13 years to the local fire department, used to purchase equipment and hire part-time firefighters 8
Since 2004, wind and solar farms statewide have paid approximately $100 million in property taxes Wind energy represents more than one-fifth of all property tax collected in some rural counties, a significant fiscal stabilizer for communities with limited commercial tax bases 9
Q: How might renewable energy tax revenues benefit the communities that host these projects?
A: When construction-related road damage is covered through a Road Use Agreement, renewable energy tax revenues represent genuine additional fiscal capacity for the county, not simply an offset against repair costs The primary value of these revenues is making the financial benefit of hosting renewable infrastructure visible and tangible to the communities bearing its impacts: funding schools, public safety, and general road maintenance over the project's 20-40 year life 7, 8, 9
While road funding is rarely formally earmarked from these revenues, road maintenance is a common local government priority and a frequent beneficiary of renewable energy tax receipts.10 Counties can strengthen this link through PILOT agreement terms or development conditions, though the degree to which formal earmarking is possible varies by state law 11
Strategies include:
● Dedicating a percentage of annual PILOT payments to a road repair reserve fund
● Conditioning development approvals on multi-year road maintenance commitments from developers
● Using the University of Michigan Graham Sustainability Institute's Renewable Energy Tax Impacts Calculator to project county-level revenue before negotiations begin
Planners play an important role in connecting long-term renewable energy revenue to community infrastructure needs, particularly road maintenance. Planners can influence the discussion and allocation of revenue during the project approval process, even though state law ultimately sets tax policy
Before approving a project, planners or the developer may conduct or request a fiscal impact analysis that estimates both the short-term infrastructure costs (road damage, inspection, and restoration) and the long-term tax or PILOT revenue the project will generate This gives the county a factual basis for negotiating development agreements that explicitly direct a portion of annual revenue toward road maintenance funds.
Planners should understand the difference between property taxes based on assessed value and PILOT (Payment in Lieu of Taxes) agreements PILOT agreements are negotiated, giving the county flexibility in how funds are directed but also the responsibility to advocate for terms that tie payments to infrastructure maintenance Planners should also ensure that decommissioning financial assurance is addressed in development agreements, protecting the community if a project is abandoned before the end of its useful life ** Key Resource: Local Property Tax Impacts of Large-Scale Wind and Solar Projects
[1] Westwood Professional Services. Road Use Agreements: How to Reduce Risk Exposure.
[2] NREL (DOE) Transportation of Large Wind Energy Components (2016)
[3] UM Graham Sustainability Institute Renewable Energy Tax Impacts Calculator
[4] NREL (Levine & Cook) Transportation of Large Wind Components: A Permitting and Regulatory Review (2016).
[5] American Planning Association (APA). Planning for Wind Energy.
[6] Krol, M., and Mills, S. (2024). Planning & Zoning for Battery Energy Storage Systems: A Guide for Michigan Local Governments
[7] Delworth, A , Center for Rural Affairs (CFRA) Wind Energy in Howard County, Iowa: A Case Study (2025)
[8] Walling, M & Wildeman, M K Associated Press Wind Power can be a major source of tax revenue, but officials struggle to get communities on board (2024)
[9] Clean Grid Alliance. Wind and Solar Projects Add $16 Million in Production Tax Revenue to Rural Minnesota Counties for 2020
[10] Headwaters Economics Uneven Local Benefits of Renewable Energy in the U S West
[11] U-M Graham Sustainability Institute Renewable Energy Tax Series (Indiana, 2025)
What Is the Rationale for Setbacks, Noise Standards, and Zoning Rules? Jeewon Suh | 2026 04
Introduction
Setbacks are a foundational tool in planning and zoning used to reduce crowding along property lines, ensure fire separation between structures, and maintain consistent street walls in built environments When applied to renewable energy infrastructure, setbacks serve the same core purposes: protecting neighboring land uses from physical hazard, noise, and visual impact while ensuring emergency access and environmental compliance
Noise and safety concerns, particularly ice throw and blade failure risk, most often drive setbacks for wind turbines For utility-scale solar, visual impact, traffic safety along roads, and inverter noise are the primary drivers of setback requirements Unit spacing and emergency access for battery storage (BESS) are governed by fire code spacing requirements, but setbacks often serve as a means of addressing noise at the property line Understanding the specific rationale behind each standard helps planners set rules that are both protective and proportionate
Q: What is the rationale for physical safety setbacks, ice throw, and blade failure?
A: Unlike noise and shadow flicker, safety setbacks for ice throw and blade failure are driven by structural risk rather than nuisance These setbacks are fundamentally different in character and should be understood and communicated separately
● Ice throw: Ice can accumulate on turbine blades in cold climates and be ejected at high speed during operation The throw distance depends on blade length, rotation speed, and wind conditions.
● Blade failure: The structural failure of a blade can result in debris traveling significant distances from the turbine base.
● The 1.5× hub height standard: Connecticut, Maine, and Massachusetts use 1 5 times the total turbine height as the public safety setback for both scenarios. This is a conservative but administratively simple rule 2
Q: Why do planners regulate wind turbine siting, and what is the scientific basis for each concern?
A: Physical safety is the primary driver of residential setbacks for wind turbines Ice throw and blade failure are the primary physical safety hazards that establish a minimum exclusion zone around wind turbines, independent of noise or other land use considerations 2 These hazards are site-specific and technology-specific, which is why many jurisdictions use a multiplier of hub height rather than a fixed distance as the setback standard
Noise is a secondary but significant concern Setbacks can provide some buffering at the property line Still, local governments increasingly rely on performance-based sound standards that specify a maximum dB(A) level at non-participating residences, rather than relying on distance alone to manage noise This approach better reflects actual site conditions and is more equitable across varied landscapes.
e.g., 1,000 ft from any residence
✓ Easy to administer, no acoustic modeling required
✓ Predictable for developers during site planning
✗ May be over- or under-protective depending on topography, wind direction, and turbine size
e.g., not to exceed 55 dB(A) Leq(1hr) at non-participating residences
✓ Better reflects actual site conditions
✓ More equitable across varied landscapes
✗ Requires an independent acoustic survey, adds cost and complexity to permitting
When updating local ordinances, planners should consider whether a fixed-distance or performance-based noise standard better fits the community context. A 1000-foot setback from residences is a commonly used starting point, consistent with successful wind project siting in Iowa 2 Communities with quiet rural baselines often supplement fixed setbacks with a performance-based noise limit, requiring pre- and post-construction acoustic monitoring as a condition of approval
Planners can require independent acoustic surveys as part of the site plan review process, placing the cost on the developer, not the county, to verify that predicted noise levels are accurate before construction begins
Q: Why do planners regulate shadow flicker, and is it a health concern?
A: Shadow flicker occurs when rotating turbine blades cast moving shadows through nearby windows. Because the amount and intensity of shadow flicker dissipate with distance from the turbine, sometimes it can be minimized through setbacks The primary question for planners is whether it warrants a setback or whether other regulatory tools are more appropriate
● Health context: Historically, smaller wind turbines could rotate at frequencies approaching 3 Hz, the threshold at which repetitive light flicker has been associated with photosensitive epilepsy Modern turbines, though, produce shadow flicker well below the frequency threshold associated with photosensitive epilepsy Current evidence does not support direct health impacts from shadow flicker at typical residential distances 1 Annoyance, however, is a legitimate planning concern and a basis for regulation 7
● The 30-hour/year standard: Many jurisdictions limit shadow flicker to 30 hours per year at non-participating residences. This standard is based on realistic GIS modeling that accounts for cloud cover and turbine operating statistics 7 Flicker can be accurately predicted before construction, giving planners a tool to require mitigation, such as automatic turbine shut-off during flicker periods, as a condition of approval If a setback is included to address shadow flicker, it should be linked to a specific flicker threshold rather than applied as a standalone distance Automatic shut-off systems are often a more precise and less restrictive alternative to large setbacks for this concern alone.
Q: How do safety setback distances vary across jurisdictions, and what approach works best for local ordinances?
A: Jurisdictions across the country vary significantly in their approach, reflecting differences in local risk tolerance, turbine size, and nearby land uses.9
● Some counties use fixed distances from residences or property lines
● Others use a multiplier of the total turbine height
● Variation reflects local risk tolerance, turbine size, and nearby land uses
A multiple approach is administratively simple, scales automatically with project size, and allows local ordinances to remain protective as turbine sizes change over time, making it a practical starting point 9 Planners might consider reviewing the specific turbine specifications proposed, particularly total hub height, and calibrate setbacks accordingly.
When reviewing a proposed project, confirm that the local ordinance specifies whether setback distances apply to the hub height or total tip height; the difference can be significant for modern utility-scale turbines
A 1000-foot setback is a commonly cited starting point for noise-related setbacks in Iowa 2 Safety setbacks based on a hub height multiplier may produce different distances; treat the two rationales separately in ordinance drafting
Q: What are the primary planning concerns for utility-scale solar setbacks?
A: For solar PV installations, setback requirements are primarily driven by three land use compatibility concerns: visual impact, traffic safety, and noise from inverters and equipment 4 Unlike wind turbines, solar panels pose no structural safety risk to neighbors, so the rationale is grounded entirely in nuisance and compatibility.
● Visual screening: Setbacks from property lines and roads can reduce visual exposure to adjacent land uses. Where setbacks alone are insufficient, mixed evergreen and deciduous vegetative screening is generally more efficient than large setback distances for addressing visual impact 4 Planners can require developer-funded screening plans as a condition of approval, specifying plant species, height at maturity, and maintenance obligations
● Traffic safety: Road setbacks protect sight lines along public rights-of-way and reduce conflict between solar access roads and public traffic Many jurisdictions require a minimum setback from road rights-of-way, often 50-150 feet, as a standard ordinance requirement 4
● Noise: Solar inverters and cooling equipment can generate low-frequency noise audible at close range Property line setbacks help buffer these impacts on neighboring uses 3
Q: Should planners require glare analysis for solar projects?
A: Modern anti-reflective panel coatings have largely eliminated glare as a concern for typical residential neighbors The FAA revised its policy in 2021, finding that solar glint and glare near airports is comparable to reflections from water surfaces and glass buildings 5 However, glare analysis is still required at federally obligated airports with control towers; planners should verify whether a proposed site is within an airport influence area before waiving this requirement
When reviewing utility-scale solar applications, planners might consider focusing regulatory attention on stormwater and vegetative screening rather than distance-based setbacks alone. Require developers to submit a stormwater management plan and a landscape screening plan as part of the conditional use permit process
Consider updating local ordinances to specify: (1) minimum perennial vegetative cover requirements post-construction, (2) screening species requirements appropriate to the local climate, and (3) a long-term maintenance and bond requirement for vegetative buffers
** Key Resources: APA PAS Memo Utility-Scale Solar (2019) | PA DEP Stormwater Best Management Practices
Q: How does fire code drive setback requirements for battery storage facilities?
A: BESS setback requirements serve two distinct purposes that planners should understand separately.
● Unit-to-unit separation (fire code): Within a facility, spacing between ESS units is governed by fire and building codes, principally NFPA 855 and UL 9540, not by planning ordinance NFPA 855 Section 15 5 requires a minimum 3-foot gap between ESS units unless the manufacturer demonstrates through a UL 9540A fire test that a smaller gap is safe 6 These separation distances contain thermal runaway cascade failures and are determined in coordination with local fire officials, not through the zoning process.
● Property line setback (zoning): At the property line, setbacks are a local zoning tool, most often used to address noise BESS facilities generate noise from cooling systems, inverters, and transformers, and property line setbacks help buffer these impacts on neighboring uses 8 Most jurisdictions with BESS-specific zoning set property line setbacks of 50-150 feet, depending on adjacent land use
Real-World Validation: Australia (2021)
A fire at a Tesla battery facility was contained to one of 212 units, with only minor damage to adjacent units This event occurred despite wind speeds being three times the test baseline This outcome validated that the NFPA 855 separation distance standard is effective under real-world conditions Planners can cite this case when communicating the rationale for separation requirements to the public.
Planners are not expected to interpret fire codes directly, but they play a critical role in ensuring that fire officials are engaged early in the BESS project review process. As part of the conditional use permit process, planners might consider requiring developers to submit the following: (1) documentation of compliance with NFPA 855 separation distances, (2) a UL 9540A test report if reduced spacing is proposed, and (3) a pre-incident plan developed in coordination with the local fire department 6
When updating local zoning ordinances for BESS, planners should incorporate fire code requirements as minimum standards and consider requiring independent peer review for larger installations, as New York State has done for facilities exceeding certain capacity thresholds
** Key Resources: NFPA 855 (2023) | PNNL Energy Storage in Local Zoning Ordinances (PNNL-34462)
[1] DOE WINDExchange. Shadow Flicker Information.
[2] Iowa Environmental Council (IEC) Wind Siting Best Practices (2019)
[3] Barbose, G et al (2023) Good Fences Make Good Neighbors: Solar Siting and Land Use Compatibility Lawrence Berkeley National Laboratory
[4] APA PAS Memo: Utility-Scale Solar (2019)
[5] FAA Policy Review of Solar Energy System Projects at Federally Obligated Airports (May 2021)
[6] NFPA 855. Standard for the Installation of Stationary Energy Storage Systems (2023).
[7] Hoen, B et al (2023) Although Wind Farm Neighbors Notice Turbine Shadow Flicker, Few Are Annoyed By It. Lawrence Berkeley National Laboratory / Energy Research and Social Science
[8] Twitchell, J. B., Powell, D. W., & Paiss, M. D. (2023). Energy Storage in Local Zoning Ordinances (PNNL-34462) Pacific Northwest National Laboratory
[9] NREL / Open Energy Data Initiative Wind Energy Setback Requirements from Structures, County Ordinance Dataset (April 2022)
[11] Shuyang Shi How Does Renewable Energy Siting Connect to Land Use Planning? (Factsheet, 2026)
[12] Yuyang Ding Fire Safety & Planning Consideration for BESS (Factsheet, 2026)
What Should Communities Expect
Renewable energy construction involves months of heavy equipment, traffic, grading, and site disturbance The scale and duration of impacts vary by technology and project size Proper planning, which includes traffic management plans, road use agreements, and stormwater controls, can effectively manage disruption and minimize temporary impacts
A critical distinction for planners and communities: the total development period (encompassing permitting, interconnection, and financing) spans several years and is very different from the on-site construction period, when actual community disturbance occurs Local ordinances and public notices can help communities by defining 'construction period' explicitly so that residents understand when to expect disruption and when it will end
Q: How long does renewable energy construction typically last?
A: On-site construction durations vary significantly by technology The following ranges reflect typical utility-scale projects in the U S , based on EIA, SEIA, and NREL data 1, 2, 3:
(standalone)
Large co-located solar+BESS projects may extend to 4+ years total
When reviewing development applications, planners can help communities better anticipate construction impacts by requiring applicants to clearly distinguish between the total development period and the on-site construction period in all public notices and permit documents. Defining 'construction period' explicitly in local ordinances, with start and end triggers tied to physical site activity, helps manage community expectations and provides a clearer basis for enforcing working hour limits, noise controls, and traffic management requirements.
Requiring developers to provide a construction schedule as part of the conditional use permit application gives planners and residents a shared reference point before approval, not after the first truck arrives ** Key Resources: EIA
Q: What is the difference between a Traffic Management Plan and a Road Use Agreement?
A: These are two distinct tools that serve different purposes and are typically held by different parties. A key distinction for communities: renewable energy projects generate heavy traffic during construction but very little once operational, making construction-phase traffic management a time-limited but high-priority planning concern. The TMP addresses safety during that window; the RUA protects public infrastructure throughout and after it
Traffic Management Plan (TMP) 8
Purpose: Manages traffic flow and safety during construction
Covers: Haul routes, delivery schedules, turning zones, pedestrian safety, signage, and community notification
Held by: Developer, submitted as part of permit application
Road Use Agreement (RUA) 9
Purpose: Protects the condition of public roads and assigns responsibility for repair and restoration
Covers: Pre-construction survey, performance bond, restoration standards, traffic caps, and emergency vehicle priority
Held by: County or local government, negotiated with the developer before groundbreaking
Q: Which level of government negotiates and holds a Road Use Agreement?
A: This varies by state and project type, and planners should verify the answer for their jurisdiction before a project is proposed In general:
● In most Midwest states (Iowa, Minnesota, Illinois), county governments hold RUAs for utility-scale wind and solar projects that use county roads as haul routes 4
● In some states, township road authorities may hold RUAs where township roads are affected, separate from the county agreement 10
● Separate RUAs may be necessary for projects that cross multiple jurisdictions, involving each affected county or township 11
● State departments of transportation (DOTs) may hold separate agreements for state routes used as haul routes, particularly for oversize/overweight wind component transport 3
Planners can help clarify jurisdiction early in the pre-application process, before a developer assumes one government entity handles all road agreements. Identifying the relevant road authority for each segment of the haul route at the outset helps prevent delays and gaps in road protection during construction
** Key Resource: Westwood Professional Services Road Use Agreements: How to Reduce Risk Exposure
Q: What should an effective Traffic Management Plan include?
A: An effective TMP addresses community safety and communication throughout construction
Key components include:
● Current road condition analysis along all proposed haul routes
● Designated haul routes and delivery schedules, including daily vehicle count limits and restricted hours
● Large equipment turning zones and temporary road widening locations
● Pedestrian and cyclist protection measures at road crossings
● Public notification plan: via signage, direct community outreach, and accessible online updates
The public domain has limited published TMP examples for renewable energy construction Planners can request TMP samples from state energy offices or peer counties that have recently permitted similar projects, particularly in Iowa, Minnesota, and Texas, where large-scale wind and solar development is well-established NREL’s Wind Farm Construction and Decommissioning Guide provides a useful framework for understanding construction-phase traffic impacts, and FHWA’s Work Zone Traffic Management guide outlines the core components that an effective TMP should address 3, 8
Q: What should an effective Road Use Agreement include?
A: An RUA is the county's primary legal protection during construction Using an independent pre-construction survey of road conditions as the contractual baseline, rather than vague language like 'prior condition,’ can significantly reduce conflict and clarify restoration obligations Core RUA components include:
● Pre-construction road condition survey by an independent engineer, used as the contractual baseline 9
● Performance bond in place from the groundbreaking through the commercial operation date 9, 10
● Obligation to restore roads to equal or better condition, with specific and measurable standards 9
● Daily traffic caps and working hour limits to minimize community disruption 4
● Emergency vehicle priority provisions on all haul routes 10,11
Planners can strengthen road protection by incorporating RUA requirements into local zoning ordinances or conditional use permit conditions before a project is proposed, so developers know the expectations in advance Raising road impact questions at the pre-application stage gives the county more negotiating leverage than waiting until a project is already designed
When reviewing RUA language, coordinate with the county attorney and highway engineer early Weak RUA language transfers risk to the county, and vague restoration standards have led to disputes and costly settlements in documented cases Specific, enforceable standards and an adequate performance bond are the county's most important protections.
** Key Resource: Westwood Professional Services Road Use Agreements: How to Reduce Risk Exposure
Q: What federal requirements govern stormwater management during renewable energy construction?
A: The Clean Water Act's National Pollutant Discharge Elimination System (NPDES) Construction General Permit (CGP) is the primary federal framework 5 It is administered by the U S EPA but delegated to state environmental agencies in most states, meaning the specific requirements and enforcement authority vary by state.
● Federal baseline: All construction sites disturbing one or more acres must obtain NPDES permit coverage and develop a Stormwater Pollution Prevention Plan (SWPPP). The SWPPP identifies site-specific erosion and sediment controls and must be implemented before ground disturbance begins. 5
● State variation: States with delegated NPDES authority administer their own permit programs, which may be more stringent than the federal baseline. Planners should verify the permitting authority and specific requirements in their state In some states, this is the environmental quality department; in others, a water resources or natural resources agency 5
SWPPP compliance is a critical risk management issue, not merely an engineering checkbox. Inadequate erosion control during construction can result in significant legal liability for both the developer and potentially the permitting jurisdiction A Georgia solar farm case resulted in substantial jury damages for environmental harm caused by inadequate erosion controls, a well-documented example of the consequences of SWPPP non-compliance
** Key Source: TRC Companies, Solar Energy and Stormwater: Erosion, Sediment, and Their Controls
Q: What are the key erosion and sediment control measures used during construction?
A: Standard ESC measures include several complementary approaches that are typically required in combination 5,6:
● Silt fences and sediment barriers: Filter sediment at site perimeters and along disturbed slopes
● Check dams: Reduce flow velocity in drainageways and allow sediment to settle before runoff leaves the site
● Sediment basins: Provide temporary retention of stormwater runoff during active construction phases
● Stabilized construction entrances: Prevent tracking of mud and sediment onto public roads, required at all site entry points under most state programs
● Stockpile management: Isolate soil stockpiles from drainage pathways to prevent sediment-laden runoff
Vegetation as long-term stormwater control: Revegetation is the most effective long-term erosion control measure 6 Several states, including Illinois, Maryland, Michigan, Minnesota, and Vermont, have adopted pollinator-friendly solar siting standards that require or incentivize native seed mixes under and around solar panels 6 These standards serve dual purposes: stormwater management and ecological co-benefits. Minnesota's 2016 pollinator-friendly solar program was among the first in the U S and has informed similar policies in other states 7
Planners can strengthen stormwater protection by requiring developers to submit a SWPPP and an erosion and sediment control plan as part of the conditional use permit application, before ground disturbance begins Coordinate with the state environmental agency early to understand whether the local government has any co-permitting role or inspection authority under the state NPDES program
When updating local ordinances, consider including language that: (1) requires a SWPPP as a permit condition, (2) specifies stabilized construction entrance requirements at all access points, and (3) addresses post-construction revegetation standards, including native or pollinator-friendly seed mixes where appropriate for the site context.
** Key Resources: U S EPA NPDES Construction General Permit | EPA National Menu of BMPs for Stormwater | SolSmart Solar Land Use and Stormwater Management
[1] U.S. Energy Information Administration (EIA). Preliminary Monthly Electric Generator Inventory
[2] Solar Energy Industries Association (SEIA) Solar Industry Research Data
[3] NREL Wind Farm Construction and Decommissioning Guide
[4] Iowa Environmental Council (IEC). Wind Siting Best Practices (2019).
[5] U.S. EPA. NPDES Construction General Permit (CGP).
[6] U.S. EPA. National Menu of BMPs for Stormwater Construction.
[7] SolSmart Solar Land Use and Stormwater Management (2021)
[8] FHWA Work Zone Traffic Management: A Guide for Local Officials
[9] Westwood Professional Services Road Use Agreements: How to Reduce Risk Exposure
[10] Logan County, Illinois Highway Department Road Use Agreement, Sugar Creek Wind Farm
[11] Logan County Board Top Hat Wind Energy Project Conditional Use Application (2022)
What Conditions Are Attached to Siting Permits and How Are They Enforced? Jeewon Suh | 2026 04
Siting permits for renewable energy projects, typically issued as Conditional Use Permits (CUPs) or Special Use Permits (SUPs), may carry specific conditions across the full project lifecycle from construction through operation to decommissioning Not all CUPs or SUPs include wide-reaching conditions; the scope depends heavily on state enabling legislation, local ordinance language, and the specific project being reviewed
A critical distinction shapes how enforceable permits are written: many protections communities want, such as noise limits, setbacks, and screening requirements, are more appropriately set as standards within the local zoning ordinance rather than as individualized conditions of approval 1 Conditions of approval are project-specific commitments tied to a particular permit, such as a post-construction acoustic study, a decommissioning financial instrument, or 24-hour emergency contact signage Getting this distinction right and building local capacity to monitor and enforce conditions over a project's lifetime determines whether communities are actually protected
Q: What is the difference between a permit condition and an ordinance standard?
A: This distinction is fundamental to writing enforceable permits, and confusion between the two is one of the most common pitfalls in renewable energy siting:
● Applies universally to all projects of that type in the jurisdiction
● Set in advance through the ordinance update process
Examples: setback distances, maximum noise levels, screening requirements, height limits
● Project-specific commitments attached to a particular permit
● Negotiated during the permit review process
Examples: post-construction acoustic study, decommissioning financial instrument, 24-hour emergency contact, vegetation establishment timeline
In practice, many communities inadvertently draft approval conditions that repeat ordinance standards verbatim or, worse, attempt to set standards through conditions that have never been codified in the ordinance Both approaches create enforcement problems If a noise limit is a condition rather than an ordinance standard, it may not survive a legal challenge 2 If it is an ordinance standard, it doesn't need to be repeated in each permit; it applies automatically 1
Before drafting permit conditions, planners can benefit from reviewing the UM Graham Sustainability Institute's 'Ongoing Zoning Compliance' framework (graham umich edu/media/files/btb-guide pdf, p 11, Strategy #1) and the model condition language in Appendix C. These resources provide a practical template for distinguishing between what belongs in the ordinance and what belongs in a CUP condition
A useful starting question when drafting any condition: 'Does this protect the community from something specific to this project, or is it a standard we want to apply to all similar projects?' If the latter, it belongs in the ordinance, and the permit review process is an opportunity to identify gaps in local ordinances that need to be addressed before the next project arrives
** Key Resource: U-M Graham Sustainability Institute, Renewable Energy Siting Guide and Appendix C
Q: How should noise standards be addressed in the permit process?
A: Noise limits are ordinance standards They apply universally and are best set in advance through the local ordinance, not negotiated project-by-project. The permit process should focus on how to verify compliance, not the noise limit.
● Ordinance standard (set in advance): Quantitative noise limits, such as a maximum dB(A) level at the nearest non-participating residence during daytime and nighttime hours, are more enforceable than vague language like 'minimize noise ' State siting standards can provide a useful reference point: for example, New Hampshire's SEC standard 3 and Wisconsin's PSC wind noise protocol 4 both use specific dB(A) thresholds referenced to background levels.
● Condition of approval (project-specific): A qualified independent acoustician conducts a post-construction acoustic study that compares measured sound levels against the ordinance standard, making it an appropriate condition of approval This approach is meaningfully different from on-paper noise modeling: a field study captures actual site conditions, topography, and operating characteristics that pre-construction models may not reflect
Q: How should construction hours and vegetation screening be addressed in the permit process?
A: The same ordinance standard vs. condition of approval distinction applies:
● Construction hours are ordinance standards; hour restrictions apply to all similar projects in the jurisdiction and are more consistently enforced when codified in the ordinance rather than set individually per permit
● Vegetation screening requirements, minimum buffer widths, species mix, and height at maturity are ordinance standards However, a vegetation establishment timeline, a maintenance bond, and reporting obligations are appropriate conditions of approval tied to the specific project
When reviewing a proposed project, planners can assess whether the local ordinance already contains clear, quantitative noise limits and construction hour restrictions If not, the permit review process is a signal that an ordinance update may be needed, but attempting to fill that gap through permit conditions alone is not a reliable substitute
** Key Resources:
Q: How should stormwater requirements be structured in the permit process?
A: Stormwater management requirements span both ordinance standards and permit conditions, and the distinction matters for enforcement:
● Ordinance standard: requiring a stormwater management plan prepared by a licensed professional engineer as part of the permit application; this applies to all projects above a threshold size.
● Permit condition: the specific stormwater management plan submitted for this project, with performance benchmarks, an inspection schedule, and a mechanism for addressing non-compliance
● Permit condition: a post-construction stormwater audit by an independent engineer, verifying that installed controls meet design specifications
Some states have developed solar-specific stormwater guidance that planners can reference when reviewing applications Minnesota's Pollution Control Agency (MPCA), for example, provides technical guidance on vegetation management beneath solar panels as a stormwater best management practice, recognizing that well-managed ground cover under panels can meaningfully reduce runoff compared to bare or conventionally mowed sites 7
Planners can strengthen stormwater protection by ensuring that the local ordinance requires a professional engineer-prepared stormwater plan as a condition of permit application, so the expectation is set before a specific project is reviewed. During permit review, the condition of approval can then focus on project-specific commitments: the approved plan, inspection timeline, and reporting obligations
** Key Resources: EPA NPDES Permit Basics | MN MPCA Stormwater Guidance for Solar
Q: What is the role of decommissioning in the permit process?
A: Decommissioning planning is one of the areas where permit conditions play the most important role because it addresses what happens at the end of a project's life, long after the permit was issued and the developer may have changed. The core condition is straightforward: the developer maintains a financial instrument, for example, a surety bond, letter of credit, or escrow account, sufficient to cover the cost of site restoration if the facility is abandoned or the developer is unable to fulfill decommissioning obligations.
● Why financial assurance matters: Without a financial instrument in place, decommissioning costs can fall on local governments or landowners if a developer defaults The cost of decommissioning varies significantly depending on project size, technology, site conditions, and salvage value of materials, meaning the appropriate bond amount should be based on an independent cost estimate rather than a developer's self-assessment.
● Abandonment trigger: Most ordinances define abandonment as a failure to operate for a consecutive period, typically 12 months, triggering the decommissioning obligation. 8, 9 The permit condition can specify the abandonment definition, the timeline for initiating decommissioning, and the process for releasing the financial instrument once site restoration is complete
The bond amount is only as protective as the cost estimate it is based on Planners can require that decommissioning cost estimates be prepared by an independent engineer, not the developer, and updated periodically over the project's life to reflect current material and labor costs This is particularly important for large projects where the gap between a low and high estimate can be substantial 10 For in-depth guidance on decommissioning financial assurance structures, see the work of Shengrui Chang’s factsheet on renewable energy decommissioning policy 11, 12
Decommissioning conditions are one area where planners can add significant value by ensuring that the financial instrument requirement is built into the ordinance so it applies to all projects and that the permit condition specifies an independent cost estimate process, a periodic update schedule, and a clear abandonment definition For model decommissioning condition language and a framework for ongoing zoning compliance, see Appendix C of the U-M Graham Sustainability Institute's renewable energy siting guide ** Key Resource: U-M Graham Sustainability Institute
What enforcement tools are available for local governments?
A: Enforcement authority for renewable energy permits varies by state, but local governments generally have several tools available The key is having a codified process so that both staff and residents know what to expect when a concern is raised
Stop Work Order 2 Immediately halts construction or operation pending investigation. Most effective when trigger conditions are clearly defined in the permit or ordinance.
Penalties 2 Financial penalties for permit violations Enforceability depends on whether the permit specifies penalty amounts and a process for assessment.
Revocation 2
tool: may terminate the project Typically requires documented repeated violations and a due process hearing
Draw 2, 11, 12 If a developer fails to meet decommissioning or restoration obligations, the financial instrument can be drawn to fund remediation.
Q: What makes a complaint process effective?
A: A complaint-driven process is only as effective as the documentation and response timeline behind it. 2, 5 Key elements that make complaint processes work in practice:
● 24-hour emergency contact signage at all facility entrances, so residents and emergency responders know who to call 1
● A defined intake process: who receives complaints, how they are logged, and what triggers an inspection 2
● A response timeline: how quickly the jurisdiction will respond to a complaint, and what happens if the developer does not respond
● A clear escalation path: warning → notice of violation → citation → penalty, with each step defined in the ordinance or permit
● For noise complaints specifically, the response standard is an independent acoustic measurement compared against the permit threshold, not a response from the developer
Planners can strengthen enforcement capacity by ensuring that the local ordinance codifies the complaint and enforcement process before a project is approved, including intake procedures, response timelines, and escalating penalties. A process that exists only informally or at staff discretion is difficult to enforce consistently over a project lifetime of 20-40 years
The North Carolina Local Government Enforcement Guide provides a practical framework for codifying enforcement processes for development regulations that can be adapted for renewable energy permit conditions.
Drawing on the preceding sections, an enforceable permit for a renewable energy project can benefit from the following principles1, 5:
1 Use quantitative standards: vague language like 'minimize noise' or 'adequate screening' is difficult to enforce. Specific, measurable thresholds are more defensible.
2 Distinguish ordinance standards from conditions of approval: avoid repeating ordinance requirements as conditions and avoid setting standards through conditions that belong in the ordinance
3. Require independent monitoring and verification: post-construction acoustic studies, independent stormwater audits, and third-party inspections are more reliable than developer self-reporting alone
4 Secure decommissioning financial assurance before groundbreaking: based on an independent cost estimate, with periodic updates over the project's life
5 Codify the complaint and enforcement process: intake procedures, response timelines, and escalating penalties should be in the ordinance before the first project is approved
6 Keep ordinances current: permit review is an opportunity to identify gaps If a condition is being added to address something the ordinance does not cover, consider whether an ordinance update is needed before the next project
[1] U-M Graham Sustainability Institute. Renewable Energy Siting Guide & Appendix C.
[2] UNC School of Government. Enforcement of Development Regulations (2022).
[3] NH Site Evaluation Committee (SEC). Sound Standards for Wind Energy Systems.
[4] Wisconsin Public Service Commission (PSC) Wind Energy Siting Handbook
[5] UNC School of Government / Coates' Canons Types of Development Decisions
[6] U S EPA NPDES Permit Basics [Section 3&5]
[7] Minnesota Pollution Control Agency (MPCA) Stormwater Guidance for Solar [Section 3]
[8] Indiana Office of Energy Development County Zoning Ordinances for Solar Energy Ready Standards (2023).
[9] NYSERDA Solar Guidebook for Local Governments: Decommissioning (2022)
[10] Schube, C & National Center for Energy Analytics A State-by-State Assessment of Financial Assurances Required for Decommissioning Wind and Solar Facilities (2025)
[11] Shengrui Chang What Happens at the End of Life of Renewable Energy Projects? (Factsheet, 2026)
[12] Shengrui Chang End-of-Life Material Management: Reuse, Recycling, and Disposal of Solar Panels, Wind Turbines, and Batteries (Factsheet, 2026)
By Nathan Jindra April 2026
Who makes the siting decision for wind, solar, or battery energy storage system (BESS) projects?
It depends Very often, siting is a combination of state and local authority, either implicitly or explicitly
Siting authority is the legal power granted to governmental bodies (local, state, or federal) to approve, permit, and determine the location of energy projects like pipelines, power plants, and renewable energy facilities.
States delegate permitting authority to local jurisdictions to varying degrees, typically by delegating authority to county governments, and to a lesser extent, to town governments, especially in the northeastern U S Most states have some combination of state and local authority ¹
A key finding from a state-by-state policy analysis by the Department of Energy is that, while 97% of states maintain some state-level control of the permitting process, 73% of states empower local authorities to determine the siting standards [or at least have a role in setting standards].²
There are many ways to classify states, but they often fall into 4 main categories: Local, hybrid, contingent, or state siting. Different studies have labeled them in different ways, with two main examples shown here.
One study, “Laws in Order: An Inventory of State Renewable Energy Siting Policies”, published in 2024, created this map below in order to classify states in these four ways, with “both” standing in for hybrid ³

Cost Estimates
Project Timeline
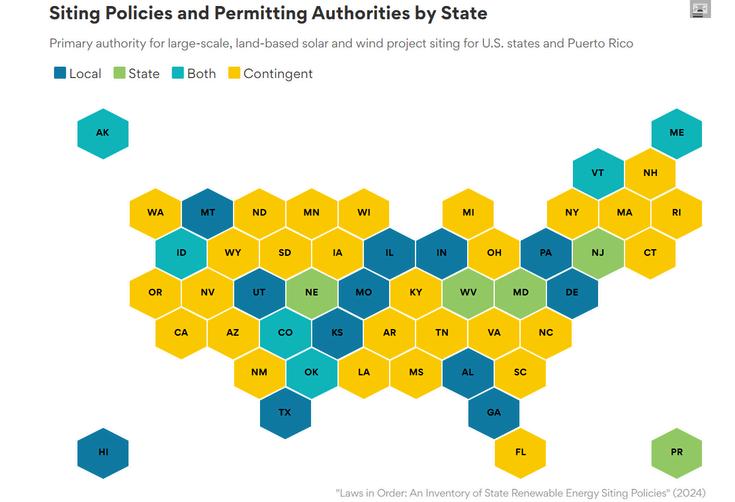
Another report created by the group Energy and Environmental Economics shows these different options on a spectrum from local to state, with slightly more detail and categories of hybrid and contingent states, shown directly below ⁴
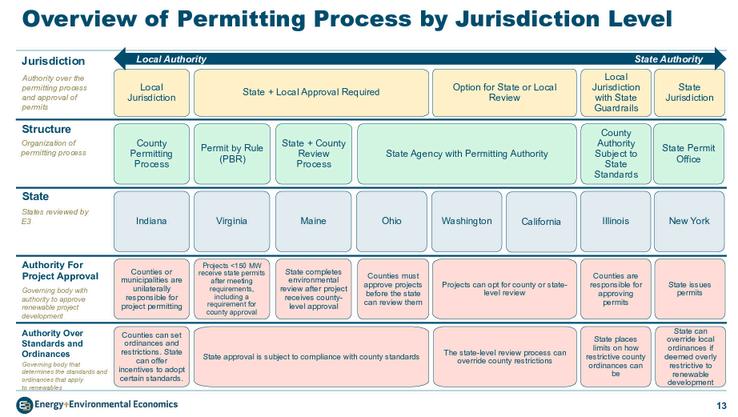
Floor Plans and Elevations
STATE-LEVEL SITING
Example states: CT, MD, VT, WV
The state has ultimate authority over permitting and siting, and can override local ordinances if they are too restrictive
HYBRID/CONTINGENT SITING
Example states: Most of them
Hybrid states provide state and/or local siting upon discretion or actions of the developer, state government, or local government
Hybrid siting authority is often a combination of authority, or the developer can opt in or opt out of state processes.
Contingent projects’ siting authority is typically decided by the size (in megawatts) of the project. In 27 states, principal authority for siting and permitting depends on project size, with larger projects typically sited at the state level though project size thresholds differ significantly from state to state.
LOCAL-LEVEL SITING
Example states: AZ, AL, CO, DE, GA, ID, IN, KS, MO, MT, NE, OK, PA, TX, UT
Local governments make all permitting decisions.
For more information on differences in state siting policies or for information on your state, a comprehensive overview can be found at The State Climate Policy Dashboard,⁵ or in the appendix of the Clean Tomorrow and Siting Solutions Project Insight report ⁶
Usually, state boards can only preempt local zoning when the state has explicit siting authority. However, 14 states have enacted policies that would preempt local siting rules and that apply to, at minimum, conventional wind or solar projects of 50 megawatts (MW) or more ⁵
A state may consider preempting local zoning through the passage of these policies if the state’s government is friendly to renewable energy development and local governments in the state are not
A developer may still use community engagement and may still interact with the community when siting their project, even if the state controls permitting Sometimes, in fact, state-level permitting processes require the developer to have local community engagement.
Residents can voice their concerns or ideas at public hearings hosted by the community and/or the developer, and the developer may make changes based on feedback. These concerns could be voiced through public comment processes, litigation, or advocacy.
According to a University of Michigan and Michigan State University guide as well as a 2024 survey of developers, residents can often influence projects through topics like “vegetative screening, excluding properties, setbacks, compensation, decommissioning, community benefits agreements, and revenue use”.⁷
In most states, a Public Utility Commission (PUC), also called the Public Service Commission or the Board of Public Utilities, is involved in the siting process, specifically by issuing a CPCN, a certificate of public convenience or necessity (or something similar). PUCs typically have the mandate to determine that infrastructure projects proposed by both utilities and developers do not threaten economic, recreational, aesthetic, and environmental land uses or unduly raise electricity prices for customers ⁸ PUCs typically enforce these rules over all Investor Owned Utilities (IOUs) in their state However, in some states, independent power producers (IPPs) may be able to build, generate, and sell power without obtaining a certificate of necessity from the PUC.⁹ PUCs have little power over the actual siting process but can influence a project’s effect on consumers.
As with many things, there are trade-offs between state- and local-level siting authority State-level authority may yield more predictable outcomes and mitigate excessive compliance costs from inconsistent or onerous local requirements, but may take longer due to its comprehensive review processes.¹⁰ By contrast, local siting may provide fairer procedural outcomes for host community members, could provide greater net benefits to project host communities, and could mitigate community opposition, though a study finds that the level of siting authority does not significantly affect public participation in project planning.¹¹
Even when local siting is the primary method, many states often have maximum or minimum requirements on procedures or project size
Both major political parties in the US agree that siting reform is needed, but have found it hard to agree on a solution.² Note the cases of California and Texas, two states with substantially different siting authority distributions, both achieved nation leading levels of renewable energy development.¹⁰
Regardless of the level of siting authority, there are often opportunities for engagement. It is important that residents and stakeholders understand the goal of each engagement session, and planners can help set clear expectations of what the purpose of each session is. Different types of community engagement include sessions to inform, consult, collaborate, or request feedback. Planners and other officials can take feedback from the sessions that call for it and see that it applies through reasonable discussion on changes in the project
1.Howdoespermittingforcleanenergyinfrastructurework? (n.d.).Brookings. https://wwwbrookingsedu/articles/how-does-permitting-for-clean-energy-infrastructure-work/
2.Sitingof Large-ScaleRenewableEnergyProjects.(n.d.).Energy.gov. https://www.energy.gov/cmei/systems/siting-large-scale-renewable-energy-projects
3 LawsinOrder:AnInventoryof StateRenewableEnergySitingPolicies| EnergyMarkets& Planning (n.d.).https://emp.lbl.gov/publications/laws-order-inventory-state-renewable
4 Alagappan,L ,Spencer,S ,Shenhar,J ,Danielyan,E ,& Charles,P (nd) Assessmentof Renewable EnergySiting and Permitting Policies.EnergyandEnvironmental Economics. https://wwwethreecom/wp-content/uploads/2024/04/Renewable-Siting-and-Permitting-PoliciesE3-Public-Version-04.17.2024.pdf
5 ConsolidatedStateSitingandPermittingAuthority| StateClimatePolicyDashboard (nd) https://www.climatepolicydashboard.org/
6 Breckel,A ,& Falkenburg,N (nd) StatePolicyApproachestoRenewableEnergySiting Clean TomorrowandtheSitingSolutionsProject https://sitingsolutionscom/wpcontent/uploads/2025/12/Renewable-Energy-Siting-Policy-Field-Guide.pdf
7 Bessette,D J ,& Hoen,B (nd) AGuideToHostingCommunityConversationsAbout Large-Scale Solar Development.https://www.canr.msu.edu/csus/FINAL%20CCSD-Guidebook.pdf
8 Kappas,Eva StatePermittingPoliciesandBest Practicesfor Electrical TransmissionintheNortheastMidwest Region.2024.Northeast-Midwest Institute.https://www.nemw.org/wpcontent/uploads/2024/06/State-Permitting-Policies-for-Electrical-Transmission-NEMWIpdf
9.BackgroundDocument:AnOverviewof PUCsfor StateEnvironment andEnergyOfficials.(May20, 2010) US Environmental ProtectionAgency epa gov https://wwwepa gov/sites/default/files/201603/documents/background paper.pdf
10.Goslowtogofast? Areviewoftheimpactsof permittingonlarge-scalesolar projectdevelopment. (2025) EnergyResearch & Social Science,127,104318 https://www.sciencedirect.com/science/article/pii/S2214629625003998
11 Jacquet,J B (2015) Theriseof “privateparticipation”intheplanningofenergyprojectsintherural UnitedStates.Society& Natural Resources,28(3),231-245. https://doiorg/101080/08941920 2014945056
By Nathan Jindra April 2026
What permits are typical for wind, solar, or battery energy storage system (BESS) projects?
Most projects require approval from all levels of government: local, state, interstate/regional, and federal A wide variety of permits are needed for approval of a project
Typically, a renewable project requires a land-use or zoning permit based on the zoning and planning ordinances of the city or county government in which it would be sited ¹
These land-use permits may be conditional or special use permits if renewable energy projects are not typically allowed on the site by-right.
Building or electrical permits, issued by local governments, may be required to verify structural integrity, load calculations, and wind resistance, and to confirm electrical safety. Some states may exempt power plants from these permits, but still require zoning permits ²
Soil erosion permits are needed to make sure there will not be significant sediment buildup due to the project Sediment is one of the largest volume polluters of lakes and streams ³ Uncontrolled erosion can increase flooding, cause the loss of fertile topsoil, and fill in rivers While soil erosion regulations vary, in Michigan, for example, a permit is generally required for any earth change activity which disturbs one or more acres of land or which is within 500 feet of a lake or stream.⁴ In South Carolina, this 1 acre regulation is the same, but they also require that projects in any of 8 coastal counties require a Coastal Zone Consistency Certification.⁵ For more information on erosion and soil health, see our Environmental Impacts factsheet.
Even in states without state-level siting, if a public utility interacts with a renewable project, such as buying the project itself or buying power, they typically must obtain a certificate A certificate is a type of siting permit from a government body that allows a type of use based on its effects These siting permits are usually called a “Certificate of Public Convenience and Necessity” or “Certificate of Public Good” and are commonly issued by the state public utilities commission.¹ New transmission projects also will require a certificate of public convenience and necessity (CPCN) from the utility commission.
20 states have modeled their own laws after the National Environmental Policy Act (NEPA), which are called SEPAs or Little NEPAs, and may give approvals to renewable projects on state land ⁶ However, if a NEPA review is already needed or completed, a state may not require their own SEPA review For example, Wisconsin state agencies do not require their own state review if a project already requires a NEPA review ⁷
A state department of transportation may also issue oversize/overweight permits for the movement of vehicles or loads needed for construction to travel on state and federal highways which exceed the size or weight limitations specified by law.⁸
A state (or local) department of transportation may also issue a right-of-way permit if construction requires blocking off a road or working in a setback area.⁹
Renewable energy projects need to connect to the “regional transmission network” in order to deliver their power to customers.
These networks are called Regional Transmission Organizations (RTOs) or Independent System Operators (ISOs) and may exist at the state level (such as the CAISO¹⁰ in California or ERCOT¹¹ in Texas) or regional level (such as the PJM¹² in the Eastern United States).
Regional EPA offices usually review renewables projects for compliance with the Clean Air Act and Clean Water Act, focusing on permits, discharges, and emission standards.¹³ Renewable energy projects often need Clean Air Act and Clean Water Act permits during their construction phases as construction entails some regular pollution from sources such as vehicles and generators.¹⁴
Figure 1 shows that wind and solar generators seldom require one of the three most laborious federal permits: an Environmental Impact Statement (EIS), a 404 wetlands permit, or a Habitat Conservation Plan. Between 2010 and 2021, fewer than 5 percent of the 1,883 total wind and solar projects required one of those permits.¹⁵
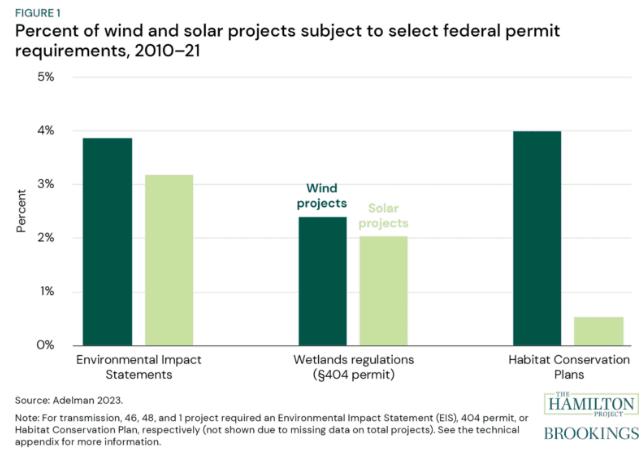
NEPA, the landmark federal environmental protection law, does not mandate a separate permit like the other laws mentioned below. Instead, it is a procedural law, requiring an assessment of the environmental impacts of any significant federal action, including any project that the federal government issues a permit for As a first step, agencies will prepare Environmental Assessments (EAs) to determine whether a proposed action has the potential to cause significant environmental impacts Many times, EAs are drafted by the developer and then reviewed and adopted by the agency This EA can lead either to a FONSI, a Finding of No Significant Impact, or an EIS, an Environmental Impact Statement, for projects that do have significant impacts
Projects affecting wetlands, waterways, or harbors require a Section 404 permit from the US Army Corps of Engineers. This includes all offshore wind projects, which affect harbors, and often includes transmission lines, which may cross over wetlands or waterways.¹⁶
The Endangered Species Act (ESA) requires permits if renewable energy projects in any way affect endangered or threatened species, or migratory birds, eagles, marine mammals, or fish.¹⁷ This is especially important for offshore and onshore wind projects.
One of these permits is a Habitat Conservation Plan. These are planning documents designed to accommodate and authorize the limited and unintentional “take” of listed species A take is any action that can harass, harm, wound, kill, trap, or capture animals that are endangered or threatened If the U S Fish and Wildlife Service finds an HCP meets the specified criteria, it issues an incidental take permit This allows the permit holder to proceed with an activity that could otherwise result in the unlawful take of a listed species ¹⁸
The FAA also requires permits for any structure taller than 200 feet Wind turbines are commonly double or triple this size, so each individual turbine in a project requires a permit This is to ensure they do not interfere with flight paths or cause other flight disruptions ¹⁹
Only about 4% of operating renewable energy capacity is sited on federal lands, which means federal agencies are rarely the primary authority for permitting ²⁰ Further, most renewable energy projects on federal lands receive streamlined federal permitting reviews, and projects are rarely contested through federal litigation ²¹ From 2010 to 2021, the number of federal environmental cases challenging new projects was remarkably low only twenty-eight cases involved wind projects, eight solar, and fourteen transmission lines over this twelve-year period ²² However, in July 2025, the Trump administration set a group of federal regulations, attempting to restrict solar and wind development. In 2026, a judge stopped these regulations as litigation over them plays out. Renewable energy projects are still often challenged in court by state or local governments.
Renewable projects that are not on federal land still may require a range of federal permits Projects may require a wide range of federal permits from a variety of agencies, depending on the project scope When multiple federal permits are required, one agency is typically designated as the “lead” and coordinates all permits and consultations with other agencies.²³
Renewable energy projects must comply with a range of federal, regional, state, and local permits, with differences based on location and size. Permits come from many different government bodies, and can often be contingent on each other, which complicates the process and can create long delays This process compounds project risks, with 94 percent of developers citing permitting as a factor in project delays or cancellations ²⁴
Planners can help facilitate the process by laying out which permits are required locally, and which state or federal permits may be required
Planners can minimize procedural loops or intentional slowdowns through increasing flexibility by changing processes to not require certain permits before other permits or reviews. Agencies have often layered permit requirements over time without questioning whether the sequence makes sense. Circular permit dependencies often function (intentionally or not) as informal veto points for agencies or stakeholders who lack formal authority to block a project
Flexibility means allowing parallel review tracks For instance, state permitting agencies shouldn't require FAA approval before beginning their own wind energy review Since most permitting work is independent of FAA determinations, concurrent review saves months, and if the FAA ultimately denies the project, no more time has been lost than if approval had been required upfront.
1 Howdoespermittingforcleanenergyinfrastructurework?(nd) Brookings https://wwwbrookingsedu/articles/how-does-permitting-for-clean-energy-infrastructure-work/
2.BalancingTheBooksWhenHostingRenewableEnergy:AGuideForMichiganLocalGovernments.Graham SustainabilityInstitute UniversityofMichigan https://grahamumichedu/project/btb
3.USEPA.(2015,November4).Sediments[DataandTools].https://www.epa.gov/caddis/sediments
4 SoilErosionandConstructionStormWater (nd) DepartmentofEnvironment,GreatLakes,andEnergy https://wwwmichigangov/egle/about/organization/water-resources/soil-erosion
5.NPDESPermit Stormwater|SouthCarolinaDepartmentofEnvironmentalServices(n.d.). https://desscgov/programs/bureau-water/national-pollutant-discharge-elimination-system-npdes/npdespermit-stormwater
6 EnvironmentalJusticeRevisited (nd) BCLP-BryanCaveLeightonPaisner-EnvironmentalJusticeRevisited https://wwwbclplawcom/en-US/events-insights-news/environmental-justice-revisitedhtml
7.Memorandum:IntroducingFederalNationalEnvironmentalPolicyActPractitionersToTheWisconsin EnvironmentalPolicyActProcess WEPA https://ceqdoegov/docs/lawsregulations/state information/Federal Practitioner Guide to WEPA 23Dec2015pdf
8 Oversize/overweightpermits (nd) https://wwwmichigangov/mdot/business/permits/oversize-overweight
9 Right-of-wayconstructionpermits (nd) https://wwwmichigangov/mdot/business/permits/right-of-wayconstruction
10 Home|CaliforniaISO (nd) https://wwwcaisocom/
11 ElectricReliabilityCouncilofTexas (nd) https://wwwercotcom/
12.PJMWebsite.(n.d.).https://www.pjm.com/
13 USEPA,O (2016,April15) EPAEnforcementEnsuresthatSolarCompanyFollowsStormwaterDischarge RequirementsatWarren,Mass.Facility[Speeches,TestimonyandTranscripts].USEPA. https://wwwepagov/newsreleases/epa-enforcement-ensures-solar-company-follows-stormwater-dischargerequirements-warren
14.AboutEPAPermitting.UnitedStatesEnvironmentalProtectionAgency.https://www.epa.gov/permits/about-epapermitting
15.Eightfactsaboutpermittingandthecleanenergytransition.(n.d.).TheHamiltonProject. https://wwwhamiltonprojectorg/publication/economic-fact/eight-facts-permitting-clean-energy-transition/
16 PermitProgramunderCWASection404 UnitedStatesEnvironmentalProtectionAgency https://www.epa.gov/cwa-404/permit-program-under-cwa-section-404
17 EnergyPermits,Policies,andAuthorities USFishandWildlifeService https://wwwfwsgov/page/energypermits-policies-and-authorities
18 HabitatConservationPlans|US Fish&WildlifeService (2016,December21) https://wwwfwsgov/service/habitat-conservation-plans
19.NewInteragencyStudyFindsFurtherExpansionofRenewableEnergyProductiononFederalLandsCouldPower MillionsMoreAmericanHomesby2035 (2026,April28) EnergyGov https://wwwenergygov/articles/newinteragency-study-finds-further-expansion-renewable-energy-production-federal-lands
20 Goslowtogofast?Areviewoftheimpactsofpermittingonlarge-scalesolarprojectdevelopment (2025) Energy Research&SocialScience,127,104318 https://wwwsciencedirectcom/science/article/pii/S2214629625003998
21.Adelman,D.E.(2024).PermittingReform’sFalseChoice.EcologyLQ,51,129. https://wwwcongressgov/119/meeting/house/118561/documents/HHRG-119-II00-20250910-SD209pdf
22 23US Code§139 EfficientenvironmentalreviewsforprojectdecisionmakingandOneFederalDecision (nd) LII/LegalInformationInstitute.https://www.law.cornell.edu/uscode/text/23/139
23 14CFRPart77 Safe,EfficientUse,andPreservationoftheNavigableAirspace (nd) https://www.ecfr.gov/current/title-14/part-77
24 Tamborrino,K (2026,April7) Federalpermittingobstructscleanenergydeployment,surveyfinds E&ENewsby POLITICO https://wwweenewsnet/articles/federal-permitting-obstructs-clean-energy-deployment-surveyfinds/

Created by Shuyang Shi, April 2026
Noise is one of the most common community concerns raised during renewable energy siting and permitting. Wind turbines, battery energy storage systems (BESS), and inverters within a solar facility do generate sound, but the type, intensity, and perceived impact of that sound varies by technology, equipment design, weather conditions, background noise, and distance from nearby property. In practice, noise regulation is usually handled at the state or local level through zoning ordinances and specific project permit conditions rather than through one single national standard.
1. Use of A-Weighted Decibels (dBA)
Environmental noise is commonly reported in A-weighted decibels (dBA). This scale is widely used because it is designed to reflect the way people hear sound, giving greater emphasis to frequencies that are more noticeable to the human ear.1 As a result, dBA is the most common metric used in renewable energy noise regulation.
C-weighted decibels (dBC) are sometimes used, however, when low-frequency sound is a concern, since A-weighting does not fully capture all aspects of low-frequency noise.2
2. Noise Sources and Levels Across Wind, Solar, and BESS
• Wind
The primary source of wind turbine noise is the interaction between moving blades and the air, which produces a characteristic “whooshing” sound. Mechanical components may also contribute, though they are less significant in modern designs.
Under typical conditions, utility-scale wind turbines are often described as producing approximately 3545 dBA at around 1,000 feet from the turbine,3 with sound levels varying depending on wind speed and site conditions.
• Solar
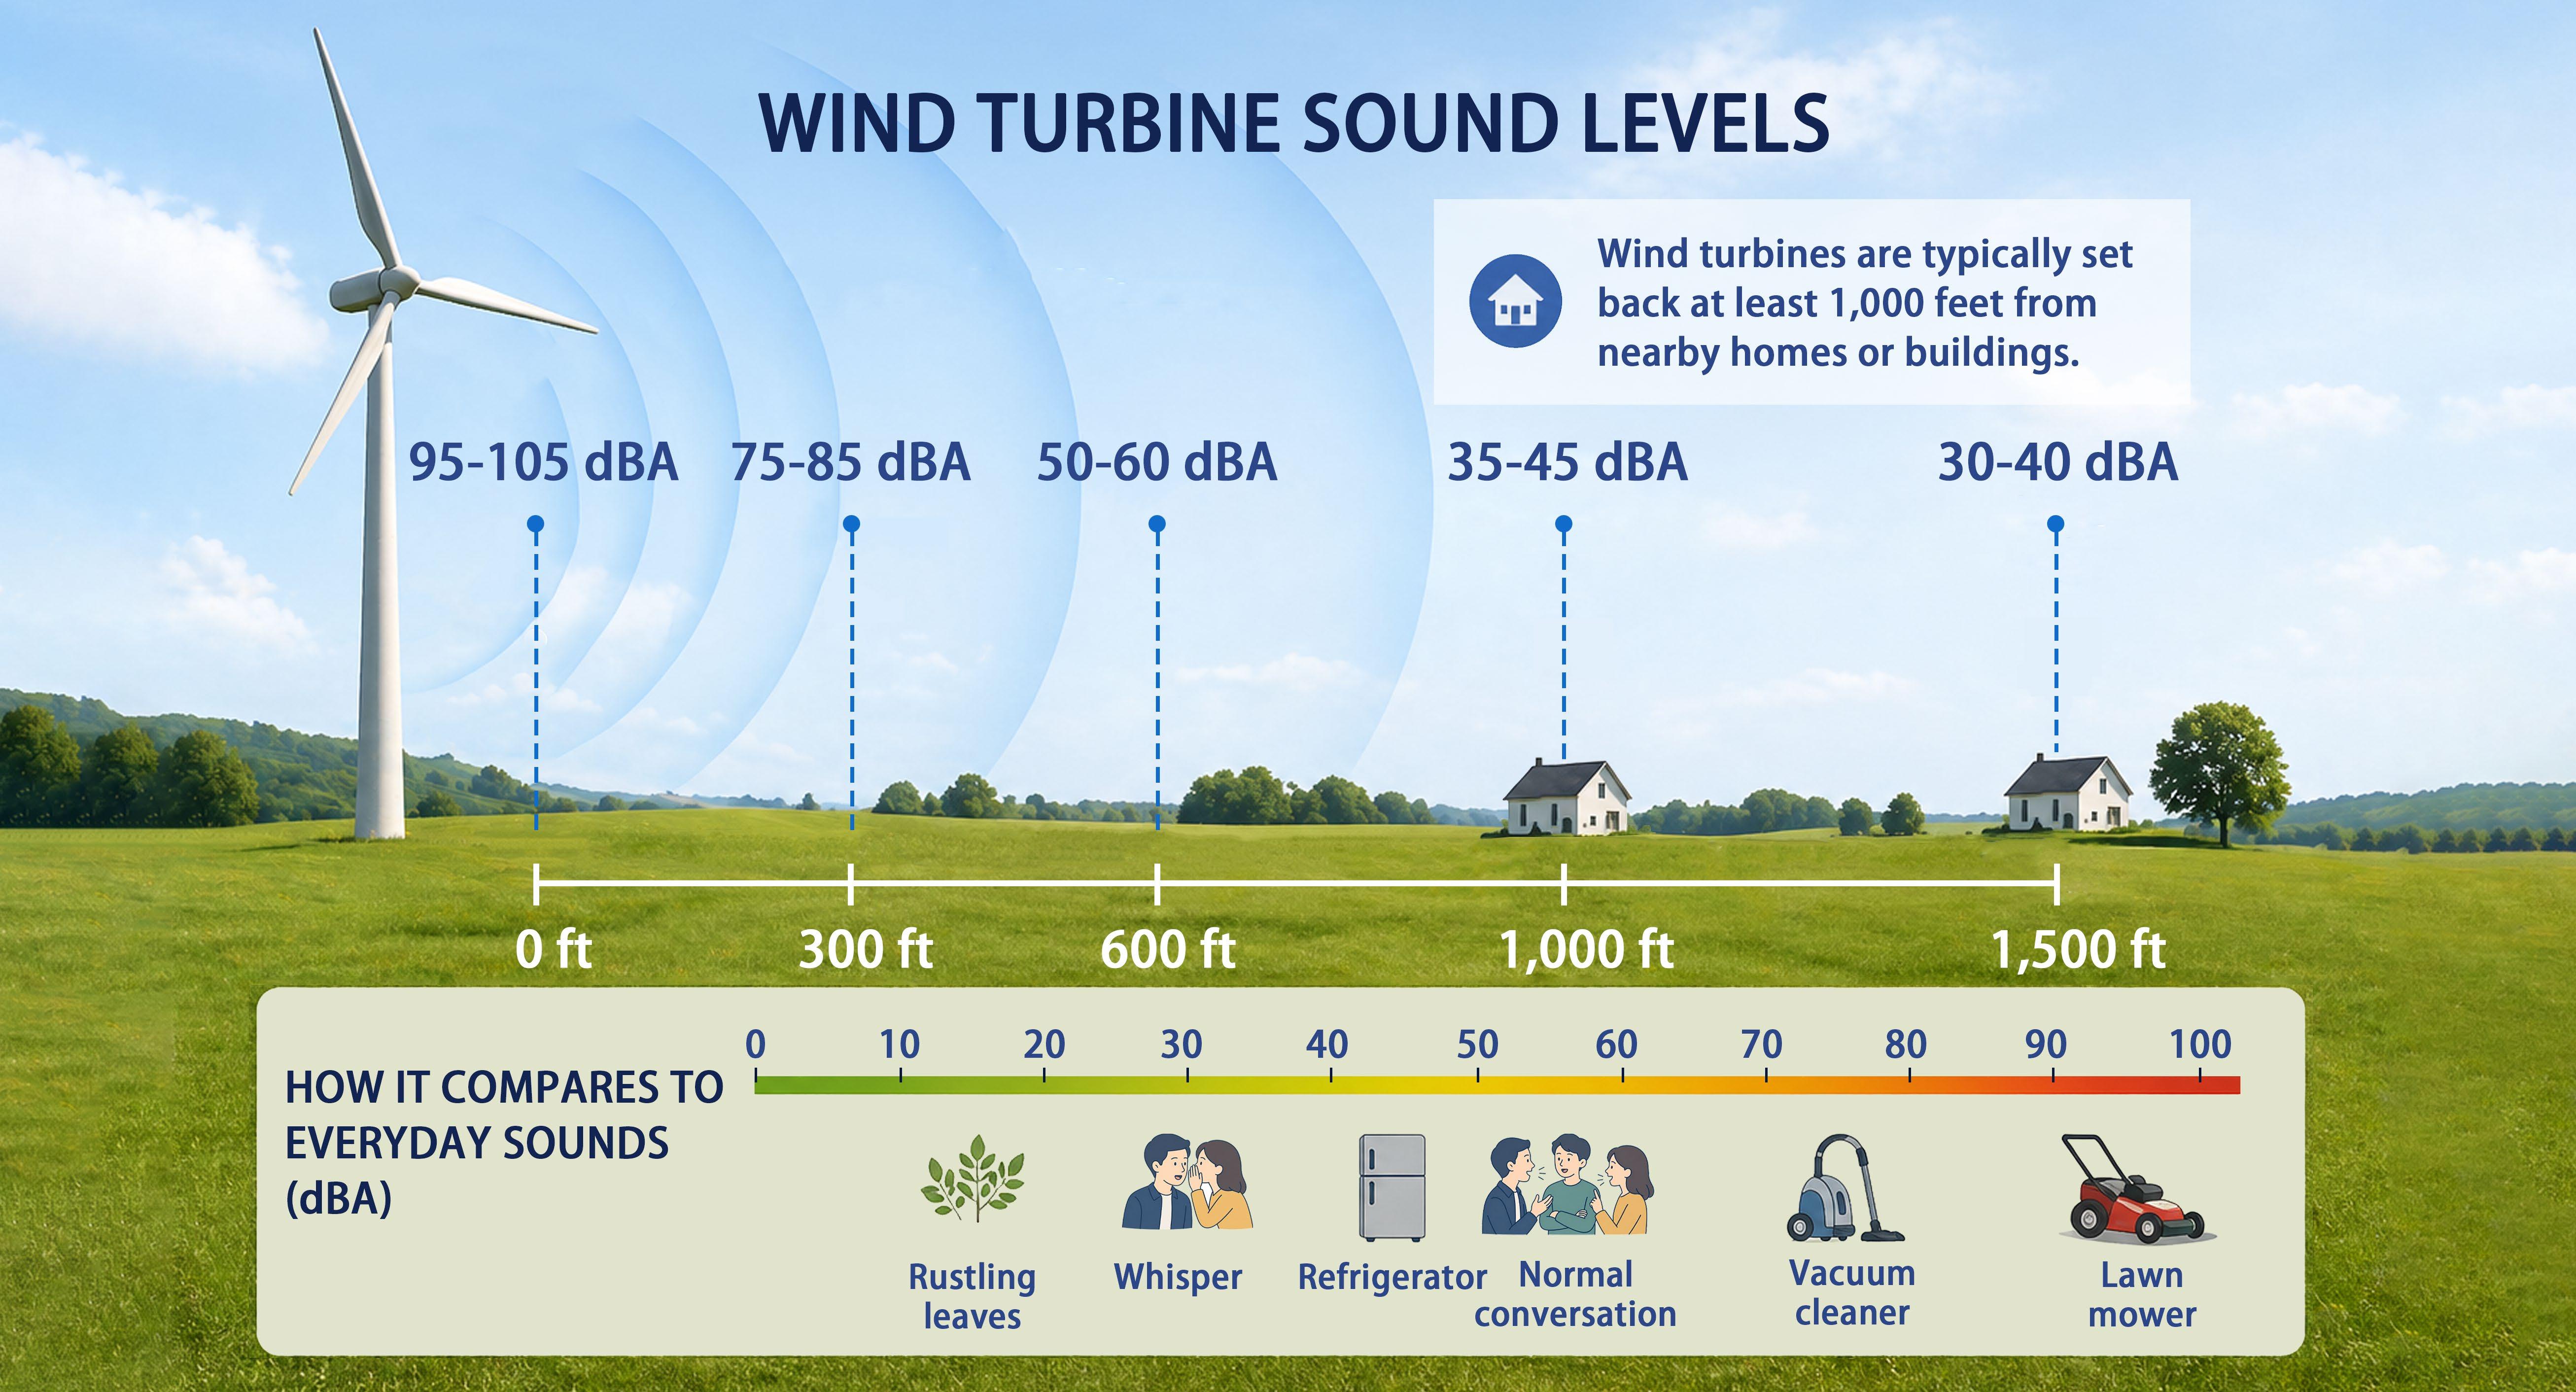
Solar panels themselves do not produce noise. Instead, sound is generated by associated equipment, primarily inverters and transformers. Inverters are typically the main noise source, producing sound from cooling fans and electrical switching, while transformers generate a steady low-frequency hum due to electromagnetic processes. At very close range, inverters can produce sound levels of around 60-70 dBA, comparable to a large air conditioning unit. However, sound levels decrease rapidly with distance, typically reaching approximately 35-40 dBA at distances relevant to nearby receptors or property boundaries (around 100 feet). At these levels, noise is generally comparable to background sounds such as a refrigerator. In some cases, solar tracking systems may also generate intermittent mechanical noise as panels adjust position throughout the day, although these sounds are short in duration and less prominent than inverter-related noise.4
• BESS
BESS facilities generate noise primarily from inverters, cooling and ventilation systems, and other electrical components, rather than from the batteries themselves. 5 Residential, on-site systems are typically designed to operate quietly and often produce less noise than whole-home generators or HVAC units. In contrast, larger, off-site BESS installations can generate noise levels of approximately 60-80 dBA at close range.6

Sound from renewable energy facilities spreads outward, with noise levels decreasing as distance from the source increases. Under simplified conditions (without significant atmospheric effects), sound levels are commonly described as decreasing by approximately 6 dBA each time the distance from the source doubles.7
In most siting contexts, distance is the primary factor influencing noise exposure, especially when receptors (i.e., people) are located relatively close to the source. While meteorological conditions and source height can also affect sound propagation, their influence is often secondary at shorter distances.
Wind speed influences both the generation and perception of noise from renewable energy facilities, most notably for wind turbines but also in shaping ambient sound conditions around solar and battery storage systems. As wind speed increases, airflow around turbine blades and other equipment can produce higher noise levels. This increase is not strictly linear, and sound levels may rise more rapidly under stronger wind conditions.2
At the same time, higher wind speeds also increase background environmental noise, including wind moving through vegetation, buildings, and terrain. This can partially mask facility-related noise, making it less noticeable even when sound levels are higher.2
1. Common forms of local noise standards
There is no single nationwide standard for renewable energy noise. Instead, enforceable limits are typically set through local ordinances, zoning regulations, permit conditions, or state-level guidance. These rules define the maximum sound levels allowed at specific receiving locations.
Two common approaches are used:
• Fixed thresholds, which set a maximum allowable sound level (for example, 55 dBA at the property line)
• Ambient-based thresholds, which limit the allowable increase above existing background sound (for example, ambient plus 5 dBA)
In addition to the form of the standard, local regulations also differ in how sound is measured. Two commonly used metrics are the equivalent continuous sound level (Leq), which represents an average over a specified time period, and the maximum sound level (LMax), which captures short-duration peak noise events. For example, some guidelines set limits such as 55 dBA Leq (1-hour) at a building’s outer wall, while others may use 66 dBA LMax at the property line.8 Leq-based standards are often used for continuous or steady noise sources, while LMax standards are more sensitive to intermittent or sudden noise. The choice of metric can influence how restrictive a standard is in practice and how compliance is evaluated.
Local standards often vary by jurisdiction and land use context. For example, Michigan’s standard guidance for energy facilities is 55 dBA Leq (1-hour) at an adjacent nonparticipating dwelling.9 Similar thresholds are widely used in rural and suburban areas, where renewable energy projects are typically located and where background noise levels are relatively low.
Beyond the specific form of the standard, some guidance emphasizes that noise regulations should be set at the minimum level necessary to protect public health and welfare. If research identifies a threshold above which noise may cause harm, regulations should not be more restrictive than required to achieve that purpose.10 Overly strict limits may be difficult to justify and enforce, particularly if challenged in legal or permitting contexts.
2. Measurement locations and sensitive receptors
Noise standards are usually tied to a specific receiving point rather than to the equipment itself. Common reference locations include the project boundary, the property line, the nearest building, or another noise-sensitive receptor such as a school. Because standards are tied to these locations, the same equipment may be acceptable in one setting but not in another, depending on surrounding land uses and proximity to receptors.
Measuring at the property line provides a consistent and clearly defined regulatory boundary, which makes standards easier to apply and enforce across different sites. In contrast, measuring at an existing building may better reflect actual human experience of activity on the property, but results can vary depending on building placement, shielding, and site-specific conditions. This distinction can influence both compliance outcomes and how noise impacts are perceived in practice.
Many ordinances place emphasis on non-participating properties, meaning those not financially involved in the project, as these locations are often considered the most sensitive from a regulatory and community perspective.10
3. Compliance monitoring and enforcement
Compliance is typically evaluated through a combination of pre-construction analysis, post-construction testing, and ongoing monitoring.
• Pre-construction acoustic modeling is commonly required to estimate expected sound levels at nearby receptors. This allows local officials to assess whether a project is likely to meet applicable standards before approval.10
• Post-construction testing is often required to verify that actual sound levels match predicted values. This is typically conducted by a qualified third party and documented in a formal report.10
• Ongoing compliance and enforcement may include follow-up measurements, especially if complaints arise. In practice, many communities rely on a complaint-based process, where reported concerns trigger additional monitoring or operational adjustments.
If measured sound levels exceed approved limits, jurisdictions may require mitigation measures such as operational changes, equipment modification, or additional screening.
1. Common complaint patterns
Noise concerns are not driven by loudness alone. Complaints can increase when sound is perceived as out of character with a typically quiet environment. Common community concerns include nighttime disturbance and continuous equipment hum or mechanical noise. Complaints are more frequent in quieter rural areas, where background noise is low, and during nighttime, when sound is more noticeable and may affect sleep.
However, recent research suggests that the relationship between sound levels and annoyance is not straightforward. Large-scale survey data indicate that about 84% of residents living within 5 miles of wind projects report not hearing turbine noise.11 Among those who do hear it, the majority describe their level of annoyance as low, with over half reporting “not at all” annoyed and only a small share reporting higher levels of disturbance.
Social and perceptual factors play a significant role in shaping responses. Studies find that noise annoyance is more strongly associated with factors such as prior attitudes toward the project, visual perceptions of the facility, and individual noise sensitivity than with sound levels alone. In addition, perceptions of fairness in the planning process and whether residents receive direct benefits from the project can influence overall attitudes and complaint patterns.12, 13
Only a small share of residents report high levels of annoyance or stress-related impacts. For example, national survey data suggest that a small percentage of individuals living near wind projects experience “strong” annoyance, indicating that severe impacts are relatively limited but still important to address in planning and community engagement.12, 13
2. Mitigation strategies
Noise mitigation is most effective when it is addressed at multiple stages of project development and involves both local governments and project developers. In practice, mitigation strategies typically come into play at three key points:
• During project design (developer-led decisions on siting, layout, and equipment)
• During permitting and local review (where standards, setbacks, and conditions are defined)
• As enforceable permit conditions and operational requirements (monitored after construction)
While local governments typically set noise limits, setbacks, and permit conditions, developers are primarily responsible for implementing mitigation through project design, equipment selection, and operations. In practice, mitigation strategies generally fall into three categories: siting and layout, equipment and design, and operations.3, 14, 15, 16
Siting and layout measures
The physical location of noise-generating equipment is often one of the most important determinants of off-site sound exposure. Increasing the distance between turbines, inverters, transformers, or battery storage equipment and nearby homes can substantially reduce the sound level experienced at the property line or at other sensitive receptors. Site layout decisions also matter because even within the same project, some components are noisier than others.
Common siting and layout measures include:
• increasing setbacks from residences, property lines, or other sensitive receptors
• placing louder equipment farther from nearby homes
• concentrating noise-producing components in less exposed parts of the site
• using the site’s topography, where possible, to help limit sound transmission
• incorporating fencing, walls, or vegetative screening as supplementary sound barriers
Blade-air interaction, mechanical components Wind
Inverters and transformers, occasional tracker movement Solar
Cooling and ventilation systems, inverters, transformers BESS
Equipment and design measures
About 95-105 dBA
About 70 dBA
About 60-80 dBA
1000 feet
35-45 dBA
40-45 dBA 50 feet
100 feet
35-40 dBA
100-450 feet
40-55 dBA
Larger setbacks are often needed because turbines are tall, widely visible, and can be audible over longer distances.
Noise typically drops quickly with distance. Layout and equipment placement are usually effective.
BESS noise is usually concentrated at equipment locations, so site layout matters.
Noise can also be reduced through project design and equipment selection. Design-based mitigation can help reduce impacts before a project is even built, which may be more effective than trying to address problems later through complaints or enforcement.
Common equipment and design measures include:
• selecting quieter wind turbine models or blade designs
• using sound-dampening treatment for mechanical components such as gearboxes and generators
• choosing lower-noise inverters, transformers, and cooling systems
• enclosing or partially enclosing noisy equipment where feasible
• incorporating acoustic barriers or design features intended to reduce sound transmission
• for BESS, designing ventilation and cooling systems to minimize continuous mechanical noise
Operational measures
Some noise impacts depend not only on what equipment is installed, but also on how that equipment is operated. Operational mitigation is especially useful when sound concerns are concentrated during particular times of day, weather conditions, or operating modes. These measures do not always eliminate noise, but they can reduce the likelihood of repeated complaints or threshold exceedances.
Common operational measures include:
• using reduced-noise operating modes during more sensitive periods, such as nighttime
• adjusting wind turbine blade pitch or turbine operating settings under specific wind conditions
• curtailing certain activities or equipment operation when necessary
• scheduling maintenance or testing at less disruptive times
• responding promptly to complaints and adjusting operations when monitoring indicates a problem
• pairing operational changes with follow-up measurement to confirm that mitigation is working Planning
For planners, managing renewable energy noise is less about a single standard and more about balancing technical performance with community expectations. While sound levels can be measured and modeled, the perceived impact of noise is shaped by local context, including land use patterns, background conditions, and community sensitivity.
Several key considerations emerge from current practice. First, distance and site design are often the most effective tools for reducing noise impacts. Setbacks, equipment placement, and screening can significantly influence whether a project meets regulatory thresholds and avoids complaints. Second, early-stage acoustic modeling is critical, as it allows planners to evaluate potential impacts before construction and to require design adjustments when necessary.
Planners should also recognize that compliance does not always eliminate community concerns. Even projects that meet numerical standards may generate complaints, particularly in quiet or rural areas where new sounds are more noticeable. As a result, integrating complaint response processes and adaptive management strategies into permits can be as important as setting decibel limits.
Finally, renewable energy noise regulation is inherently context-specific. Effective approaches often combine clear standards, thoughtful siting requirements, and ongoing monitoring, allowing communities to support clean energy development while protecting quality of life.
[1] National Institute on Deafness and Other Communication Disorders. (2025, April 28). How is sound measured? https://www.nidcd.nih.gov/health/how-sound-measured
[2] Energy Sustainability Directory. (2025, November 20). What role does wind speed play in noise? https://energy.sustainability-directory.com/question/what-role-does-wind-speed-play-in-noise/
[3] U.S. Department of Energy. (n.d.). Sound. https://www.energy.gov/eere/wind/windexchange/windexchange/sound
[4] Bahtiarian, M. (2020). Noise evaluations of solar energy facilities. INTER-NOISE and NOISE-CON Congress and Conference Proceedings, 262(1), 663–672. https://ince.publisher.ingentaconnect.com/content/ince/incecp/2020/00000262/00000001/art00077
[5] Murray, C. (2024, April 8). BESS noise has ‘exploded as a concern’ recently. Energy Storage News. https://www.energy-storage.news/bess-noise-has-exploded-as-a-concern-recently/
[6] Graham Sustainability Institute, Center for EmPowering Communities. (2024). Planning & zoning for battery energy storage systems. University of Michigan. https://graham.umich.edu/project/bess-guide
[7] Hottinger Brüel & Kjær. (n.d.). How weather affects noise measurements. https://www.hbkworld.com/en/knowledge/resource-center/articles/noise-measurement-weather
[8] Krol, M. (n.d.). Renewable Energy Academy Online “Workable ordinances under PA 233”. Graham Sustainability Institute, Center for EmPowering Communities, University of Michigan.
https://www.michigan.gov/egle/about/organization/materials-management/energy/renewable-energy/renewable-energy-academy
[9] State of Michigan Legislature. (2023). Public Act 233 of 2023 (Enrolled House Bill No. 5120).
https://www.legislature.mi.gov/documents/2023-2024/publicact/htm/2023-PA-0233.htm
[10] Reilly, M., & Neumann, B. (2020, October 6). Sample zoning for wind energy systems. Michigan State University Extension. https://www.canr.msu.edu/resources/sample_zoning_for_wind_energy_systems_1
[11] Hoen, B., Rand, J., Wiser, R., Firestone, J., Elliott, D., Hübner, G., Pohl, J., Haac, R., Kaliski, K., Landis, M., & Lantz, E. (2019, November). National survey of attitudes of wind power project neighbors: Summary of results. Lawrence Berkeley National Laboratory. https://emp.lbl.gov/projects/wind-neighbor-survey
[12] Bakker, R. H., Pedersen, E., van den Berg, G. P., Stewart, R. E., Lok, W., & Bouma, J. (2012). Impact of wind turbine sound on annoyance, selfreported sleep disturbance and psychological distress. Science of the Total Environment, 425, 42–51. https://doi.org/10.1016/j.scitotenv.2012.03.005
[13] Michaud, D. S., Keith, S. E., Feder, K., Voicescu, S. A., Marro, L., Than, J., Guay, M., Bower, T., Denning, A., Lavigne, E., Whelan, C., Janssen, S. A., Leroux, T., & van den Berg, F. (2016). Personal and situational variables associated with wind turbine noise annoyance. Journal of the Acoustical Society of America, 139, 1455–1466. https://doi.org/10.1121/1.4942390
[14] Segovia, N. A., & Burke, C. (2024). Noise control tactics to balance the demand for sustainable energy storage, community tranquility, and environmental regulatory compliance. INTER-NOISE and NOISE-CON Congress and Conference Proceedings, 264, 746–755. https://doi.org/10.3397/NC_2024_0092
[15] Eriksson, L. (2023). Battery energy storage systems—Their environmental noise emissions and possible mitigation pathways. Proceedings of Meetings on Acoustics, 52, 040014. https://doi.org/10.1121/2.0001951
[16] Storm, M., Khoshmashrab, S., & Bright, E. (2011). The sounds of solar power generation. INTER-NOISE and NOISE-CON Congress and Conference Proceedings, 2011, 889–899. https://ince.publisher.ingentaconnect.com/contentone/ince/incecp/2011/00002011/00000001/art00087
By: Yuyang Ding, Master of Urban and Regional Planning
Date: April 2026
Introduction
Battery Energy Storage Systems (BESS) have become a fastly expanding component of the U.S. power grid. U.S. developers plan to add 24 GW of utility-scale battery storage to the grid in 2026, compared with a record 15 GW added in 2025.[6]
This rapid growth brings a new challenge for the fire protection community. Several high-profile fire incidents have raised public concern about the safety of BESS facilities. One notorious example is the 2019 BESS explosion in Surprise, AZ, which drew widespread media attention and exposed risks associated with battery failures. Since then, there has been increased scrutiny from regulators, local communities, and emergency responders regarding the safety and siting of BESS facilities. There have also been changes to safety standards intended to make battery incidents much less likely.
The factsheet specifically focuses on fire safety & planning considerations for BESS. For general knowledge about BESS, see Battery Energy Storage System FAQ by New York State Energy Research and Development Authority (NYSERDA).
Q: What causes fire?
A: Thermal runaway is the primary cause of fires. The dominant technology used in BESS is Lithium-Ion batteries because they offer high energy density at a cost-competitive price. However, because lithium-ion batteries store large amounts of energy within a relatively small space coupled with having a flammable electrolyte, they have the risks of becoming unstable and entering thermal runaway.[4]
Q: What is thermal runaway?
A: It is a phenomenon that occurs when the temperature inside the battery increases so much that the cell cannot dissipate the heat and enters an uncontrollable, self-heating state.[5] Thermal runaway can be triggered by several factors,[3] including:
● Mechanical abuse: physical damage of a battery
● Electrical abuse: short circuit, overcharging or some other faults
● Thermal abuse: exposure to extreme temperatures that could cause damage to the battery
● Manufacturing defects
Q: How common are BESS fires?
A: BESS fires are extremely rare, and the number of incidents each year has decreased rapidly because of technological improvements and evolving safety standards (see Figure 1).[3] The Electric Power Research Institute (EPRI) created a BESS Failure Incident Database, which tracks global failure incidents since 2011.

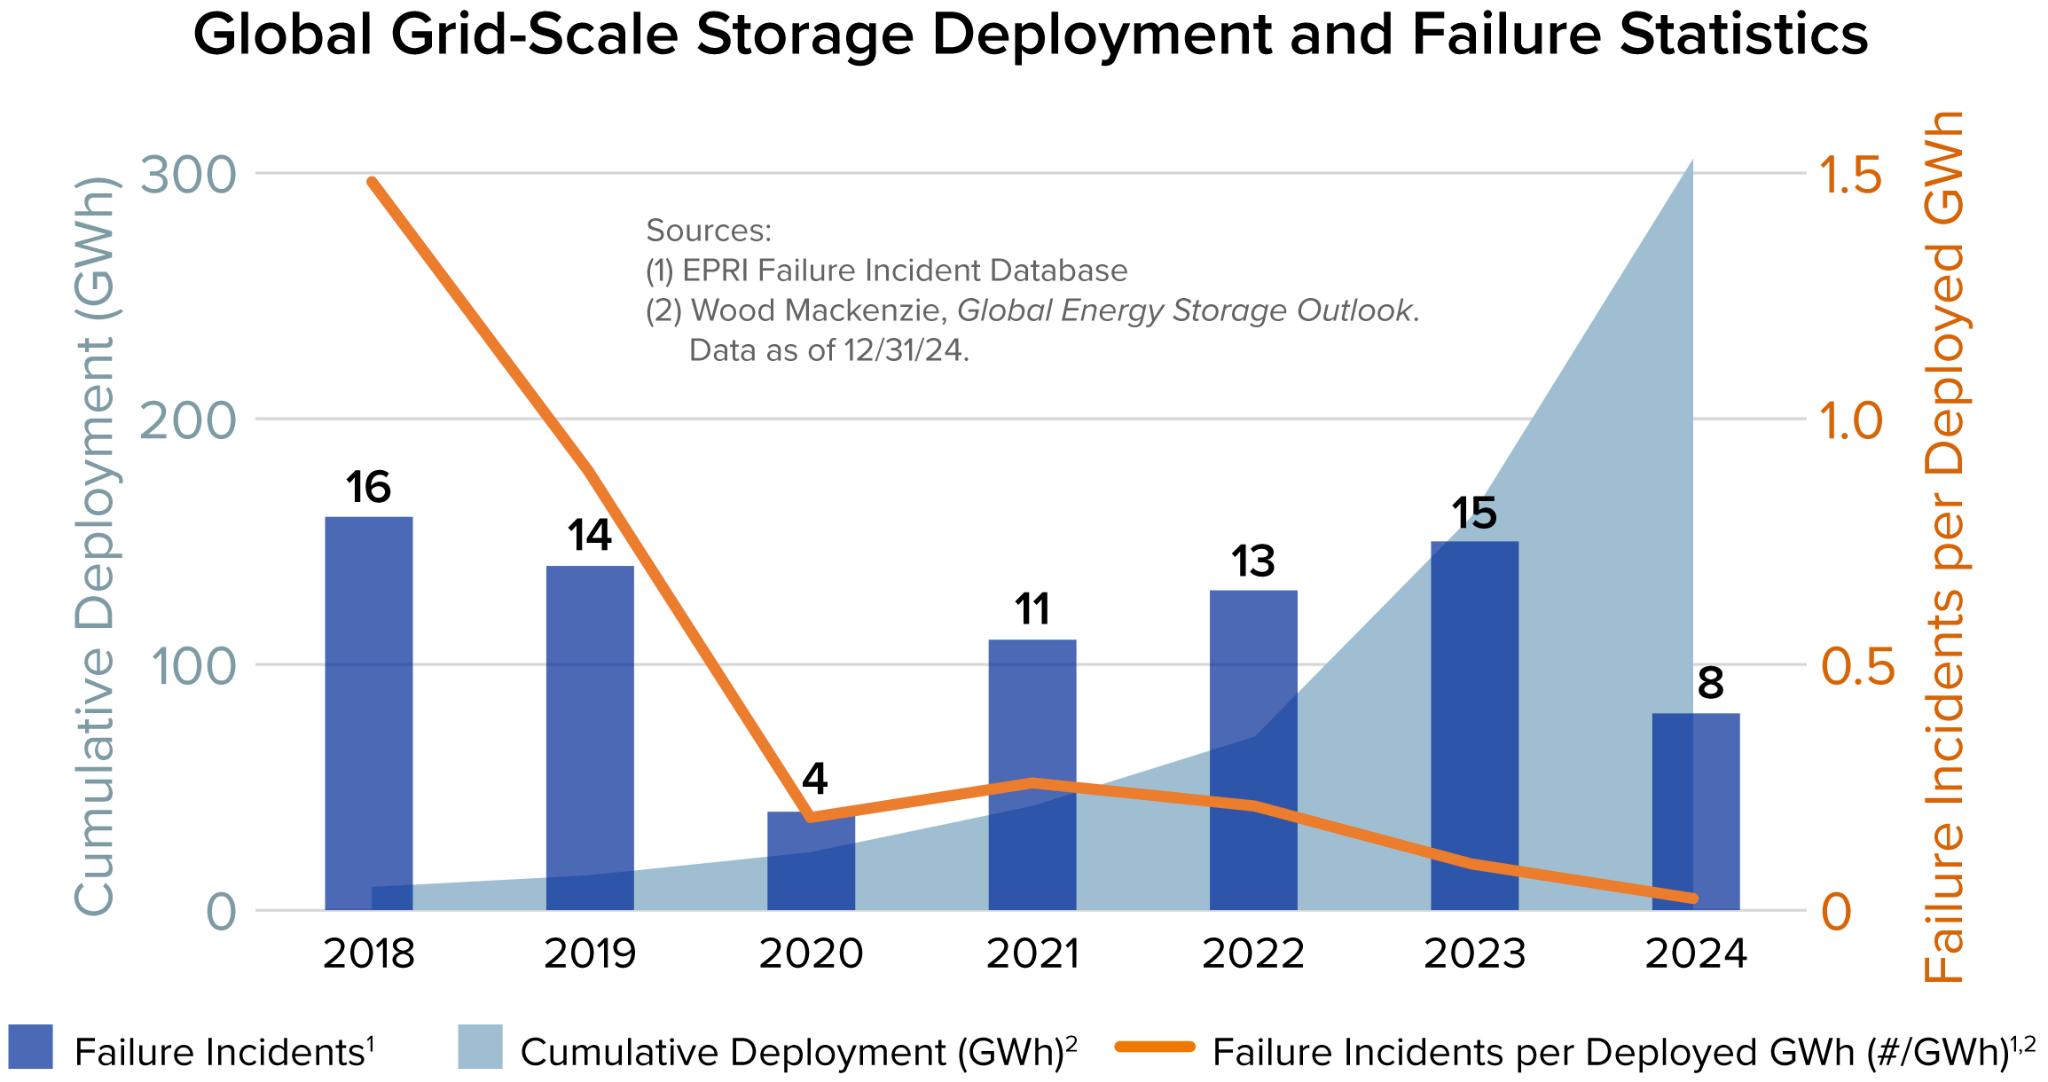
Figure 1. Global Grid-Scale Storage Development and Failure Statistics
Q: What code/standards govern safety?
A: In the United States, codes and standards are primarily written by following standards-developing organizations (SDOs), which work in conjunction with expert organizations to develop standards and regulations through consensus processes approved by the American National Standards Institute. Key organizations involved in energy storage safety standards include:
● the National Fire Protection Association (NFPA)
● The Underwriter Laboratory (UL)
● The International Code Council (ICC)
● The Institute of Electrical and Electronics Engineers (IEEE)
Major codes and standards that govern the safety, design, and installation of BESS include:
● NFPA 855 for the Installation of Stationary Energy Storage Systems
● UL 9540 for Energy Storage Systems and Equipment
● UL 9540A for Evaluating Thermal Runaway Fire Propagation in BESS
● the International Fire Code (IFC)
Relevant resources:
● U.S. Codes and Standards for Battery Energy Storage Systems
● Study of Codes and Standards for Stationary Energy Storage Systems
Q: What separation distances, access roads, ventilation, detection, and suppression requirements are part of current codes?
A:
Separation Distances
The separation distances depend on the maximum aggregate ratings of ESS. For more information, see NFPA 855: Table 15.5.2.
Access Roads Fire department access roads shall be provided to outdoor ESS installations in accordance with the local fire code.
Ventilation Exhaust and ventilation equipment and systems shall be prepared and installed.
Detection Areas containing ESSs shall be provided with a smoke detection, thermal image fire detection, or radiant-energy-sensing system. For more information, see NFPA 855: Section 4.8 - Smoke and Fire Detection.
Suppression Gas phase and water-based (e.g., sprinklers, sprayers, deluge systems, water mist systems) suppression systems shall be installed. For more information, see NFPA 855: Annex G - Guide for Suppression and Safety of Lithium-Ion Battery (LIB) Energy Storage Systems
Q: What training and pre-incident planning is recommended for local fire departments?
A: An emergency responder preincident plan is recommended for fire departments in response to fires, explosions, and other emergency conditions associated with the ESS installation. The plan commonly includes the following elements:
1) Understanding the procedure included in the facility operation and emergency response plan described.
2) Identifying the types of ESS technology present and the potential hazards associated with the system.
3) Identifying the location of all electrical disconnects in the building.
4) Understanding the procedures for shutting down and deenergizing or isolating equipment to reduce the risk of fire, electrical shock, and personal injury hazards.
5) Understanding the potential for reignition long after initial extinguishment.
6) Contacting personnel qualified to safely remove damaged ESS equipment from the facility.[2]
Relevant resources:
● NFPA 855: Annex C - Firefighting Considerations (Operations)
● Battery Energy Storage Systems: Main Considerations for Safe Installation and Incident Response
● Lithium-Ion Battery Training Resources
● Lithium-ion Awareness Course by the New York State Office of Fire Prevention and Control (OFPC)
Planner’s Perspective
Fire Safety can be significantly enhanced by requiring compliance with the latest edition of NFPA 855.[1] However, beyond formal adoption, planners can also play a critical role in interpreting and operationalizing these standards at the local level.
The first step is to become familiar with relevant codes and standards, including NFPA 855 and testing standards UL 9540. Equipped with this foundational knowledge, planners can better evaluate proposals and coordinate with fire officials and technical experts.
Second, planners could ask developers for detailed safety plans and reports during project approval.[1] Even where standards are not fully codified or enforced locally, planners can proactively engage developers by asking relevant questions to ensure safe design and operation. In some cases, this may also support the negotiation of voluntary agreements or conditions of approval. Key questions include:
1. Is this system listed and certified under UL 9540?
2. Have local fire officials been briefed and involved in project planning?
3. Do you have qualified consultants ensuring compliance with the applicable codes and standards (e.g., NFPA 855)?
4. What explosion control and gas detection measures will be employed (e.g., 4-gas meters, remote sensing technologies)?
5. What monitoring or inspection technologies (e.g., drones) will be used? If using drones, do you have a certified drone operator?
6. What are the long-term maintenance, inspection, and repair plans for the facility?[4]
Third, planners could involve local emergency response officials early in fire and emergency response planning. They could share relevant BESS resources with fire departments and emergency responders to help build familiarity with potential risks, safety protocols, and suppression strategies. Integrating them into project discussions helps ensure that emergency response considerations, such as site access and water supply are addressed proactively
Furthermore, planners could advocate to project developers and local governments to support regular training for emergency responders.
Finally, planners could study and draw on effective practices from other states, which often have a comprehensive toolkit (e.g. San Diego Fire Department Toolkit & Tennessee Emergency Management Agency (TEMA) Toolkit), to strengthen local governance frameworks. For example, New York has established an Inter-Agency Fire Safety Working Group that brings together regulators, fire authorities, and technical experts to coordinate oversight of BESS safety. Adopting a similar model could improve communication, consistency, and transparency in project review processes. Furthermore, the state requires independent Peer Review for installations exceeding certain capacity thresholds. The peer review team is aimed to assist Local Authorities Having Jurisdiction (AHJs) which lack the resources or expertise to evaluate critical BESS permitting documents and compliance. This approach provides an extra layer of technical validation and helps ensure that safety considerations are thoroughly evaluated prior to approval.
References:
[1] Krol, M., and Mills, S. (2024). Planning & Zoning for Battery Energy Storage Systems: A Guide for Michigan Local Governments. University of Michigan Center for EmPowering Communities. https://graham.umich.edu/project/bess-guide
[2] National Fire Protection Association. (2026). NFPA 855: Standard for the installation of stationary energy storage systems.
[3] New York State Energy Research and Development Authority. (2026). New York battery energy storage system guidebook for local governments. https://www.nyserda.ny.gov/-/media/Project/Nyserda/Files/Programs/Clean-Energy-Siting/Ene rgy-Storage-System-Guidebook.pdf
[4] Twitchell, J. B., Powell, D. W., & Paiss, M. D. (2023). Energy storage in local zoning ordinances. Pacific Northwest National Laboratory. https://www.pnnl.gov/publications/energy-storage-local-zoning-ordinances
[5] UL Fire Safety Research Institute. (2025). Take C.H.A.R.G.E. of Battery Safety. https://admin.batteryfiresafety.org/sites/default/files/2025-10/FactSheet_UL.pdf
[6] U.S. Energy Information Administration. (2026). New U.S. electric generating capacity expected to reach a record high in 2026. https://www.eia.gov/todayinenergy/detail.php?id=67205#