Rapid Revolution: Envisioning New High-Capacity Transit Service Along the Plainfield and Alpine Corr
LIST OF TABLES
Table 1: Summary of Recommendations from ALIGN Study
Table 2: Alpine and Plainfield Land use Strength and Weaknesses
Table 3: Corridor and City Transit-dependent Demographics
Table 4: Route-level Daily Ridership Comparison
Table 5: System-wide Daily Ridership Comparison
Table 6: 2050 Scenario Comparisons of Ridership
LIST OF FIGURES
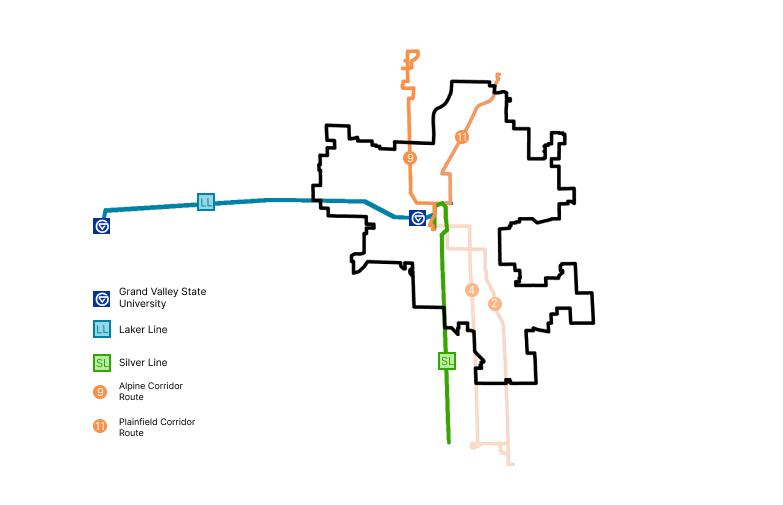
Figure 1: Existing BRT services and Candidate Routes for Upgrade
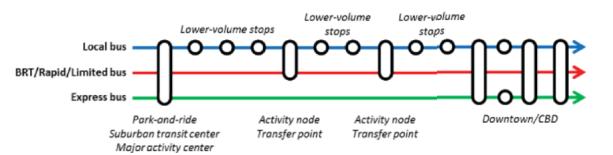
Figure 2: BRT Services vs Local Routes and Express Services
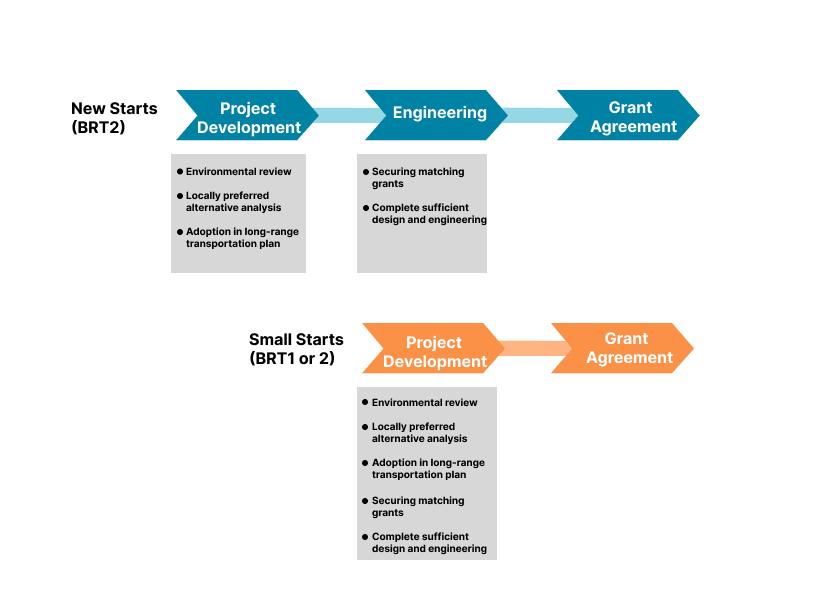
Figure 3: FTA processes for transit infrastructure funding
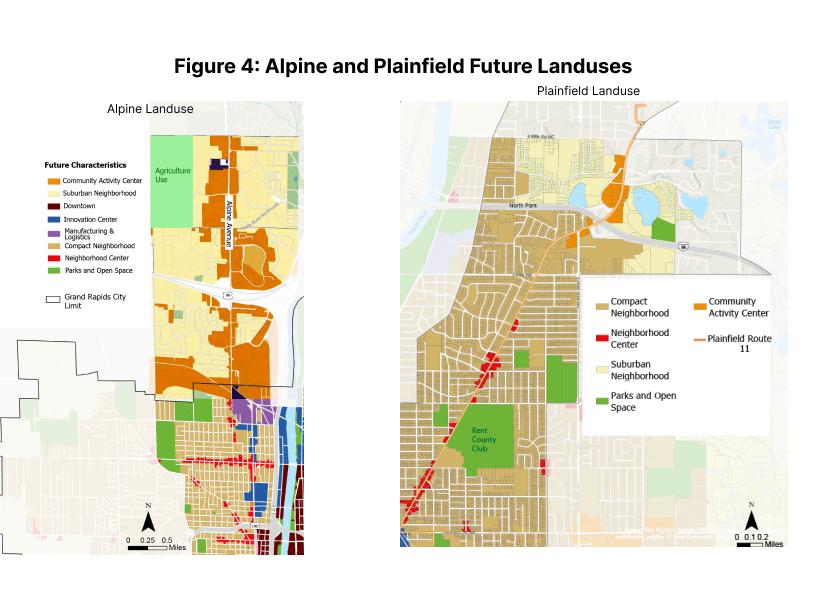
Figure 4: Alpine and Plainfield Future Landuses
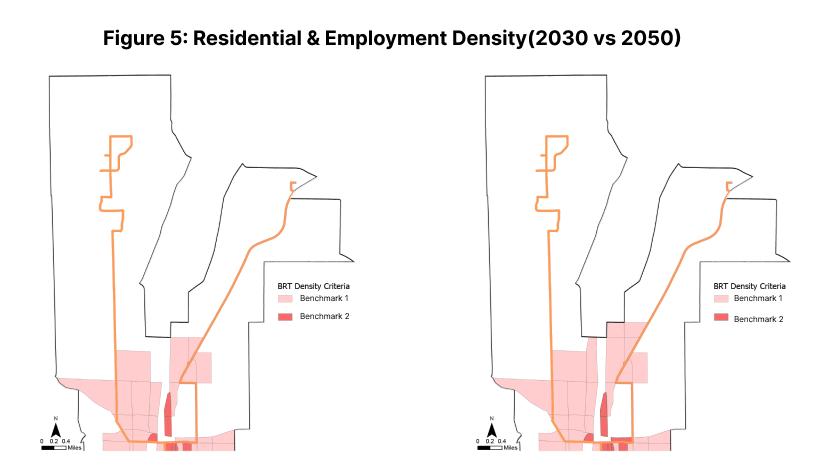
Figure 5: Residential & Employment Density (2030 vs 2050)
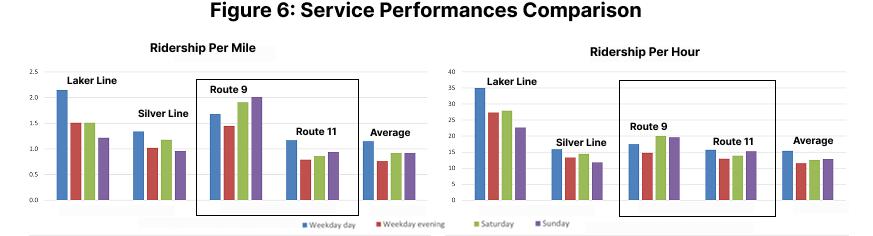
Figure 6: Service Performances Comparison
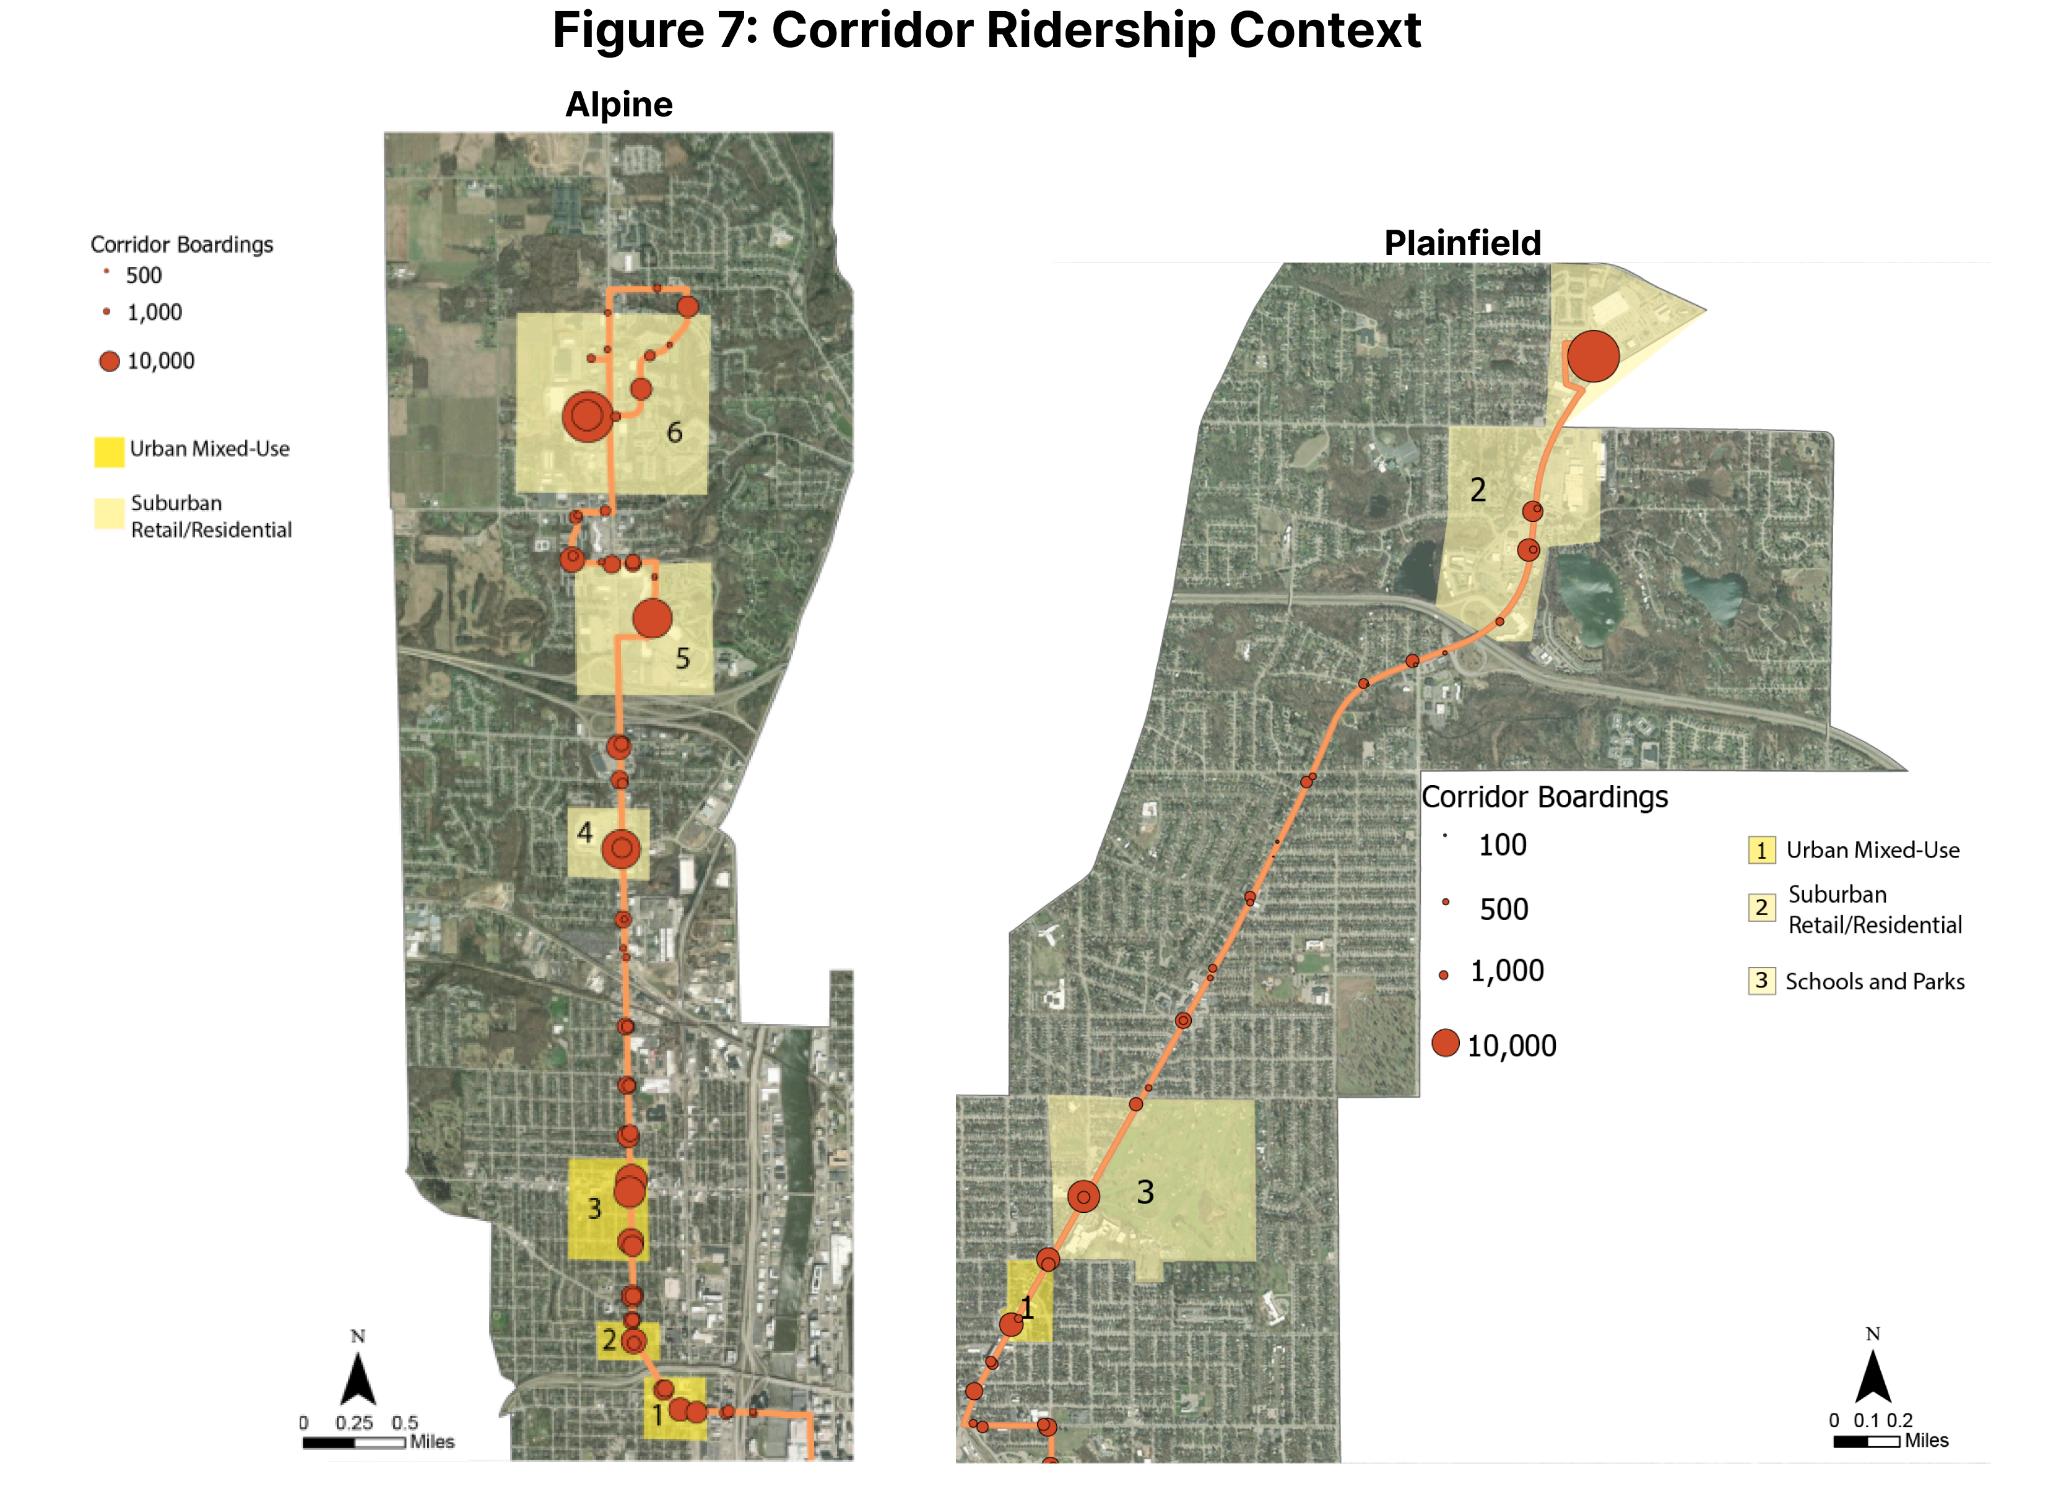
Figure 7: Corridor Ridership Context
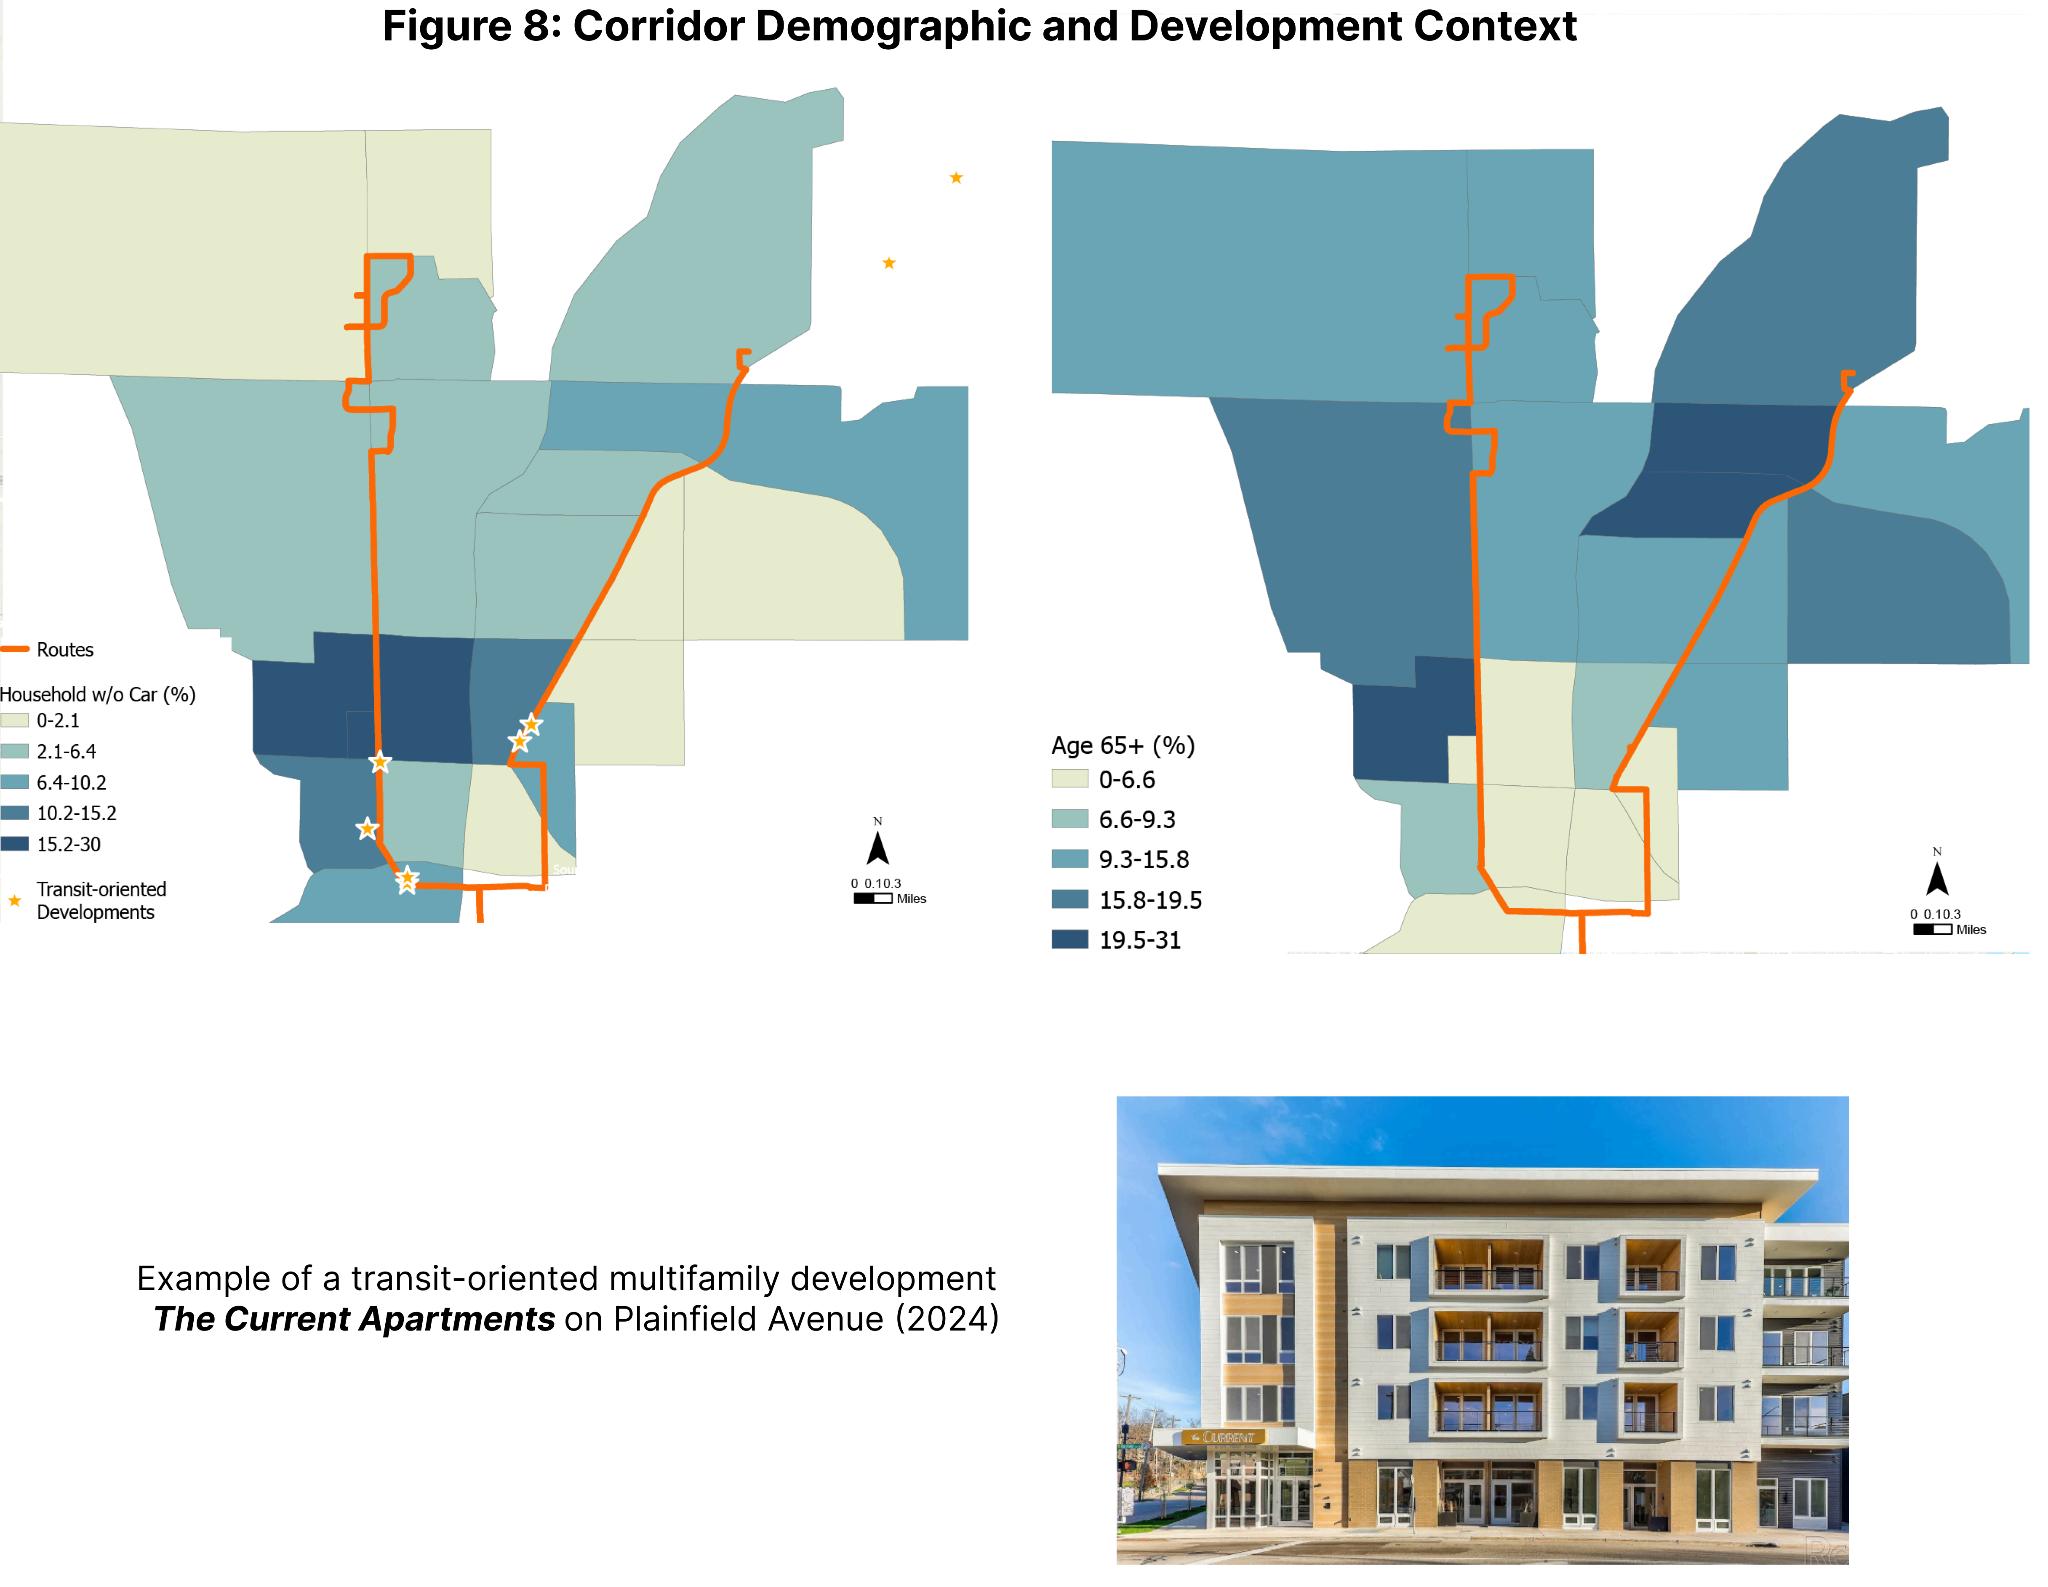
Figure 8: Corridor Demographic and Development Context
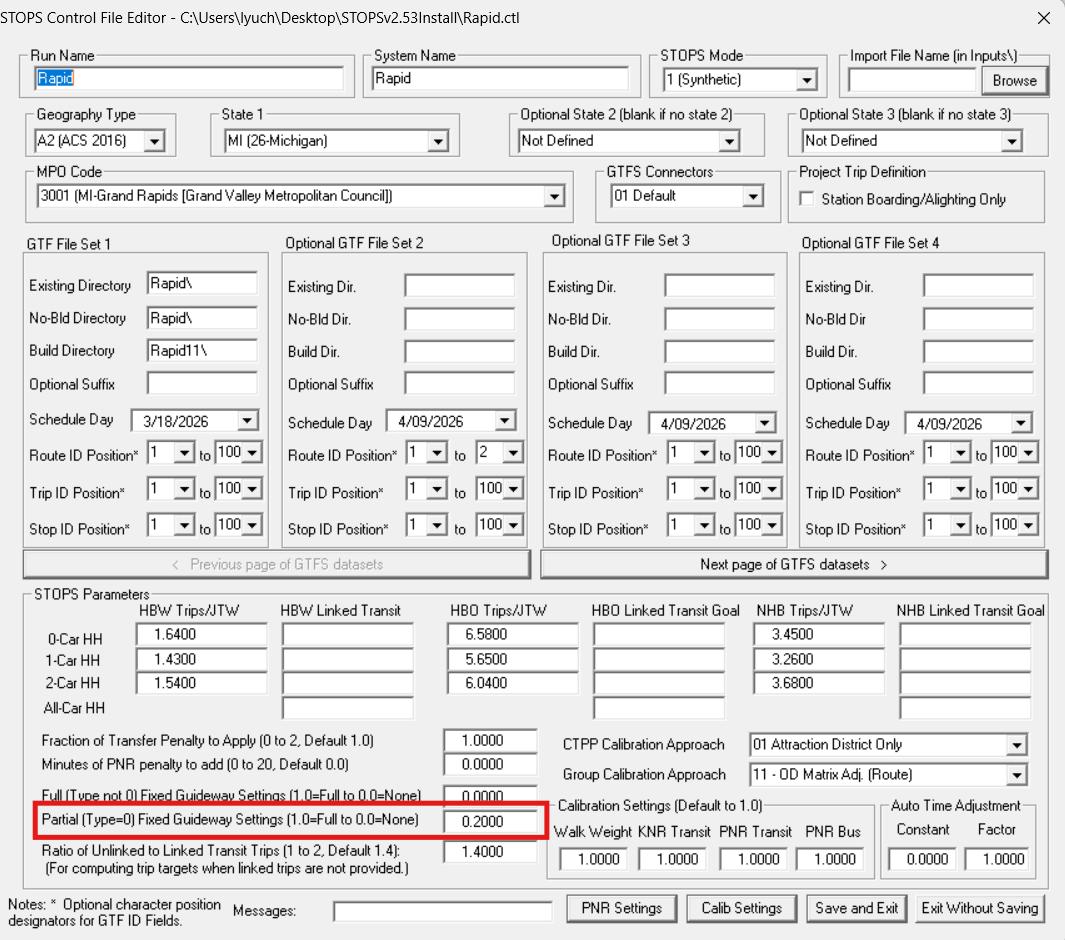
Figure 9: Partial Fixed Guideway Set-up 1
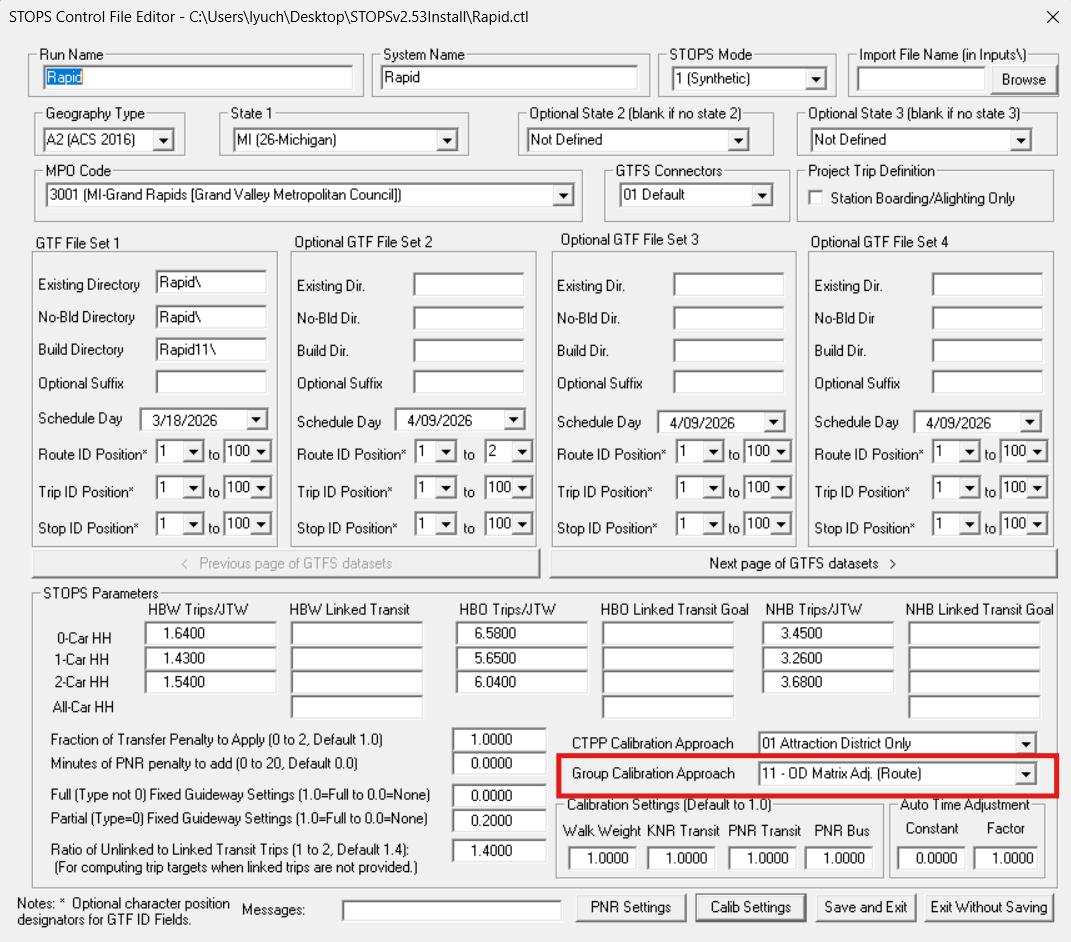
Figure 10: Partial Fixed Guideway Set-up 2
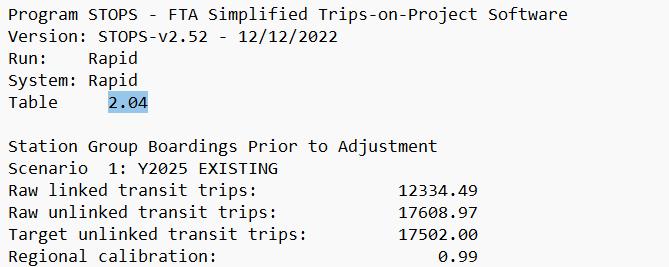
Figure 11: STOPS Output for Baseline Verification
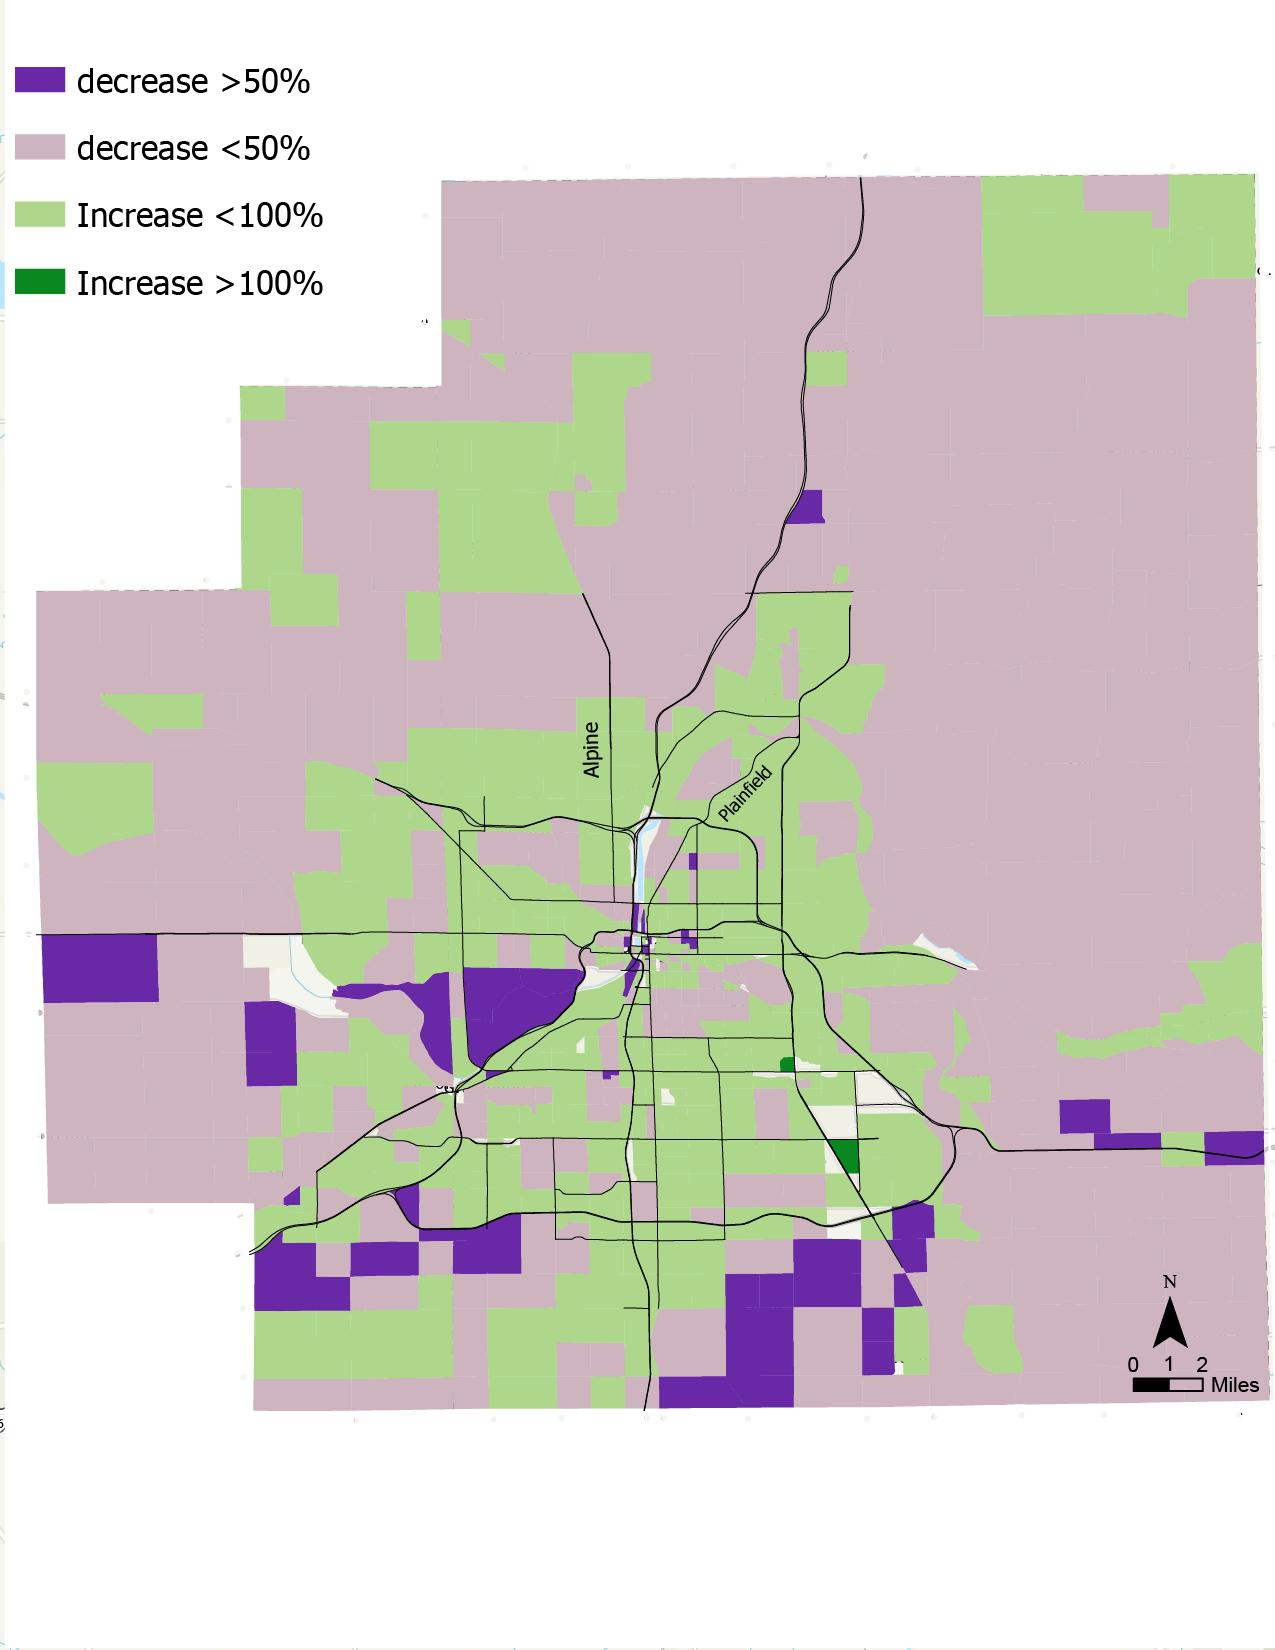
Figure 12: HN Scenario vs MPO Scenario Population
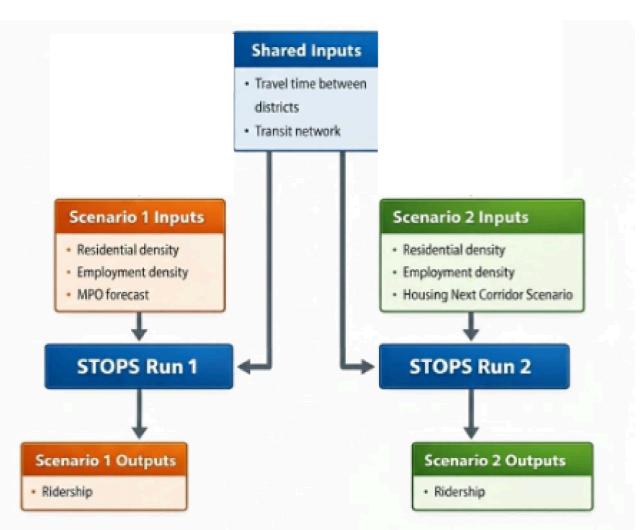
Figure 13: STOPS run with Housing Next and MPO scenarios
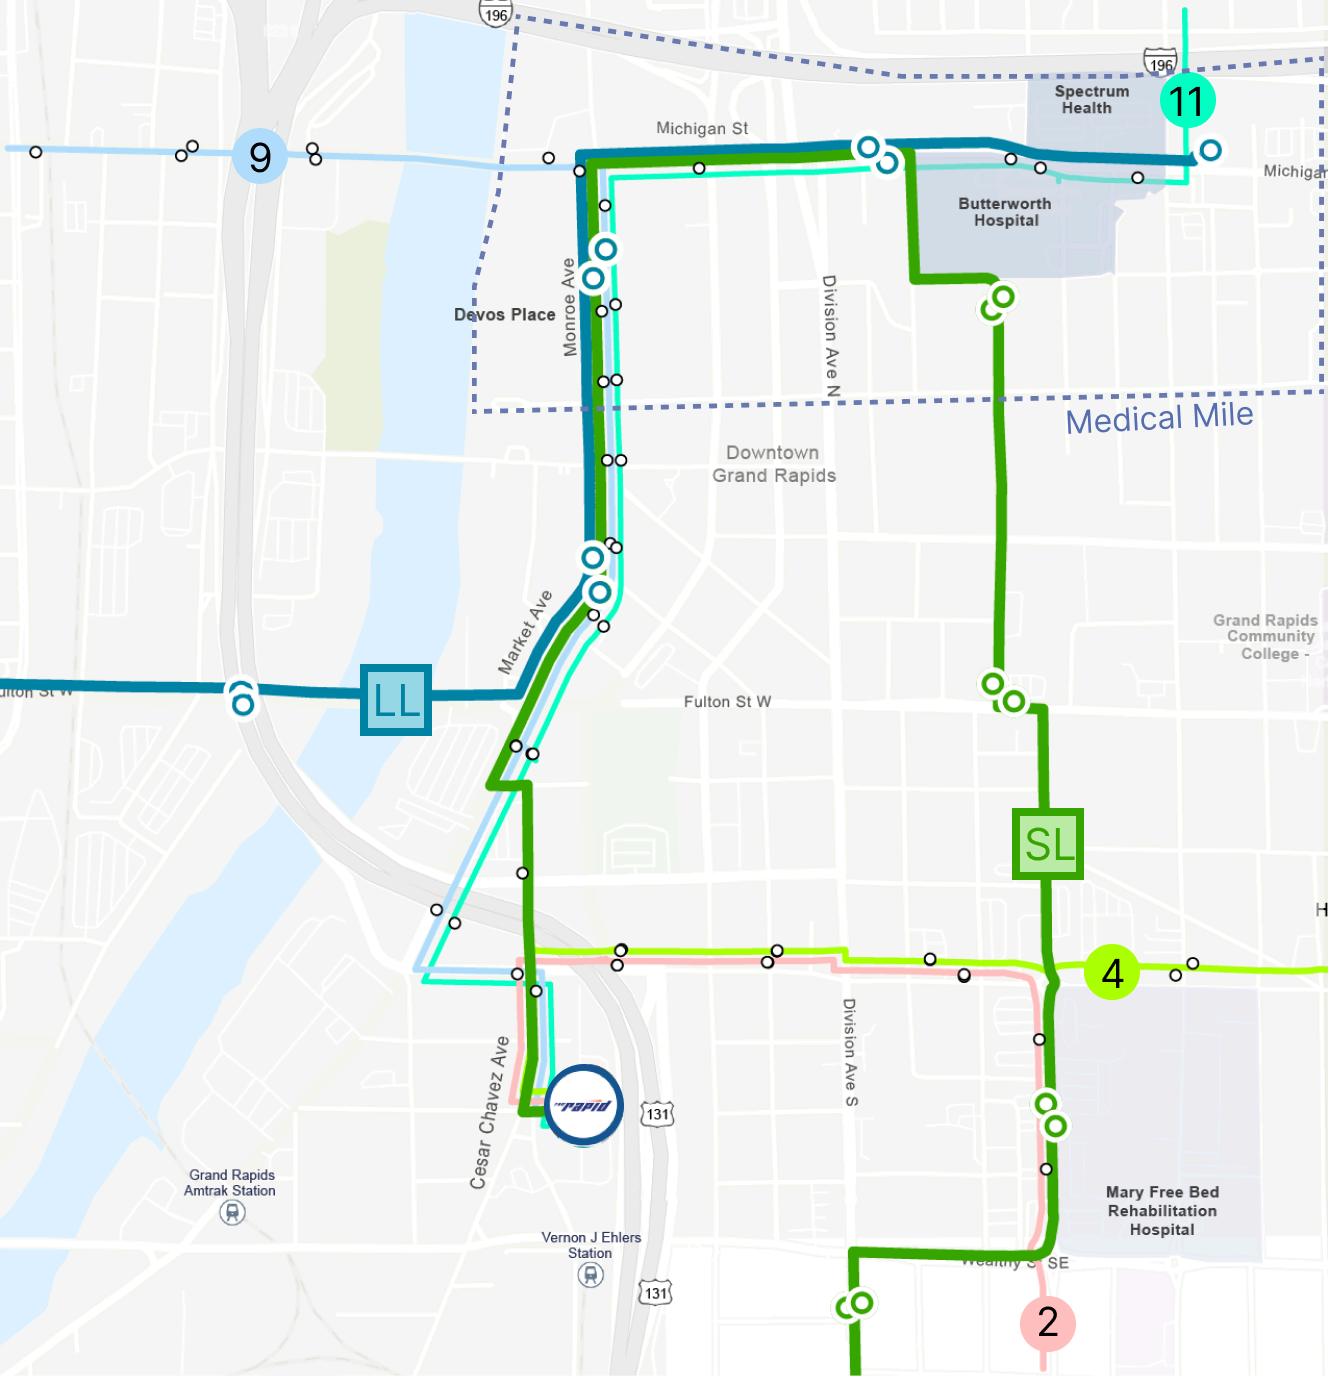
Figure 14: Grand Rapids Downtown Key Bus Route and Stops
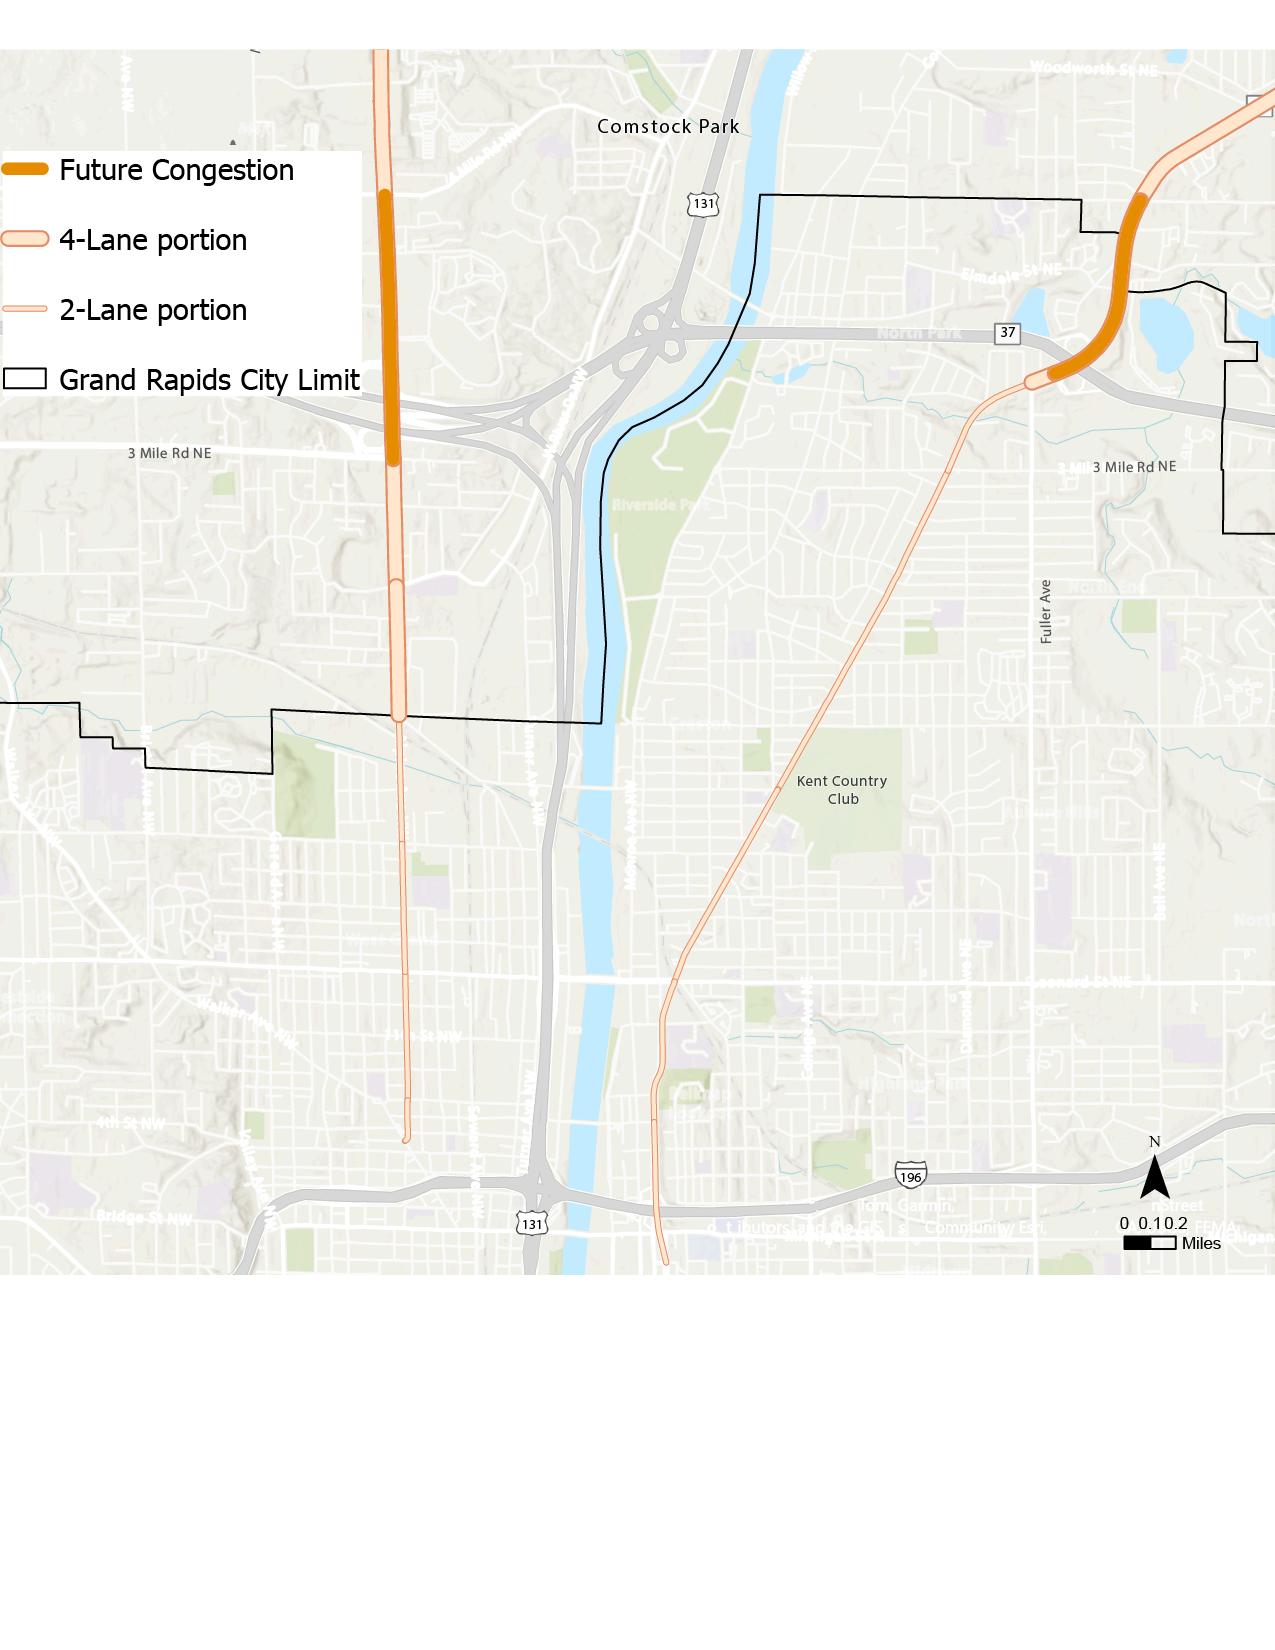
Figure 15: Projected Congestion and Road Width
ACKNOWLEDGEMENT
I want to acknowledge the individuals who have provided motivation, guidance, and input for this capstone report First, I would like to thank Tim Roseboom from The Rapid As a senior planner, Tim provided initial motivation and met with me consistently throughout the year to offer feedback, identify questions of interest to The Rapid’s planners, and provide data and logistical support, including an interpreted tour of The Rapid’s facilities during my site visit
I also want to thank Professor Joe Grengs, who agreed to serve as a mentor for this project and introduced me to the Transit Capacity and Quality of Service Manual, as well as other important guides such as those from NACTO through a previous class I appreciate his advice on report structure and on staying organized while conducting a large-scale project independently.
I want to thank Jeffrey Roux from the Federal Transit Administration, who offered to walk me through using STOPS, a FTA modeling software that is publicly available but difficult to master, and for which many transit agencies have resorted to expensive consulting services for assistance His experienced guidance and meetings with me enabled the completion of an important component of this report.
I would like to thank Mike Tresidder from Spokane Transit Authority; Emily Provonsha from Pittsburgh Regional Transit; and Nadia Barrera-Ramirez and Roberto Gonzalez from CapMetro (Austin), who offered input on the planning contexts of their BRT services and pointed me to resources from their agencies While this report does not include a dedicated case study section, their input helped me develop a framework for the report and appreciate the collegial environment within the transit planning field
Finally, I want to thank Sam Kallen from Flywheel, who provided context on the Housing Next housing scenario and shared the geospatial files developed by Housing Next to quantify new development possibilities I also want to thank George Yang from the Grand Valley Metro Council, who has consistently and promptly responded to my email inquiries for data products ranging from socioeconomic forecasts, landuses, to transportation datasets
1, INTRODUCTION
1.1 Key Motivations
This report supports the vision of The Rapid–the transit agency serving Grand Rapids, a midsized Michigan city that is home to two of the state’s only Bus Rapid Transit (BRT) lines–by addressing its need for clear, quantitative evidence as it considers expanding high-capacity transit in northside Grand Rapids, especially along the Plainfield and Alpine corridors. This report contributes to The Rapid’s planning work and to the BRT literature in three ways:
(1) It develops an analysis framework to evaluate service concepts along two candidate corridors for BRT upgrades;
(2) It produces clear, FTA-recognized quantitative evidence on ridership benefits with the introduction of new BRT through the use of STOPS modeling software developed and made available for public use by FTA; and
(3) It uses scenario analysis to provide multiple outlooks for future ridership that better incorporate land-use change and planning uncertainty
More broadly, the work can serve as a reference for evaluating high-capacity transit in a midsized city.
1.2 Overview of The Rapid’s Current Service and Rationale for High-Capacity Transit
The Interurban Transit Partnership (“The Rapid”) provides regional public transit service in Grand Rapids and surrounding municipalities Its highest-capacity fixed-route services include Michigan’s only two Bus Rapid Transit (BRT) lines: the Silver Line and the Laker Line. These routes operate at higher frequencies and include transit-priority elements along portions of their alignments, along with enhanced station amenities However, the existing BRT network does not extend beyond downtown into northern Grand Rapids, leaving key northside corridors outside the region’s fastest and most reliable transit offerings This gap is also reflected in public comments from The Rapid’s recent Transit Master Plan process (The Rapid, 2024, p. 21).
The Rapid is exploring an expansion of its BRT network, with particular focus on the Alpine and Plainfield corridors connecting downtown to northern Grand Rapids and nearby municipalities These corridors are currently served by Route 9 (Alpine) and Route 11 (Plainfield), both operating at 15-minute peak headways, among the highest-frequency services in The Rapid’s system The corridors are shown relative to the existing BRT lines in Figure 1
2, LITERATURE REVIEW
2.1 What defines BRT
Bus Rapid Transit (BRT) is defined in the Transit Cooperative Research Program (TCRP) guide as an integrated, rubber-tired rapid transit system that combines running ways, stations, vehicles, services, and ITS elements to deliver rail-like performance with bus flexibility (Kittelson & Associates, Inc , et al , 2007, p S-1)
BRT services typically feature a combination, if not all, of the following infrastructure elements to support speed, reliability, and a clear system identity (see figure 3 for differences in funding implications between BRT1 and BRT2) (NACTO, 2007, Table 1)
● Lane Priority (Mixed traffic vs. bus-only lane)
○ BRT1: Typically operates in mixed-traffic or peak-only running-way
○ BRT2: Typically operates in a dedicated transitway that is distinctly marked (e.g., colored pavement/paint) or physically separated from general traffic
● Transit Priority (Signal priority / queue jump)
○ Transit preferential treatments such as exclusive bus lanes, transit signal priority (TSP), queue jumps/bypass lanes at low LOS intersections
● Station Amenities (real-time info, branding, enhanced stops)
○ BRT1: Typically features unique branding and real-time passenger information.
○ BRT2: On top of BRT1, it often features platform-level boarding and off-board fare payment
Compared to local bus routes, BRT typically has more widely spaced stops–often about a half-mile or more apart–based on the assumption that people are willing to walk farther to access upgraded service (Walker, 2012, p. 64). Compared to express service, BRT stops are generally closer together and served more frequently (10-minute peak headways and 15-minute off-peak headways for full-service BRT) to provide adequate access along the corridor while still supporting faster travel (Kittelson & Associates, Inc., et al., 2007, p. 3-23).
Figure 2: BRT Services vs Local Routes and Express Services
Note. Reprinted from Transit Capacity and Quality of Service Manual (3rd ed., Exhibit 2-20, p. 2-36), by Transportation Research Board, 2013, National Academies Press
Given these service characteristics, the accessibility impacts of BRT depend on both how the service improves regional travel and how easily riders can reach and use its stations. In this report, accessibility refers to the extent to which residents can use transit to reach destinations efficiently, as well as the ease with which riders can access the transit service itself. This includes both destination-based access, or how quickly riders can reach key destinations, and stop or station-area access, such as walking distance to stations, ease of boarding, and the quality of the pedestrian environment. The accessibility benefits of BRT are therefore somewhat mixed On one hand, BRT can improve destination-based access by reducing travel times through fewer stops, transit priority treatments, and more reliable service Enhanced station amenities, such as real-time information, branding, level boarding, and off-board fare payment, can also make the system easier to navigate and use On the other hand, wider station spacing may reduce station-area access for some riders by increasing walking distances, particularly for those with limited mobility or in areas with poor pedestrian infrastructure. Thus, while BRT has the potential to improve overall transit accessibility, its benefits depend heavily on station spacing, corridor design, and the quality of first- and last-mile connections.
2.2 Previous Studies by TheRapid on BRT and high-capacity transit
A previous comprehensive evaluation of high-capacity transit opportunities in Grand Rapids was conducted in 2018, titled ALIGN. This study identified Plainfield, Eastern, and Kalamazoo as three avenues suitable for BRT upgrades At the time of the study, Plainfield was one of the most heavily used corridors, despite being served by only one route. While Alpine Avenue wasn’t recommended for BRT, it was suggested for amenity improvements, including transit signal priority, as it was one of the most congested corridors at the time (AECOM et al , 2018)
The study also identified several high-capacity service options, as shown in table 1 The suitability decreases as the list goes down in each column
Table 1: Summary of Recommendations from ALIGN Study
Cutlerville Express
Cascade/Airport Express
Cedar Springs/Rockford
Express Grandville Express
Eastern Avenue BRT
Laker Line BRT Extension (Michigan Street)
Kalamazoo Avenue BRT
Plainfield Avenue BRT
Michigan Street
Fuller Avenue/Kalamazoo Avenue
Leonard Street
2.3 Evaluation Structure for BRT Corridor Suitability
For transportation planning corridor studies, the FTA typically requires an early study in the environmental review process called an alternatives analysis (see figure 3). This requires any proposed improvements to be evaluated against the status quo to justify new investments In transit planning, the evaluated alternatives would include different alignment options for a p d ll diff i fi i d ( il b )
Capacity Improvements,” by Federal Transit Administration, n d , U S Department of Transportation
Drawing from the experiences of peer agencies, including Pittsburgh Regional Transit and Spokane Transit Authority, several common evaluation metrics are used to evaluate alternatives, including demographics, current and forecast ridership, traffic impacts, supportive land-use, capital cost (Spokane Transit Authority, 2021; WSP, 2017) The following evaluation of The Rapid BRT expansion options only focuses on supportive landuse, ridership and demographics, Given the author’s time and capacity constraints Both Routes 9 and 11 are evaluated qualitatively for the degree to which surrounding land use supports transit and for existing residential and employment densities, using established planning thresholds and recommended BRT design features as reference points Both corridors are also evaluated quantitatively for current ridership performance and modeled ridership changes under alternative BRT upgrade possibilities.
3, RIDERSHIP AND LAND-USE EVALUATIONS
3.1 Supportive Land Use Evaluations
In 2024, Grand Rapids concluded its Bridge to Our Future Community Master Plan, which offers an outlook on community-preferred land use conditions for the next 20 years (City of Grand Rapids 2024) Figure 4 zoomed in on the land uses specifically along Plainfield and Alpine g
Grand Rapids has been adopting a form-based code for more than a decade, which allows greater flexibility in the types of housing that can be developed and permits mixed uses without rigid restrictions on building typologies (Brey, 2018) As a result, both Alpine and Plainfield have strong potential to accommodate transit-oriented development (e.g., higher densities, reduced parking requirements) without being precluded by overly restrictive zoning However, given the community-preferred land use patterns, each corridor also has distinct strengths and weaknesses related to trip generation, as summarized qualitatively in Table 2.
Strength
Table 2: Alpine and Plainfield Land use Strength and Weaknesses
Diverse land-use mix (e.g., innovation center, manufacturing, logistics), which could support a broader range of regional trip purposes
Predominantly compact neighborhood land use; supports varied housing types and small-scale neighborhood commercial uses
Weakness
Significant portion lies outside city limits (not covered by the Community Master Plan); currently characterized by auto-oriented big-box retail
3.2 Land Use Density Evaluations
Large park area (golf course) creates political/implementation uncertainty about future redevelopment or full build-out
A widely cited standard in transit land-use guidelines - referenced by leading planning organizations such as Puget Sound Regional Council - derives from Guerra and Cervero (2010). In that study, the authors develop normative benchmarks that relate assumed BRT capital cost per mile to the surrounding activity density (jobs + residents) required to achieve strong cost-effectiveness, based on regression models linking ridership to land-use and service factors: about 17 jobs and residents per acre at $10 million per mile, rising to about 88 jobs and residents per acre at $25 million per mile (Puget Sound Regional Council [PSRC], 2015, p. 20). These two benchmarks are referred to as benchmark 1 and 2 in the remaining part of this section PSRC cited suitable density for BRT as +/- 17 residents and jobs per gross acre
Figure 5 visualizes land-use activity density (the sum of jobs and persons per acre) along Alpine and Plainfield, based on Grand Valley Metro Council forecasts for 2030 and 2050, respectively, with colors stratified according to benchmarks 1 and 2 above. The map unit is the traffic analysis zone (TAZ), as defined by the Grand Valley Metro Council. It shows that, for either corridor, the majority of surrounding areas do not meet the benchmarks Of the 63 TAZs total, only 31 in 2030 meet benchmark 1 and 34 in 2050, with most concentrated near downtown. While this suggests a need for future densification, these benchmarks are prescriptive thresholds and do not need to be treated as definitive in current BRT location planning
3.3 Existing Ridership Comparisons
According to The Rapid’s 2024 ridership data analyzed by the author, Route 9 has an average daily ridership of 1,065, compared to 665 on Route 11. To further compare routes on key cost-effectiveness indicators-ridership per mile and ridership per hour-Figure 6 presents key routes side by side across different times of day and days of the week. Route 9 outperforms Route 11 across all measures and time periods. More notably, while still trailing the Laker Line, Route 9 significantly outperforms the Silver Line, the earliest-implemented BRT route in Grand Rapids. Field observations indicate that the Silver Line has scaled back some of its early BRT features, including off-board fare vending and payment, and its ridership no longer stands out relative to regular routes on key productivity metrics
3.4 Ridership Generation Contexts
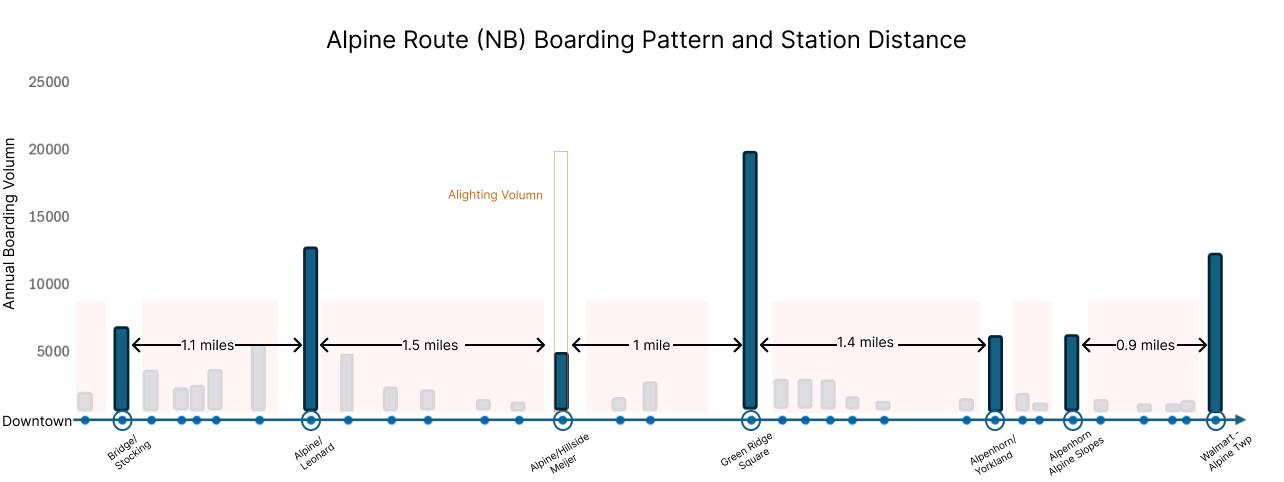
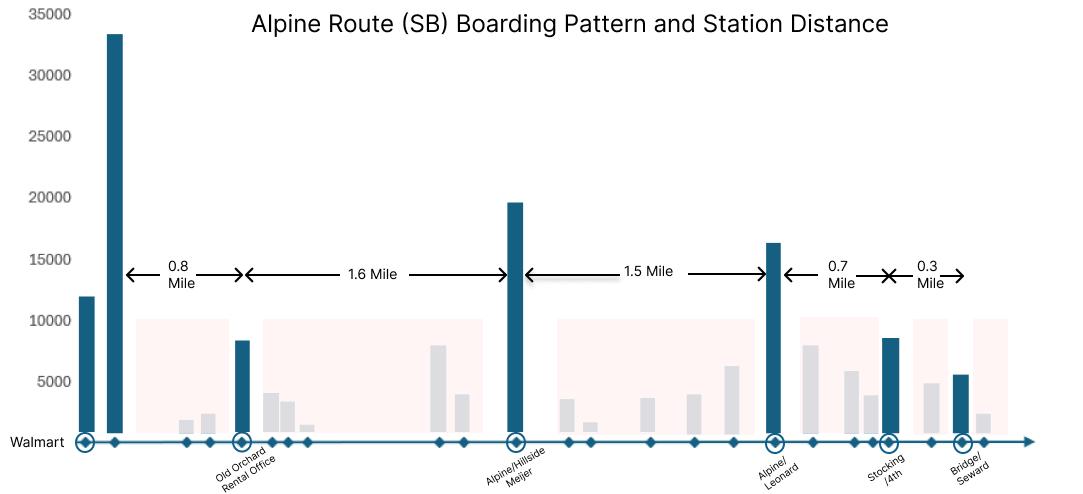
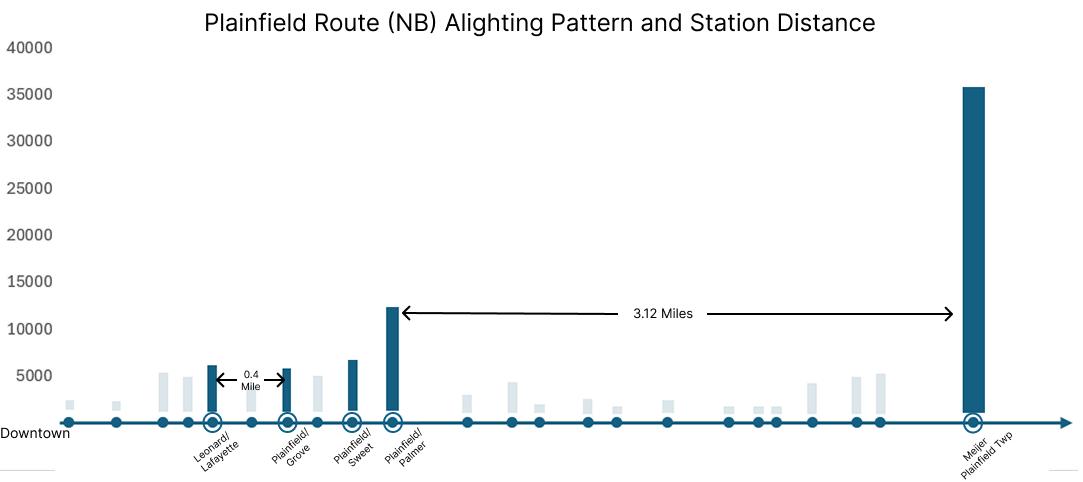
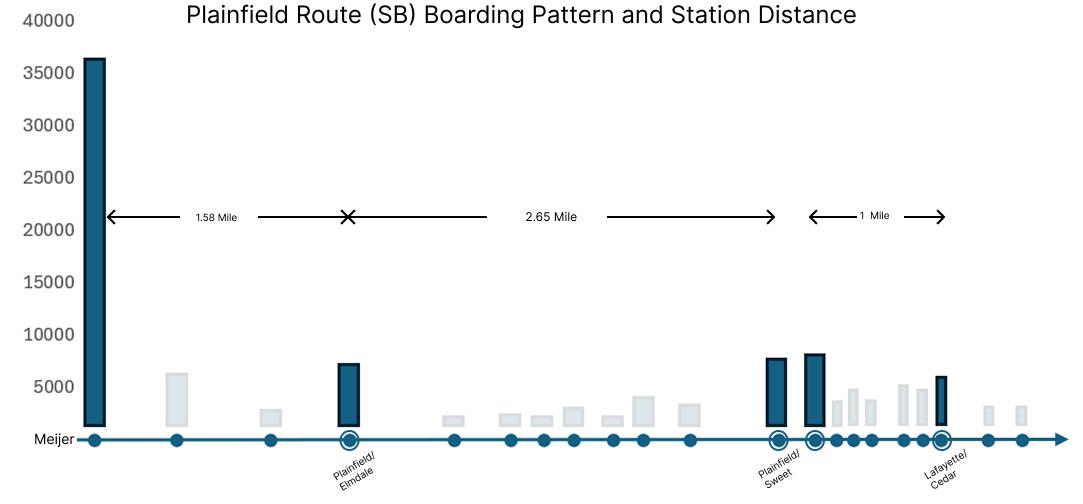
The boarding map from Figure 7 suggests that ridership on both corridors is anchored by a small number of land-use “generators,” but the spacing and continuity of those generators differs in a way that matters for near-term BRT feasibility - A route with more evenly spaced, high-ridership stops would make an upgrade to BRT easier, since these stops already provide ridership-justified siting choices for BRT stations.
Route 9: a continuous chain of mixed-use and retail/residential nodes. Along Route 9, higher boardings appear repeatedly at multiple activity centers rather than concentrating only at the ends Several of the largest stops coincide with (1) urban mixed-use areas closer to the city, and (2) suburban retail/residential concentrations farther north. Importantly, these generators are distributed at relatively regular intervals, creating a corridor with consistent demand and multiple all-day trip purposes (work, shopping, services, and neighborhood-based trips). This “beads-on-a-string” pattern is advantageous for BRT because it supports frequent service and justifies investments (stations, transit signal priority, all-door boarding) across the corridor–not only at a few peak locations
Route 11: strong anchors, but more uneven demand between them. Route 11 also shows clear high-ridership anchors tied to distinct land-use contexts–urban infill
near the southern end, a major suburban mall at the northern end, and a schools/parks district that generates localized ridership. However, the boardings between these nodes appear more dispersed and generally lower, indicating that demand is more concentrated around a few destinations rather than sustained along the entire alignment. This pattern can make BRT harder to “establish” as a corridor-wide service because improvements may benefit only limited segments unless land use intensifies in the gaps
Overall, Route 9 Alpine has demonstrated advantages for near-term BRT conversion, as it already has the ridership pattern to establish BRT station locations In the long-term, however, planners would need to take into consideration potential land use changes along these routes to accommodate new residential/employment centers that could emerge.
3.5 Corridor Demographics
The demographic characteristics of the Plainfield and Alpine corridors could inform The Rapid’s understanding of the equity impacts of potential service upgrades and potential ridership for the service. In transit planning, “captive riders” is a key demographic traditionally referred to transit users who lack access to alternative modes of transportation, such as cars, and are therefore dependent on transit Recent literature, such as TransitCenter (2016) and Guerra (2022), has used travel surveys to demonstrate that residents with certain characteristics traditionally associated with “captive riders” are also highly sensitive to service quality, including frequency, travel time, and station access Improving service could increase ridership among these groups, who might otherwise choose to borrow a car, rideshare, walk or bike, or not take a trip at all.
Table 3 summarizes corridor-area demographics at the census-tract level for the two corridors
Table 3: Corridor and City Transit-dependent Demographics
To better understand the spatial distribution of riders from households without cars and senior residents, Figure 8 was developed to illustrate the percentage distribution of each variable. It shows that, for the most part, the relationship between seniors and zero-car households is inverse: seniors tend to live farther from downtown Grand Rapids, while zero-car households tend to be more concentrated near the downtown area. However, several census tracts show a coincidence of both a high percentage of zero-car households and senior citizens In addition, several transit-oriented market-rate housing developments in recent years, featuring minimal set-back, proximity to transit stops, and high zero-car percentage in the area, potentially signal the emergence of “voluntary transit-dependent riders,” also known as “captive by choice,” as described by Lierop and El-Geneidy (2017). This definition includes riders who are financially capable of owning a car, but choose not to due to the convenience of transit
4, THE USE OF STOPS IN RIDERSHIP FORECAST
4.1 Why Use STOPS
The Simplified Trips-on-Project Software (STOPS) is used to estimate transit ridership and evaluate the impacts of proposed transit investments in a consistent FTA-compliant framework It is treated as an important source of justification by FTA for Small Starts and New Starts projects because it links land use, travel demand, and transit service characteristics into a comprehensive modeling process STOPS requires planners to compare build scenarios to existing no-build to justify any new project decisions with the modeled changes in ridership (RSG, 2024)
4.2 Required Input Files and Initial Calibration
Required Input Files (Pre-Calibration, Type 0)
● Parameter/control file (.ctl)
● CTPP data (journey-to-work flows, provided by FTA)
● TAZ shapefile and zonal data (provided by Grand Valley Metro Council)
● Station file (including stop IDs and attributes)
● District definitions and station group files (referencing land use categories)
● MPO socioeconomic forecasts (population and employment provided by GVMC)
Key Calibration Decisions
● Partial Fixed Guideway for BRT
Only the Laker Line in Grand Rapids is treated as a partial-fixed guideway by modifying its GTFS route type (from 3 to 0). This reflects its stronger performance and infrastructure The Silver Line is excluded due to underperformance, and a partial fixed guideway coefficient of 0.2 is applied in STOPS to capture BRT boost.
● Route-Level Group Calibration
Group calibration is set to 11- route-level (OD matrix adjustment) rather than station-level because weekday station boarding counts are unavailable The weekday ridership by route is used for calibration instead
Figure 9: Partial Fixed Guideway Set-up
Figure 10: Partial Fixed Guideway Set-up
4.3 First Test Run and Regional Calibration Check
The initial STOPS calibration, run on current year, indicates the model is well-aligned with observed conditions For the Y2024 Existing scenario, the target unlinked transit trips are 17,502, compared with 17,608.97 unlinked transit trips produced in the first test run. This yields a regional calibration coefficient of 0.99, which is very close to 1 0 and suggests the model’s regional boardings and overall transit demand are appropriately scaled prior to evaluating service changes. With this calibration performance, subsequent scenario testing can be interpreted as reflecting service effects (frequency and BRT improvements) rather than artifacts of under- or over-estimating base transit ridership.
4.4 Tested Scenarios and Ridership Results
For the test runs, the GTFS schedules were modified to create four service scenarios for evaluation:
1. Route 9 – Frequency Increase: headways reduced by 50%, yielding approximately 10-minute peak service and 20–30 minute off-peak service
2. Route 9 – Full BRT Upgrade: BRT conversion with station-level enhancements and selected transit priority treatments (e g , lane/queue priority), generally comparable to the Laker Line
3. Route 11 – Frequency Increase: headways reduced by 50%, yielding approximately 10-minute peak service and 20–30 minute off-peak service
4 Route 11 – Full BRT Upgrade: BRT conversion with station-level enhancements and selected transit priority treatments comparable to the Laker Line concept.
These test cases are intended as bounding cases Final service characteristics should be determined by The Rapid, particularly because a BRT upgrade may include stop consolidation
Figure 11: STOPS Output for Baseline Verification
(skipped stations) and other operational decisions In practice, the implemented improvements are expected to fall between the “frequency increase” and “full BRT upgrade” cases for each route
Table 4 summarizes corridor daily ridership impacts. On Route 9, modeled ridership increases from 1,419–1,412 (Existing) to 2,090–2,286 (Frequency Only) and to 3,664–3,729 (BRT Upgrade) in 2030/2050 On Route 11, ridership rises from 999–1,012 (Existing) to 1,206–1,249(Frequency Only) and to 1,433–1,548(BRT Upgrade).
Test Cases
Table 5 summarizes system-wide daily ridership impacts Systemwide impacts are more modest, reflecting that gains on an upgraded local route may partially substitute for trips on other services In 2030, total ridership is 24,990 under Existing conditions With a Route 9 frequency increase, total ridership rises to 25,212, while a Route 11 frequency increase yields 25,132. Under full BRT upgrades, total ridership increases to 25,529 with Route 9 upgraded to BRT, and to 25,333 with Route 11 upgraded to BRT In 2050, the Existing total is 25,404; totals increase to 25,626 with a Route 9 frequency increase and 25,544 with a Route 11 frequency increase, and to 25,988 with a Route 9 BRT upgrade and 25,770 with a Route 11 BRT upgrade
Test Cases
Table 4: Route-level Daily Ridership Comparison
Table 5: System-wide Daily Ridership Comparison
4.5 Introducing Scenario Planning
Scenario planning is used because long-range transit ridership is driven by uncertain factors–especially land use, housing supply, and where jobs concentrate–cannot be captured well by a single “most-likely” forecast. Instead of passively accepting a point estimate based on past trend lines, scenario planning allows a community to take a long-term view and envision a range of plausible futures it wants This approach supports more resilient decisions by revealing which investments perform well across multiple futures and which depend on specific assumptions (Oregon Department of Transportation, 2017, p 6 )
The Housing Next scenario represents a corridor-focused growth possibility proposed by the Grand Rapids–based nonprofit Housing Next, under the assumption that zoning restrictions in not only the City of Grand Rapids, but also Kent County could be removed to allow high-density housing development along traffic corridors. Rather than distributing new housing evenly or focusing exclusively on Downtown, this scenario proposes concentrating housing growth along key transportation corridors and nodes to better align development with areas that have supportive existing infrastructure, such as sewer capacity and road access (Goodspeed et al., 2024, p 11) Figure 12 illustrates how the Housing Next - proposed scenario compares to the Grand Valley Metro Council forecast in terms of population by TAZs across the metropolitan area Figure 13 illustrates how this scenario is incorporated into the STOPS modeling process
Figure 12: 2050 Population Differences (Housing Next vs GVMC)
Figure 13: STOPS run with Housing Next and MPO scenarios
4.6 Scenario Modeling Results
All ridership forecasts reported here are for 2050 Under the BRT Upgrades Scenario–which corresponds to the Housing Next 2050 land-use scenario–the same BRT investments tested previously yield smaller gains: Route 9 reaches 3,633 with Total (route 9) at 25,213, and Route 11 reaches 1,486 with Total (route 11) at 24,997. By comparison, under the MPO (Scenario1) scenario using the same BRT upgrade assumptions, Route 9 reaches 3,729 with Total (route 9) at 25,988, and Route 11 reaches 1,548 with Total (route 11) at 25,770 Overall, relative to the MPO scenario, the Housing Next 2050 scenario slightly dampens the modeled ridership benefits of the BRT upgrades
Table 6: 2050 Scenario Comparisons of Ridership
4.7 Results Discussion
The results indicate that both Route 9 and Route 11 benefit from service improvements. The largest corridor-level ridership gains occur on Route 9, while systemwide ridership increases are positive but more modest—suggesting that some corridor gains reflect reallocated trips from elsewhere in the network rather than entirely new trips Overall outcomes are also sensitive to land-use/housing assumptions, as shown by differences between the MPO and Housing Next scenarios.
Corridor impacts (large on-route gains, especially Route 9):
● In 2030, Route 9 gains +671 (+47%) with frequency-only and +2,245 (+158%) with BRT, while Route 11 gains +207 (+21%) with frequency-only and +434 (+43%) with BRT.
● In 2050, the same pattern holds: Route 9 gains +874 (+62%) with frequency-only and +2,317 (+164%) with BRT Route 11 increases from 1,012 (Existing) to 1,249 with frequency-only (+237, +23%) and to 1,548 with BRT (+536, +53%).
Systemwide impacts (net gains are meaningful but smaller than corridor gains):
Even under the strongest options in 2050 (Route 9 or Route 11 BRT), totals rise to 25,988 when Route 9 is upgraded (+584, +2.3%) and to 25,770 when Route 11 is upgraded (+366, +1.4%) These increases are much smaller in magnitude than the route-level gains especially for Route 9 implying that modeled gains partly substitute for other services rather than creating entirely new trips
Compared with the MPO forecast, the Housing Next scenario produces smaller route-level ridership gains and more modest systemwide totals, lower by roughly 3-4% This may seem counterintuitive, since Housing Next shifts growth toward corridor-focused development, rather than concentrating it in Downtown Grand Rapids However, the MPO scenario assumes substantially higher Downtown growth, where STOPS likely assigns higher transit propensity
While higher-density, corridor-oriented development would also be expected to increase transit propensity, these results suggest STOPS’ assumptions about relatively stable travel behavior and mode choice may limit how much additional mode shift is reflected under alternative land-use scenarios.
5, RECOMMENDATIONS
5.1 Route-level Justifications
The overall results strongly support upgrading Route 9: either increasing frequency or fully upgrading to BRT would produce the most significant ridership gains, both corridor-wide and systemwide. Route 9 also has more evenly spaced, high ridership-generating centers. The tradeoff, however, is that a significant portion of the route lies beyond Grand Rapids’ jurisdiction and may require additional political coordination if The Rapid pursues infrastructure upgrades to accommodate BRT service Route 11 also sees significant modeled gains from BRT upgrades, even though it is relatively moderate compared to route 9 The community-preferred land use for compact neighborhoods creates opportunities for densification and diversification of land uses along Route 11 Plainfield, with the potential to increase ridership along the route
5.2 Future Data Needs for STOPS Run
While the current STOPS run has achieved high pre-calibration accuracy, for better STOPS modeling performance, several further data items collections are recommended:
● Boarding and Alightings on weekdays: While The Rapid has collected annual boarding and alighting data, it is not broken down into weekday-specific data, which the FTA requires for the station-group calibration method Proportionalizing station boardings based on route-level boardings is not accepted as reliable, since ridership can vary significantly across stations on the same route and between weekdays and weekends.
● Onboard Transit O-D survey: The current STOPS model is “synthetic,” meaning it relies on a traditional four-step model to estimate transit mode share. An “incremental” STOPS model would be better, because it would anchor future forecasts more directly to existing ridership. This would not fully address the core challenge–STOPS’ assumption of consistent transit propensity over time–but it is generally considered a stronger modeling approach To implement it, The Rapid would need to conduct onboard rider surveys to collect O–D information, trip purposes, and whether trips are linked (with transfers) or unlinked
5.3 Infrastructure Opportunities to improve BRT experience overall
Regardless of whether TheRapid decides on choosing Route 9, 11 or both for BRT upgrades, several general improvement opportunities could be considered to improve BRT experience overall regardless of route.
Downtown Transit Priorities: As shown in Figure 14, multiple current and potential BRT routes share a limited number of roads in downtown Grand Rapids, particularly in the Medical Mile area, including Market, Monroe, and Michigan As future traffic increases downtown, transit delays could become more significant. Currently, The Rapid operates peak-only lanes on certain
segments, including Monroe but not Michigan, but it does not have dedicated bus lanes Additional lane and transit-priority treatments could be considered downtown, including dedicated bus lanes and queue-jump lanes Changes along one or more of these segments could have large systemwide impacts, given the number of routes they affect.
Figure 14: Grand Rapids Downtown Key Bus Route and Stops
Bus Lane and Transit Signal Priority on 4- lane segments along Alpine and Plainfield: According to Grand Valley Metro Council forecast, sections of Plainfield and Alpine Corridor will face capacity constraints by year 2050 (defined as a volume capacity ratio > 0.8). As seen in figure 15
vice.
since
CONCLUSION
This report uses an alternative analysis framework that integrates land-use assessment, ridership analysis, and STOPS modeling to evaluate BRT feasibility on the Alpine (Route 9) and Plainfield (Route 11) corridors. Results suggest Route 9 has strong near-term potential for BRT investment, supported by relatively high existing ridership, a more continuous demand pattern, and larger forecast ridership gains. Route 11 shows more limited—but still meaningful—upside under the modeled improvements While population and employment densities along both corridors fall below commonly cited BRT-supportive land-use benchmarks, these thresholds are prescriptive and should not be treated as definitive criteria for corridor selection.
This report also produced a successful STOPS calibration result, demonstrating that it is technically feasible for transit agencies in midsized cities to run STOPS with a simple pre-calibration setup In addition, the report tested both MPO (Grand Valley Metro Council) and Housing Next-proposed, traffic-corridor-focused population growth scenarios in the STOPS ridership forecast model, which showed less ridership gain than anticipated under MPO forecasts While these results may disappoint planners hoping to use the Housing Next scenarios as an alternative basis for justifying BRT, they should be interpreted as modeling outcomes only, as higher-density development along transportation corridors could shift overall transit propensity along these corridors over time that isn’t taken into account into the modeling process.
Finally, this report provides recommendations on actionable steps The Rapid could take to improve STOPS modeling results and prospective BRT performances On the data side, weekday boarding and alighting counts and the onboard O-D survey were identified as key gaps; on the infrastructure side, the report identifies potential focus areas for transit lanes and a station-consolidation study.
REFERENCES
The Rapid. (2024). Engagement summary: The Rapid Transit Master Plan [Report].
https://ridetherapid org/assets/files/1h2/engagment summary-fall 2024 pdf
Kittelson & Associates, Inc., Parsons Brinckerhoff Quade & Douglas, Inc., KFH Group, Inc., Texas A&M Transportation Institute, & Arup. (2007). TCRP report 118: Bus rapid transit practitioner’s guide (Transit Cooperative Research Program Report No 118) Transportation Research Board. https://nacto.org/wp-content/uploads/tcrp118brt practitioners kittleson.pdf
National Association of City Transportation Officials (2007) BRT: Bus rapid transit service design guidelines [Report].
Walker, J (2012) Human transit: How clearer thinking about public transit can enrich our communities and our lives. Island Press. https://doi.org/10.5822/978-1-61091-174-0
Transportation Research Board (2013) Transit capacity and quality of service manual (3rd ed ) National Academies Press. https://doi.org/10.17226/24766
AECOM, Williams & Works, The Image Shoppe, & The Rapid (2018, August 8) The Rapid’s transit improvement plan: ALIGN [Report].
Federal Transit Administration (n d ) Capital investment grants program: New Starts, Small Starts and core capacity improvements. U.S. Department of Transportation. https://transit dot gov/CIG
Spokane Transit Authority. (2021, April 14). Division Street locally preferred alternative (LPA) [Report/Presentation]
Brey, J (2018, December 26) A decade without single-family residential zoning in Grand Rapids. Next City. https://nextcity.org/urbanist-news/a-decade-without-single-family-residential-zoning-in-grand-rapi ds
Puget Sound Regional Council (2015, February) Transit-supportive densities and land uses: A PSRC guidance paper [Report]. https://www.psrc.org/media/4958
Guerra, E (2022) What the heck is a choice rider? A theoretical framework and empirical model. Journal of Transport and Land Use, 15(1), 165–182.
https://wwwjstororg/stable/10 2307/48719768
TransitCenter. (2016). Who’s on board 2016: What today’s riders teach us about transit that works [Report]
van Lierop, D., & El-Geneidy, A. (2017). A new market segmentation approach: Evidence from two Canadian cities Journal of Public Transportation, 20(1), 20–43 https://doi.org/10.5038/2375-0901.20.1.2
RSG (2024) Simplified trips-on-project software (STOPS) user guide: Version 2 52–2 53 [User guide] U S Department of Transportation, Federal Transit Administration https://transit.dot.gov/sites/fta.dot.gov/files/2024-09/STOPS-User-Guide-v2-53-v.pdf
Oregon Department of Transportation (2017, August) Oregon scenario planning guidelines: Resources for developing and evaluating alternative land use and transportation scenarios (Vol. 1 1) [Report]
Goodspeed, R , Mills, S , DuMouchel, L , & Brown, A (2024, November) Launching the Michigan zoning atlas: Report of the West Michigan pilot [Report].
https://static1 squarespace com/static/648b2229bf22686fbf79689f/t/6734bb860332553c353a3e c4/1731509128490/MI+Zoning+Atlas+West+Michigan+Pilot Final pdf
APPENDICES
Appendix A: List of considerations in BRT Planning
Technology
Transit Signal Priorities
Queue Jump Lane
Curbside Concurrent Bus Lane
1, Pedestrian Volumes ideally not high
2, Intersection Low LOS
3, Cross-street bus volume not high
1, Low LOS at intersection
2, ROW Availability
3, Not high pedestrian volume
4, Not high right turn volume if shared
1, Prefer Far-side station
Platform
1, ROW constraint (minimum 11ft, 10 for offset)
2, Peak hour volume of 30-40 runs (not necessary)
3, Existing congestion causing uneven arrival
1, Minimum 8ft Width
1, Need more justification than TSP
2, Often on right-turn lane
3, If near-side station, Need Queue Jump downstream
1, Enforcement is key
Frequency
1, Minimum 15 minutes service during peak
1, Near-side station might need larger width for sightline considerations
2, If use curb extension, need to make sure there can be two travel lanes with another through lane for high boarding volumn stations, especially far-side
1, Bus Bunching might happen with 5-ish Minutes headway
Appendix B: Ridership Pattern and Station Distancing on Alpine and Plainfield