The following report was prepared by a team of nine second-year master’s degree candidates in the Urban and Regional Planning program at the University of Michigan’s Taubman College of Architecture and Urban Planning as part of a graduate capstone course in the Winter 2026 semester. The team created this report under the supervision of Professor Madhavi Reddy for their client, the Community Opportunity Alliance.
Scenario 1: Service Collapse and Inequities Between ‘Earners’ and ‘Non-Earners’ Recommendations
Scenario 2: Financial Innovation and Hybrid Capital Recommendations
Scenario 3: Consolidations and Convenings Recommendations
The Path Forward Introduction ................................................................................................................................15
Community Development in Four Cities: Cleveland, Detroit, New Orleans, and Philadelphia ..........................................................................................28 Cleveland Detroit
New Orleans Philadelphia
New Orleans Learning Trip Survey Limitations
Scenario 1: Service Collapse and Inequities Between ‘Earners’ and ‘Non-Earners’ ................................................................................................43
Scenario Explanation
Real Estate Development as a Model for Earned Revenue
Defining Resilience
CDO Resilience: Literature Review
Resilience Matrix
Scenario 2: Financial Innovation and Hybrid Capital ..............................................62
The Strategic Relationship Framework .....................................................................114
Key Takeaways & Case Studies by Relationship Type
Key Takeaways: How Funders and Other Ecosystem Participants can Support CDOs in Forming Strategic Relationships Discussion & Recommendations ...................................................................................130
Scenario 1: Service Collapse and Inequities Between ‘Earners’ and ‘Non-Earners’ Recommendations
Scenario 2: Financial Innovation and Hybrid Capital Recommendations
Scenario 3: Consolidations and Convenings Recommendations Conclusion ................................................................................................................................136
Acknowledgements
We would like to express our gratitude to Madhavi Reddy for her guidance and support throughout this project, and for her dedication to the community development field. We would also like to thank our client, the Community Opportunity Alliance, specifically Frank Woodruff and Chanse Sonsalla, for their collaboration.
We greatly appreciate the following organizations and the individuals who provided their time and expertise in the form of interviews and survey responses for this project. The successful completion of this report would not have been possible without their insights into the field of community development.
Broad Community Connections
Building Community Value Detroit
Campus District, Inc.
Central Detroit Christian Community Development Corporation
City of Dearborn
City of Detroit
City of New Orleans Office of Community Development
Community Development Solutions LLC
Community Opportunity Alliance
Congress of Communities
E. Warren Development Corp
East Falls Development Corporation
Enterprise Community Partners Detroit
Enterprise Community Partners Gulf Coast Market
Equity Alliance of Michigan
Germantown United CDC
Greater New Orleans Foundation
Green & Healthy Homes Initiative
Hope Village Revitalization
HousingNOLA
Hudson Webber Foundation
Jefferson East, Inc.
Jericho Road Episcopal Housing Initiative
Kresge Foundation
LISC Detroit
Lower North Philadelphia Community Development Corporation (LNPCDC)
Michigan Community Resources
Midtown Detroit Inc.
North Corktown Neighborhood Association
NW Goldberg Cares
OppCo
Park to Broad Arts & Business District
People’s Housing+
Acknowledgements
Philadelphia Association of Community Development Corporations (PACDC)
Rocket Community Fund
Song Community Development Corporation
Source America
South Kensington Community Partners
Southwest Community Development Corporation
University of Michigan
Urban Institute
Urban Land Institute
USNAPBAC
West Park Kamm’s Neighborhood Development
Executive Summary
About the Client: Community Opportunity Alliance
The client for this capstone project is the Community Opportunity Alliance (COA), a national nonprofit organization with a mission to lead the community development field and its partners in shaping and influencing strategies that advance community prosperity. They strive to build the community development field through their Seven Pillars:
1. Convening the Community
2. Nurturing the Field’s Identity
3. Grounding Shared Values in Research
4. Building the Field’s Capacity
5. Advocating as an Alliance
6. Elevating Community Developers’ Voices
7. Engaging Private Funders to Support Community Development1
Local community development organizations (CDOs) work in low- and moderate-income communities to develop affordable housing and commercial space, support small business development, and provide social services. COA’s work strengthens the field of nearly 6,000 local CDOs and 37 state and regional associations. They are committed to creating conditions where residents can shape the destiny of their neighborhoods.2
COA’s Grounding Values in Research
This project builds on COA’s Grounding Values in Research, a multi-year initiative to provide actionable insights that stakeholders can use to increase their effectiveness and build the sustainability of the community development field. The Grounding Values in Research uncovered the urgent need for field-level resilience planning in the face of uncertainty, characterized by rising polarization, deepening austerity, and the increasingly complex needs of neighborhoods across the country.
On October 7, 2025, COA initiated efforts to strengthen resilience and scenario planning across the field—holding a session called Staying Rooted, Moving Forward during the 2025 People and Places Conference in Washington, D.C. The session brought together people from every facet of the community development field to discuss the future of the field and develop an action plan for the short-, medium-, and long-term.
During this session, COA developed three scenarios, detailed below, that reflect some of the most pressing issues in the field of community development right now.3 Through in-depth literature reviews, interviews with 28 stakeholders, surveys of community development organizations, case studies conducted across four U.S. cities, and an immersive learning trip to New Orleans, this project expands on these scenarios, providing a set of tools and recommendations for each. This report provides strategies for building the resilience of the community development field, which can be leveraged by both COA and the field more broadly to prepare for, cope with, and recover from periods of crisis and uncertainty.
Scenario 1: Service Collapse and Inequities Between ‘Earners’ and ‘Non-Earners’
The first scenario is concerned with the decline in grant-funded services due to increased cultural and political pressures while real estate developers and CDFIs are able to sustain themselves through earned income. Potential funding inequities between these “earners” and “non-earners” presents the risk that the sector that houses people is unable to meet their other basic needs.
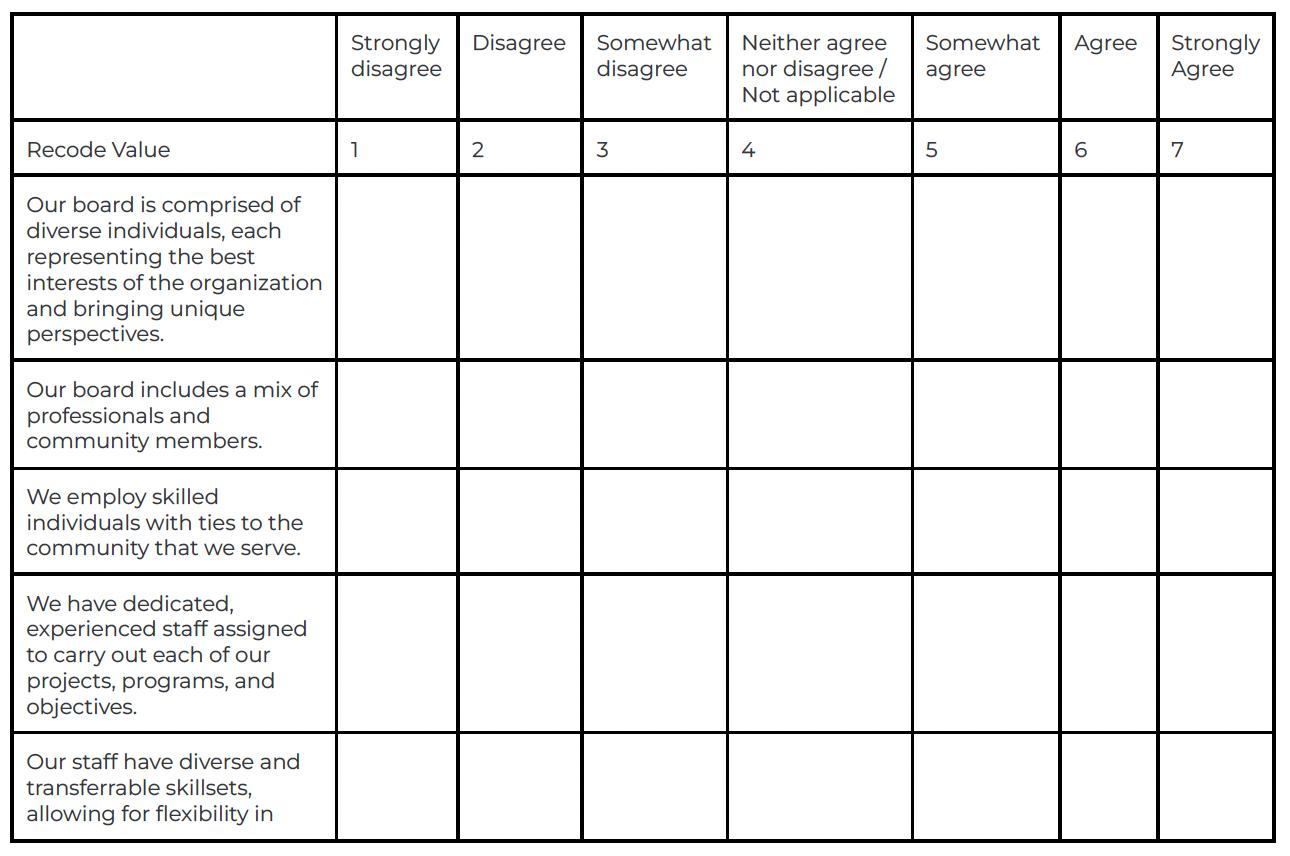
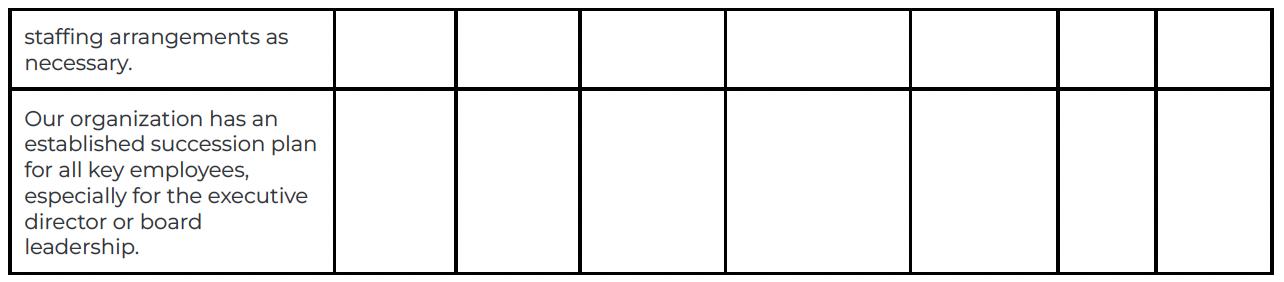
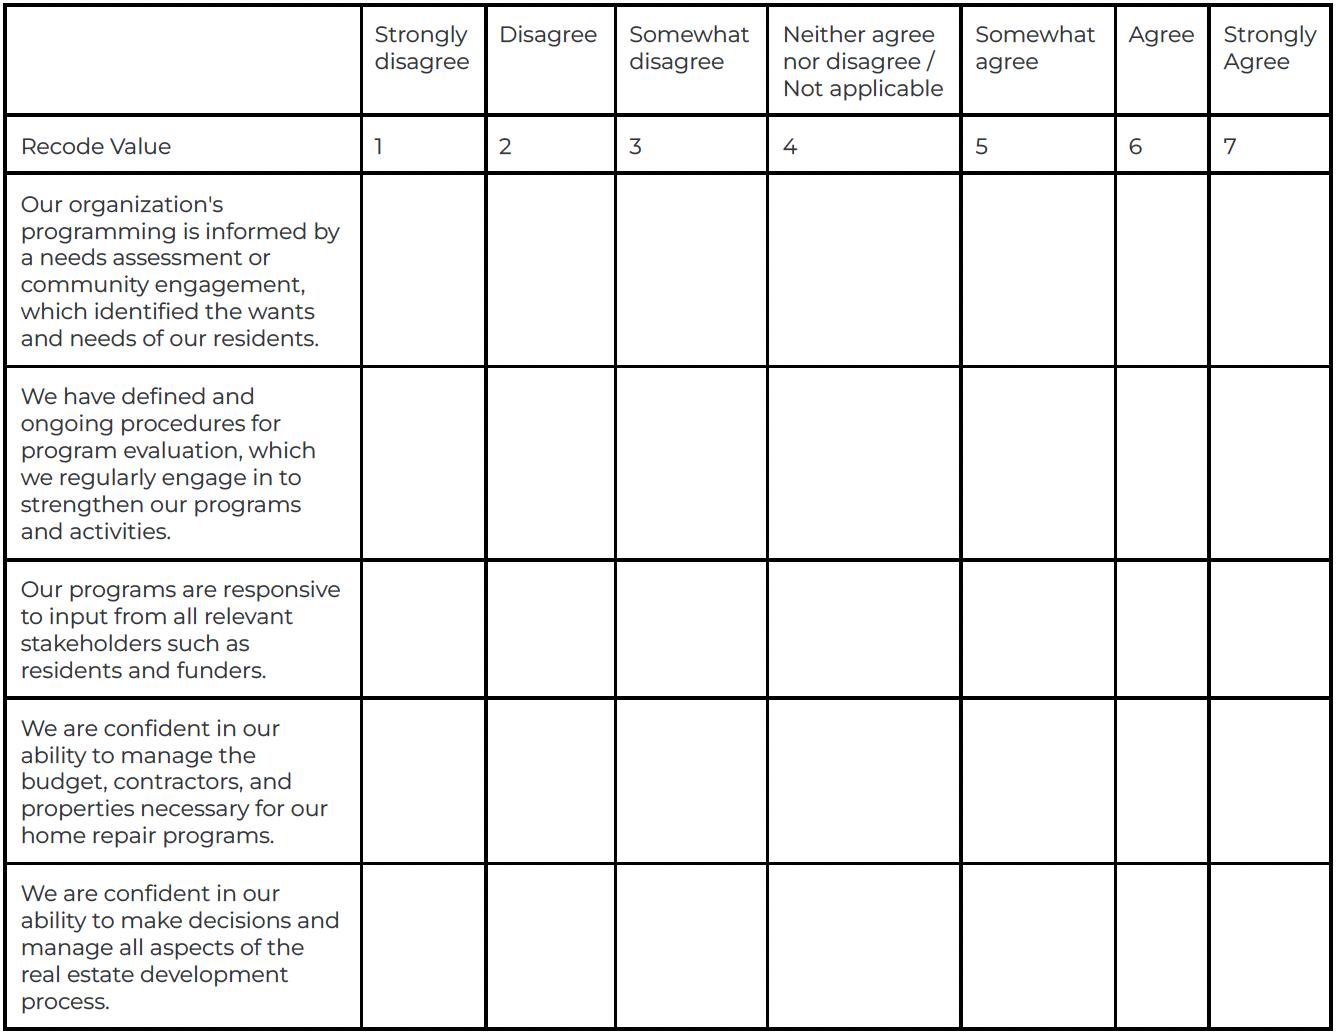
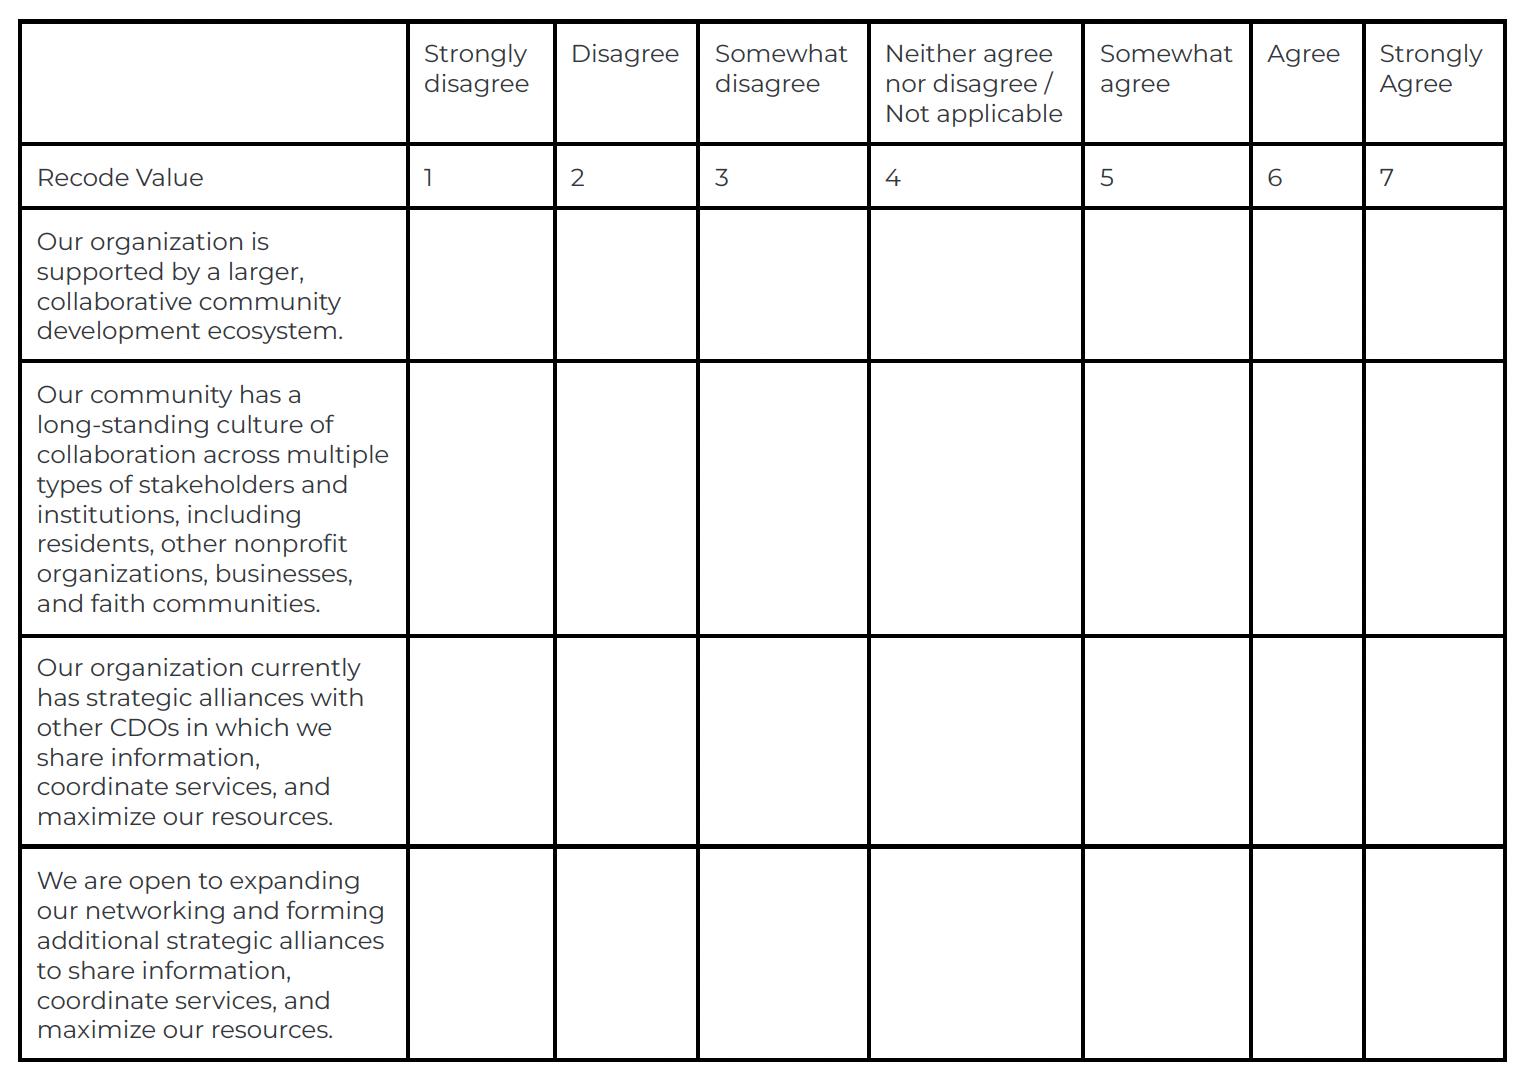
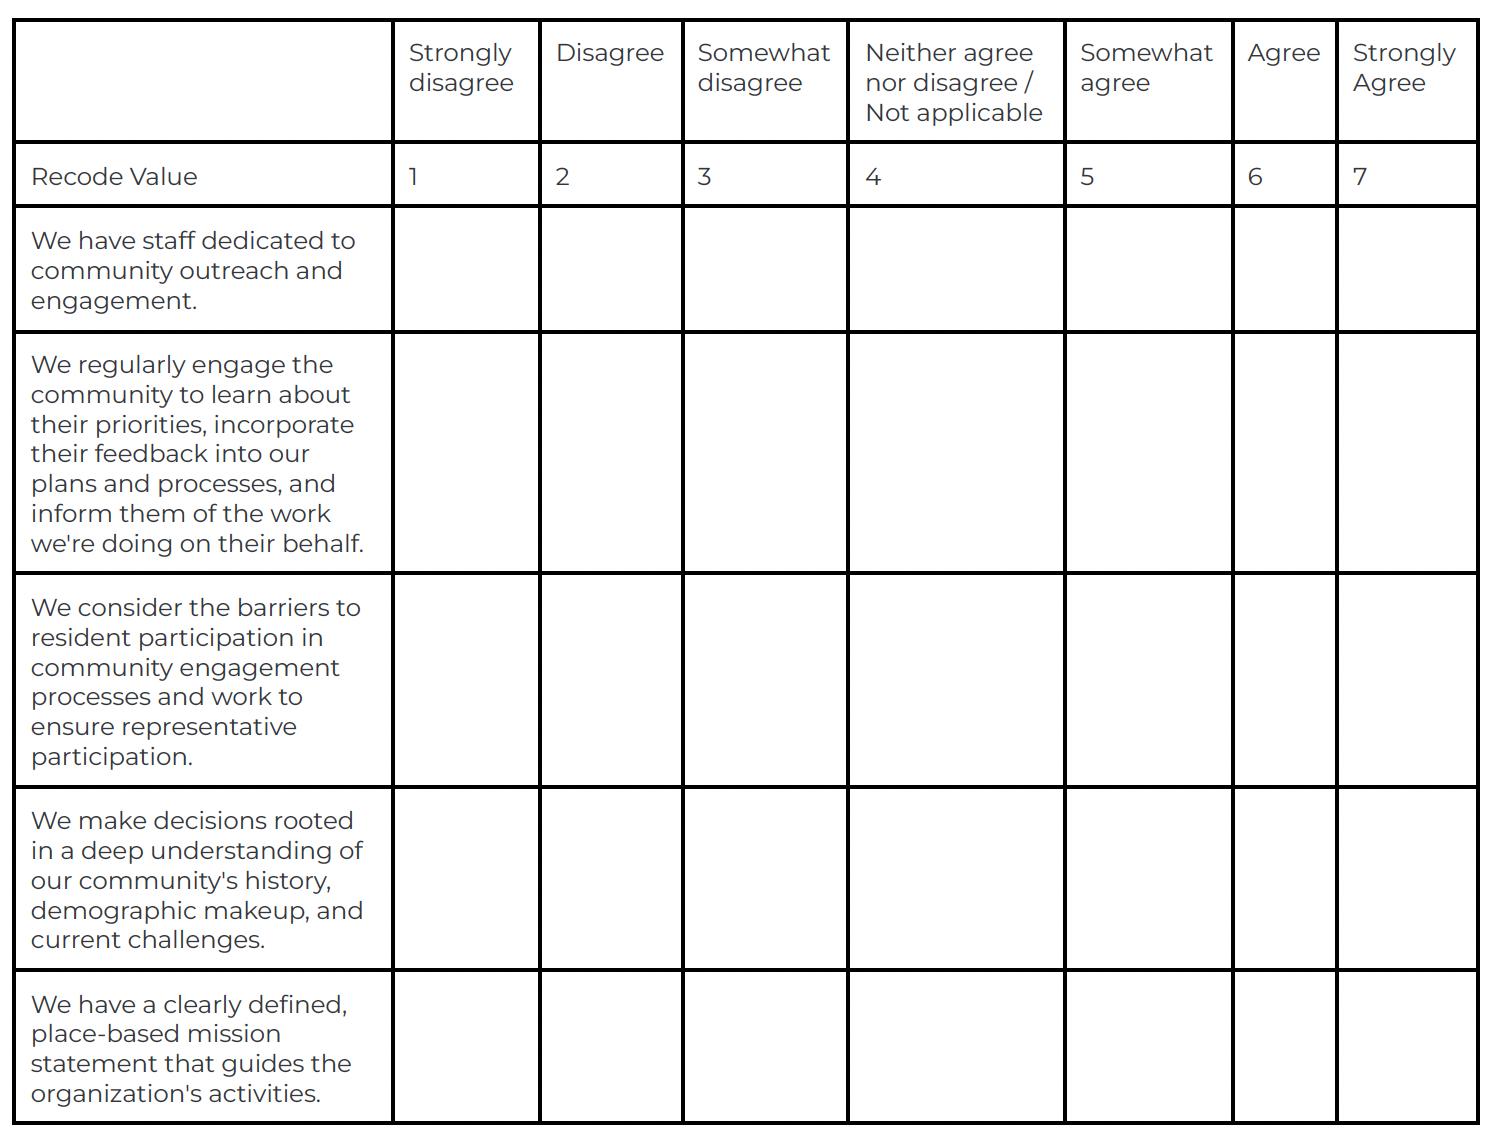
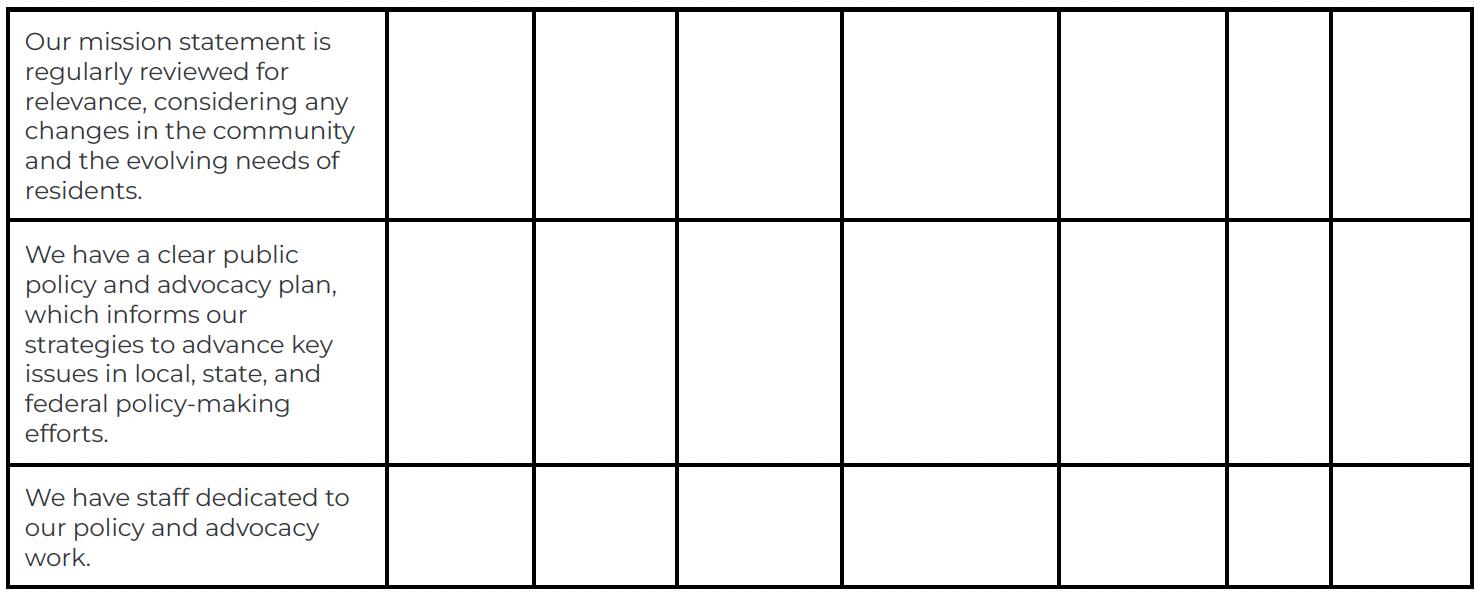
In order to increase the stability of these service providers, this portion of the project focuses on building CDO resilience. To do this, the team developed a Resilience Matrix that provides a mechanism for CDOs to measure and strengthen their overall resilience as an organization. The Matrix, tested across 22 CDOs in four geographies, identifies 28 unique characteristics and strategies across five distinct categories of capacity that contribute an organization’s ability to withstand conditions of uncertainty.
Scenario 2: Financial Innovation and Hybrid Capital
The second scenario looks at over-reliance on single funding sources, particularly philanthropy and CDFIs, with the decline in government funding. This presents the risk of organizations thriving only if they are able to innovate, while others are left behind, which can result in financialization, or the growing influence of investment-driven priorities, and the prioritization of returns over communities.
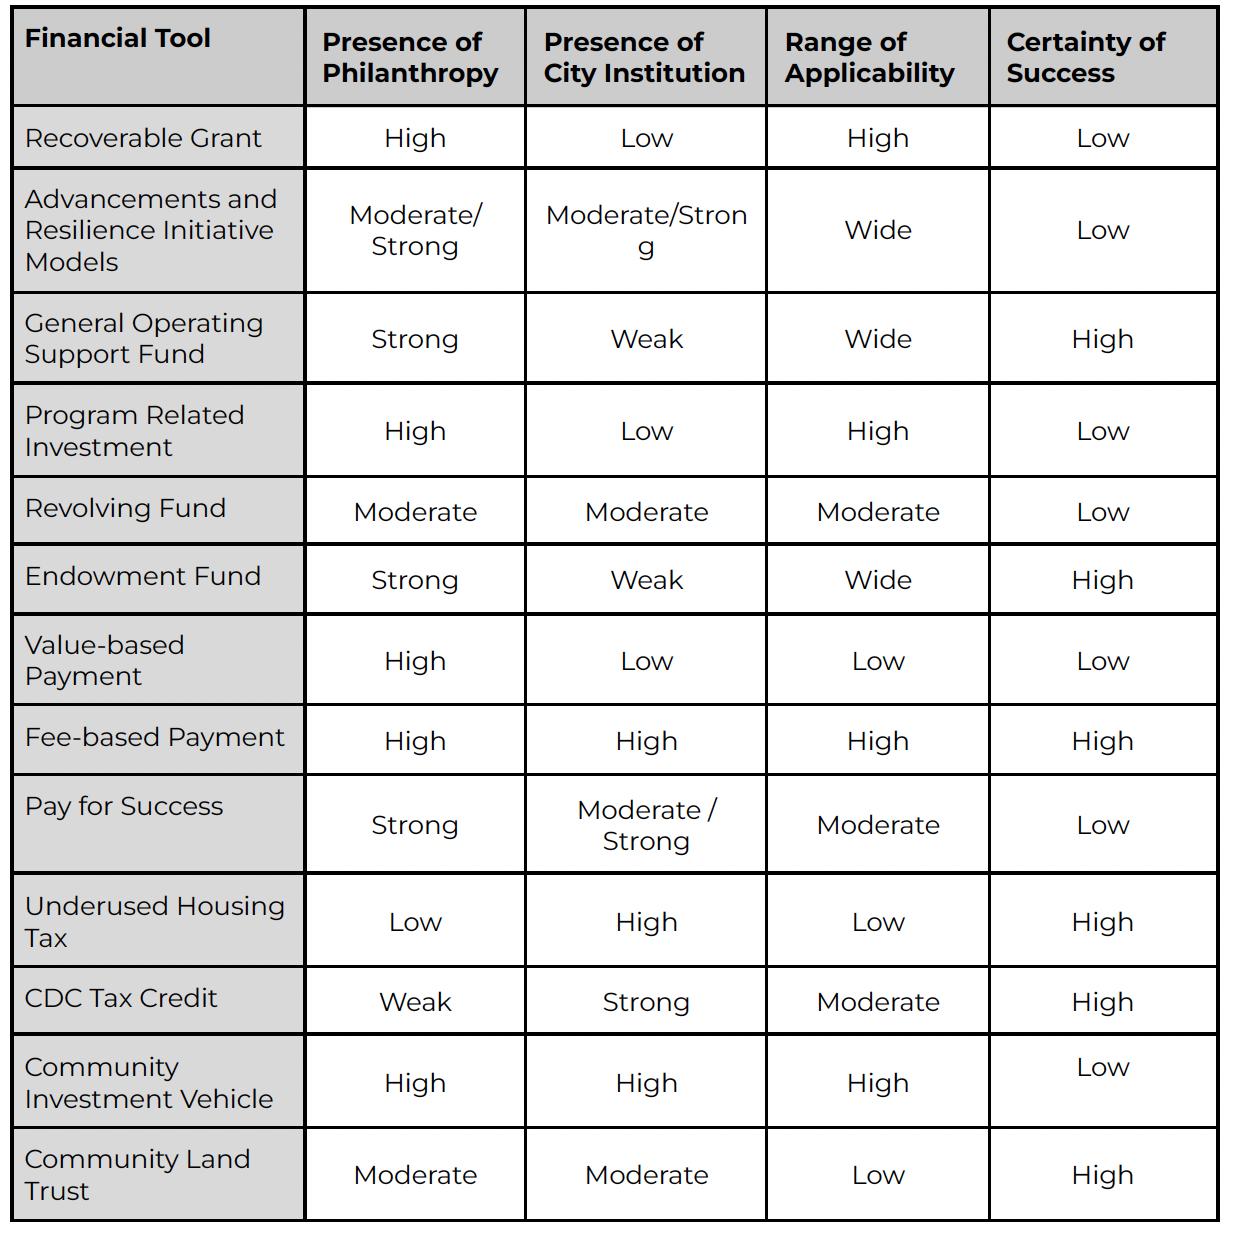
This portion of the project makes the case for nonprofit housing development, establishing a value proposition that goes beyond just monetary returns. Additionally, this scenario explores how CDOs can diversify their revenue streams and fill gaps in government funding by leveraging 13 distinct and innovative financial tools.
Scenario 3: Consolidations and Convenings
The third scenario explores the increasingly important role of mergers, consolidations, partnerships, and convenings within the field. Mergers and consolidations allow smaller CDOs to continue making an impact when they are no longer able to function on their own. Partnerships facilitate organizational reach through collaboration and resource sharing between neighboring organizations. Convenings allow CDOs to share knowledge and coordinate with similar organizations.
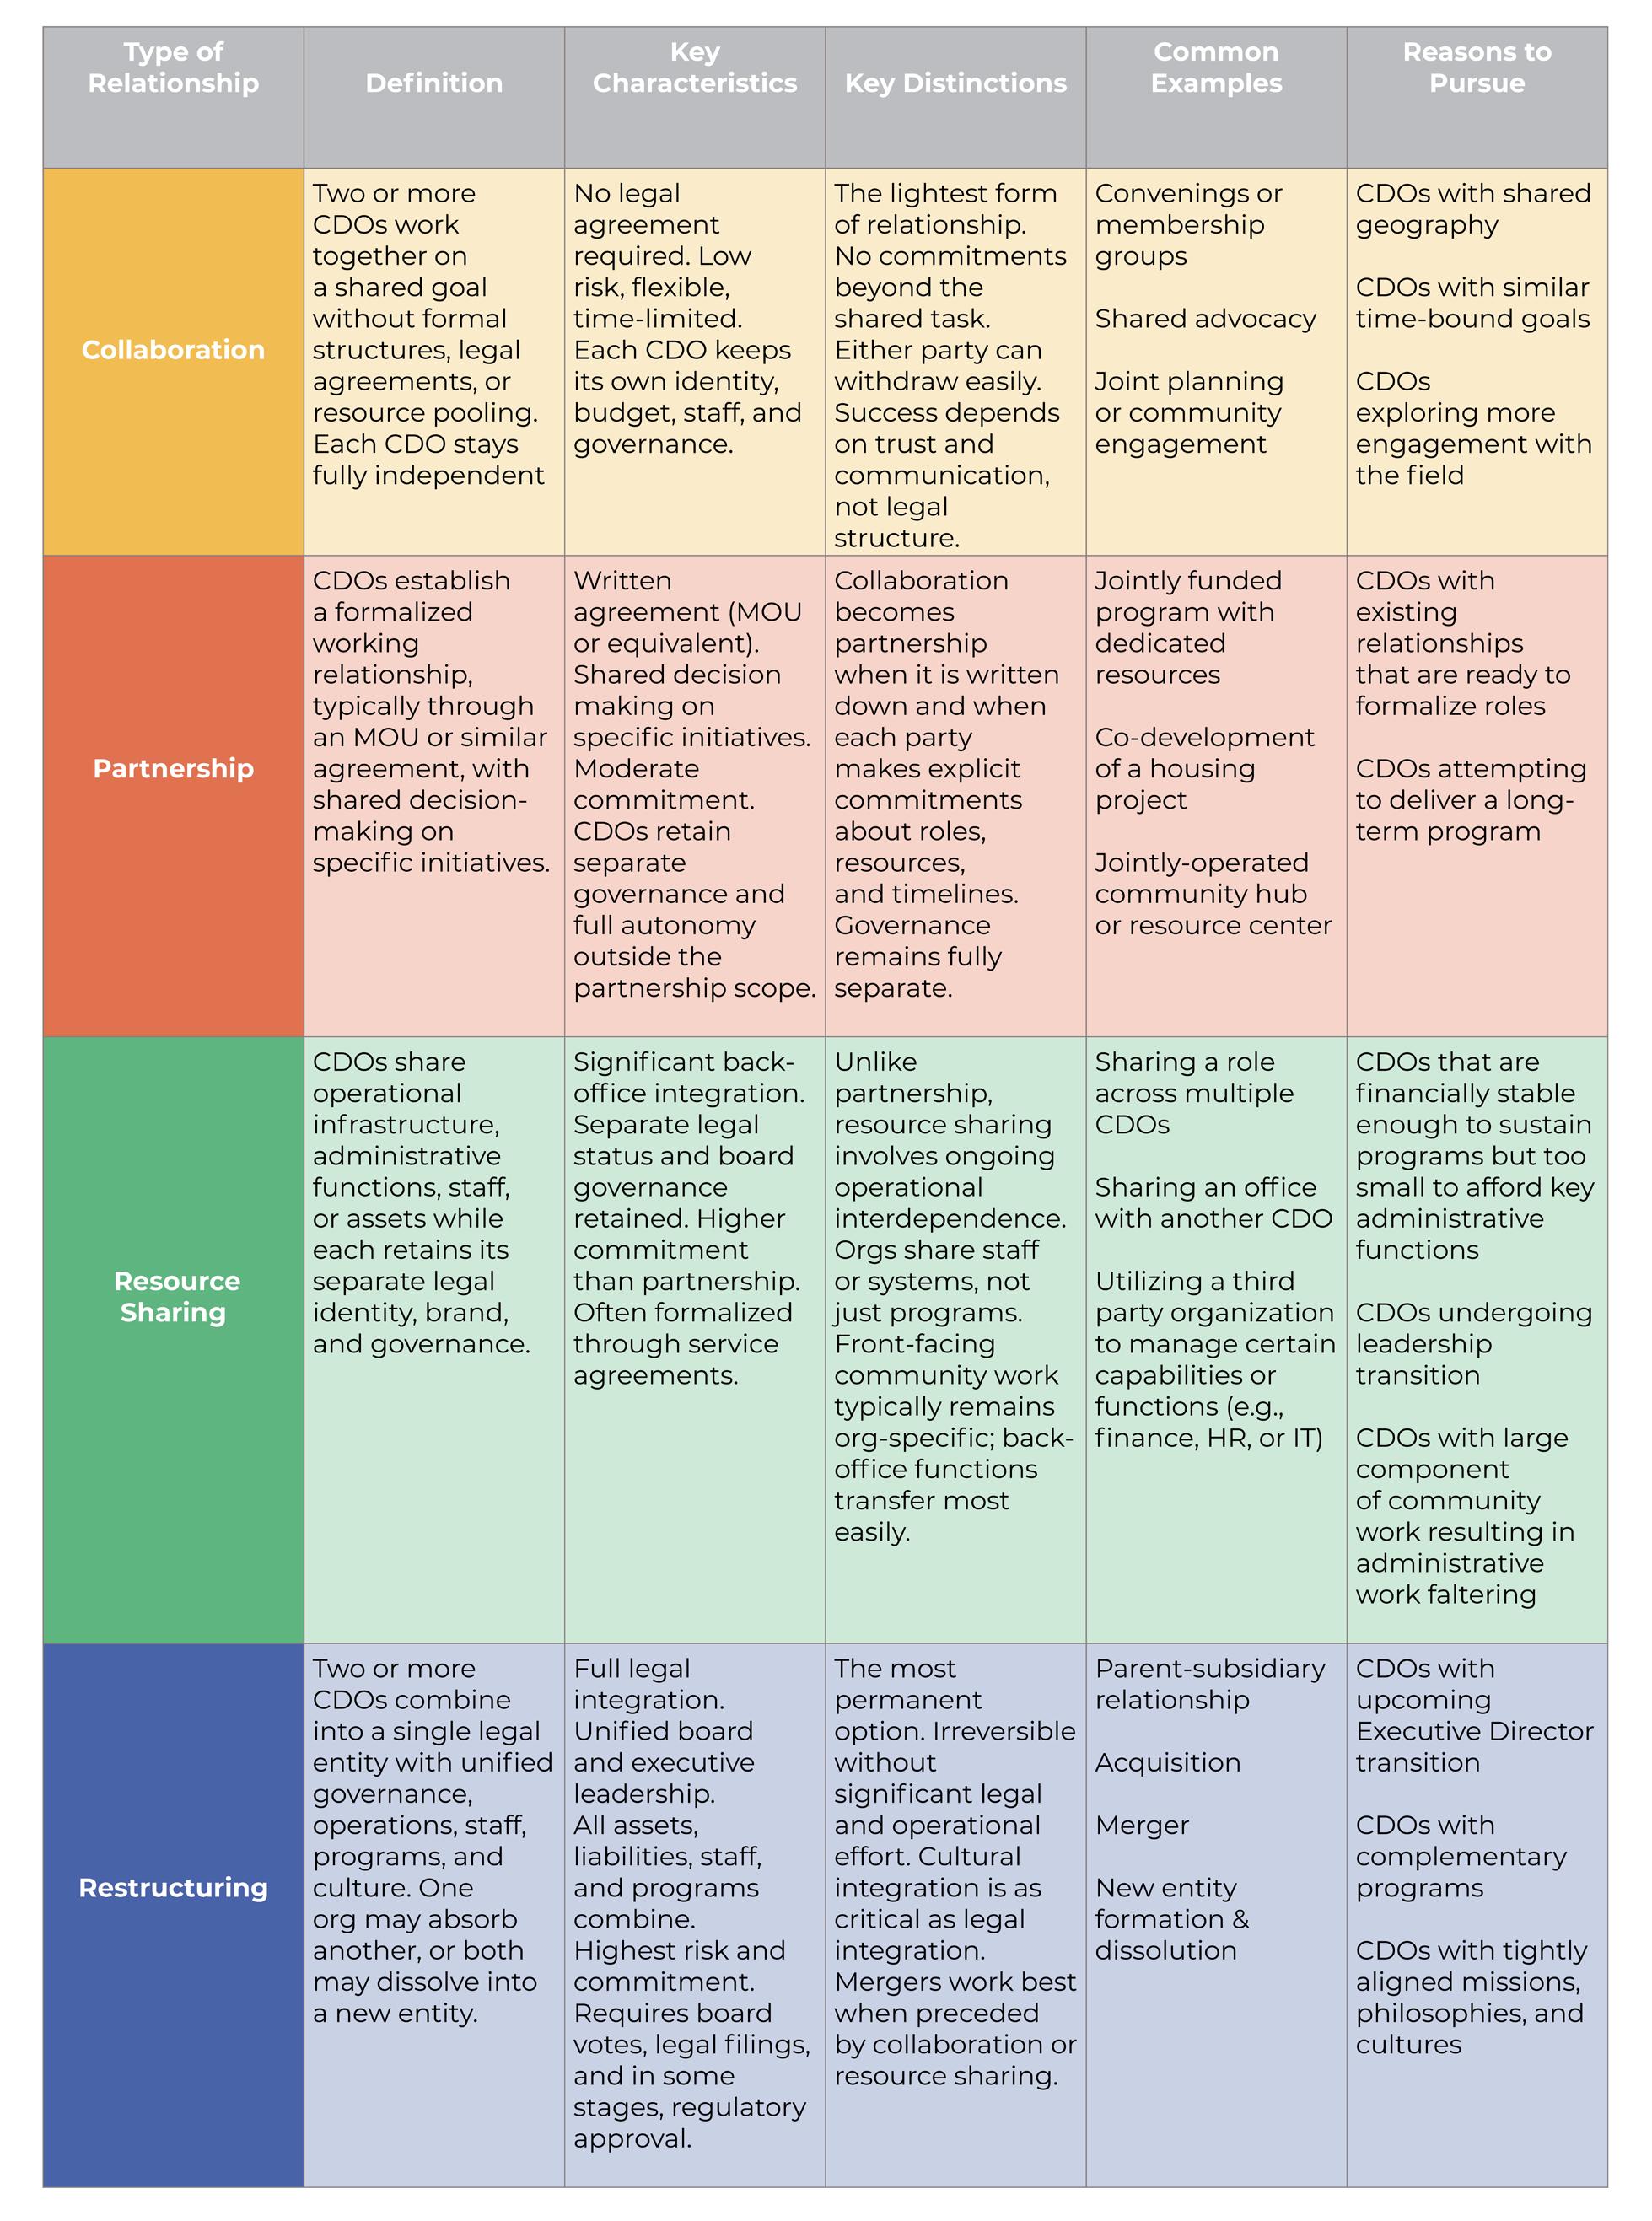
This portion of the project explores this range of partnerships, collaborations, and consolidations by defining key relationship types, investigating best practices, and providing case studies for various scenarios. Through this work, the Strategic Relationship Framework was developed, providing strategies for stronger relationships within the community development field.
Overall, this report covers a variety of topics, all of which are rooted in the same primary concern: uncertainty. For the community development field, this uncertainty derives from the reduction of funding, resources, and support from both government agencies and philanthropic organizations, threatening the stability and prosperity of intermediaries, community development organizations, and the communities they serve.
Scenario 1: Service Collapse and Inequities Between ‘Earners’ and ‘Non-Earners’ Recommendations
For Intermediaries & Resource Providers:
Identify and address the context-specific barriers to earned revenue. Conduct thorough gap analyses of the real estate market in different communities, paying specific attention to locational differences. From these analyses, deploy strategies that are tailored to community-specific needs in order to facilitate increased CDO-led development and potential increases in earned revenue. These strategies may include, but are not limited to, technical assistance focused on building CDO’s development capacity, flexible grants or lines of credit to subsidize funding gaps, and professional development initiatives to strengthen supporting sectors such as contractors.
Evaluate and plan for organizational and ecosystem resilience regularly.
Prepare for organizational threats, such as financial, social, and environmental shocks, preemptively. The ability for both CDOs and their supporting ecosystems to forecast, withstand, and recuperate from periods of uncertainty and crisis requires a comprehensive approach to capacity building, covering a range of activities to minimize vulnerabilities and capitalize on strengths. Resilience is not simply a response to crisis, it is the longevity that results from the active and ongoing process of strategic organizational planning.
For CDOs
Diversify and stabilize funding sources.
Develop a balanced revenue model that combines earned income, grants, and philanthropic support, which can be facilitated through strategic expansion of programmatic offerings. Additionally, strong financial management and oversight practices, such as maintaining a detailed budget and a financial reserve, are critical to lasting financial sustainability.
Invest in staff capacity and retention.
Build teams with both the technical expertise and cultural competence needed to carry out core functions and create long-term stability through competitive compensation, professional development, and tactics that preserve institutional knowledge. Staff should be strategically deployed to roles that best leverage their strengths and maximize program impacts.
Strengthen leadership and governance structures.
Ensure CDOs are guided by well-defined, place-based missions and skilled, communityresponsive leadership. Boards should be composed of capable and diverse individuals, with representation from the communities in which they serve. Engaging in succession planning will also prove critical for maintaining continuity and directing organizations through periods of change.
Leverage partnerships and community relationships. Engage in knowledge sharing, coalition building, and build strategic partnerships with other organizations, funders, and public agencies to expand capacity and access resources. Establishing trust within the community and acting as their advocates in the political arena further facilitates organizational capacity over time.
Scenario 2: Financial Innovation and Hybrid Capital Recommendations
Diversify Funding Streams
Role of Intermediaries & Resource Providers
Support CDOs with flexible, multi-year revenue streams effectively, and encourage blended financing approaches rather than siloed program funding to reduce administrative fragmentation and strengthen long-term financial stability.
Role of CDOs
Develop a diversified and coordinated financial portfolio that includes grants, earned revenue programs, capital recycling tools, and shared service agreements. Strategically align and braid sources so that each stream addresses different financial risks and organizational needs.
Leverage Cross-Sector Funding Model
Role of Intermediaries & Resource Providers
Adopt financing models that link financing to measurable social outcomes, enabling housing and community development interventions to access non-traditional capital by demonstrating cross-sector impact and shared cost savings.
Role of CDOs
Build partnerships across housing, healthcare, finance, and social service sectors to access cross-sector financing opportunities, and demonstrate how housing and community development outcomes contribute to broader system level benefits such as improved health outcomes and reduced public expenditure.
Investment in Organizational Capacity
Role of Intermediaries & Resource Providers
Recognize administrative and operational infrastructure as essential investment rather than overhead, and deploy financial tools to provide flexible, patient capital that strengthens internal systems. Invest in core operation as a foundation for impact, moving beyond projectspecific funding to support the full cost of delivering results.
Role of CDOs
Prioritize internal capacity-building by strengthening financial management systems, human resources infrastructure, compliance processes, and grant tracking mechanisms to build long-term resiliency and effectively manage complex funding portfolios.
Strengthen Financial and Technical Literacy
Role of Intermediaries & Resource Providers
Fund technical assistance, training programs, and capacity-building partnerships with universities, financial institutions, and intermediaries to ensure CDOs are equipped to manage, structure, and evaluate innovative financial tools effectively.
Role of CDOs
Invest in internal capacity building around financial literacy, underwriting, risk management,
legal structuring, impact evaluation systems, and other necessary skills to effectively engage with complex financial instruments.
Develop Shared Regional Resources Pool
Role of Intermediaries & Resource Providers
Invest in regional financing hubs and shared infrastructure systems that reduce transaction costs, distribute risk, and provide centralized legal, financial, and technical support, enabling broader access to advanced financing tools.
Role of CDOs
Collaborate to form regional coalitions and shared platforms that pool projects, financial pipelines, and technical expertise, enabling smaller organizations to access complex financial instruments that would otherwise be inaccessible individually.
Scenario 3: Consolidations and Convenings Recommendations
For Intermediaries & Resource Providers:
Utilize clear and consistent terminology.
Utilize uniform language to articulate options for collaboration or partnership to reduce ambiguity and improve communication among stakeholders. Terms like “merger” may carry negative connotations that can influence negotiations. The Strategic Relationship Framework provides a clear understanding of various terminology for effective communication.
Avoid initiating mergers prematurely.
Consider a wide spectrum of relationship types for CDOs, beginning with collaboration or partnership. Mergers are not always the best choice for the organizations or for the communities they serve, as they require deep levels of philosophical, cultural, and strategic alignment from leadership and boards.
Invest in convening infrastructure.
Provide dedicated resources for convening (e.g., intermediaries, conferences, alliances, coalitions, working groups) where CDOs can identify areas of shared strength and opportunities. Many successful relationships are formed through these convenings.
Fund the restructuring process across its entire lifespan.
Invest in third-party support for restructuring from the beginning (e.g., due diligence) all the way through post-deal implementation support to minimize risk of failure. While resources are often plentiful in the exploration phase, the post-merger implementation phase is often underfunded, despite increased complexity and lost organizational knowledge.
Focus on increasing impact, not rationalizing grant dollars.
Strategic relationship-building should center increases in impact that can result from combined strength, rather than cutting costs or reducing granted funds. “Doing more with less” is not achievable through mergers, and instead of “doing the same with less,” the goal should be to “do more with more.”
For CDOs:
Use strategic relationships to expand mission impact. Strategic relationships can expand mission impact by increasing capacity, providing access to more resources, and expanding reach, but it is important for CDOs to ensure that the mission remains centered throughout the relationship lifespan. Maintain commitment to the organization’s mission, using strategic relationships as a way to bolster, not compromise them.
Center community voice.
Ensure residents are considered and engaged when pursuing different types of relationships with other CDOs, especially mergers. Relationships absent of community voice can result in more harm than good, and can disenfranchise communities that are most in need of services.
Consider the Strategic Relationship Framework in succession planning. Consider strategic relationships, such as resource sharing and restructuring, in succession planning to promote mission longevity and continued service provision during times of natural organizational transition. Prioritize mission continuity over organizational preservation.
Start small and scale (if appropriate).
Begin by collaborating or partnering with another CDO as a way to build trust, test compatibility, and determine whether a more integrated relationship would be worthwhile. A great place to start is by working with other CDOs on mutually beneficial initiatives.
The Path Forward
In many communities across the United States, community development organizations are the cornerstone of their neighborhoods. Since their emergence in the 1960s as a response to widespread disinvestment, CDOs have retained their core mission of supporting vulnerable and underserved neighborhoods. These communities rely on CDOs to provide critical services, including affordable housing, corridor development, community planning, workforce development, youth programs, and much more.4
With the future of these invaluable organizations being threatened through austerity measures by government entities and philanthropy alike, the community development field is facing a dual reality characterized by both challenges in the form of reduced service capacity and equity implications as well as opportunity in the form of innovation and reinvigoration.
Overall, this report provides tools and recommendations that COA and the wider field as a whole can leverage in order to take advantage of this opportunity. Through key strategies such as investments in staff and organizational capacity, diversification of funding streams and tools, and the strategic development of partnerships, stakeholders across the community development field can fortify the ecosystem through increased adaptability and knowledge sharing.
While this report can aid in the preparation for and recovery from periods of uncertainty and austerity, it is only one part of the path forward. The ongoing health and sustainability of the community development field ultimately depends on the continued and expanded advocacy, funding, and research of the sector. Together, these actions will ensure the longterm prosperity of this critical ecosystem.
Introduction
Introduction
About the Client: Community Opportunity Alliance
The client for this capstone project is the Community Opportunity Alliance (COA), a national nonprofit organization with a mission to lead the community development field and its partners in shaping and influencing strategies that advance community prosperity. They build the community development field through their Seven Pillars:
1. Convening the Community
2. Nurturing the Field’s Identity
3. Grounding Shared Values in Research
4. Building the Field’s Capacity
5. Advocating as an Alliance
6. Elevating Community Developers’ Voices
7. Engaging Private Funders to Support Community Development 5
Local community development organizations (CDOs) work in low- and moderate-income communities to develop affordable housing and commercial space, support small business development, and provide social services. COA’s work strengthens the field of nearly 6,000 local CDOs and 37 state and regional associations. They are committed to creating conditions where residents can shape the destiny of their neighborhoods.6
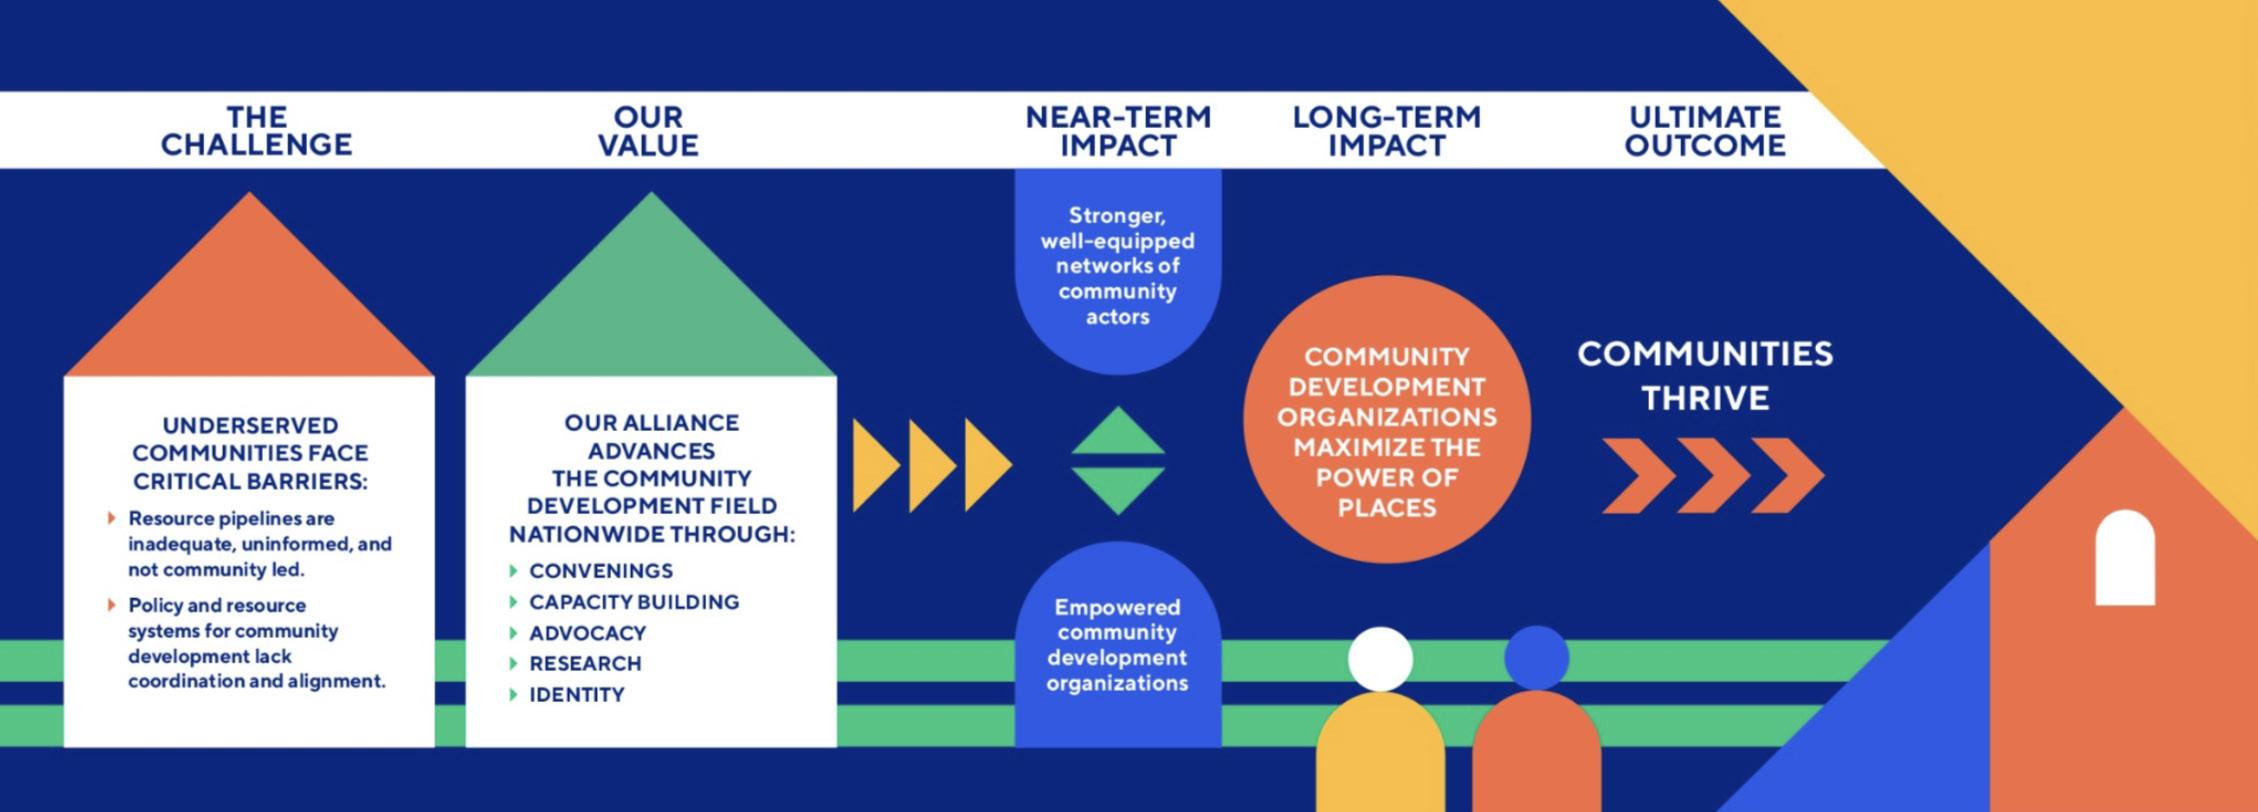
Figure 1 illustrates COA’s Theory of Change, which is rooted in the belief that a stronger, more unified community development field, with robust networks of community actors, leads to thriving and prosperous communities.
Figure 1. Community Opportunity Alliance’s Theory of Change.7
COA’s Grounding Values in Research
This project builds on COA’s Grounding Values in Research, a multi-year initiative to provide actionable insights that stakeholders can use to increase their effectiveness and build the sustainability of the community development field. The Grounding Values in Research uncovered the urgent need for field-level resilience planning in the face of uncertainty, characterized by rising polarization, deepening austerity, and the increasingly complex needs of neighborhoods across the country.8
On October 7, 2025, COA initiated efforts to strengthen resilience and scenario planning across the field—holding a session called Staying Rooted, Moving Forward during the 2025 People and Places Conference in Washington, D.C. The session brought together people from every facet of the community development field to discuss the future of the field and develop an action plan for the short-, medium-, and long-term.
During this session, COA developed three scenarios, detailed below, that reflect some of the most pressing issues in the field of community development right now.9 Through in-depth literature reviews, interviews with 28 stakeholders, surveys of community development organizations, case studies conducted across four U.S. cities, and an immersive learning trip to New Orleans, this project expands on these scenarios, providing a set of tools and recommendations for each. This report provides strategies for building the resilience of the community development field, which can be leveraged by both COA and the field more broadly to prepare for, cope with, and recover from periods of crisis and uncertainty.
Scenario 1: Service Collapse and Inequities Between ‘Earners’ and
‘Non-Earners’
The first scenario is concerned with the decline in grant-funded services due to increased cultural and political pressures while real estate developers and CDFIs are able to sustain themselves through earned income. Potential funding inequities between these “earners” and “non-earners” presents the risk that the sector that houses people is unable to meet their other basic needs.
In order to increase the stability of these service providers, this portion of the project focuses on building CDO resilience. To do this, the team developed a Resilience Matrix that provides a mechanism for CDOs to measure and strengthen their overall resilience as an organization. The Matrix, tested across 22 CDOs in four geographies, identifies 28 unique characteristics and strategies across five distinct categories of capacity that contribute to an organization’s ability to withstand conditions of uncertainty.
Scenario 2: Financial Innovation and Hybrid Capital
The second scenario looks at over-reliance on single funding sources, particularly philanthropy and CDFIs, with the decline in government funding. This presents the risk of organizations thriving only if they are able to innovate, while others are left behind, which can result in financialization, or the growing influence of investment-driven priorities, and the prioritization of returns over communities.
This portion of the project makes the case for nonprofit housing development, establishing a value proposition that goes beyond just monetary returns. Additionally, this scenario explores how CDOs can diversify their revenue streams and fill gaps in government funding by leveraging 13 distinct and innovative financial tools.
Scenario 3: Consolidations and Convenings
The third scenario explores the increasingly important role of mergers, consolidations, partnerships, and convenings within the field. Mergers and consolidations allow struggling CDOs to continue making an impact when they are no longer able to function on their own. Partnerships facilitate organizational reach through collaboration and resource sharing between neighboring organizations. Convenings allow CDOs to share knowledge and coordinate with similar organizations.
This portion of the project explores this range of partnerships, collaborations, and consolidations by defining key relationship types, investigating best practices, and providing case studies for various scenarios. Through this work, the Strategic Relationship Framework was developed, providing strategies for future collaboration within the community development field.
Overall, this report covers a variety of topics, all of which are rooted in the same primary concern: uncertainty. For the community development field, this uncertainty derives from the reduction of funding, resources, and support from both government agencies and philanthropic organizations, threatening the stability and prosperity of intermediaries, community development organizations, and the communities they serve.
The Community Development Ecosystem
In order to contextualize the impact of uncertainty on the community development field, it is critical to understand the social and historical context, as well as the relationships between the key actors in the field: CDOs, intermediaries, and resource providers.
Uncertainty in Context: The Role of Race and Power in Community Development
The equity implications of these uncertain conditions must be stated up-front in no uncertain terms: a reduction in resources to the community development field directly translates to a reduction in resources for the most vulnerable communities in the nation— primarily communities of color and poor communities that have been made vulnerable through a long history of institutionalized racism and classism. These longstanding inequities have resulted in “poor inner-city neighborhoods, particularly communities of color, [that] have unequal access to opportunities in numerous areas,” including housing, employment, and more.10
Since its inception, community development has focused on serving these communities and alleviating this unequal access to opportunity through five primary activities: (1) social services; (2) real estate development; (3) real estate management; (4) planning and organizing; and (5) lending.11 With 77 percent of CDOs providing social services, it is also important to acknowledge the diversity of this arm of activity, which includes services for workforce development, homeowners, families, seniors, homeless people, people with disabilities, youth, and immigrants.12 Given the amount of work and the resources that go into supporting these communities’ basic needs, it is clear that any reduction in funding would constitute a threat to their stability and prosperity.
History of Community Development
Emerging in the 1960s as a response to widespread disinvestment in cities across the country, community development took inspiration from the Civil Rights Movement’s “spirit of resistance” to reimagine the approach to filling the gaps in issues of housing and service provision.13 14 According to Frank Woodruff, Executive Director of the Community Opportunity Alliance, community development organizations cemented their place in society as “poor communities and people of color stood up to the federal government and the excesses of urban renewal, which had bulldozed many poor communities, especially communities of color.” 15 Through various forms of protest, these communities eventually gained federal recognition, successfully blocking the construction of highways and gaining political power to pass foundational legislation such as the Fair Housing Act and the Community Reinvestment Act.16
This era, characterized by community-led challenges to the paternalistism and inequity of urban renewal, ”gave birth” to the community development movement, establishing a network of nonprofit, place-based organizations dedicated to serving the communities they work in—typically communities predominately made up by people of color and those that have suffered from disinvestment.17
Rooted in its origins in grassroots movements, community development eventually became a key strategy of Lyndon B. Johnson’s War on Poverty, representing a more “bottomup” approach to the so-called urban crisis and calling for a strategy that was both more community-oriented and comprehensive.18
Since the 1960s, community development has evolved from a movement into a nationwide ecosystem.19 Through this evolution, the initial calls for a more comprehensive approach to solving urban problems have been realized; community development now includes a wide range of activities including affordable housing development, commercial corridor development, community planning and organizing, workforce development, youth programs, and much more.20 This expansion beyond the initial focus on housing development demonstrates the role community development has come to play as a “gap filler,” addressing the physical, social, economic, and political community needs that governments and corporate entities, not only fail to address, but sometimes generate.21
The rapid evolution of community development makes it difficult to define concisely, and contemporary uses of the term vary greatly across the literature. With these considerations in mind, it is, perhaps, best to understand community development through its outcomes. In the broadest sense, community development is the improvement, strengthening, and empowerment of communities.22 Avis C. Vidal, Professor of Urban Studies and Planning at Wayne State University, provides a more holistic understanding, noting that community development occurs “when investments of either capital or labor produce changes in the institutional infrastructure locally available to develop and sustain productive members of the community,” resulting in higher quality of life and increased access to opportunity for residents.23
The Community Development Ecosystem
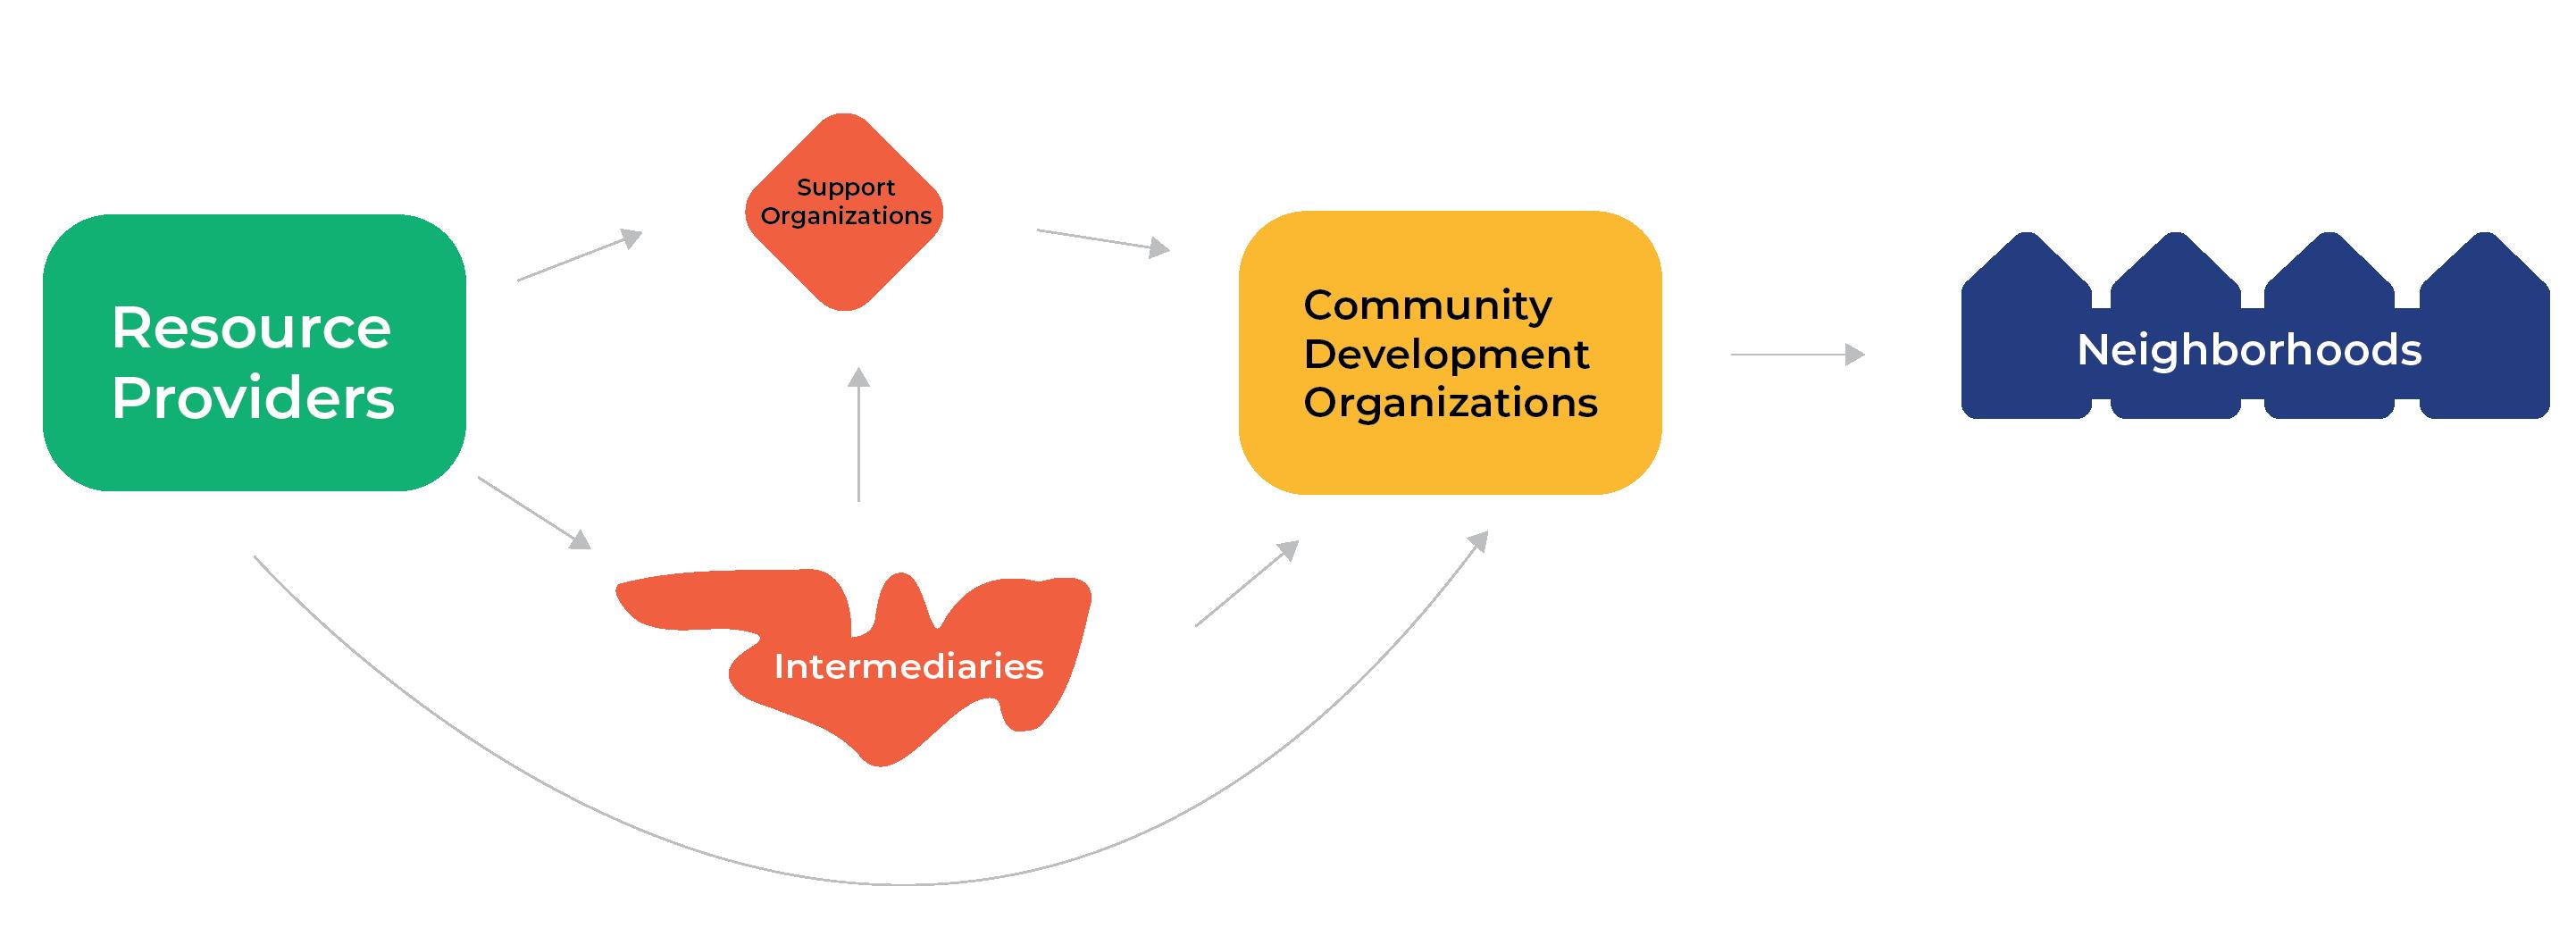
Across the U.S., community development has emerged as an increasingly complex ecosystem, with a range of stakeholders at various levels. While the details vary slightly depending on the specific contexts of the cities and communities, the community development ecosystem can generally be understood as made up of three primary actors: community development organizations (CDOs), intermediaries, and resource providers.24 Figure 4 illustrates this basic structure. where resource providers represent both governments and philanthropies; intermediaries represent institutions that provide and aggregate technical assistance, financing, and advocacy; support organizations represent other advocacy groups that act similar to intermediaries; community development organizations are local non-profit that deliver services in low-and moderate-income communities; and neighborhoods represent the ultimate beneficiaries of the ecosystem.
Community Development Organizations
(CDOs)
Like the community development field, community development organizations (CDOs) are also often subject to a variety of definitions. For the sake of clarity and alignment with the client, this report adopts the definition put forth by the Community Opportunity Alliance: “Local community development organizations work in low- and moderate-income communities to develop affordable housing and commercial space, support small business development, and provide social services.”25
While this definition provides a concise description of CDOs, the full scope of their activities is much more complex. A 2023 report from the Urban Institute quantifies this complexity, finding that the approximately 6,225 CDOs across the U.S. engaged in at least 16 unique activities spanning four categories from 2019 to 2021. These activities are listed below:
Figure 2. Diagram of the general structure of the community development ecosystem.
Housing Development Commercial & Community Facility Development
• Home construction
• Home rehabilitation Home repair
• Home weatherization
• Commercial development
• Community facility development
Community lending, financial assistance, and business supports Services and advocacy
• Real estate development
• Home purchases
• Business development
• Technical assistance for businesses Community organizing
• Resident services
• Federal government advocacy
• State government advocacy
• Local government advocacy
• Pandemic relief support
CDOs have been involved in these activities since the 1960s not only because of their gapfilling role, but also because they have a proven track record of providing benefits to the communities they serve, including neighborhood revitalization and resident stabilization.27
Intermediaries
Broadly, intermediaries are organizations that provide support to CDOs in the form of technical assistance and financing. In practice, this involves a variety of activities including fundraising, training, networking, and advocacy.28 These organizations, primarily the Local Initiatives Support Corporation (LISC) and Enterprise Community Partners (ECP), are largely credited with advancing the community development field through their capacity building efforts, especially throughout the 1990s.29
Beyond their role as capacity builders and financers for CDOs, intermediaries are beneficial for the entire community development ecosystem for a variety of reasons, including: (1) providing multi-year operational support to CDOs, which allows them to plan more effectively; (2) establishing performance standards for CDOs; (3) minimizing the administrative burden of grant-making; (4) increasing the willingness of funders to invest in communities; and (5) connecting the local community to a broader network of resources.30
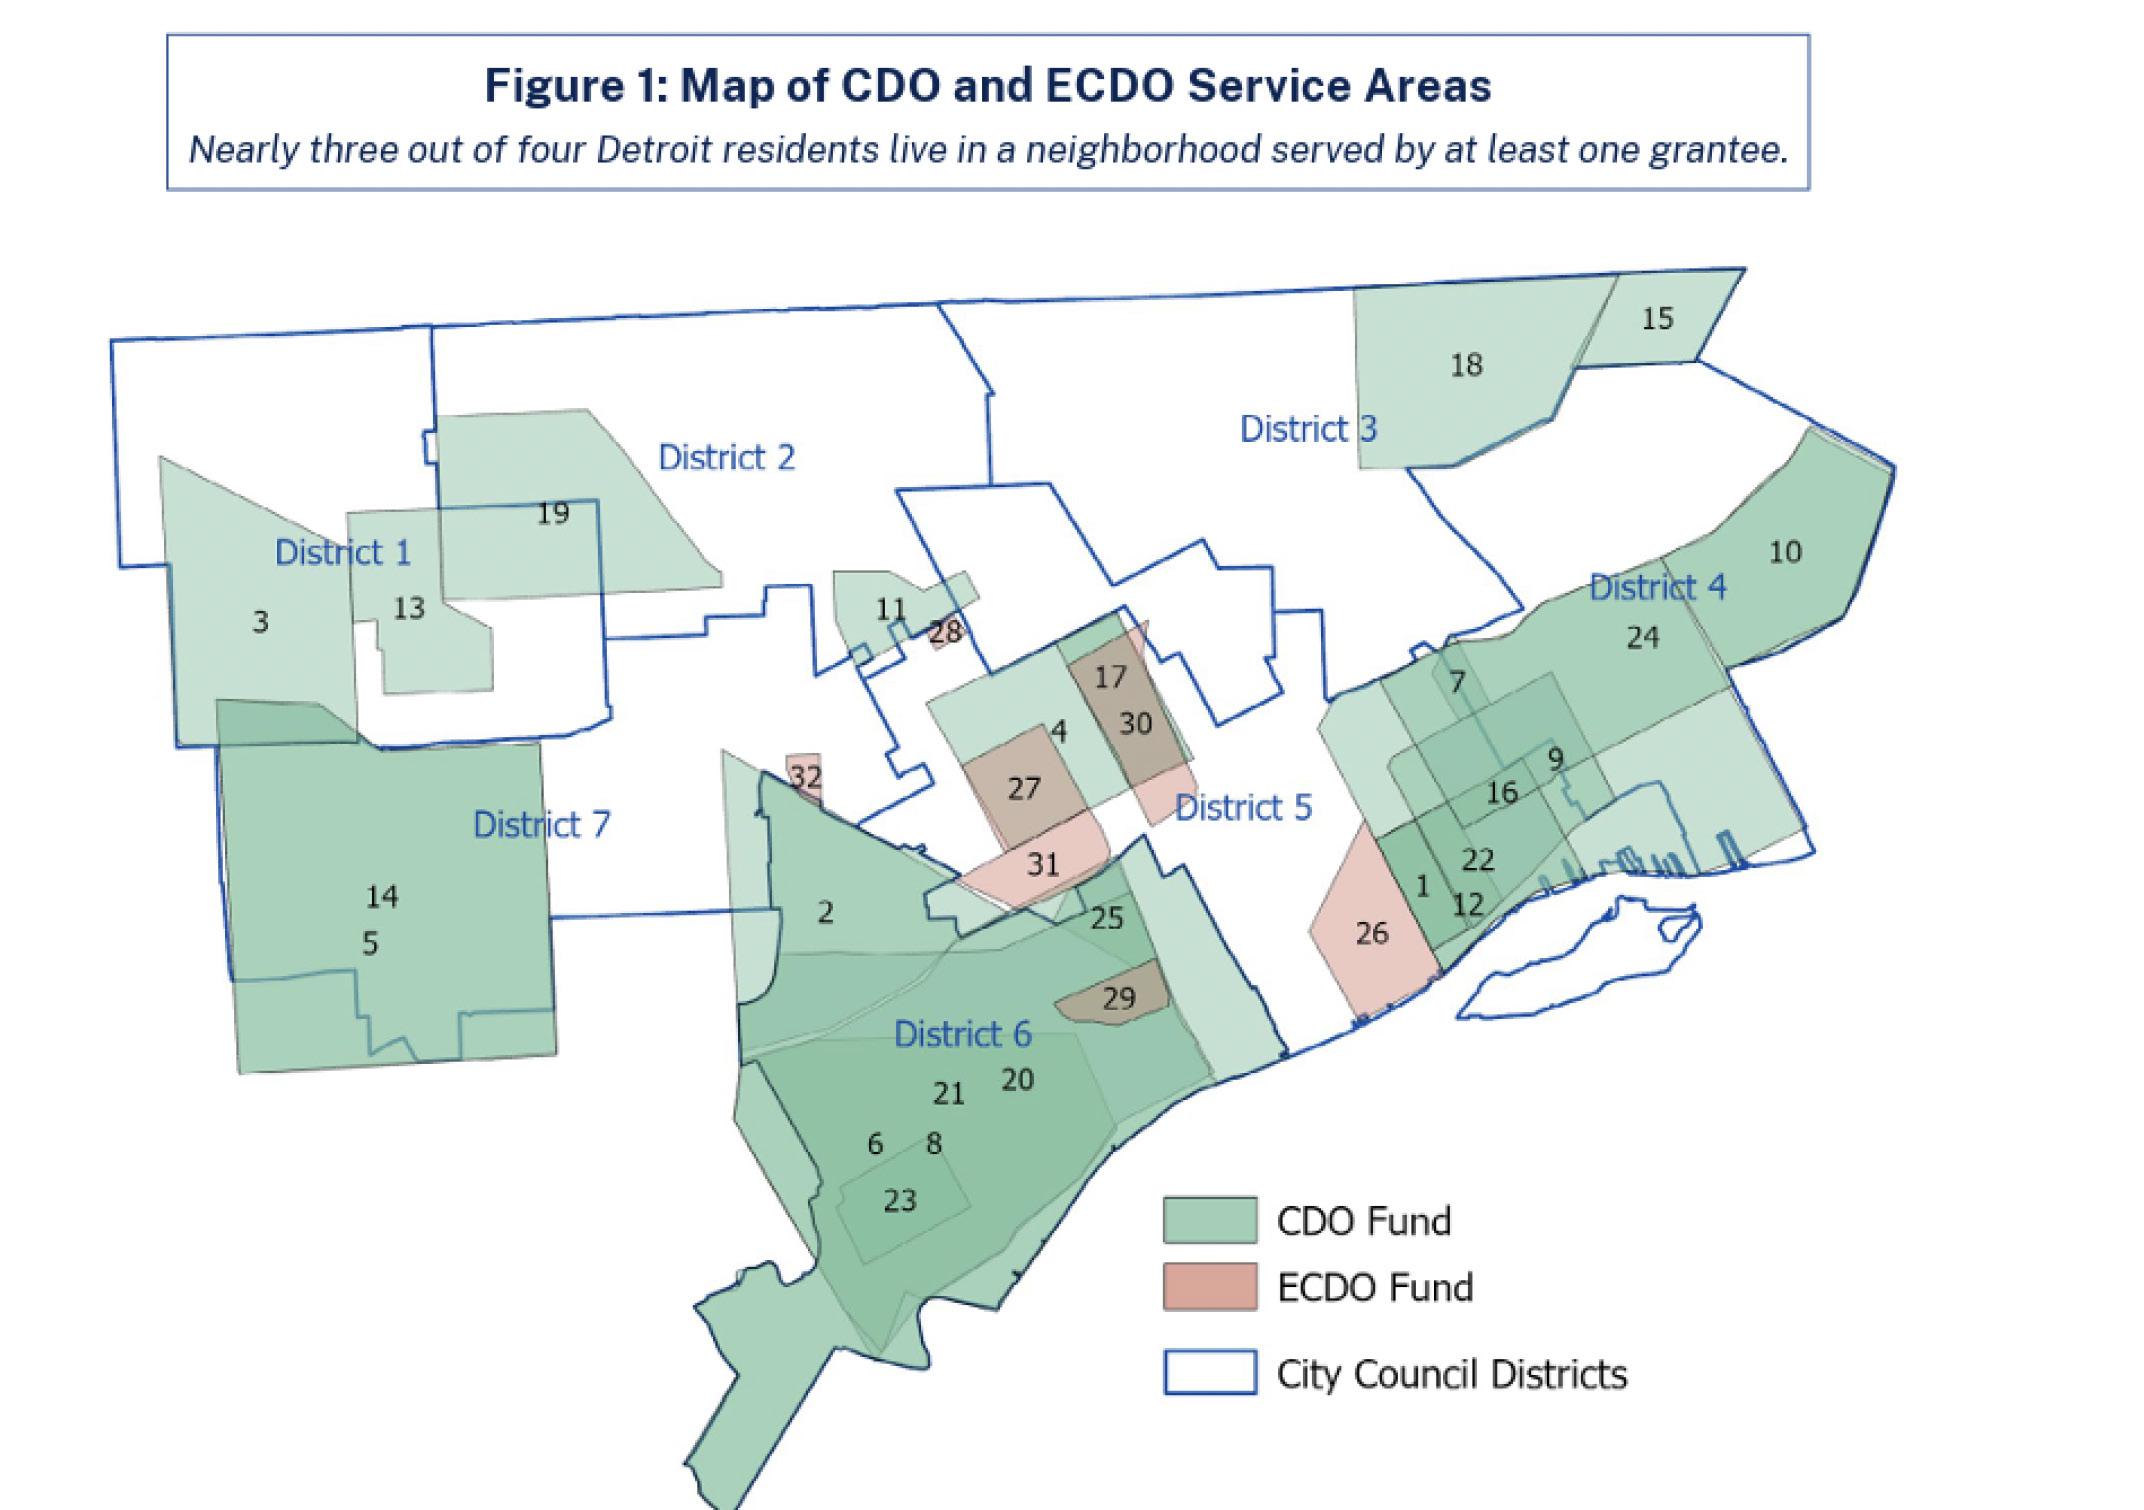
Enterprise Community Partners (ECP) has proven foundational in providing these benefits in both the Detroit and New Orleans community development ecosystems. Through the establishment of both the Community Development Organization (CDO) Fund and the Elevating CDO (ECDO) Fund in Detroit, as well as the CDO Fund in New Orleans, ECP has made significant strides in uplifting CDOs and strengthening the overall ecosystems supporting them.31 32 Supporting 32 CDOs in Detroit and eight CDOs in New Orleans, these initiatives leverage funds from various philanthropic entities to CDOs in the form of flexible operational support, technical assistance, peer learning, and cohort facilitation.33 34 The impact of these initiatives are evident in the Phase II Evaluation of the Detroit CDO and ECDO Funds, with grantees reporting: (1) a significant increase in their ability to diversify their
revenue sources and programs; (2) the creation or preservation of more than 1,400 affordable housing units; and (3) the delivery of services to 100,000 residents across the city of Detroit.35
Overall, intermediaries play a significant role in the community development field, leading to advancements in capacity building, operating support for CDOs, collaborative networks, and additional external investments.36
Resource Providers
The major component to the community development ecosystem is the resource providers as they supply the capital, grants, and investments necessary for CDOs and Intermediaries to carry out community development work. Often also referred to as funders, this component of the ecosystem is typically composed of financial institutions, philanthropic organizations, and government agencies who have and provide resources to CDOs to support affordable housing, economic development, and community revitalization.37
Support Organizations
Support Organizations are national non-profit associations, policy advocacy groups, and field building entities that strengthen community development ecosystems through research, advocacy, training, coalition building and peer learning. Unlike intermediaries and resource providers, they do not directly finance projects or deliver local services; instead they build the institutional policy, and knowledge infrastructure that enables CDOs, intermediaries, and funders to operate more effectively.38
Defining Uncertainty
Defining Uncertainty
For decades, CDOs have relied on a funding model that includes federal programs, philanthropic grants, local government support, and limited earned income. This model is now under pressure due to the increasing volatility of public funding and the growing unpredictability around federal commitments to housing and community development programs. As a result, the community development ecosystem is facing instability in the very funding streams that have historically supported their core operations.
The field of community development has faced constant periods of ebbs and flows in the last 25 years, both on the hyperlocal and national level. In New Orleans, funding surged after disaster-relief aid through federal agencies like the Federal Emergency Management Agency following Hurricane Katrina in 2005.39 Meanwhile, philanthropic funding leads community and economic development efforts in Detroit, to the point that the city is known as “the largest philanthropic cities in the country.”40The 2008 financial crisis negatively affected nonprofit housing development in the 2010s across the nation, but the surge in ARPA funding fueled the growth of CDOs after 2021.41
However, the increasing disinvestment of federal funding from community development has caused growing concern for the future of the industry. Starting in 2025, the federal government eliminated budgetary items reserved and utilized by community development organizations and their funding intermediaries.42 The most recent shifts affected the role that all actors—whether philanthropy, intermediaries, and CDOs—must now play in the community development ecosystem.
Previously, philanthropic support was seen as a mid-point between governmental and donation-based support in CDO funding, the so-called filler that would make up the difference in a CDO’s operational finances. However, as the federal funding receded, philanthropy was slowly tasked with taking on a greater “filler” role. In the past, intermediaries were seen as middlemen between on-the-ground organizations and the umbrella of both private and public financial institutions. The shifts towards austerity have constrained the ways intermediaries can support CDOs.
Decline in Federal Funding Sources
On May 2, 2025, the current director of the Office of Management and Budget, Russell T. Vought—with the endorsement of the Trump administration—submitted a “skinny budget,” which proposed diminishing Homeless Assistance and Tenant-Based Rental Assistance programs and eliminating critical resources such as the Community Development Block Grants (CDBG) program, HOME Investment Partnerships Program (HOME), Pathways to Removing Obstacles (PRO) Housing program, the Community Development Finance Institutions (CDFI) fund.43 These programs operate under the Department of Housing and Urban Development (HUD), and comprise the majority of its annual budget.
Though the proposed budget caused apprehension in the community development field, the preservation of some HUD programs—funded through a joint Congressional funding bill for the Department of Transportation and the Department of Housing and Urban Development (THUD) for Fiscal Year 2025—provided some reprieve, safeguarding the CDBG, Tenant-Based Rental Assistance, and homelessness assistance programs, at least temporarily. Other HUD programs, however, were not as fortunate. They either receive no funding, like the HOME program and the CDFI fund, or drastic cuts like the PRO Housing program.44
The weight of federal funding cuts also extended beyond budget items. Vought reportedly discussed using “pocket rescissions” during the initial budget proposal, which would delay proposed rescissions to Congress until the end of the fiscal year. In this case, “lawmakers do not need to approve [a budget cut] for it to go into effect.”45 Pocket rescissions allow un-earmarked, withheld funds to expire without rolling over to the next fiscal year. This has the cascading effect of pre-emptively cutting millions of dollars that would have gone towards community development programs. The implications of pocket rescissions caused documented apprehension among community development resource providers in late 2025 and early 2026.46 The inconsistent federal support for government programs and volatile threat of budgetary exclusion, especially in the context of polarizing political partisanships, has come to define this most recent era of uncertainty in the community development field.47
Decline in Individual and Philanthropic Funding
Since 2021, charitable giving rates have declined by 4.5 percent, resulting in less philanthropic funding for CDOs and intermediaries.48 The reasons behind this phenomenon are diverse, with potential explanations ranging from individual circumstances to the consequences of political shifts.
One explanation is that younger donors have less money, express less institutional trust, and face delayed life milestones, all of which reduce discretionary income.49 These economic pressures transcend generations as exponentially rising housing costs, wage stagnation, and healthcare expenses abound, leaving little discretionary funding left for Americans to donate to charity.
Social and economic factors aside, another contributing factor are policy decisions. The 2017 Tax Cuts and Jobs Act eliminated itemization benefits for nine in 10 taxpayers, resulting in less giving.50 The National Bureau of Economic Research estimates that this policy change reduced giving by nearly $20 billion in 2018.51 This act also introduced a new floor and cap on itemized deductions, making it unlikely for the donor base to expand.52 The act’s impact was immediately felt: in 2017, 30 percent of taxpayers itemized their deductions, but by 2018, only 10 percent of taxpayers itemized deductions.53
In June 2025, the One Big Beautiful Bill Act (OBBA) passed. It included a one percent floor for corporate charitable deductions. Boston College Center for Corporate Citizenship (BCCC) estimates this act will reduce corporate charitable giving by around $45 billion over the next 10 years.54 The BCCC states that “.....international evidence suggests the [one percent floor in corporate charitable contributions] is unusual among developed nations and may further reduce social cohesions.”55
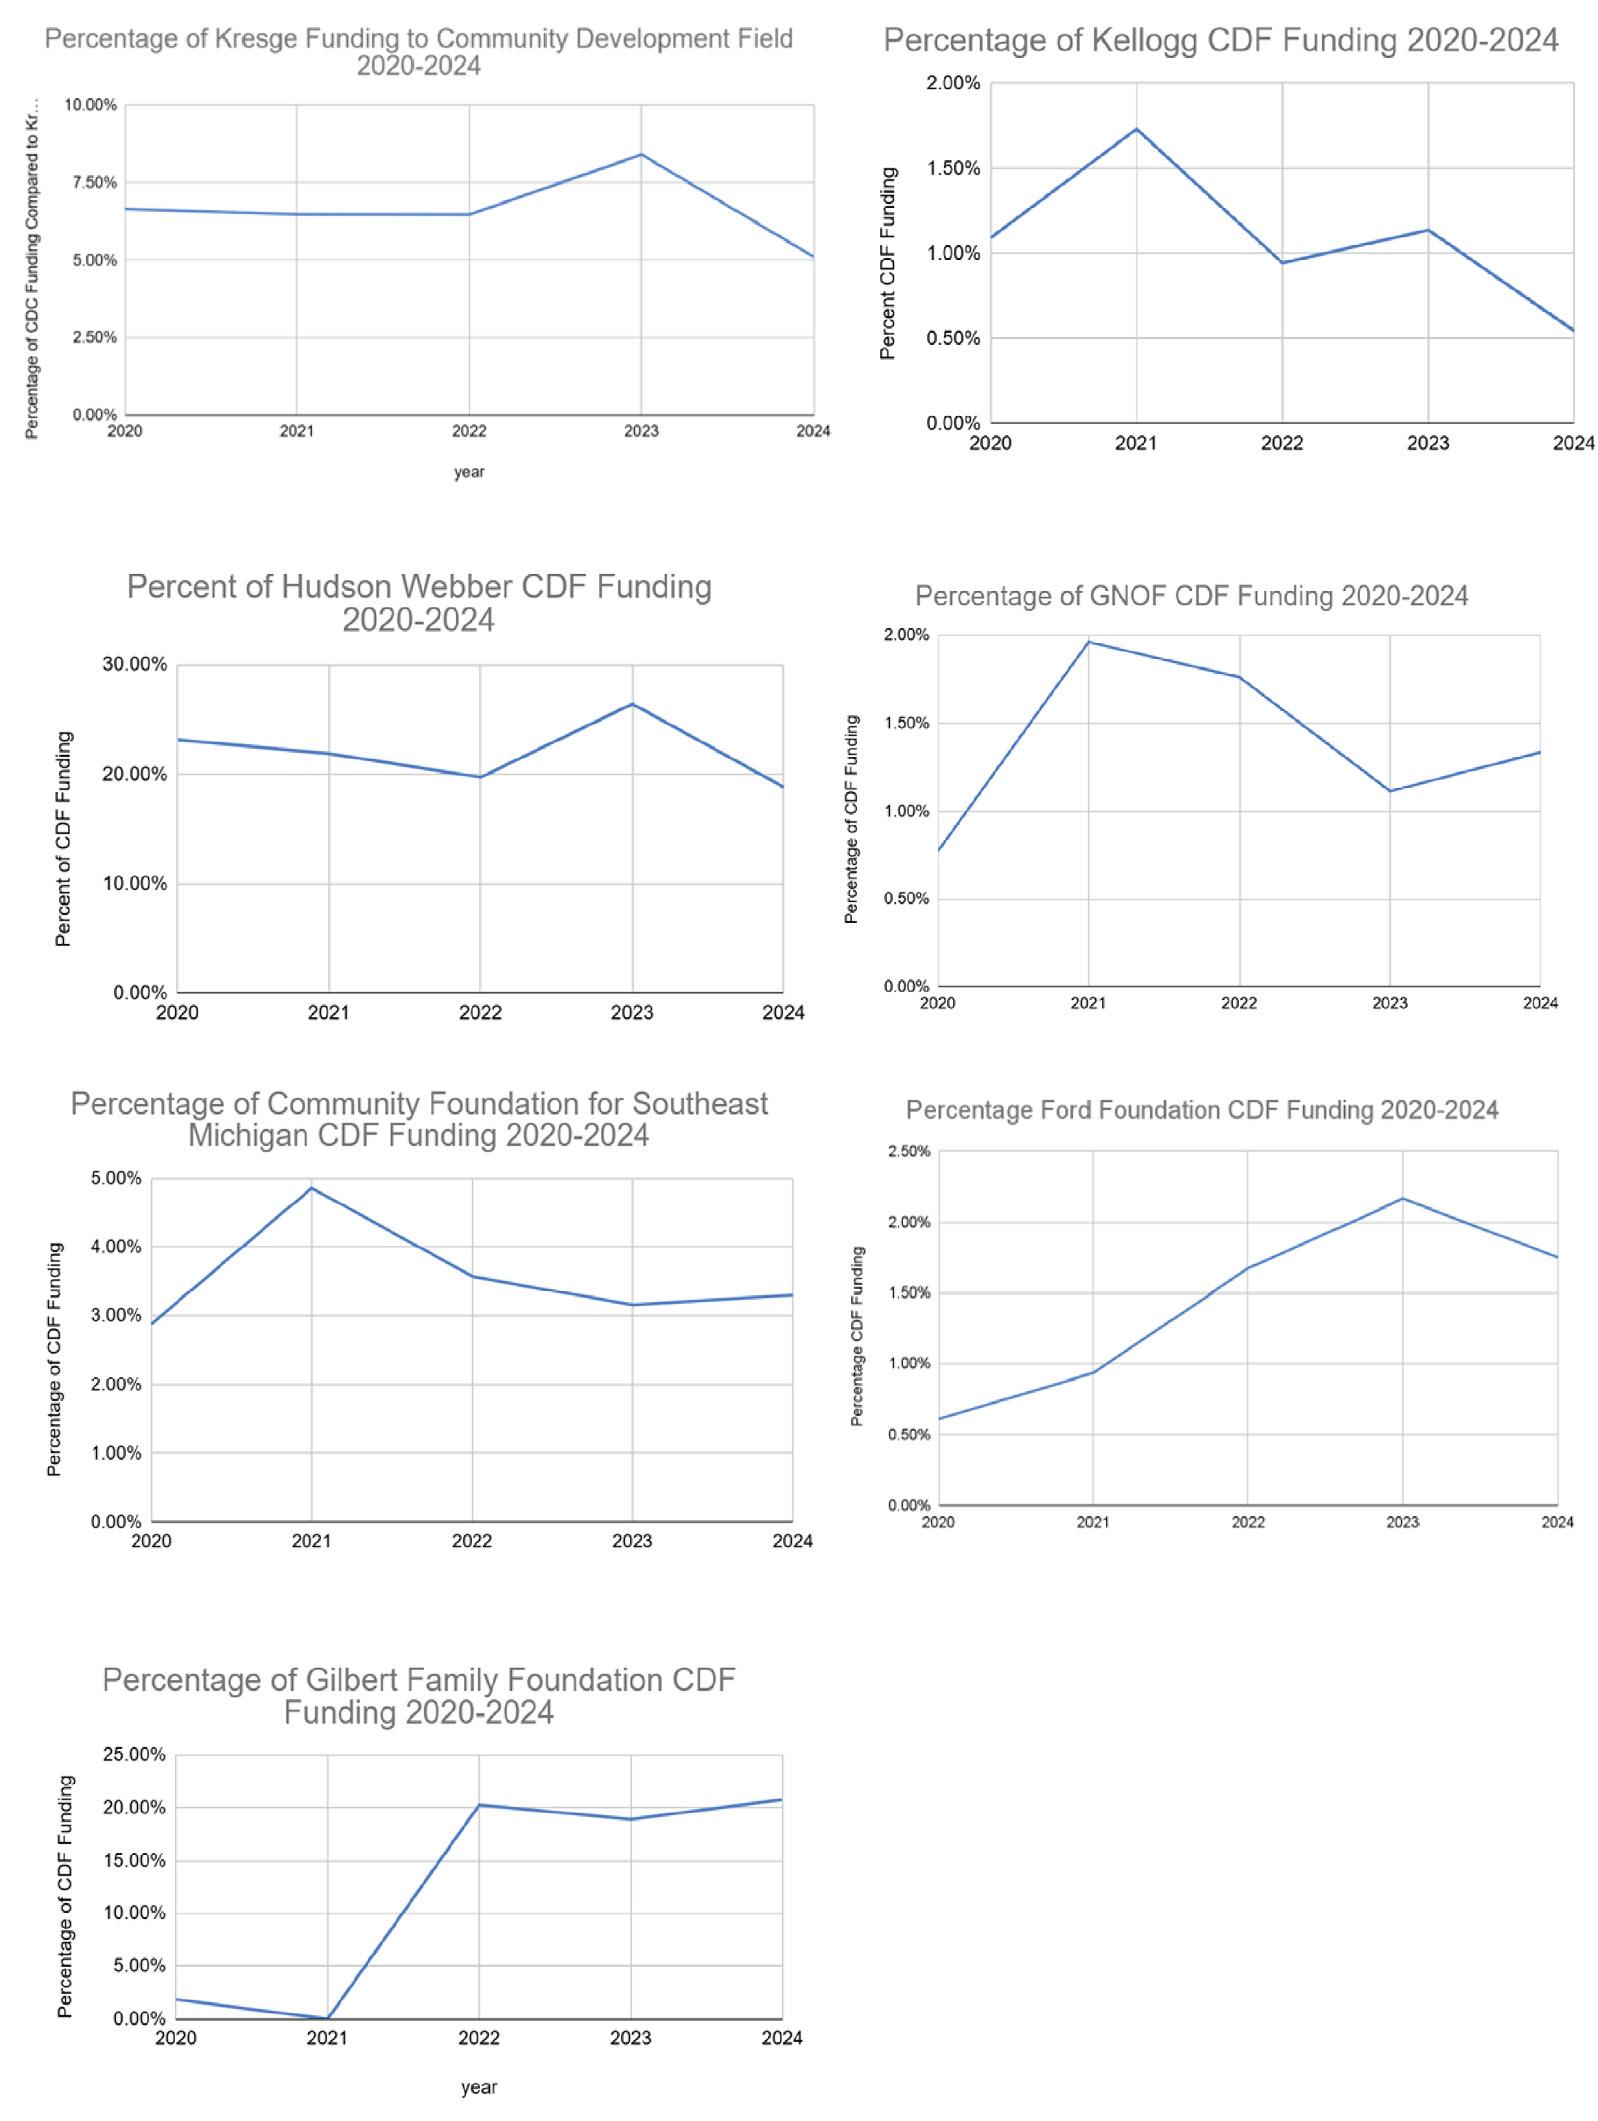
An analysis of 990 data for seven major foundations contributing to the community development ecosystems of interest for this project—Cleveland, Detroit, New Orleans, and Philadelphia—illustrates this contraction of philanthropic funds. Between 2020 and 2024, all seven foundations had at least one instance of significantly reduced funding to the CDOs and intermediaries in these ecosystems, as illustrated in Figure 2.56 For example, in 2021, the community development field represented approximately 1.75 percent of the Kellogg Foundation’s total philanthropic portfolio. By 2022, Kellogg’s funding to community development organizations was reduced to just under one percent, followed by yet another reduction to only 0.50 percent of the foundation’s entire giving portfolio.
This analysis specifically looked at 990 data for the Ford Foundation, Gilbert Family Foundation, W.K. Kellogg Foundation, Kresge Foundation, Greater New Orleans Foundation, Community Foundation for Southeast Michigan, and the Hudson Webber Foundation. A complete list of the organizations included in the community development field category can be found in the Appendix.
3. Funding for the community development ecosystems of interest from major foundations in 2020-2024.57
Figure
The Impact of Uncertainty
This funding squeeze is already being felt across the sector. Government funding cuts caused one third of nonprofit service providers to lose their funding in the first several months of 2025.58 The following statistics illustrate some of the impacts of funding uncertainty in the first few months of 2025:
21%
6%
27% lost at least some government funding experienced a delay, pause, or freeze in government funding
Recieved a stop work order
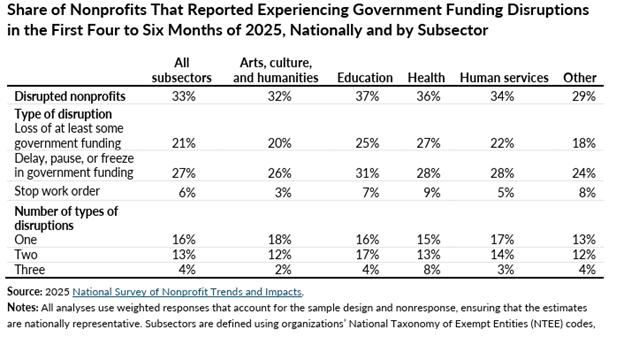
Government funding instability does not always manifest as direct funding cuts; funding delays and stop-work orders are commonly experienced by nonprofits and can be just as damaging as direct funding cuts. A report from the Urban Institute investigated the effects of government funding disruptions on nonprofit organizations in 2025 and found that even if a nonprofit did not directly experience funding cuts, the altered funding landscape led to increasing fundraising challenges.59 As shown in Figure 4, of all of the nonprofit sectors surveyed by the Urban Institute in its October 2025 report, the category including CDOs and intermediaries (“Other”) had the second highest rate of stop work orders, with eight percent reporting stop work order requests. Furthermore, 24 percent of nonprofits in this category experienced delays, pauses, or freezes in government funding and 18 percent reported a loss of government funding.60
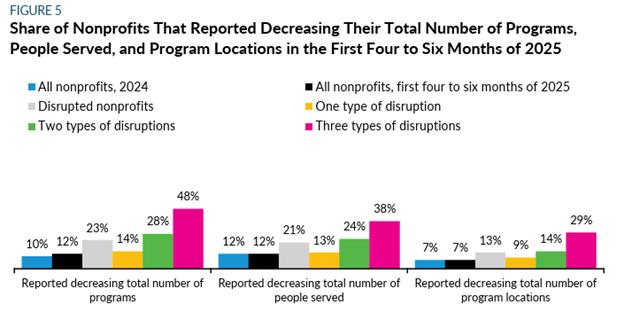
Research also shows that the more funding disruptions a nonprofit endures, the more services decline.61 As Figure 5 shows, nonprofits experiencing three types of disruptions report the highest rates of decreasing total number of programs, decreasing total number of people served, and decreasing total number of program locations in the first few months of 2025. For CDOs, this signals decreases in affordable housing, wraparound services, and crucial resources surrounding housing and homeownership.
Figure 4. Table of nonprofits that reported experiencing government funding disruptions in the first 4-6 months of 2025 by subsector.64
The volatility of this funding landscape not only impacts the budgets of nonprofits, it threatens their very existence. In a survey by the Chronicle of Philanthropy, 46 percent of nonprofit leaders nationwide indicated concern that their organizations may have to merge or dissolve due to funding cuts.63
The Impact of Uncertainty on Resource Providers and Intermediaries
The shifting funding landscape impacts every level of the community development field. An interview with the executive director of a large intermediary highlights these impacts on intermediaries within the field, describing this era of uncertainty as “the leadership dilemma of nonprofits.” He explained that this period of government austerity has resulted in greater scrutiny of the regular operations of CDOs across the country, pushing both resource providers and intermediary organizations to become stricter and more prescriptive in their expectations of CDOs. The executive director mentioned that these pressures foster an environment that prioritizes a “fee-for-service” model rather than a model that would deploy a wide variety of development tools, nonprofit programming, and funding.
Two scenarios may unfold for resource providers and intermediaries during periods of retraction. First, due to the limitation on resources, intermediaries and resource providers may encourage CDOs towards shared-based resource activities—for example, shared offices, exchange of skilled staff, and joint initiatives with other CDOs. They may also withhold resources if organizations do not consolidate. Second, resource providers and intermediaries may push the community development ecosystem to overcompensate for the lack of resources, pressuring already-overworked staff to take on more work to expand the services provided by increasingly under-resourced CDOs. This may negatively affect the relationship between resource providers, intermediaries, and CDOs. This report touches on the tensions brought about by mergers in a later section, but this is a process that is often considered by resource providers during periods of uncertainty.
Following the creation of the U.S. Department of Government Efficiency (DOGE), NeighborWorks America, a large-scale national intermediary supporting 245 community development organizations, was subject to major discontinuity as their congressionallyappropriated funding, which is typically delivered in full, was halted—only being dispersed on a monthly basis.65 This interruption of funding quickly proved disruptive to the operations of not only NeighborWorks, but also many of their member organizations, forcing them to halt
Figure 5. Share of Nonprofits that Report Decreasing Services in the First Four to Six Months of 2025.62
ongoing initiatives and long-term real estate projects.66
The Impact of Uncertainty on CDOs
Perhaps the most significant impact of uncertainty is on the availability of non-restrictive funds, or money that is flexible and can be spent at the discretion of the CDO for what it needs. This non-restrictive money is crucial for CDOs, who are able to put it toward their general operating expenses or toward programs and projects that have funding gaps. For example, in the aforementioned case of NeighborWorks, who disperses their congressionally appointed funds to CDOs through their Flexible Impact grant program, the most immediate effect of government austerity measures has been the disruption in their ability to provide CDOs with this critical form of flexible funding.67
In addition to interrupting the flow of non-restrictive funds to CDOs, which are essential for their ability to both sustain themselves and expand their capacity, government austerity measures also impact the availability of the more restrictive funds, or money that is allocated only for very specific items and activities. Especially when paired with the loss of non-restrictive funding, the reduction of restricted dollars are liable to create instability for individual CDOs.68
Overall, the pressures placed on intermediary organizations by the decreased funding from the federal government trickle down to CDOs at the local level. This is especially true for smaller organizations, according to Lou Tisler, the executive director of the National Neighborworks Association, who noted that the reduction of funds will place additional pressure on smaller organizations, preventing them from budgeting effectively and causing them to lose out on additional funding opportunities.69
One of the interviewees for this report—an executive director of an intermediary organization—explained that CDOs that serve Black and Brown communities and socioeconomically disadvantaged areas were particularly impacted by the federal government’s funding cuts. These federal budget decisions were pursuant to the Trump administration’s goal of eliminating efforts promoting diversity, equity, and inclusion (DEI), resulting in a targeted attack on organizations whose public missions involved racial, ethnic, and socioeconomic equity.70
For example, in 2025, the Trump administration stalled approximately $60 million in funds for affordable housing development, cancelling contracts under the Section 4 program with Enterprise Community Partners (ECP) and Local Initiatives Support Corporation (LISC). These funds, intended to be distributed from these national intermediaries to hundreds of CDOs, were already committed by organizations for staffing, projects, and programs, thus causing widespread hardship for CDOs across the country.72
ECP President and CEO Shaun Donovan emphasized the impact of this action on communities: “Make no mistake: Today’s decision will raise costs for families, hobble the creation of affordable homes, sacrifice local jobs, and sap opportunity from thousands of communities in all 50 states.” 73
The retrenchment of federal support has caused disruption to 90 percent of CDO funding.74 The impact of uncertainty on CDOs is significant, and the complicated politics of the federal government deteriorates the effectiveness and longevity of all community development organizations. However, the full weight of uncertainty will not fall on intermediaries or even CDOs—it will fall on the communities that these organizations exist to serve.
Community Development in Four Cities: Cleveland, Detroit, New Orleans, and Philadelphia
Community Development in Four Cities:
Cleveland, Detroit, New Orleans, and Philadelphia
This report primarily focuses on four cities, each with distinct community development ecosystems: Cleveland, Detroit, New Orleans, and Philadelphia. These cities were chosen based on the variations in their ecosystems as well as their unique contexts, detailed in the following sections. Table 1 summarizes these variations, including the community development industry size and quality (based on Christopher Walker’s 2002 report entitled Community Development Corporations and their Changing Support Systems), as well as the level of philanthropic presence in each city.75 Table 1 also indicates each city’s level of engagement in this study, including the number of interviews, the number of surveys, and the total number of engagement touchpoints. As with many cities throughout the U.S., each of these places have a history of racial tension and disinvestment, underscoring the importance of community development.
Table 1. Summary of the community development ecosystem in Cleveland, Detroit, New Orleans, and Philadelphia, including level of engagement with each city.
Cleveland
Ecosystem Overview
Cleveland’s community development ecosystem emerged in response to deindustrialization and disinvestment. In the 1980s, the city shifted its policy focus from downtown redevelopment to neighborhood stabilization, leading to the expansion of CDOs and the broader “community development industry” that strengthened collaborations between local government, philanthropy, and nonprofits. This network was bolstered by intermediaries like Cleveland Neighborhood Progress and the Cleveland Housing Network, who coordinated funding, improved CDO capacity for physical development, and professionalized neighborhood investment.76
As a result, Cleveland has an incredibly robust community development ecosystem, with a CDO presence in every neighborhood. Cleveland was frequently cited both in the literature and in stakeholder interviews as an example of a resilient and institutionalized community development ecosystem.
Government Funding
Public-sector funding has been critical for sustaining Cleveland’s community development ecosystem. Since the 1980s, the City has leveraged federal funding sources like HOME and CDBG grants to support affordable housing development and neighborhood services. More recently, the City has used Neighborhood Stabilization Program (NSP) dollars following the 2008 financial crisis and American Rescue Plan (ARPA) money to address housing instability and aid neighborhood recovery. At the state level, Cleveland draws on the Ohio Housing Trust Fund (OHTF) which provides flexible funding for a wide range of activities including housing development, home repair, accessibility modifications, and services related to housing and homelessness.77
In terms of local public-sector funding, Cleveland is unique in its local control over the way funding is distributed. The City Council directs Neighborhood Development Activity (NDA) grants, which are essentially line-item allocations of CDBG funds to specific neighborhoods, nonprofits, and CDOs.78 This distribution model is more geographically decentralized, ensuring CDOs in every neighborhood receive consistent funding.
Philanthropic Funding
The City of Cleveland has a long history of philanthropy, dating back to 1853 with the opening of the nation’s first regional Jewish charitable institution.79 In 1914, the Cleveland Foundation opened, as the nation’s first community foundation. Over the next hundred years, multiple foundations, including the United Way of Greater Cleveland, were established. This momentum continued, with Cleveland becoming a Foundation Center city in 1977— positioning itself as a trend tracker and cementing its reputation as a philanthropic hub.80 In 1987, Neighborhood Progress Inc. was created as a foundation-led effort to unify and support the work of community development organizations.
According to Fidelity Charitable, Cleveland ranked eighth in the nation for society benefit (civil rights, community improvement, social advocacy, and volunteerism).81 It ranked in the top 30 cities for overall giving in 2023, ranking first for human services, fourth for health giving, eighth in education, and tenth in arts and culture.
As of 2022, Ohio had 4,470 foundations, but they are not evenly distributed throughout the state.82Nearly half are concentrated in Cleveland, Columbus, and Cincinnati. Cuyahoga County (where Cleveland is located) is home to about a quarter of the state’s foundations, with a total of 1,024.83 These foundations gave $709 million in 2022 alone, making up 29 percent of all Ohio foundation giving.84
Real Estate Market
While other cities have experienced instability in their housing markets, Cleveland remains a stable, value-driven “refuge market” for buyers fleeing higher-cost areas. Due to its relative affordability compared to national averages, the city is seeing sustained demand for real estate. While the pandemic-era frenzy has cooled, prices are holding steady, protecting longterm investments without the sharp price drops seen in more volatile regions.85
Detroit
Ecosystem Overview
Like Cleveland, Detroit’s community development landscape has been shaped by decades of deindustrialization, disinvestment, and population loss, leaving many neighborhoods with limited public sector support and significant unmet needs. In response, CDOs emerged across the city to address the needs of their communities, particularly Black and Brown communities where disinvestment was most prevalent. In the wake of the city declaring bankruptcy in 2013, CDOs have operated alongside or in place of local government, relying on the strong base of philanthropy already present in the city.86 While Detroit’s history is unique, Rust Belt cities across the midwest have faced similar patterns of deindustrialization and disinvestment. Detroit represents one of the most extreme cases of these challenges, making it a valuable case study for understanding the pressures facing community development ecosystems across the region.
In 2016, Community Development Advocates of Detroit (CDAD), Lawrence Technological University, and Michigan Nonprofit Association, launched Building the Engine of Community Development in Detroit (BECDD).87 The aim of BECDD is to build a more cohesive and collaborative community development ecosystem in the city through seven elements: system governance, capacity building and certification, system capitalization, neighborhood voice and advocacy, data and evaluation, education and career pipeline, and city engagement.88 In 2020, Enterprise Community Partners formed the CDO Fund. Financed by local philanthropic organizations, it supports the community development ecosystem by “providing flexible, multi-year unrestricted funding, as well as technical assistance and peer learning opportunities,” allowing CDOs to “focus less on pursuing scarce resources disbursed in disparate fundraising cycles and parameters, and more on their organization’s health, program management, and exploring collaborations with peer CDOs to better serve the city’s residents.”89
Government Funding
Like other cities, Detroit relies on federal funding sources like HOME and CDBG grants, however, Detroit’s use of these funds was shaped significantly by the 2013 bankruptcy. In contrast to Cleveland, Detroit tends to centralize decision-making within city agencies, often redirecting funds toward large-scale projects and priority corridors as part of a broader revitalization effort.90
Since its introduction in 1975, Detroit’s use of CDBG funding has largely prioritized downtown development and key corridors, leveraging federal dollars to attract private investment rather than supporting neighborhood-level revitalization.91 This pattern has persisted, with significant portions of more recent CDBG funds diverted toward repaying past development loans, limiting the resources available for community-based projects.92
In 2023, CDAD published a report on the use of CDBG funds in the city. The report calls for a shift toward a more equitable, neighborhood-focused use of CDBG and other federal funds in Detroit, centered on community engagement and stronger partnerships between the city and CDOs. It emphasizes expanding investment in affordable homeownership, housing repair, and nonprofit capacity, while increasing transparency, oversight, and resident input in funding decisions. It also advocates for redirecting resources from downtown-focused projects toward neighborhood development, to support smaller organizations, and ensure that federal funds more directly benefit low- and moderate-income residents.93
Philanthropic Funding
The headline of a Philanthropy Roundtable article illustrates the role of philanthropic funding in the city: “Philanthropy keeps the lights on in Detroit.”94 Between 2007 and 2011, foundations like Hudson-Webber, Skillman, Kresge, and W.K. Kellogg poured $628 million into Detroit, according to The Chronicle of Philanthropy. The Ford Foundation reports giving $60 million to the Detroit metropolitan area since 2007, which is just under double of what was spent in the previous ten years.95 This philanthropic push largely began in 2008 when ten foundations joined forces to start the New Economy Initiative (NEI). The NEI aims to add private sector jobs to Detroit in an attempt to diversify the regional economy beyond the longstanding automobile industry.
Five years into announcing a historic, $500 million, 10-year philanthropic commitment to investing in Detroit’s housing stability, economic opportunities, and culturally rich community spaces, Rocket Community Fund and Gilbert Family Foundation announced that $300 million have been deployed since 2021, placing them ahead of their original philanthropic plan.96 $110.4 million of this was invested into housing stability initiatives. Within this pledge, the Gilbert Family Foundation and Rocket Community Fund established the Detroit Tax Relief Fund, the Detroit Home Repair Fund, the Detroit Eviction Defense Fund, the Detroit Housing Network, and the Make It Home Program, which all strive to stabilize housing for Detroit residents through the support of CDOs.97 These investments are crucial for providing affordable housing that remains affordable for Detroit residents, especially in the absence of government funding.
In 1878, the Associated Charities of Detroit was created to better serve the city’s impoverished communities.98 By the late 1800s, specialized efforts emerged, such as abolitionist work and hospitals.99 Other major funders, such as the Kresge Foundation and the Ford Foundation, founded in 1924 and 1915 respectively, began to fund sectors like healthcare, education, and socioeconomic propulsion. Today Detroit boasts over 2,270 foundations and southeast Michigan, including Detroit, hosts the largest concentration of foundations in the state.100
Real Estate Market
As of 2026, Detroit has firmly shifted into a buyer’s market. Inventory has surged at nearly three times the national growth rate, which has pushed the median list price down to around $100,000. Sellers are frequently forced to cut prices as homes sit longer, offering significant leverage to buyers.101
New Orleans
Ecosystem Overview
Community development in New Orleans was significantly shaped by Hurricane Katrina and the uneven recovery efforts that followed, exposing and reinforcing some of the longstanding racial inequities that exist in the city. The hurricane, among other things, caused large-scale displacement, ongoing population loss, and massive increases in insurance rates that drove up the cost of housing. Despite the outpouring of aid in the aftermath of the disaster, distribution was not well coordinated and was often inequitably distributed in Black and Brown neighborhoods. While some CDOs survived the hurricane, the community development ecosystem was permanently reshaped by the disaster and they played a key role in advocating for equitable redevelopment.102
Like Detroit, the community development landscape in New Orleans has also been deeply shaped by racial inequity, targeted disinvestment, and the withdrawal of public sector support. In both cities, CDOs play a crucial role in advocating communities whose needs are not being met by their local governments.
Recognizing the parallels between both cities and their community development ecosystems, Enterprise Community Partners (ECP) launched the New Orleans Community Development Organization (CDO) Fund in 2021. Modeled after the Detroit CDO Fund, the first phase of the New Orleans CDO Fund leveraged $750,000 in philanthropic funding from the Ford Foundation, the Kresge Foundation, and JPMorgan Chase to support eight local, Black-led CDOs through financial support, technical assistance, and organizational capacity building.103 As part of their larger Equitable Path Forward initiative, ECP hopes to address the “legacy of systemic racism in housing and community development” by enhancing the work of these organizations, which “serve as the anchors of the city’s neighborhoods.” 104
Government Funding
Public-sector funding in New Orleans was fundamentally reshaped by Hurricane Katrina. The disaster brought an unprecedented influx of federal disaster recovery aid. The most significant of these was the CDBG–Disaster Recovery (CDBG-DR) program, administered through Louisiana’s “Road Home” program, which directed billions of dollars toward housing recovery but was widely criticized for inequitable distribution and for disadvantaging Black homeowners by using aid distribution formulas based on pre-storm property values.105 Unlike traditional CDBG funding which is distributed locally, much of this recovery funding was controlled by the state, limiting local discretion.
At the state level, the Louisiana Housing Corporation (LHC) distributes money for housing and development projects and administers tax abatements for certain projects. Overall, greater state control over public-sector funding streams has limited the ability of CDOs to access consistent funding and has contributed to a more vulnerable community development ecosystem.
Philanthropic Funding
The Greater New Orleans Foundation (GNOF) was established in 1923, and has remained the city’s primary philanthropic organization.106 In 2011, GNOF formalized the Emerging Philanthropists of New Orleans program which aims to inspire the next generation of philanthropists in southeast Louisiana. Additionally, the Association of Fundraising Professional Greater New Orleans is a professional association that aims to strengthen and connect the local fundraising community.
Despite this institutional presence, the philanthropic landscape prior to Hurricane Katrina was highly constrained and fragmented. A small pool of donors was stretched across many needs, giving was largely uncoordinated and reactive, and funding tended to flow mostly to established institutions. Partly because of these disconnects, “and partly because of the deficiencies of local government, there was no single player capable of bringing together the vision, resources, and leadership necessary to significantly impact the central social and economic problems in the community. National funders were mostly disengaged from the city, citing its lack of capacity and legendary levels of public-sector corruption.” 107
Hurricane Katrina drastically impacted the philanthropic landscape in New Orleans. Immediately after the hurricane, response efforts were largely focused on meeting basic needs. The American Red Cross funneled $21 billion into New Orleans, and the Bush-Clinton Katrina Fund raised more than $130 million for post-disaster relief efforts.108 Individual donors comprised 86 percent of post-disaster funding: 57 percent corporate and 33 percent independent family foundations. It is important to note that the majority of foundation funding came from New York, California, and Texas, further exacerbating the lack of decisionmaking autonomy and control that New Orleanians possessed post-Katrina.
Linetta Gilbert, a former Ford Foundation Senior Program Officer, is quoted as saying “...one thing I kept hearing, especially since I worked with Louisiana Disaster Recovery Foundation, a local foundation, [is that] you had national funders come in [and] I kept hearing from everybody that we have a weak nonprofit infrastructure.” 109 The organizations that survived the hurricane received resources by passing due diligence tests imposed by foundations. Following these investments, the Louisiana Disaster Recovery Foundation was established on September 5, 2005.110 GNOF created the Community Revitalization Fund, which worked alongside the Disaster Recovery Fund, raising a total of $23 million by its sunset in 2014.111 By the time the 2008 financial crisis hit, philanthropic dollars for natural disaster recovery had receded from New Orleans. Coupled with the increased competition for funding amidst an economic recession, this resulted in an abandoned and grossly disinvested philanthropic sector.112
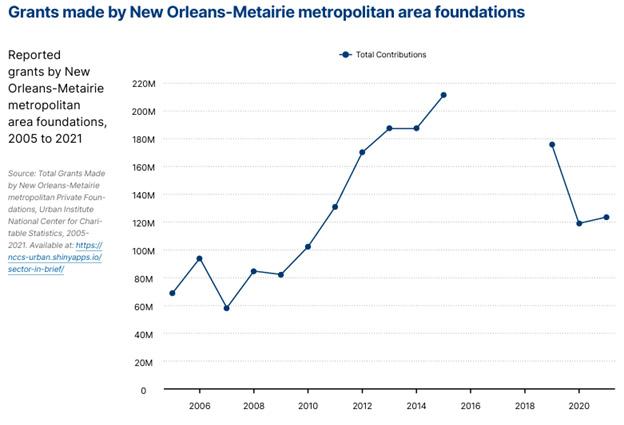
Figure 6. Graph of grants made by New Orleans-Metairie metropolitan area foundation from 2006 to 2020.
Real Estate Market
New Orleans is experiencing a stark market cooling. As of spring 2026, the median list price dropped over seven percent year-over-year, which is a significantly steeper decline than the national average. Homes are sitting on the market for well over two months, and shrinking supply hasn’t been enough to prop up prices due to diminished buyer demand.114
Philadelphia
Ecosystem Overview
Philadelphia’s community development ecosystem evolved from the same challenges faced by Detroit and Cleveland, but with more coordinated public-sector investment. In the 1990s, the city began a concerted effort to leverage federal funding sources to redevelop and stabilize neighborhoods. Similar to Cleveland, this has helped strengthen the connections between local government, funders, and nonprofits to support the work of CDOs in the city.115
Philadelphia is the only city to have a Community Development Corporation Tax Credit program that has become a key funding source for CDOs. Like Cleveland, Philadelphia is often cited as a city with a strong community development ecosystem that serves as a model for other cities.
Government Funding
Since the 1990s, Philadelphia has been notable for aligning federal funding sources like HOME and CDBG with local priorities through a strong municipal planning structure. This coordination has helped the city sustain a large network of CDOs and intermediaries.
Philadelphia is unique in its state level deployment of community development funding. In 1967, the city implemented the Neighborhood Assistance Program (NAP) which provides tax credits in return for financial contributions that support programming and projects serving low-income residents or distressed neighborhoods.116 This provides a reliable funding stream that supports CDO organizational capacity. Additionally, Philadelphia’s local Housing Trust Fund and tax increment financing districts are administered by the Philadelphia Redevelopment Authority to support affordable housing development. These state and local programs allow Philadelphia to maintain a stronger community development ecosystem compared to other cities.
Philanthropic Funding
In 1914, the Philadelphia Foundation was established as a charitable trust to administer community-based philanthropy.117 This was the world’s first community foundation, and is still one of the largest today. Since then, multiple foundations have been established, growing Philadelphia’s foundation base to 1,802 organizations in 2023.118 These foundations largely fund education and healthcare institutions, which generate 84 percent of Philadelphia’s nonprofit revenue.119
In 2023, Philadelphia was named a top 30 city for overall giving. Philadelphia also ranked seventh for educational giving, ninth for environmental and animals, and tenth for arts & culture giving.120 Philadelphia is also home to several major foundations, including the William Penn Foundation. As of 2000, Philadelphia boasted 171 CDOs, which was around 11.9 percent of total nonprofits at the time.121 There are currently 59 CDOs that are members of the Philadelphia Association of Community Development Corporations, which likely does not encompass all CDOs, but provides an estimate.122
Real Estate Market
The Philadelphia market remains resilient and complex. While it is transitioning toward a healthier, more balanced market with increasing active listings, median home prices are still showing modest year-over-year appreciation. It continues to be ranked as a highly competitive market due to its robust suburban growth and relative affordability compared to other major Northeast metros.125
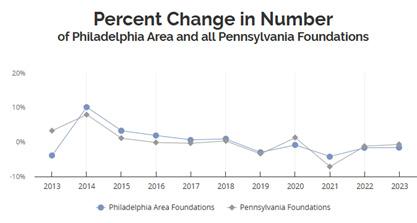
Figure 7. Percent change in number of Philadelphia area foundations compared to all Pennsylvania.123
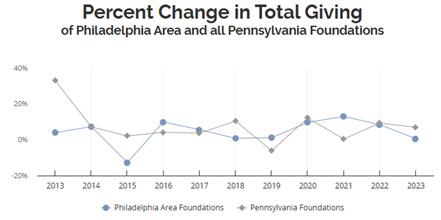
Figure 8. Percent change in total giving in the Philadelphia area compared to all Pennsylvania foundations.124
Research Methods
Research Methods
Literature Review
This project and its frameworks are grounded in a robust literature review covering a broad range of topics related to the community development field. Leveraging an in-depth literature review, this project is historically-informed in its exploration of potentially innovative methods and suggestions for the future of the field.
Interviews
Between February and April 2026, the team conducted 28 interviews with various community development stakeholders across the four cities of focus. All interviews, with the exception of those with New Orleans stakeholders, were conducted virtually. While all participants provided consent for the interviews to be recorded and transcribed, all responses remain anonymous unless otherwise specified.
Out of 28 interviewees, 26 worked directly within one of the four cities’ community development ecosystems. The geographic distribution of interview participation is listed in Table 2.
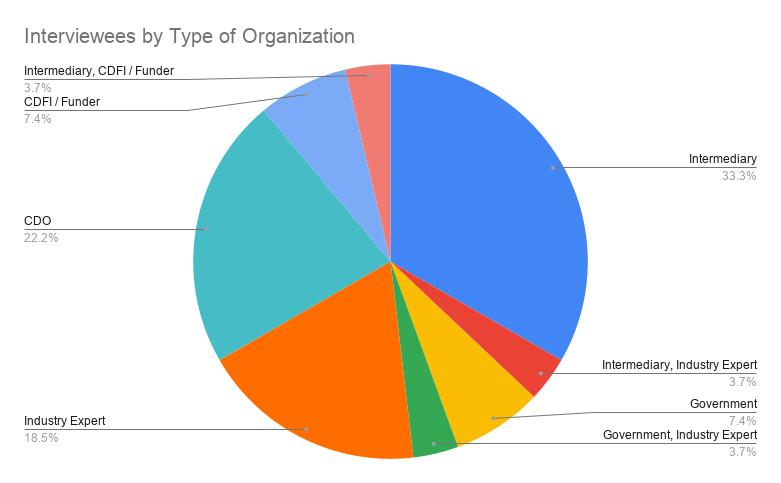
Interview participants represented a diverse range of actors within the community development ecosystem, but the majority were affiliated with intermediary organizations. Figure 9 illustrates the distribution of the types of organizations the interviewees represented.
New Orleans Learning Trip
While the majority of the interviews were conducted virtually, the team organized a learning trip to New Orleans to meet with local funders, intermediaries, and CDOs in person. Over three days, the team met with six community development organizations, intermediaries, and resource providers to better understand the history, current landscape, and future of the community development ecosystem in the city.
Table 2. Geographic distribution of interviews.
Figure 9. Distribution of interviewees by type of organization.
Survey
To collect data for the Resilience Matrix for the first scenario, Service Collapse and Inequities Between ‘Earners’ and ‘Non-Earners,’ the team conducted an anonymous online survey of CDOs across all four geographic areas of interest. The survey acted as a pilot of the Resilience Matrix and it was distributed via email to a total of 123 CDOs. Of those, seven emails were not delivered due to errors with the email addresses. Out of the remaining 116 CDOs, 26 completed the survey, yielding a response rate of 22.4 percent. However, five of the survey responses were incomplete, and therefore excluded from analysis.
The 21 complete survey responses (representing a survey completion rate of 18 percent) were analyzed to ensure the relevance and accuracy of the Resilience Matrix. The analysis first established the CDO’s “Resilience Score” using a Likert scale for five statements that gauge the organization’s ability to sustain itself through times of uncertainty. Each response (ranging from strongly disagree to strongly agree) was assigned a numeric value of 1 through 5. The Resilience Score was then derived from the sum of all responses, for a total possible Resilience Score of 25. Table X details the statements and methodology used.
Following this portion of the survey, respondents were asked to complete the Resilience Matrix, which is detailed further below. The Resilience Matrix is organized into five categories, each with a set of statements that respondents ranked using a Likert scale. Each category produced its own score, which was then tested against the Resilience Score using Pearson’s correlation to test for the existence of a relationship between each category and overall resilience.
We are confident in our ability to continue pursuing our mission through times of uncertainty.
We are confident in our ability to recover from any setbacks caused by political, cultural, financial, and/or environmental circumstances.
We are confident in the sustainability of our funding sources.
We have faced and persevered through social, political, and/or environmental disruptions in the past (e.g., 2008 financial crisis, COVID-19, etc.).
We are prepared to serve our community through a variety of social, political, and/or environmental disruptions.
Table 3. Resilience Score response table.
Limitations
This report is subject to several limitations that should be considered when interpreting the findings and recommendations. First, the geographic scope is limited to the four cities, primarily in the Midwest and East Coast: Cleveland, Detroit, New Orleans, and Philadelphia. While these cities were selected for their varied community development ecosystems, they may not fully represent conditions in other regions or smaller-scale contexts. Second, the distribution of interviews is uneven, with a significant concentration in Detroit and limited representation from Cleveland and Philadelphia, which may skew insights toward specific local dynamics. Similarly, the survey response rate was relatively low (18 percent completion), raising the possibility of non-response bias, where more capacity-stable or engaged organizations were more likely to participate. Finally, the majority of interviewees were intermediary organizations, potentially underrepresenting the perspectives of grassroots CDOs and smaller nonprofit developers. These limitations highlight the need for broader, more balanced data collection in future research.
Scenario 1: Service Collapse and Inequities Between ‘Earners’ and ‘Non-Earners’
Scenario 1: Service Collapse and Inequities Between ‘Earners’ and ‘Non-Earners’
Scenario Explanation
In Staying Rooted, Moving Forward, COA predicts that the current withdrawal of federal support—specifically Low-Income Housing Tax Credit (LIHTC), Community Development Block Grant (CDBG), and HOME funds—will disproportionally affect the longevity of “serviceoriented organizations (‘non-earners’)” compared to “community development financial institutions (CDFIs) and real estate-based developers (‘earners’).” Considering the widening discrepancies between the 20 percent of earner-CDOs that receive 80 percent of the field’s revenue, and the 80 percent of non-earner CDOs that receive only 20 percent of the field’s revenue, this portion of the report explores the ability of individual organizations to persist through periods of uncertainty that exacerbate these existing inequalities.
Real estate is an established revenue generator in the world of community development, and most CDOs offer real estate-based services alongside other grant-funded services.126 However, there is a prevailing belief that real estate provided by CDOs—as a competitor to private, market-rate real estate developers—is more stable and insulated from political and economic backsliding than grant-based services provided by CDOs. 127 128
In light of concerns that earners may survive periods of austerity while non-earners do not (potentially resulting in housing needs being met while other community needs go unaddressed), this section examines measures of CDO longevity. These measurements were developed by: (1) defining the specific terms of resilience; (2) identifying characteristics and strategies from current, long-lasting nonprofit organizations; (3) documenting financial inequities between real estate developers, CDFIs, and grant-service providers; and (4) codifying historically successful metrics of CDO health and capacity. The characteristics and strategies mentioned in this section can be used by organizations of any scale in the face of disparate challenges, and, if widely implemented, could create greater equity in the community development field.
Between 2019 and 2025, the Urban Institute conducted the first national census of community development organizations in the U.S. since 2005. Their findings highlighted both the current scale and structure of the field: approximately two-thirds of CDOs engage in real estate development and nearly all, 96 percent, provide services. At the same time, roughly 90 percent receive at least $50,000 in single-year federal funding through programs such as HOME and CDBG.129
The findings point to one central and recurring feature of the field. Most CDOs operate across both development and service provision, while also relying heavily on federal funding. A rollback in federal funding would likely negatively impact aspects of development and service provision that rely on grant support. This dependence creates a clear vulnerability in the current funding environment.
Real Estate Development as a Model for Earned Revenue
Real estate development is often seen as a path to financial stability for CDOs because it can be a major source of earned income. In a 2022 report on the financial health of CDOs, the Urban Institute distinguished organizations based on the share of their assets held in land, buildings, and equipment. Organizations with higher shares of these assets tended to have more stable revenue streams and the report suggests that CDOs with “large real estate holdings tend to be less vulnerable to sudden shocks and represent more steady income and expense streams.” 130
However, this model is highly contingent on local market conditions and is not universally accessible to all CDOs. Following the 2008 financial crisis, real estate development was no longer a viable revenue source for many CDOs. This was still true in 2016 when a Shelterforce article noted that, “there have been increasing calls for [CDOs] to change their business models. Housing development, it is argued, should be left to larger nonprofit developers, which have more stable balance sheets and wider geographic areas to provide more efficiency and more confidence for investors.” 131
While the real estate market differs greatly across cities, and the ability to do real estate development is highly dependent on the individual capacity of a CDO, interviewees in all four cities noted that real estate development does not provide a consistent source of revenue.
Cleveland
In Cleveland, the real estate market is relatively strong, but varies neighborhood by neighborhood. For CDOs, the ability to engage in development depends on where the CDO is located and limited infill opportunities in some neighborhoods reduce the opportunities for development.
Detroit
In Detroit, the 2008 financial crisis not only impacted the real estate market in the shortterm, but fundamentally reshaped the ability to do development in the city. One interviewee described these impacts:
“Many of our contractors and just the talent that we had left Detroit in 2008 to 2012 and many of them didn’t come back. So, as CDOs are trying to build their capacity to do more development, we don’t have a lot of great contractors who understand project management.”
Another interviewee described how the Covid-19 pandemic impacted the viability of real estate for CDOs:
“Their budgets and operating situation was heavily reliant on development. And so when the development dried up around Covid, they were struggling just like everybody else.”
The limited availability of experienced contractors, rising post-COVID construction costs, and gaps in CDOs’ capacity to navigate complex real estate development processes have contributed to significant constraints on nonprofit-led development in the city, as one CDO explains:
“There are very few nonprofits in Detroit that have ever successfully done real estate development well and with a revenue stream that kicks off on it.”
As a result, Detroit’s CDO sector operates within a constrained development ecosystem shaped as much by labor and market conditions as by organizational capacity.
New Orleans
In New Orleans, real estate development is highly constrained by a combination of factors. In addition to high insurance and materials costs, one interviewee noted:
“One of the challenges that we have in New Orleans… is that our land prices are much higher… so the cost to build anything here is just a substantial barrier.”
Similar to Detroit, another major challenge is closely tied to broader gaps in technical expertise, organizational capacity, and supporting infrastructure for CDO-led development:
“What we did not have was a lot of organizations that were resourced or had the technical expertise to really engage in physical development, real estate development in their neighborhoods. And there wasn’t a network of funders or clear systems for these organizations to tap into to really carry out more complex work.”
While interviewees in New Orleans did acknowledge that the emergence of trade organizations have been instrumental in building these networks and technical expertise, the constraints reflect a development environment where both cost pressures and constrained institutional capacity limit CDO-led real estate development.
Philadelphia
In Philadelphia, CDO-led real estate development operates within a comparatively stronger institutional and funding environment, but organizations still face significant financial pressures. In addition to broader federal retrenchment, delays in state budget approvals have created cash flow challenges for CDOs:
“Even some of our larger CDC members that do real estate development, they’re facing significant financial pressures because… the fiscal year 26 budget was not approved until six months late. So a lot of folks were not getting paid by the state for work that they were already doing, and that’s had a dramatic impact as well, especially if you’re a larger nonprofit organization that’s doing both social service type work and real estate development.”
This has forced CDOs that do real estate development to take on substantial financial risk, compounding the existing pressures of development.
Overall, CDO-led real estate development is constrained by multiple factors including, at the most basic, the state of the real estate market in particular neighborhoods, the high physical costs associated with development, and the limited technical knowledge and expertise of CDOs as well as their ability to engage qualified contractors.
Defining Resilience
The growing uncertainty surrounding recent federal funding cuts and withdrawal of philanthropic funding highlight the importance of organizational resilience: the ability of a CDO to withstand disruption while continuing to fulfill its mission.
Although the current conditions are uncertain, they are not without precedent. Within the past 20 years CDOs experienced the impacts of the 2008 financial crisis and the Covid-19 pandemic, as well as ongoing shifts in local, political priorities tied to elections. These events serve as important research areas, and provide key insights into strategies that can increase organizational resilience and strengthen the field as a whole.
In the literature, resilience is typically defined as “the ability of groups or communities to cope with external stresses and disturbances as a result of social, political, and environmental change.” 123 For CDOs, resilience extends beyond organizational survival to include the capacity to provide essential services to the communities they serve. This means that the longevity of these organizations has a direct impact on the wellbeing of these communities, and their ability to weather uncertainty determines whether they are able to continue to fulfill their mission in their community.133
CDO Resilience: Literature Review
The literature describes the resilience of community development organizations (CDOs) as both a demonstrated historical reality and an ongoing process of building adaptive capacity to navigate financial, social, and environmental shocks. For CDOs, “resilience is only a reactive response… resilience can also be about pre-emptive responses.” 134 At the same time, there is a clear distinction between the resilience of the communities these organizations serve and the internal resilience of the organizations themselves, though the two are deeply interdependent.135
Historical and Economic Resiliency
Research shows that the CDO sector has demonstrated significant staying power over time. Despite major economic disruptions, including the 2008 financial crisis and the Covid-19 pandemic, the sector has continued to grow in both scale and capacity.136 Between 2001 and 2019, average real revenues for surviving organizations increased by 18 percent, while average total assets grew by 54 percent.137 Additionally, the median age of a CDO is now approximately 33 years, up from 18 years in 2005, signaling a maturing industry that can sustain itself over multiple decades.138
Operational Resilience and Adaptive Capacity
Resilience is frequently framed in terms of “adaptive capacity,” or the ability to anticipate, respond to, and recover from shocks. During the Covid-19 pandemic, many CDOs demonstrated this capacity by shifting their operations to meet urgent community needs, shifting resources to provide emergency rental assistance (65 percent) and food distribution (58 percent).139 These responses highlight the role of CDOs as frontline actors during periods of crisis. Their local knowledge allows them to respond quickly when public systems are delayed or insufficient. Over time, this adaptability has also shaped the evolution of the field. Most CDOs now provide a range of services beyond physical development, including community organizing, advocacy, and basic needs support.140 This diversification reflects an ongoing effort to respond to complex and changing community conditions.
Social and Relational Resilience
Organizational resilience is closely tied to social capital, trust, and community embeddedness. Many CDOs maintain strong accountability to the communities they serve. This is often reflected in board structures, with 97 percent of CDOs reporting that their boards reflect the local population.141 Partnerships and coalitions also play a central role. Collaborative relationships allow organizations to share resources, coordinate responses, and expand their reach. However, these relationships require time and investment to sustain. In periods of financial constraint, the infrastructure needed to support collaboration is often among the first areas to be reduced. Equity and diversity are also critical. Inclusion is often cited as a “moral and ethical imperative” but also an operational necessity; organizations that fail to include diverse voices narrow their response options during crises.
Vulnerabilities and Risks
Despite overall sector growth, several persistent risks continue to affect long-term resilience. Financial structure is a key factor. Organizations with significant real estate holdings often benefit from more stable revenue streams and are insulated from sudden income shocks, but these organizations tend to carry higher levels of debt and face greater risk of insolvency (21 percent) compared to those focused primarily on service provision.142 Additionally, approximately one-third of CDOs operate with less than three months of cash on hand, which falls below commonly accepted benchmarks for financial stability.143 This limits their ability to respond to unexpected disruptions. Finally, there are ongoing inequities within the field. Organizations led by people of color often face higher financial risk and have access to fewer resources. These constraints limit their ability to invest in strategies that could strengthen long-term resilience, reinforcing disparities across the sector.144
While the community development field has demonstrated long-term growth and adaptability, resilience remains uneven across organizations. It is shaped not only by internal capacity and strategy, but also by broader structural conditions, including access to capital, local market dynamics, and systemic inequities.
Resilience Matrix
Overview
In order to operationalize the above research and interview findings, the Resilience Matrix was developed as a tool for CDOs to measure their own resilience and identify areas for improvement. Given the vast amount of variation across each CDO ecosystem and individual CDO, it is important for tools, such as this one, to take into account the wide range of possible scenarios CDOs could be facing. Grounded in a deep understanding of the literature and stakeholder engagement, this Resilience Matrix serves as such a tool.
Existing Assessment Tools & Best Practices
The Resilience Matrix draws on existing best practices for nonprofit management as well as established methods for assessing the status of CDOs. Two primary resources served as points of reference for the Resilience Matrix: the Community Development Reflection assessment from Community Development Advocates of Detroit (CDAD) as well as the Michigan Nonprofit Association’s (2009) Principles & Practices for Nonprofit Excellence in Michigan. 145 146
Understanding & Measuring Capacity
A commonly-discussed factor for the productivity and longevity of CDOs is their “capacity,” which—like community development itself—is not universally defined. The process of creating the Resilience Matrix began by establishing what capacity is and how it can be measured. Glickman and Servon (1998) provide a useful framework for understanding capacity, defining it through five major components, which ultimately serve as the five categories of the Resilience Matrix. These components are detailed in Table 4.
Resource capacity This refers to an organization’s ability to acquire and manage funding resources.
Organizational capacity This refers to an organization’s internal operations relating to staffing, management, and leadership.
Programmatic capacity This refers to an organization’s ability to manage and implement its programs and projects.
Network capacity This refers to an organization’s level of interaction and collaboration with other relevant institutions.
Political capacity This refers to an organization’s ability to serve and advocate for the needs of their residents.
Table 4. Five major components of capacity. 147
Overview of Findings
As detailed in the ‘Research Methods’ section of this report, the research team developed the Resilience Matrix, detailed below, and piloted it through an anonymous survey of 21 CDOs across all four geographic areas of interest (Cleveland, Detroit, New Orleans, and Philadelphia). The survey first established each CDO’s “Resilience Score,” measuring the organizations’ ability to sustain themselves through times of uncertainty. Following the questions on organizational resilience, survey respondents proceeded to answer questions
related to each of the five major components of capacity: resource capacity, organizational capacity, programmatic capacity, network capacity, and political capacity. Through the quantification of each of these “Capacity Categories,” a comparative analysis was conducted using Pearson’s correlation to test for the existence and strength of a relationship between each Capacity Category and the Resilience Score.
Overall, the analysis suggested that resource capacity had the highest correlation with resilience, followed closely by network capacity. Organizational and programmatic capacity were moderately correlated with resilience, and political capacity showed the lowest overall correlation, but it was still moderately correlated. These findings suggest that resilience is most strongly anchored in an organization’s ability to secure resources and leverage relationships, but this depends on a balanced and interconnected set of capabilities rather than any single source of capacity.
1. Resource Capacity
The first type of resilience is resource capacity, which describes the fundamental “ability [of CDOs] to increase, manage, and sustain funding” regardless of the context.148 Resource capacity is measured through several metrics: ability to secure long-term operating support; ability to stabilize after formation; ability to expand and grow; ability to access development capital across multiple sources; ability to build relationships with funders and develop partnerships; ability to manage a balanced portfolio of risk; and ability to integrate with other forms of capacity (i.e., organizational, programmatic, network, and political).149
Resilience Matrix – Resource Capacity
The following questions are intended to gauge an organization’s ability to acquire and manage funding sources:
Table 5. Capacity category correlation with overall resilience.
Survey Results – Resource Capacity
The data for the Resilience Matrix is comprised of the responses of the 21 CDOs who replied to the survey across all four geographic areas of interest. Of the five capacity categories, resource capacity had the highest correlation with resilience. The survey found that CDOs with a detailed budget and a dedicated staff for fundraising had a lower correlation with resilience, but programmatic funding and real estate funding were strongly correlated.
Possessing secure funding for all programs has the highest correlation with resilience—both as a subcategory of resource capacity and in all subcategories on the Resilience Matrix (r = 0.61). This indicates that as funding for non-real estate programs increases, so does resilience. This finding is noteworthy because it dispels the assumption that real estate development is the sole driver of resource capacity. Instead, there is more of an emphasis on drawing resources from a variety of places and from a diversity of relationships.
The ability to secure the funding necessary to start, complete, and maintain real estate projects had a moderate positive correlation with resilience (r = 0.43), indicating that as an organization’s funding for real estate projects increases, so does their overall resilience. This finding aligns with the literature and the interviews, which both suggest that real estate can be financed via state and federal governments and can later generate development capital more easily than through economic development.150 Economic development is defined by programs and activities that improve the local quality of life and the general conditions for economic growth— incrementally, in this case.151 Whereas capital for economic development is difficult to find in ample amounts, funding for housing can come from a broad range of sources and institutions. Furthermore, funders view support for housing as more readily accessible for upfront development costs than support for economic development initiatives.152
Throughout all interviews conducted for this report, interviewees repeatedly reported that successful community development groups shared the following key themes: diversified funding streams, the ability to leverage local government and funder relationships, and fiscal responsibility. In Detroit, the expansion of resources in these three ways were of a major concern to the community development ecosystem.
The expansion of funding streams is critical to the facilitation of CDOs’ growth, allowing them to strategically expand their projects, program offerings, and, ultimately, overall impact.153 In some cities, like Cleveland where many organizations participate in both real estate development and service-based programs, the back of both governmental and philanthropic dollars provides for programmatic flexibility. In places where real estate development is less viable, however, this diversification of funding and program expansion is much more difficult, requiring more creative strategizing.
This is the case in Detroit, where one intermediary posited that courting unconventional government funds could supplement the lack of revenue from real estate:
“I think a lot of folks are not looking at the additional kind of pots of money that they can tap into. One thing with the home repair space is that, at least in Detroit, 55 percent of folks who are in these houses that need extensive home repair are also disabled. Is there a way to tap into disability dollars in relation to that? When it comes to certain places like in New Orleans or wherever that has climate resiliency issues, are there ways to tap into climate related dollars?”
Overall, resource collapse can be mitigated by leveraging funding streams from different sources, by leveraging private donors against public dollars, and by expanding the unrestricted revenue that comes from a variety of programs.
Case Study - Resource Capacity
Jefferson East, Inc. (JEI) is a nonprofit organization that serves five historic neighborhoods— Jefferson-Chalmers, the Marina District, the Villages of Detroit, Rivertown, and Lafayette & Elmwood Park— along the East Jefferson corridor on Detroit’s East Side.154 Originally established in the early 1990s to increase commercial development in the JeffersonChalmers neighborhood, JEI has grown significantly by expanding into a broad range of programming. The organization’s efforts include corridor cleaning and safety services, small business services, housing services, resident technology support services, and domestic and intimate partner violence (DIPV) services.155 JEI’s expansive economic and community development strategy— focused on housing, family, business, and neighborhood resilience— is directly facilitated by their diversified partnerships and funding sources. These sources include, but are not limited to, Bedrock Detroit, a real estate management firm; Wayne State University; the University of Michigan; LISC Detroit; Bank of America; Enterprise Community Partners; the Michigan State Housing Development Authority (MSHDA); DTE Energy; Rocket Community Fund; the Gilbert Family Foundation; and the City of Detroit.156
These diverse partnerships and funding sources, which encompass a wide range of governmental, philanthropic, corporate, and academic actors, have proven foundational for JEI’s ability to serve its community holistically. For example, JEI has a long history of working with the University of Michigan, collaborating with the university’s law department during its founding in the mid-1990s.157 This long-term relationship with such a prominent academic institution has culminated in a number of opportunities for JEI across multiple different branches of the university, including the Ford School of Public Policy, the College of Engineering, the School for Environment and Sustainability, and the Institute for Social Research.158
Through this sustained partnership with the University of Michigan, JEI has launched a number of new community services, such as: (1) the Community Tech Workers program, which allowed JEI to hire six new staff members (three community residents and three University of Michigan students) to provide technology support and training for community members and business owners; and (2) the National Science Foundation Smart and Connected Communities Program, which helps homeowners obtain home energy savings.159 In addition to these programs, Jefferson East, Inc. has also been able to identify additional areas of opportunity to better serve their residents by leveraging student capstone projects, which has helped the organization strategize how to approach critical issues like basement and shoreline flooding in its its community.160
JEI’s approach to diversifying their revenue stream and maximizing their resource capacity moves beyond these strategic partnerships and funding opportunities that increase their service provisions. The organization has also established a for-profit subsidiary called the East Jefferson Development Corporation (EJDevCO) in order to “revitalize the Jefferson Chalmers neighborhood with a focus on mixed-income, mixed-use, equitable development.” 161 Despite acting as a for-profit entity, EJDevCO ultimately serves as an additional funding stream for JEI, with the profits directly contributing to JEI’s services.162 EJDevCO not only provides additional revenue streams for JEI through generating profits, but also through attracting additional investments from philanthropic and governmental actors. In 2018, for example, EJDevCo secured a $2 million equity investment from the Kresge Foundation to acquire, redevelop, and repurpose several buildings in the Jefferson Chalmers neighborhood. While this investment requires a one percent repayment over a 10-year term, it also includes $174,064 in grant funding.163 Overall, the establishment of EJDevCO represents a critical and worthwhile effort towards diversifying JEI’s funding stream and, ultimately, expanding their resource capacity.
2. Organizational Capacity
Organizational capacity “comprises the ways that staff, boards or directors, and others carry out the functions of nonprofits…[it also] refers to the depth of skills and expertise of board and staff members.” 164 This form of capacity refers to a CDO’s ability to administer resources, coordinate roles, and develop strategic responses to complex problems through effective internal structures, leadership, and staff coordination.
Organizational capacity is defined by the following traits: an effective executive director; competent and stable staff; effective fiscal management; diverse board development and leadership; managed growth; effective project management; honest evaluations; frequent interactions among the different components or sectors of the organization (and the community development field at large).165
Resilience Matrix – Organizational Capacity
The following questions are intended to gauge an organization’s internal capabilities related to governance and staffing:
Analysis of Survey Results – Organizational Capacity
The results of the survey demonstrated a moderate positive correlation between organizational capacity and resilience (r = 0.4), indicating that as organizational capacity increases, resilience also increases. While this r-value indicates a moderate correlative relationship between organizational capacity and resilience, it is the second lowest correlation between a capacity category and resilience.
However, the “staff assigned” subcategory of organizational capacity had the highest correlation with resilience of all subcategories tested in the survey (r = 0.78). This subcategory assesses whether a CDO has dedicated, experienced staff assigned to carry the organization’s projects, programs, and objectives. The strong correlation indicates that when an organization’s staffing needs are met, it is more resilient. Staff skillset—having a staff with diverse and transferrable skillsets—also showed a high correlation with resilience (r = 0.56), indicating that a more flexible staff leads to higher resilience.
These findings indicate that while organizational capacity as a whole is less correlated with resilience, having a staff that can fulfill multiple roles and is trained across a wide range of functions is extremely important to the longevity of organizations. Several survey indicators from other capacity categories also connect resilience to staff retention and diverse skillsets. Interviewees also suggested that mixed leadership boards, competent executives, and succession planning were, anecdotally, the strongest characteristics of resilient organizations.
When documenting resilient community development organizations in Detroit, the configuration of the board of directors and staff were often cited as a key component of resilience in interviews. The range of expertise and experiences of the board and staff were identified as key factors in organizational longevity. Interviewees emphasized that, alongside community representation among board and staff, a mix of professionals and specialized expertise is essential for strengthening organizational capacity.
Historically, CDOs were largely composed of community members with a direct stake in the organization’s mission—whether as residents within the CDO’s geographic area or through shared identities and affiliations (e.g., faith-based, African American–focused, Latinofocused, or family-centered organizations).166 As the field has become more professionalized, these traditionally grassroots structures have expanded to include non-resident actors. In
this evolving model of community development, organizations increasingly adopt more heterogeneous structures, bringing together residents, corporate leaders, and financial professionals at the board level, alongside a mix of volunteers and specialized staff.167
One interviewee from a Detroit-based CDO emphasized the importance of the make-up of an organization’s board:
“You really have to have a diverse board, one that represents the community you serve, but also is plugged into power centers that can help you get things done… I’ve seen small organizations get tripped up [when] the board doesn’t respect the professional management of the organization. It’s very tough for a grassroots organization to go from a volunteer-led organization to a professionally managed organization… I’ve seen organizations that [will bring on] professional staffers, but the board still is trying to manage day-to-day operations. [They will even overrule] the staff from that, too. And what ends up happening, then, is the staff leaves.”
This suggests that organizational capacity depends on both a diverse and representative leadership, as well as a staff with both community ties and professional expertise.
Case Study – Organizational Capacity
The Grandmont Rosedale Development Corporation (GRDC) is a nonprofit organization dedicated to the improvement and preservation of the Grantmont Rosedale neighborhoods in Detroit.168 With a Board of Directors comprised entirely of neighborhood residents, GRDC is able to pursue their mission strategically through a variety of programs that are specifically tailored to resident needs, developing their community into a prosperous “place to live, work and play.” 169 Through intentional efforts to align their staff members, resident-driven board, and the broader community, GRDC is able to demonstrate a commitment to their residents, leverage a diverse set of experience, and generate a broad base of support.170
By carefully balancing the voices of resident board members with professional staff, GRDC has diligently served their community in ways that meaningfully improve the lives of their residents through a variety of activities and projects such as real estate development, a local farmer’s market, a co-working space, home repair, commercial corridor revitalization, and neighborhood beautification.171 Each of these efforts culminate into a “momentum [that] is becoming hard to miss,” characterized by increased investment, opportunity generation, significant development, and overall greater interest to live, work, and support the Grandmont Rosedale community.172 More tangibly, this has translated into approximately $32 million in new housing and commercial development projects as well as the attraction of new residents and businesses throughout the community.173
3. Programmatic Capacity
Programmatic capacity is an organization’s ability to effectively design, implement, and evaluate its programs.174 While all five of the capacity categories are highly inter-dependent, programmatic capacity is especially dependent on the other four categories, as it requires stable and qualified staff to design and implement programs as well as the resources to maintain and evaluate these programs. But programmatic capacity can also generate capacity in these categories, because, “with thoughtful program design, building capital can occur through service delivery.” 175
Programmatic capacity can be defined as an organization’s ability to implement and manage programs effectively, supported by aligned staff expertise, flexible staffing structures, and technical skills for delivering complex services like real estate development and home repair. It also depends on mission clarity and place-based focus, as well as strong external relationships with funders, government, and intermediaries that provide access to capital, technical assistance, and implementation support.
Resilience Matrix – Programmatic Capacity
The following questions are intended to gauge an organization’s capabilities related to program and project implementation:
Analysis of Survey Results – Programmatic Capacity
The survey results show moderate correlation between resilience and programmatic capacity, particularly programs that are responsive to community feedback, home repair programs, and real estate development. This indicates that organizations with the ability to effectively manage real estate or home repair programs are potentially better positioned to remain resilient during periods of uncertainty.
There is a slightly weaker, but still positive, correlation with community-informed programming and program evaluation, suggesting that while planning and assessment are important for program quality, they are less directly tied to an organization’s ability to withstand external shocks.
Programmatic capacity is closely tied to other capacity categories, particularly an organization’s ability to retain qualified staff and to maintain strong relationships with government and funders to generate resources that support program implementation. One key challenge to programmatic capacity is the instability of short-term funding, which limits an organization’s ability to plan and sustain programs and also limits their ability to retain staff to manage these programs long-term. One intermediary highlighted the importance of long-term, flexible funding in building programmatic capacity:
“One of our key recommendations [to City Council] was actually providing sustained, ongoing multi-year support to community-based organizations through general operating support… that long-term support enables you to plan longer term and to hire staff and know that funding will be there beyond just a one-year grant, whereas you don’t know after that year grant ends, whether you’re going to be able to sustain a staff position, for example.”
This underscores that hiring qualified staff is not just a matter of recruitment, but of financial stability. Without reliable funding, organizations struggle to offer competitive pay and benefits, leading to higher turnover and reduced capacity to consistently implement programs. The interviewee further pointed to the role of local government relationships in directly supporting programmatic work through targeted funding streams:
“The city… does utilize a fair amount of funding to support the work done by community development organizations, whether that’s housing counseling or commercial corridor management, like the neighborhood shopping areas working to improve those… So it’s very programmatic focused... So we’ve been successful in getting funding for those programs increased aswell too because those folks need to get paid better than they were getting paid before, for one and get better benefits as well.”
These insights show that programmatic capacity depends not only on technical skill, but on sustained investment in staff and stable funding structures. City-supported, program-specific funding for staff and operations plays a critical role in enabling organizations to deliver and sustain their programs.
Case Study – Programmatic Capacity
People’s Housing Plus (PH+) is a community development organization based in New Orleans that develops real estate and provides counseling for affordable housing, financial wellness counseling, and long-term estate planning. PH+ serves the entire city of New Orleans, but currently operates in the Gentilly-Pontchartrain Park, New Orleans East, Gentilly-Fillmore, Tremé, 7th Ward, Tulane-Gravier, and Broadmoor neighborhoods.176
PH+ formed out of a merger of three organizations: Home By Hand, Tulane Canal Neighborhood Development Corporation, and Crescent City Community Land Trust. This merger came out of the need to grow resources and capabilities of affordable housing providers, and to holistically expand the access to affordable housing in the city in the years following Hurricane Katrina.177 Home By Hand formed shortly after 2008, with the goal to stabilize the local housing market by building and gifting houses to hurricane victims.178 Its main program was affordable home construction and repair.. However, the complex needs of Home By Hand’s clientele led to the inception of the comprehensive stewardship program. The comprehensive stewardship program was an all-inclusive client services framework, which covered financial literacy, financial fitness, education on the homebuying process, and post-sale resources for homeowners.179
Home By Hand eventually merged with the Tulane Canal Neighborhood Development Corporation, a place-based, single-family developer that served potential homeowners. Though that organization delivered sparse construction projects, its primary focus was homebuyer preparation. By merging together, the new, hybrid organization could provide both construction and financial literacy services without contracting consultants.180
Following this merger, a second merger brought in the Crescent City Community Land Trust. The Crescent City Community Land Trust developed the central server model, where the land trust invested in other housing development projects to adjust the local housing affordability of an area permanently.181 The final merger of these three organizations coordinated each original organizations’ skills, and leveraged those specialties to focus on guaranteeing shared equity and permanent home affordability. PH+ positioned itself to address issues in the housing supply and to decrease the barrier to entry in the housing system.
People’s Housing Plus is a successful example of an organization with strong programmatic capacity because of its varied and holistic development approach. Not only does PH+ maintain a diverse housing portfolio, but it also provides services to clients at different parts of the homeownership process. Furthermore, by nature of the merger, the PH+ staff is diverse in each members’ skill and the jurisdiction overlooked by all three original organizations. By integrating its services horizontally, PH+’s programmatic capacity can adapt to the future economic and developmental changes in New Orleans.182
4. Network Capacity
Network capacity can be understood as an external expansion of organizational capacity. Research suggests that “Connectedness in inter-organizational networks and the social capital between institutions and individuals who represent the organizations play an important role in the distribution of information, and establishment of a cognitive structure. They also help organizations and networks build adaptive capacity via operating on a common ground, sharing resources, and leading the change as opposed to following change in the environment.” 183 Building beyond internal organizational capacity, network capacity allows CDOs to improve adaptive capacity by building relationships within their neighborhood and city. Interviewees consistently emphasized the importance of network capacity and the current lack of coordination across CDOs as a key structural challenge in the field:
“So if you take real estate and planning as a sleeve of program delivery, and then you take home repair and social service as a second sleeve, and then you take
community engagement and neighborhood marketing [and] organizing as an approach, and then if you take a fourth sleeve around infrastructure and corridor development... If those are the four, no one’s doing the landscape analysis of who’s providing what and where and why and for whom.”
Network capacity can be understood as an organization’s ability to share knowledge, engage in networks that support collaboration, and build strong relationships with governments, funders, and other partners that provide access to resources and support.
Resilience Matrix – Network Capacity
The following questions are intended to gauge an organization’s level of interaction and collaboration with other relevant institutions:
Analysis of Survey Results – Network Capacity
Network capacity had the second-highest correlation with overall resilience, following resource capacity. The survey results showed a high correlation between resilience and collaborative ecosystems, strategic alliances, and network expansion, and moderate correlation between resilience and collaborative organizational culture.
Network expansion has the strongest correlation (r = 0.65), suggesting that organizations that are open to forming new partnerships are better able to adapt during periods of uncertainty. This demonstrates the importance of intermediary and mediating organizations who actively work to build and extend networks across sectors. Both strategic alliances (r = 0.51) and strong collaborative ecosystems (r = 0.50) show high correlations, indicating that structured partnerships and resource-sharing systems play a key role in supporting resilience.
In contrast, collaborative culture is moderately correlated (r = 0.32), suggesting that informal collaboration alone is less impactful without formal networks and mechanisms in place.
Case Study – Network Capacity
During interviews, Cleveland was frequently cited as a city with a strong foundation of network capacity and a well-developed CDO ecosystem. Two organizations have contributed significantly to developing this local network capacity: Cleveland Housing Network (CHN) and Cleveland Neighborhood Progress (CNP).
CHN is a large-scale non-profit housing developer that also acts as a mediating organization that “proactively manages the relationships between organizational actors from different sectors and fields to ensure particular outcomes.” 184 In practice, CHN connects CDOs with forprofit firms, nonprofit philanthropies, and political representatives. It also acts across multiple scales from connecting communities with local funders to connecting state-level agencies with national-level policies. This type of coordination “presents the challenge of coordinating distinctive logics, systems of value and measurement, practices, and goals,” and an organization capable of doing this “requires people who knew what mattered to actors in all of these settings without reducing the networked organizations to a single logic of practice, such as profitability or popular authority.” 185 Importantly, once these types of mediating organizations are developed in one place, they become models that can be adapted and adopted in other cities.186 CHN has expanded into Detroit as the Detroit Housing Network and implemented its development model in Rochester and Pittsburgh.187
CNP similarly acts as an intermediary between the City of Cleveland, local foundations, and the CDOs. In 2024, CNP began the Advancement and Resilience Initiative (ARI), where the money from local foundations is funneled through CNP to CDOs who can apply for these dollars by completing a review process and assessment of their organizational capacity and sustainability.
Not only does CNP coordinate funding throughout Cleveland’s community development ecosystem network, rewarding CDOs that are focused on resilience, but, as one CDO noted:
“Another thing that Cleveland Neighborhood Progress does really well and… that builds camaraderie amongst CDCs is they host several working groups.”
In addition to providing grant funding, CNP offers “training programs, leadership development, and technical support while connecting CDOs to broader networks and resources. Through long-term engagement and feedback, this approach can not only strengthen CDOs but ultimately advance the nonprofit ecosystem, aiming for sustainable resources and long-term impact through continuous collaboration.” 188
5. Political Capacity
Political capacity refers to a CDO’s “ability to credibly represent its residents [and] effectively advocate on their behalf in the larger political arena.” 189 This involves two main objectives among CDOs: (1) advocating and influencing government agencies for the benefit of themselves and their communities; and (2) establishing trust and legitimacy within the communities they serve.190 These objectives may be met through a variety of activities including community outreach and participation, relationship building with public officials, and resident education.191 While considered to be the “trickiest kind of capacity building,” political capacity is critical for CDOs as it facilitates greater access to resources and the ability to build the other types of capacity.192
Resilience Matrix – Political Capacity
The following questions are intended to gauge an organization’s ability to serve and advocate for the needs of residents:
Analysis of Survey Results – Political Capacity
Overall, analysis of survey results indicate a moderate correlation (r = 0.36) between resilience and political capacity. In this category, the importance of staffing is again highlighted with a very high correlation between resilience and having dedicated community engagement staff (r = 0.81). This indicates that as an organization’s ability to hire dedicated community engagement staff increases, their resilience increases significantly. Similarly, retaining a dedicated staff member for policy and advocacy has a high correlation (r = 0.59) with resilience. While community engagement, policy, and advocacy are important, this could indicate greater importance in staffing capabilities, as previously observed in the organizational capacity category.
Case Study – Political Capacity
Between the scholarship on resilience and interviews conducted with intermediaries and industry experts in Cleveland and New Orleans, it is clear that there are overlapping themes that define political capacity: the importance of baseline support from local government officials, and the reliability of a knowledgeable community who would, in turn, be receptive to education on formal community development efforts. A director of neighborhood development in a Cleveland CDO elaborated on the need for allies within the local government:
“It’s helpful that we have a council that really sees the value in the work that we do, so, you know, I feel like locally at least, there’s an understanding by the foundations and Council that the CDC system cannot and should not fail...Because Council, has the final say in how much our CDBG awards are. So that’s why it’s really important for CDCs to [establish] strong relationships with their council-person.”
The interviewee elaborated that because the council has a “final say” in how much CDBG funding is awarded to each community development organization, a strong relationship with representatives on the city council could secure that type of funding. Political capacity is the ability to correspond with financial decision-makers to achieve an organization’s long-term goals.
In contrast, an interviewee from New Orleans reported that community ties were strongest when deference and respect towards community members were centered in that relationship:
“[As a CDO, you are] not a proxy for the communities that you serve…being there is not a substitute for them being there right? And you being there is… because this is what you do. This is your role in the ecosystem, and they need to be there… And some [CDOs] have been really smart and have hired organizers, and have done real lasting work to stay in real authentic relationships with the citizens that they represent, the community that they really do represent, [while] some of them have not.”
Overall, community members may offer insights into hyperlocal issues, and help CDOs in a staffing capacity with their skills as organizers. However, these relationships must not be taken for granted or exploited. Nurturing community ties is critical for CDOs in establishing political legitimacy. In a broader scope, these relationships can also translate into partnerships with like-minded organizations.
Case Study – Political Capacity
The Eastside Community Network (ECN) is an established CDO in Detroit that has remained embedded in the community by empowering residents to take on leadership roles, both within ECN and in their neighborhoods.193 Their activities center around providing a variety of services, targeted at youth and family, financial empowerment, and environmental and physical wellness. ECN builds trust with the communities they serve by prioritizing members’ involvement in their governance and leadership.194
In addition to ensuring that community members serve on their board of directors, ECN designed a Neighborhood First Engagement Model, which trains community leaders in resident-led neighborhood development.195 This tool supports residents in organizing and solving neighborhood challenges through collaborative learning and advocacy.196 ECN also builds trust through the LEAP Sustainability Fellowship, a training program focused on building residents’ sustainability and community leadership capacity.197 Fellows develop community projects, learn to apply for grant funds, and lead project implementation with the help of the community.198
Ultimately, ECN’s deep and persistent commitment to engaging and empowering their community members establishes them as a trustworthy and legitimate institution to their constituents. This, paired with their direct training and education initiatives, increases their ability to attract resources to their community on Detroit’s Eastside. For example, as community leaders such as Delores Orr—president of the Cadillac Boulevard Block Club and board member of the East Village Association—began to express an interest in environmental improvements, ECN expanded its work to explore the benefits of green infrastructure.199 In response to resident priorities, ECN was able to secure funding from donors such as the Erb Family Foundation and the Kresge Foundation to plan and implement green infrastructure projects including rain gardens and solar energy systems.200
Scenario 2: Financial Innovation and Hybrid Capital
Scenario 2: Financial Innovation and Hybrid Capital
Scenario Explanation
Community development organizations are deeply embedded in communities and play a central role in shaping neighborhood stability, housing access, and local economic development in low-income communities. Between 2019 and 2021, they produced 556,000 housing units, constructed nearly 3,500 community and commercial facilities, deployed $3.24 billion in community loans annually, and supported 373,000 businesses.201 In addition to these measurable outputs, CDOs function as long-term, place-based institutions that provide essential services such as food assistance, workforce development, healthcare navigation, community organizing, and advocacy. They serve the unique needs of the neighborhoods they work within.
For decades, CDOs have relied on a funding model that includes federal programs, philanthropic grants, local government support, and limited earned income.202 This model is now under pressure due to increasing volatility in public funding and growing uncertainty around federal commitments to housing and community development programs. As a result, the ecosystem is facing instability in the funding streams that have historically supported their core operations.
Based on the findings from the Staying Rooted, Moving Forward session, this scenario is divided into three key areas:
1. A Value Proposition for Nonprofit Development
2. Mapping Financial Innovation Tools
3. Long-term Resilience Strategies
While uncertainty is threatening, it presents the opportunity to articulate the invaluable services that CDOs deliver and the chance to reimagine how the field is financed.
Value Proposition for Nonprofit Development
Because housing production is a primary activity of many CDOs, a value proposition for nonprofit housing development is one way of articulating the essential role of the community development field.203 CDOs are often compared to for-profit developers, who have the advantage of speed, scale of production, and return on capital. However, this comparison misrepresents the unique impact of CDOs and other nonprofit developers, which serve populations that private investors systematically overlook. This value proposition seeks to articulate the significant role of nonprofit developers within the housing ecosystem in order to ensure the continued provision of critical activities and services.204
Mapping Financial Innovation Tools
This section moves from articulating the value of nonprofit housing development to examining how the field can be sustainably financed in a changing funding environment. Over time, the ecosystem has developed a range of innovative financing tools that have not been fully scaled to serve the mission and operating realities of the CDOs. These include capital recycling mechanisms, community investment vehicles, and cross-sector financing models. Together, they point toward the potential for a hybrid capital approach, a blended financial strategy that creates more diversified and resilient funding structures.
Long-term Resilience Strategies
However, adopting these tools requires careful alignment with organizational capacity, technical expertise, and the access to a strong network. This transition carries real risk, including the possibility that financial returns may be prioritized over community outcomes, or that complex financing models will disproportionately benefit larger, resourced organizations. The challenge is not simply to replace declining public dollars, but to ensure that emerging financial systems strengthen community ownership, preserve equity, and sustain the mission-driven nature of the CDO ecosystem.
These financing considerations apply across the CDO ecosystem, and are particularly visible in nonprofit housing development, where housing costs, deep affordability needs, and longterm stewardship responsibilities heighten the need to align capital with the mission. In this context, articulating the value proposition for nonprofit housing is essential.
Nonprofit Housing Value Proposition
This value proposition was developed in light of the funding uncertainty that the community development field is currently facing. Under the threat of federal funding cuts to sources that heavily subsidize nonprofit housing development, CDOs and other nonprofits are being pushed to innovate their financing systems to continue housing production. At the same time, housing affordability is in a state of crisis in the U.S. and across the globe. While most income groups in the U.S. are experiencing a shortage of affordable housing, very lowincome and extremely low-income (ELI) renter and owner households are disproportionately impacted by this housing crisis.205
Currently, there is no state, metropolitan area, or county in which a full-time worker earning federal or local minimum wage can afford a modest, two-bedroom rental home at Fair Market Rent.206 Historically, nonprofit organizations have played a key role in serving these vulnerable populations. The unique strengths and advantages of nonprofit developers outlined in this value proposition make them a vital part of the overall housing ecosystem.
Setting the Stage: Affordability Today
As of 2025, half of all renter households are housing cost-burdened, spending more than 30 percent of their income on rent and utilities, and over a quarter are severely housing costburdened, spending more than half their income on rent and utilities.207 Extremely lowincome (ELI) renters, defined by the National Low Income Housing Coalition as renters whose incomes are at or below either the federal poverty guideline or 30 percent of the area median income (AMI), are disproportionately impacted by these burdens.208
This group faces the most acute shortage of affordable and available homes; nationally, there are 7.2 million affordable units for 11 million ELI renter households.209 Of the homes that are technically affordable to ELI renting households, 3.4 million units are occupied by higher income groups, leaving only 3.8 million available units for ELI renters. For every 100 ELI renter households, only 35 affordable and available homes exist. For very-low income renter households (at or below 50 percent AMI), there is a slight statistical improvement: 54 affordable and available homes exist per every 100 households.
A large majority, 74 percent, of ELI renter households are severely cost-burdened, spending over half of their income on rent and utilities.210 Of these households, 34 percent are in the
labor force, but many if not all face inadequate wages, and those who work less than full time may struggle to find enough work.211 These households are more likely to have characteristics that limit the hours they can work; they are more likely to be seniors, have a disability, be enrolled in school, or be single-adult caregivers of children or disabled individuals.212
Homeowners face similar challenges. Rising housing costs for both first-time buyers and longtime homeowners result in increased cost-burdens related to home insurance, property taxes, utilities, and routine maintenance of homes.213 The number of cost-burdened homeowners rose to 20.3 million in 2023, representing 23.7 percent of all homeowner households.214 Slightly more than half of this rise in cost-burdened homeowners was homeowners with severe cost-burdens, meaning they are paying more than half of their income on housing costs.215
Like renter households, those at the lowest income level are the most heavily impacted by these cost burdens. Almost 75 percent of the lowest-income homeowners, defined as those making less than $30,000 per year, are cost burdened, and more than half of these households are severely cost burdened.216 These households represent a small number of total homeowners—just 13 percent—but make up around 40 percent of all homeowners who are cost-burdened and 64 percent of all homeowners who are severely cost-burdened.
Nonprofit Housing Development
Nonprofit developers are one of the three major producers of housing in the U.S., alongside for-profit developers and the government.217 Nonprofits are credited with having produced or rehabilitated more than 1,252,000 units of housing between 1999 and 2005, eclipsing the number of units produced by public housing agencies.218 In 2007, nonprofits produced approximately 4.8 million units, representing one-third of the social housing sector.219
Within this broader landscape, nonprofit housing development generally includes two primary types of organizations: large regional or national nonprofit organizations and CDOs. CDOs, in particular, have been involved in affordable housing development since the 1960s, emerging in response to community needs; they are typically willing to enter markets and serve populations that the for-profit sector will not or cannot.220
Beyond housing production, nonprofit developers are uniquely positioned to provide both physical housing development and place-based services. Nonprofits are also more likely to provide special needs supportive housing, which might include wraparound services such as access to medical or social services.221 222 As a result, city initiatives in places like New York, Baltimore, Cleveland, and Atlanta have granted linchpin status to nonprofit development organizations.223
Funding for nonprofit developers, particularly CDOs, can be complex and fragmented. Currently, around 90 percent of CDOs receive at least $50,000 in federal funding, with HUD serving as the primary source of funding—particularly through the HOME and CDBG programs.224 225 However, because nonprofit developers are mission-oriented, obligated to redistribute profits into programming, and reliant on grants and donor funds, their funding is often drawn from multiple sources and can be time-intensive to secure, leading to smaller scale projects.226
For-profit developers possess significant advantages over nonprofit developers in the real estate market. Their technical expertise and broader financial resources (access to bank loans and private equity) allow them to develop more quickly and at a larger scale than nonprofit developers. Additionally, they are able to lobby government actions, allowing them to influence housing policy, tax laws, and land-use regulations.
However, these advantages are paired with certain limitations. For-profit developers are obligated to produce profits meaning that their incentives conflict with the affordability needs of low-income residents and neighborhoods. Without subsidies, the private market cannot produce or maintain an adequate amount of housing at rents that ELI renters can afford. Even when private developers use LIHTC funding, they may avoid areas with higher proportions of ELI households, in part because residents may require services that for-profit developers are not equipped to provide. 227 228 For these reasons, nonprofits fulfill demand in markets that for-profit developers are unwilling or unable to fulfill, while also providing essential supportive services for low-income populations.
Unique Strengths of Nonprofit Housing Development
Nonprofit developers possess distinct strengths that extend beyond housing production. Rooted in place-based and mission-driven work, they are uniquely positioned to respond to the complex challenges of serving vulnerable populations.
This section outlines the key advantages that differentiate nonprofit housing development, including:
1. Trust-Building with Communities
2. Provision of Wraparound Services
3. Generational Wealthbuilding for Low-Income Communities
4. Creation of Positive Spillover Effects
5. Reducing Housing Cost Burden
Each of these advantages of nonprofit development is accompanied by a case study of a CDO or intermediary that demonstrates its application in practice.
1. Trust-Building with Communities
CDOs are designed to serve the communities they operate in. In many cases, they are formed by residents themselves to address local needs and priorities. As a result, community accountability is a defining feature of their structure. This means hiring community members to serve as leadership and staff and limiting the share of government officials or public agency staff that can serve on their boards.229 The majority of CDOs also engage community members in advisory roles on projects, advocate for community priorities, and ensure their programming is culturally appropriate.230 Unlike larger development firms, CDOs are more likely to pursue smaller-scale, place-based initiatives such as infill development, mixed-use corridors, and projects that prioritize culturally responsive design and the preservation of neighborhood character.231
As a function of being nonprofits, CDOs operate under a “nondistributive constraint,” meaning they cannot distribute profits to those controlling the organization, and are instead obligated to reinvest profits into the organization’s programs or operations.232 While this constraint can limit access to capital, some researchers argue it leads nonprofits to produce higher quality outputs; because they are not incentivized to maximize profits, they are more
likely to prioritize long-term community outcomes.233 Combined with their communitycentered mission, this structure contributes to higher levels of trust between CDOs and the communities they serve.
Case Study – Grandmont Rosedale Development Corporation
The Grandmont Rosedale Development Corporation (GRDC) is a small CDO serving the Grandmont Rosedale neighborhoods of Northwest Detroit. Their primary activities include initiatives around homeownership and housing development, strategies for economic development, and a deep commitment to community engagement.234 GRDC’s dedication to centering the community is clear in their governance, as their board of directors is composed entirely of Grandmont Rosedale residents.235
As a part of their work to address housing needs, GRDC has organized a Vacant Property Task Force, a resident-led initiative targeting and addressing blight and vacancy within the Grandmont Rosedale neighborhoods.236 The task force was formed out of support for existing resident efforts to monitor and research vacancy in the neighborhood, organize community members to prevent displacement, and salvage homes under threat of foreclosure.237 GRDC has supported these endeavors in many ways, such as through the purchase and rehabilitation of deteriorating homes, and through advocacy for the beautification and programming of vacant lots.238 The Vacant Property Task Force has been featured in a study by the National Community Stabilization Trust as an example of a grassroots, residentcentered effort to address neighborhood needs and empower communities.239
This resident-centered approach to community work has also facilitated and informed GRDC’s development efforts. Their Minock Park Place project, a $20 million mixed-use development in the heart of the Grandmont Rosedale community, looks to bring both affordable senior housing and commercial space to the area.240 This project represents the first affordable senior housing development in Grandmont Rosedale, marking it as “a transformative leap toward fostering a vibrant, inclusive community.”241 With 42 affordable senior housing units and 5,400 square feet of commercial space, Minock Park Place looks to serve a “dual purpose of enhancing the local neighborhood while addressing critical housing needs.”242 Mike Randall, the executive director of GRDC, speaks to the value this development has in diversifying the available housing options in the neighborhood, serving the community’s unique needs, and retaining their support:
“Individuals might want to age in place and they may not want a large single-family house. What Minock Park Place does is provide an additional housing opportunity for them to be able to downsize and stay in the community.”243
2. Provision of Wraparound Services
In addition to providing housing for low-income households, CDOs and other nonprofit developers often provide wraparound services to more holistically support and stabilize residents. Wraparound services provide comprehensive support and personalized resources designed to aid households in addressing complex issues and challenges that might interfere with long-term housing stability.
On average, CDOs perform around nine different types of activities, which involve a mix of direct services, planning, and advocacy or organizing, in addition to development. Almost 60 percent of CDOs provide resident housing services, and between 45 and 55 percent of CDOs provide counseling services in areas like budgeting and credit management, homeownership
education, and tenant counseling.244 Other services can include rental and downpayment assistance, eviction and foreclosure prevention, and home repair and weatherization services.245 Some CDOs who provide these services can be identified through partnership with HUD as certified housing counseling professionals. These services provide residents with expert advice on navigating complex bureaucratic processes, retaining their housing during periods of financial hardship, developing skills in financial literacy, and assisting in the homebuying process.
Case Study
– U-SNAP-BAC (Detroit, MI)
U-SNAP-BAC is a longstanding CDO focused on improving access to housing in their east side Detroit neighborhood. In addition to their goal of producing affordable housing for low- and moderate-income families, U-SNAP-BAC provides key counseling services on topics like homeownership education, rental assistance, credit management, eviction prevention and financial services.246 These services have improved outcomes for the over 900 families that U-SNAP-BAC has assisted. Beyond the individual household scale, U-SNAP-BAC also services small businesses, aids in community organizing, and contributes to neighborhood beautification.247 They have provided mentorship to small business owners, assisted in developing block clubs, facilitated town hall meetings, workshops, and community forums, and supported neighborhood cleanup efforts.248
3. Reducing Housing Cost Burden
Housing cost-burden is one of the most widespread and consequential effects of housing instability, with far-reaching impacts on household financial security and economic mobility.249 For low-income households, housing cost-burden can force trade-offs between housing costs and basic needs such as food, healthcare, or education.250 On a system-level, these burdens perpetuate cycles of poverty and present significant barriers to economic mobility for low-income households.251 However, the impacts of housing burden extend beyond these groups. On a national scale, the shortage of affordable housing costs the American economy about $2 trillion a year in lower wages and productivity, restricting and slowing GDP growth.252 It is estimated that between 1964 and 2009, greater access to affordable housing would have increased GDP growth by 13.5 percent, resulting in a $1.7 trillion increase in income and an additional $8,775 in wages per worker.253 People of color and low-income households would stand to benefit the most from housing cost reductions, as they face the heaviest cost-burdens.254
Expanding access to affordable housing puts money back into the hands of residents, bolstering local economies and contributing to the local tax base. It can also act as an economic engine within neighborhoods, creating construction jobs, generating local contracting opportunities, and supporting nearby small businesses.255 As producers of affordable housing, nonprofit developers can contribute to the elimination of cost-burden for low-income households, helping to stabilize them, grow their disposable income, and strengthen their local economy.
Case Study – HousingNOLA, (New Orleans, LA)
Developed in 2014 out of a convening of residents and nonprofits focused on affordable housing, HousingNOLA is a community-led process and initiative to address housing issues in New Orleans over the next ten years.256 An interview with Andreanecia Morris, Executive Director of HousingNOLA, highlighted the widespread impact that housing has in communities. Guided by the Housing First philosophy, an approach rooted in the belief that housing is a human right and should be accessible to those in need without
meeting prerequisites or mandating participation in social service programs, HousingNOLA emphasizes housing as the most essential component of solving any other social or economic issues.257 Morris stated:
“We believe, and you can actually prove, that there isn’t a social justice issue, an economic issue, that doesn’t have a root in housing.”
The Housing First model recognizes the impacts that housing has on all aspects of life, including health outcomes, access to employment, educational success, and more.258 To address chronic housing needs in New Orleans, HousingNOLA created a ten year “Housing For All” investment plan that identifies key activities to address critical needs and their associated costs, as well as supportive policies and programs at the city, state, and federal level.259 As a part of their cost analysis, the team at HousingNOLA found that $525 million dollars would be available for local spending if cost burden was eliminated, placing dollars back in residents’ hands and allowing them to invest in their community.260
4. Generational Wealthbuilding for Low-Income Communities
Homeownership has historically been one of the most common and effective ways that households have built wealth in the U.S. However, this pathway is largely inaccessible to low-income households, who would stand to gain the most from the benefits of homeownership.261 Low-income households and households of color face significant barriers in achieving homeownership, primarily because of restricted affordable housing supply, limited access to credit, and systemic inequalities.262
Homeownership builds wealth in a variety of ways. It acts as both a forced savings mechanism and a means of accumulating equity as the home value appreciates. Both of these methods build equity, which, over time, can become a significant financial reserve for homeowners.263 This reserve can be used as collateral to secure loans or credit for significant life expenses and improvements.264 Owning a home also provides stability and protection from the fluctuation and inflation of rent prices.265
One of the fundamental factors influencing wealth accumulation is the ability of households to maintain homeownership and it is especially critical for low-income households.266 Lowincome and racialized owners have a lower probability of maintaining homeownership; only 57 percent of low-income buyers were found to own their first home five years, compared to 70 percent of high-income owners.267 Additionally, low-income and minority households are less likely to refinance for lower mortgage rates, and more likely to purchase homes in poor condition and in areas with weaker housing markets, exposing them to higher maintenance costs and lower potential for home price appreciation.268 For every dollar in net wealth accumulated by a high-income household, a low-income household amasses seven cents.269
Nonprofit developers and CDOs are more likely to maintain housing affordability and provide housing counseling services to low-income residents. CDOs can educate homeowners about the opportunities and risks associated with refinancing, which can impact wealth accumulation.270 Additionally, they can help manage the condition of the home and advise owners on when trading up is recommended.271 The interventions that CDOs provide can help stabilize low-income households to maintain homeownership in the face of financial challenges such as job loss, health problems, changes in family composition, etc.272
Case Study – People’s Housing Plus (New Orleans, LA) People’s Housing Plus (PH+), as mentioned earlier in the report, is a CDO focused on increasing homeownership among low-income families and individuals in New Orleans, with the goal of fostering multigenerational wealth and combating systemic racism.273 To realize this goal, they produce affordable housing units for sale and rental, provide housing services and counseling, and use a community land trust (CLT) to create lasting community assets.274 The units produced by People’s Housing Plus are all new construction, meeting Energy Star 3.0 standards and using high quality materials to ensure that maintenance and utility costs remain low.275
Stewardship, in the form of continuous counseling for residents, is another way PH+ encourages intergenerational wealth building for residents.276 These services, including advising around homeownership, disaster preparedness, succession and estate planning, financial coaching, and more, ensure that marginalized groups, including minority and lowincome populations, have the information, awareness, and access to resources to maintain homeownership and build wealth.277 Additionally, the CLT model that PH+ employs ensures the long-term affordability of housing developments while also allowing low-income residents to build equity.278
5. Creation of Spillover Effects
Research has found that for affordable housing to be most effective, it must be combined with other neighborhood improvements like the development of schools, commercial spaces, or green space.279 Many of the activities undertaken by CDOs contribute to neighborhood revitalization, including reducing blight, supporting small businesses, restoring public spaces, and building organizing capacity within the community.280
It has been proven that the activities of CDOs lead to neighborhood revitalization, measured through increases in residential property value.281 A 2003 study compared the residential real estate markets of neighborhoods in Indianapolis served by CDOs to neighborhoods without them.282 The primary activities of these CDOs focused on producing and rehabilitating residential properties as affordable housing in the form of rental or owner occupancy properties.283 The areas serviced by CDOs initially displayed deteriorating conditions, with median home values 7.79 percent lower than those in comparison neighborhoods, where owner occupancy rates were higher and vacancy rates were lower.284 By the conclusion of the study—conducted between 1987 and 2000—it was observed that median home values in CDO-served neighborhoods had risen to the point that no significant difference was observed in values among all neighborhoods.285
A similar 2006 study conducted in New York City compared the spillover effects of housing developments produced by both for-profit and nonprofit developers. While the study found that projects managed by both types of developers had significant positive effects, those created by nonprofits were found to be sustained over time, while those generated by forprofit developers diminished somewhat following the project’s completion.286 Increases in residential property values can strengthen a community’s tax base, expanding the local municipality’s ability to invest in public goods like infrastructure, education, and healthcare.287
Case Study – Northwest Goldberg Cares (Detroit, MI)
Northwest (NW) Goldberg Cares is a young CDO based in the west side of Detroit. Established by a lifelong resident of the neighborhood, NW Goldberg Cares strives to revitalize the neighborhood and stimulate the local real estate market.288 In addition to stabilizing
Northwest Goldberg through affordable housing development, NW Goldberg Cares focuses on creating public green spaces, hosting educational programs, and organizing community events to strengthen neighborhood ties. They emphasize the importance of programming public spaces to maintain long-term care and use of these spaces, as well as solidifying their value within the community.289 By pairing neighborhood revitalization efforts with the development of affordable housing, NW Goldberg Cares ensures long-term community stability and improves residents’ quality of life. These activities contribute to holistic improvements within the neighborhood, enhancing infrastructure and public spaces as well as strengthening community relationships.290
Conclusion
In the face of deepening affordability challenges, subsidizing nonprofit development is imperative. CDOs and other nonprofit developers provide vital services to severely underserved, vulnerable populations. The value of nonprofit development extends far beyond the production of affordable units. They foster trust within the community, provide vital housing services, and have a far reaching, multigenerational impact on both individuals and neighborhoods. CDOs and other nonprofit developers are able to address both the immediate needs of neighborhoods and the structural drivers of inequality and housing instability. Ensuring reliable funding for nonprofit development will not only support much needed housing production, but also works to advance equity and build more resilient communities for the future.
Innovative Financial Tools
In this section
- Scenario Explanation
- Nonprofit Housing Value Proposition
- Innovative Financial Tools
- Social Investment Tools
- Capital Recycling Tools
- Outcome Based Models
- Tax Incentive Based Tools
- Community Ownership Models
- Systematic Strategies for CDO Financial Resilience
Innovative Financial Tools
While the value of nonprofit housing production is indisputable, CDOs increasingly require new and innovative financial tools to fund both real estate development and services, allowing them to fulfill their critical role in the affordable housing ecosystem. This section introduces thirteen financial tools identified through interviews and research for their potential scalability and applicability across the diverse community development ecosystem. These tools will enable CDOs to access the financial instruments needed to maintain and strengthen their critical role in producing sustainable affordable housing and providing resident services. These tools are intended to complement and expand the financing ecosystem that supports nonprofit housing development. These tools are organized into five key groups:
A. Social Investment Tools
1. Recoverable Grants
2. Capacity Aggregator Model
3. General Operating Support Fund
B. Capital Recycling Tools
4. Program Related investments
5. Revolving Loan Fund
6. Endowment Fund
C. Outcome Based Models
7. Value Based Payment Method
8. Fee Based Payment Method
9. Pay for Success
D. Tax Incentive Based Tools
10. Underused Housing Tax
11. Tax Credit Program
E. Community Ownership Models
12. Community Investment Vehicles
13. Community Land Trust
To support consistent analysis across tools, a comparative performance framework was developed based on insights from interviews, secondary literature, and case study evidence. Each tool is evaluated across four dimensions: the presence of philanthropic capital, the involvement of city-level institutions, the range of applicability across CDO activities, and the certainty of success.
‘Presence of philanthropy’ refers to the degree to which philanthropic foundations and mission-driven funders are essential in financing a tool. A high rating indicates that philanthropic capital is a primary input. A low rating indicates that the tool can operate through public, institutional, or market-based capital with low philanthropic involvement.
‘Presence of city institution’ refers to the degree to which municipal governments and public agencies are involved in administering, enabling, or co-financing a tool. A high rating indicates that city institutions are essential actors without whom the tool cannot function effectively. A low rating indicates that the government plays a supporting role.
‘Range of applicability’ refers to the breadth of programmatic and operational contexts in which a financial tool can be applied, including whether it is best suited for specific-project level interventions, broader organizational operations, or different stages of development activities within CDOs. A high rating indicates adaptability across diverse contexts. A low rating indicates that the tool is suited to specific sectors, project types, or conditions.
‘Certainty of success’ reflects the degree of implementation and practical validation of a tool within the field. A high rating indicates that the tool has an established track record and produces predictable outcomes when organizational capacity is sufficient. A low rating signals that the tool remains context-dependent, with outcomes that vary significantly based on implementation design, organizational capacity, and external conditions.
Together, these dimensions provide a structured means of assessing both the scalability and feasibility of each financial instrument within the community development ecosystem.
Social Investment Tools
Social investment tools use philanthropic or mission-driven funding to support organizations in ways that help them stay financially stable while also creating social benefits. These instruments provide flexible, early-stage funding that strengthens organizational capacity, supports experimentation, and enables innovation.291 By reducing the rigidity of traditional grant structures, these tools allow CDOs to respond to emerging needs, stabilize operations, and invest in long-term institutional development while advancing clearly defined social outcomes.292
The three Social Investment Tools studied are :
- Recoverable Grants
- Capacity Aggregator Model
- General Operating Support Fund
1. Recoverable Grants
Recoverable grants are a hybrid financing tool that combine elements of grants and loans. Foundations provide upfront capital to nonprofits or CDOs with the possibility of no repayment, partial repayment, or full repayment under predefined conditions. Unlike a traditional grant, repayment is expected only if the funded project reaches agreed milestones such as revenue generation, refinancing, or other liquidity milestones.293 294 If outcomes such as revenue generation, occupancy targets, or refinancing are achieved, the recipient repays part or all of the grant. If these outcomes are not met, repayment is waived without creating a debt burden.295
This structure allows funders to support early-stage or higher-risk projects that wouldn’t normally qualify for traditional loans.296 These funds are often used for pre-development activities, pilot programs, acquisition support, or short-term financing gaps where traditional debt is difficult to secure.297 If repaid, the funds can be redeployed into new grants, enabling a continuous cycle of reinvestment in community development initiatives.298 For foundations, these grants also count toward IRS-required five percent annual charitable payout requirements.299
Unlike Program-Related Investments (PRIs), which are structured as a loan or equity investments with expected repayment, recoverable grants begin as grants rather than investments and only convert into repayable obligations if specified conditions are met.300 This approach preserves philanthropic intent while providing a mechanism for longer-term capital reuse.
Role of CDOs – Recoverable Grants
CDOs play a key role in putting recoverable grants into action by using flexible funding to carry out projects in their communities. They typically deploy funds to meet specific community needs such as land acquisitions, community engagement, or pilot interventions. Because repayment is contingent on project success, CDOs also assume responsibility for milestone tracking, reporting, and financial planning. Their institutional capacity significantly influences whether repayment is achievable.
Barriers to Adoption – Recoverable Grants
The use of recoverable grants is limited by a range of structural, operational, knowledgebased, and risk-related barriers. At the structural level, the absence of standardized legal or financial frameworks make implementation and replication difficult, as they require customized structuring across institutions and contexts.301 Operationally, managing repayment, tracking milestones, and recycling funds requires strong financial systems and reporting capacity both from the funders and CDOs. Not all CDOs have revenue-generating models or the financial infrastructure needed to support repayment conditions. Knowledge gaps on the part of both funders and CDOs also constrain the use of recoverable grants because they are unfamiliar with the instrument or lack the technical expertise to design and implement it. Finally, funders may be wary of the risk of deploying grant money when repayment is not guaranteed.
Performance Matrix – Recoverable Grants
Recoverable grants are primarily funded by philanthropic foundations, resulting in a strong philanthropic presence. Municipal involvement is limited and typically restricted to indirect support, meaning there is low presence of city institutions. The tool has a high range of applicability, as it can support a range of community development work, from early-stage planning and land acquisition to filling short-term financing gaps and backing revenuegenerating projects. However, certainty of success is low because repayment is uncertain, organizational capacity varies, and there is no standardized implementation model. Overall, recoverable grants are a promising, but still evolving, tool for supporting CDO-led development.
Case Study – Recoverable Grants
New Roots Community Farm (Fayetteville, WV)
New Roots Community Farm (NRCF) is a community land trust and social enterprise in Fayetteville, West Virginia. It operates as a community-owned agricultural resource center focused on food sovereignty, equitable food access, and co-operative economic development that supports living-wage jobs.302 Invest Appalachia, through their Catalytic Fund, provided a recoverable grant to purchase three pieces of equipment for its rural grocery operations.303 This investment strengthened NCRF’s infrastructure and expanded its capacity to distribute fresh, nutrient-dense, and culturally appropriate seasonal foods in the New River Gorge region. The grant improved food access for low-income and food-insecure residents by enhancing participation in SNAP, SNAP Stretch, and the Farmers Market Nutrition Program (FMNP). These programs allowed NRCF to increase the affordability and accessibility of healthy food while reinforcing local food systems.304
Through its Catalytic Fund, Invest Appalachia has deployed recoverable grants to support community-driven activities including, small business development, agricultural enterprises, and local infrastructure projects. The organization first deployed around $1 million in catalytic capital to test and support community enterprises, and later expanded its model by closing a $35 million community-first impact investment fund to scale this work.305 306 Invest Appalachia demonstrates how flexible, mission-driven capital can be used, from experimental funding to institutionalised tools for sustained community economic development.
2. Capacity Aggregator Model
The capacity aggregator model is a capacity-building and grantmaking approach in which an intermediary organization pools funding from philanthropic and public sources into a shared fund and redistributes it to CDOs. These funds are typically paired with technical assistance and are used to provide flexible capital for general operating support, capacity building, programming, and neighborhood-specific needs.307
The model is designed to address uneven access to capacity-building resources, particularly in jurisdictions with limited internal planning or administrative support. Examples like Cleveland Neighborhood Progress’s Advancement and Resilience Initiative (ARI) illustrate how aggregate funds can be used to strengthen CDO operations, offering technical assistance and resources to improve, adapt, and sustain operations through environmental, economic, or social challenges.308
The capacity aggregator model is one approach to the broader mechanism of pooled funding, where an intermediary receives funding from a variety of sources and then reallocates it to CDOs through a combination of grants and technical assistance.
Role of CDOs – Capacity Aggregator Model
Within the capacity aggregator model, CDOs function as both recipients of pooled funding and as active contributors to the design and implementation of the funding system. As recipients, they access capital through a single intermediary rather than navigating multiple financing sources, reducing the administrative burden and transaction costs. This support often includes technical assistance and capacity building resources that allow organizations to use the funding effectively. When CDOs participate in shaping the system, they can provide strategic direction and advocate for systemic change.
Barriers
to Adoption – Capacity Aggregator Model
Replicating the capacity aggregator model requires a strong and trusted intermediary that has existing relationships with CDOs and the convening capacity to co-create a shared assessment framework. The model also depends on strong investment capacity, either from a governing body or a coordinated multi-funder philanthropic system, which can be difficult to assemble in cities where both institutional presence and philanthropy are weak. Furthermore, smaller CDOs with limited staff capacity may struggle with the self-assessment process, and the unrestricted nature of grants can create accountability challenges for funders accustomed to program-specific reporting.
Performance Matrix – Capacity Aggregator Model
The Capacity Aggregator model relies heavily on philanthropic foundations and municipal funding, resulting in a moderate to high presence of both philanthropy and city institutions. It relies on both of these financing sources to pool capital into an intermediary fund that supports CDO capacity—and in some cases, the city governments act as the intermediary.
The model has a high range of applicability as it provides flexible funding that can be used across a wide range of CDO activities, including overhead costs, staffing, community engagement, and programming. However, the certainty of success is low, as the model depends on at least one stable funding source, which many cities lack. While early implementation in places like Cleveland and Rhode Island show promise, the model is still in an early pilot phase.
Case Studies – Capacity Aggregator Model Advancement and Resilience Initiative (Cleveland,
OH)
The Advancement and Resilience Initiative (ARI), launched by Cleveland Neighborhood Progress (CNP) in 2023, demonstrates how the capacity aggregator model operates in practice. Through ARI, CNP functions as an intermediary, pooling philanthropic and public funding and redistributing it to CDOs in the form of flexible grants, technical assistance, and capacity-building support.
CDOs act as both recipients and active participants. Rather than navigating multiple funding sources, they engage with a single intermediary that allocates resources based on organizational need and performance. This structure enables CDOs to deploy funding across a wide range of activities—including housing programs, small business support, and neighborhood engagement—while also strengthening internal capacity and long-term sustainability.
In FY 2025, CNP invested $2 million across 17 Cleveland CDOs, supporting outcomes like housing stabilization, home repair investments, and small business assistance. Beyond program delivery, CDOs also contributed to broader system change. Notably, Cleveland City Council passed Ordinance 113-2025, which authorized the use of non-federally sourced city funding for five community development functions: community engagement, housing and economic development, events and promotion, neighborhood planning, and partnerships. Because local dollars carry few federal restrictions, this shift gives CDOs greater flexibility in how they deploy city contracts to meet neighborhood needs.309 310
Enterprise Community Partners CDO and ECDO Fund (Detroit,
MI)
In 2020, Enterprise Community Partners established the Community Development Organization (CDO) Fund and the Elevating Community Development Organization (ECDO) Fund (aimed at emerging CDOs) to support community development in the city. In this model, Enterprise acts as an intermediary, pooling philanthropic capital from multiple major foundations and redistributing it to CDOs through flexible operating grants, technical assistance, and cohort-based support.311
CDOs engage a single funding platform rather than multiple individual funders, reducing administrative burden and competition for resources. They use flexible, multi-year funding to support a wide range of organizational needs, including staffing, internal systems, and program delivery, while also participating in peer learning cohorts, technical assistance, and cross-city exchanges. The ECDO Fund further demonstrates how the model can be tailored to different organizational scales, providing targeted support to smaller, emerging CDOs.
Between 2020 and 2022, the CDO Fund deployed $12.2 million to 25 organizations, while the ECDO Fund provided $1.8 million to a smaller cohort of emerging CDOs. Together, the funds demonstrate how pooled philanthropic investment, delivered through an intermediary, can strengthen organizational capacity, foster collaboration, and support the long-term
sustainability of CDOs within a shared ecosystem.312 Recognizing the immense and positive impact both the CDO and ECDO Funds had, ECP looked to expand the initiatives into a second phase, securing additional funding from both existing and new philanthropic partners alike. As a result, Phase II represented not only the continuation of these critical support systems for CDOs, but also an expansion of them, with $17.4 million in funding for the CDO Fund and $4.6 million in funding for the ECDO Fund.313
3. General Operating Support Fund
General Operating Support (GOS) refers to unrestricted grant funding provided to nonprofit organizations to support overall organizational operations rather than a specific program or project. Nonprofits can use this general operating support to address urgent and emerging issues, boost salaries and benefits, invest in technology and other infrastructure, strengthen communications and fundraising efforts, and meet other operational needs.314 It is one of the clearest ways to support organizational health.315
GOS is often delivered through unrestricted grants from philanthropic funders, allowing CDOs significant discretion in how funds are allocated. Foundations offering GOS often establish internal practices such as educating boards on flexible funding, benchmarking peer funders, reserving portions of grant budgets for operating support, and explicitly inviting grantees to identify operational needs. CDOs typically pursue GOS based on alignment with funder priorities and organizational needs. CDO-funder alignment can increase an organization’s chances of obtaining funding.316
Role of CDOs – General Operating Support Fund
CDOs are both the primary advocates for and intended beneficiaries of GOS programs. The flexible, multi-year support enables CDCs to continue to deliver core services in a way that advances equity, including enabling local residents and businesses to create generational wealth, build and preserve affordable homes, advance economic opportunity by supporting and growing local businesses and commercial corridors, create safe, clean, and green streetscapes, and elevate community voices.317 CDOs also play a role in designing GOS program criteria, holding funders accountable for follow-through, and reporting on organizational and community impact over time.
Barriers to Adoption – General Operating Support Fund
Despite the advantages that GOS brings to a nonprofit’s work, there are still misconceptions about this type of funding. These misconceptions continue to limit the amount of nonprogram related support that grantmakers are willing to provide, perpetuating chronic underinvestment in nonprofit infrastructure, capacity, and staff. Many government funders and foundations are more comfortable funding specific programs than organizational operations, viewing overhead costs with suspicion.
Performance Matrix – General Operating Support Fund
GOS is primarily driven by private foundations, community foundations, and philanthropic trusts that provide grant funding, resulting in a high presence of philanthropy. Municipal involvement is limited and not structurally required, leading to a weak presence of city institutions, though some local governments may offer support in certain cases. GOS has a high range of applicability, as funds are designed to be flexible and a CDO can use the funding for a range of organizational needs, rather than being bound to a specific project. Despite its widespread use within the nonprofit sector, the certainty of success is low. While GOS is a widely used philanthropic mechanism, access from any individual CDO’s perspective remains highly uncertain as funding is competitive, eligibility criteria vary significantly across funders, and award decisions depend heavily on funder priorities, and strategic alignment. As a result, CDO may rely on GOS in principle while finding it difficult to count on as a stable or predictable source.318
Case Study – General Operating Support Fund
Community Capacity Building Fund (Philadelphia, PA) Philadelphia’s Community Capacity Building Fund (CCBF) is a formal, city-funded GOS fund for community development organizations. It provides multi-year general operating support to qualified CDOs to build their capacity to serve residents , thus creating a more equitable city.319 The program provides multi-year, flexible support amounting to $125,000 per year to qualified CDOs.320 Rather than restricting dollars, the GOS model trusts CDOs to allocate resources according to what their communities actually need.
In Philadelphia’s FY 2026 budget,321 the city committed $3.5 million in flexible funding for Philadelphia’s CDOs, marking the first formal institutionalization of GOS for CDOs at the local government level in the city’s history. This funding was a critical first step but remained far below PACDC’s full ask of over $7.5 million annually.322 As a testimony to city officials, PACDC documented that Philadelphia CDOs have contributed billions to the local economy over two decades—yet many had been forced to rely on tightly constrained programmatic funding that failed to cover organizational overhead or respond to evolving community needs. The GOS model directly addresses this structural funding gap. Reducing the power imbalance between grantmaker and grantee by allowing nonprofits to devise their own solutions based on their vast experience in the community signals greater trust between grantmaker and grantee.323
Capital Recycling Tools
Capital recycling tools are designed to reuse and reinvest funds over time, maximizing the impact of initial capital. Instruments like program related investments, revolving funds, and endowment funds enable capital to flow back to the original funder or financing pool, where it can be redeployed for new initiatives.324 325
The three capital recycling tools studied are:
- Program Related Investment
- Revolving Loan Fund
- Endowment Fund
4. Program Related Investments (PRI)
Program Related Investment (PRI) is a financial instrument used by foundations and CDFIs to advance charitable and community development goals. Unlike traditional grants, PRIs are structured as low-interest loans, equity investments, or loan guarantees, with an expectation of repayment, usually at below market returns.326 Unlike recoverable grants, PRI carries a formal expectation of capital repayment with below market interest as part of its financial structure.
PRI provides upfront capital to nonprofit organizations with low interest rates, longer repayment periods, and patient capital aligned with long term social outcomes.327 Since repayment is expected, the returned fund can be reinvested into future projects, creating a pool of recyclable capital. Under IRS regulations, PRIs qualify toward the five percent annual charitable payout requirements for private charitable foundations if they meet three conditions: (1) they must serve a primary charitable purpose; (2) they must have no significant purpose of income generation; and (3) the investment cannot support political or lobbying activities.328 PRIs are often used to support affordable housing development, community facilities, small businesses financing, health-related initiatives, and other revenue-generating or asset based projects where some level of financial returns or repayment is feasible.
Role of CDOs – Program Related Investment
CDOs play an important role in the PRI ecosystem by translating philanthropic capital into community-level outcomes. They help identify viable projects, structure proposals to meet both the financial and impact requirements, and manage implementation on the ground.329 Projects under PRI help CDOs signal credibility to other investors, catalyzing additional capital investment.330
Barriers to Adoption – Program Related Investment
The adoption of PRI has remained limited due to legal complexity, high transaction cost, and perceived financial risk. The process of structuring, documenting, and managing PRIs is an intensive process, making transaction cost a significant burden. The expertise required to design and oversee these investments can often be too complex and resource intensive for many CDOs. In addition, limited standardized performance data makes it difficult for funders to evaluate outcomes and scale their use. Due to concerns around financial loss or reputational risk, foundations avoid investing in PRIs.331
Performance Matrix – Program Related Investment
PRI requires a high philanthropic presence, as foundations are the main providers of the capital. City institutions have a low presence in PRI deployment. City support typically occurrs indirectly through partnerships or supportive policy mechanisms rather than direct financing. Its applicability is high, as it can support a range of projects such as housing, health, small business development, and food systems, but is best suited to projects with identifiable revenue streams or repayment capacity. However, certainty of success is low as outcome depends on project performance and organizational capacity. This is a promising practice for CDOs that are able to meet repayment structures.
Case Study – Program Related Investment
Affordable Housing Leverage Fund (Detroit, MI)
The Affordable Housing Leverage Fund (AHLF) is a partnership between the City of Detroit Housing & Revitalization Department, the Local Initiatives Support Corporation (LISC), and the Michigan State Housing Development Authority (MSHDA) to provide affordable housing developers and owners with streamlined access to financial tools that are specifically designed to address housing challenges in Detroit neighborhoods. Developers in Detroit face a persistent financing gap between available public and private funding sources, construction and rehabilitation costs, and limited returns from housing priced for lowincome residents. AHLF addresses this gap by providing finance that reduces the risk for investors and enables both preservation of existing affordable housing and development of new units.332
Through this program, the fund mobilized approximately $250 million in total housing investment. This capital supported the preservation of around 10,000 affordable housing units and the creation of approximately 2,000 new units across Detroit. The intervention also strengthened lender confidence in affordable housing markets by reducing the financial risk with a philanthropic backstop.333
5. Revolving Loan Fund
A Revolving Loan Fund (RLF) is a self-replenishing pool of capital that uses repayments of principal and interest from prior loans to make new loans, enabling an initial capital injection to circulate continuously through a community. Revolving loan funds, which rely on the repayment of principal and interest to replenish the funds that made the loans, can reduce dependence on ongoing grant support.334 The Greater New Orleans Foundation (GNOF) has employed the revolving fund concept as a cornerstone of its community revitalization strategy in the Gulf South region.
In the RLF model, initial capital from government, philanthropic, or private sources is deployed through below-market loans to qualifying borrowers—typically CDOs, small businesses, or affordable housing developers. As borrowers repay principal and interest, those dollars flow back into the fund and are lent again to new borrowers, creating a sustainable cycle of community investment. A single infusion of capital multiplies its impact over time.
Role of CDOs – Revolving Loan Fund
CDOs serve as both the recipients and administrators of revolving loan funds. As borrowers, they access below-market capital to finance affordable housing development, commercial corridor revitalization, and predevelopment costs that would otherwise be inaccessible through conventional financing. As fund administrators, CDOs with sufficient capacity can manage revolving loan programs directly—screening borrowers, setting loan terms, conducting underwriting, and reinvesting repayments.
Barriers to Adoption – Revolving Loan Fund
The feasibility of a revolving loan fund may remain limited until a sufficient portion of the existing loan balance is repaid,335 meaning an RLF’s impact is constrained in its early years and is dependent on borrower repayment performance. Losses from defaults can deplete the fund’s capital base without a mechanism for recapitalization. The general administration of launching and managing an RLF requires underwriting expertise, legal infrastructure, and compliance systems that may be burdensome to even well-established lenders. Additionally, in the distressed markets where CDOs primarily operate, conventional underwriting
standards may disqualify many creditworthy community borrowers, and default risk is higher, making it difficult for RLFs to remain financially sustainable while maintaining a communityfirst lending philosophy.
Performance Matrix – Revolving Loan Fund
Revolving loan funds are typically capitalized through a mix of philanthropic, public, and private institutional funding, resulting in a moderate presence of both philanthropy and city institutions. RLFs can support a range of activities, including acquisition, construction, façade and landscape improvements, and equipment purchases. However, RLFs designed around defined purposes (e.g. affordable housing, small business lending), and funds are restricted to that designated use. This means a single RLF cannot be deployed flexibly across the full spectrum of community development needs, thus limiting the range of applicability.336 Although RLFs are an established financing tool, they have not been widely used in the field of community development as their success depends heavily on legislative frameworks, funder support, and local context.
Case Study – Revolving Loan Fund
Urban Redevelopment Authority of Pittsburgh (Pittsburg, PA)
The Urban Redevelopment Authority (URA) of Pittsburgh operates several Revolving Loan Fund (RLF) programs through its Center for Innovation and Entrepreneurship (CIE), demonstrating how RLFs function as flexible, gap-financing tools for community development. Capitalized through a mix of federal, state, and local public funds, these RLFs provide loans that complement private financing, helping small and medium-sized businesses and commercial development projects access capital.
Within this model, CDOs play a key intermediary role. They help identify eligible borrowers, support project development, and connect businesses to RLF financing as part of broader neighborhood revitalization strategies. Eligible borrowers can access loans ranging from $5,000 to $500,000 at below market fixed rates, working capital, equipment. This is precisely the type of capital needs that CDO-connected businesses commonly face.337 CDOs additionally assist with technical support—such as business planning or navigating application requirements—ensuring that borrowers can meet underwriting standards and successfully deploy funds.
RLFs operate as self-replenishing capital pools, with loan repayments recycled into future lending. This structure allows CDOs and their partners to sustain long-term investment in local economies while maintaining flexibility in how funds are used, including for real estate development, equipment, or working capital. Between 2014 and 2016, URA’s CIE issued 69 loans, leveraging over $51 million in total project costs and supporting 559 jobs. This case highlights how RLFs enable CDOs to expand access to capital, reduce risk for private lenders, and drive local economic development outcomes.338
6. Endowment Fund
An endowment fund is a permanent pool of invested capital held by a nonprofit, where the principal is preserved and only investment returns are used to support organizational activities. While most common among large institutions like universities and hospitals, endowments can also serve as a long-term financial strategy for CDOs, providing a stable and self-sustaining revenue stream.339
Endowments generate ongoing funding by investing an initial capital gift, typically from donors, foundations, or fundraising efforts. The organization then sets an annual rate, typically around four or five percent, and distribute those returns for organizational use while the principle remains intact and grows over time.340 Community foundations serve as valuable partners in creating and managing endowments, offering expertise, administrative support, and deep knowledge of local needs.341
In periods of financial austerity, endowments may also offer a way to preserve resources within the field. For example, assets from dissolving CDOs could potentially be transferred into a shared endowment, allowing those funds to continue supporting community development over the long term. This can be an area for further research as a way to ensure that the funding generated over decades remains within the CDO ecosystem over time.
Role of CDOs – Endowment Fund
CDOs must take a proactive, strategic position to build an endowment fund—identifying donor prospects, cultivating planned giving relationships, and partnering with community foundations that can steward the assets and provide investment management. This source of funding can be invaluable in periods of economic uncertainty when other support is withdrawn. During periods of economic prosperity, an endowment can provide funding to act as seed money for developing new programs and services.342 CDOs that successfully build endowments are better positioned to weather funding disruptions, invest in staff development, and pursue long-term community impact, independent of funder priorities.
Barriers to Adoption – Endowment Fund
Building an Endowment Fund requires a level of organizational maturity, donor trust, and development capacity that many CDOs, particularly smaller, community-based organizations, do not possess. Building a meaningful endowment large enough to generate substantial annual income takes years or even decades of sustained fundraising. Governance and administrative considerations can also pose challenges. For example, what are the ongoing costs of managing the endowment, whether internally or through an external fund manager? And is the board comfortable restricting the use of the principal, or should there be greater flexibility in how annual returns are allocated?
Furthermore, CDOs serving low-income communities often operate in social networks where major donors are less concentrated, making it difficult to seed an endowment fund. Tension also exists between the case for spending on immediate community needs versus setting aside funds for future organizational sustainability .
Performance Matrix – Endowment Fund
Endowment Funds are built almost exclusively with philanthropic capital, often in the form of long-term “legacy gifts” aimed at funding an organization’s mission in perpetuity. They operate entirely within the nonprofit and private investment sectors, requiring no municipal presence or involvement. In most cases, endowment payouts are unrestricted, unless limited by the donor, allowing CDOs to allocate annual returns for any organizational priorities. This gives the tool a wide range of applicability, despite restrictions on accessing capital. However, communities with fewer major donors or weaker philanthropic networks have limited capacity to build endowments, raising significant equity concerns about access to models. Overall, Endowment Funds have a high certainty of success as they are well-established and widely used mechanisms for long-term sustainability. However, some approaches to forming endowments, like transferring the assets of organizations that are closing towards endowments, are more experimental and depend on strong institutional facilitation.
The Ford Foundation and the Bedford Stuyvesant Restoration Corporation (BSRC) demonstrate how endowment-based grantmaking can function as a transition mechanism for mature CDOs. Through a series of endowment grants, the Ford Foundation provided BSRC with the capital to not only to support operations but to build its own endowment, establishing a permanent financial asset.
In the early 1980s, the Ford Foundation identified BSRC as having reached a benchmark in its growth and development, making it a prime candidate for a transition from annual dependency to long-term financial sustainability. The primary mechanism used by the Ford Foundation to support BSRC was the “tie-off” endowment grant designed to end the Ford Foundation’s long-term general operating support by providing a large, one-time endowment, creating a permanent financial asset for BSRC.343
While the initial endowment provided the principal, BSRC also used endowment-related grants to ensure its physical and financial assets were managed effectively. Between 1992 and 1994, BSRC was awarded $150,000 for specific preparatory and management activities to implement a capital improvement plan and develop a fundraising program. These endowment grants provided BSRC with a predictable stream of income, allowing the CDO greater flexibility in pursuing its goals, and most importantly, allowed the leadership to focus on long-term program objectives, without the constant pressure of fundraising.344
Outcome Based Tools
Outcome based tools link financial disbursement, payments, or earned revenue directly to the achievement of predefined results or performance metrics. Instruments such as valuebased payment systems, fee-based payment models, and pay for success structures shift the focus from inputs and activities to measurable outcomes such as improved health, housing stability, or employment. This approach enhances accountability, encourages efficiency, and ensures that funding supports a result-driven program.345
The three outcome-based tools studied are:
- Value Based Payment Method
- Fee Based Payment Method
- Pay for Success
7.
Value Based Payment Method
Value based payment (VBP) is a financing approach in healthcare where payments are tied to patient outcomes rather than the volume of services delivered. VBP shifts the focus from treatment to prevention. Payments are linked to measurable outcomes such as reduced hospitalizations, improved patient health, and lower overall healthcare costs.346 VBP creates a pathway for housing and other social interventions to receive health-sector funding when they demonstrate measurable improvements in health outcomes and reductions in overall costs.347
VBP operates through an outcome-linked financing cycle. Capital is deployed upfront to finance things like weatherization, structural repairs, or mold remediation, and improvements are implemented in targeted households identified as frequent healthcare users.348 Outcomes are tracked over time using metrics such as ER visits, number of reduced hospitalizations cases, and other related parameters. Outcome payments are made to providers and community partners based on verified results.349 The initial capital invested is then repaid from the realized cost savings, creating a self-sustaining financing cycle.350
Role of CDOs – Value Based Payment Method
CDO serves as a critical intermediary in VBP models, bridging the gap between health sector resources and community level action. CDOs help identify and prioritize high risk households where housing interventions will generate the most impact. They lead the coordination and manage the intervention along with healthcare providers and funding organizations.351 CDOs are contracted and paid by banks, foundations, and government sources and use it to carry out the work in the community.352
Barriers
to Adoption – Value Based Payment Method
Despite its potential, VBP faces several implementation challenges. The mechanism requires long-term tracking of data to measure whether health outcomes and associated cost savings are sustained over time. Because health outcomes are influenced by multiple factors, isolating the impact of a single housing or social intervention on a specific health result remains difficult. As these models operate across multiple sectors including housing, healthcare, and finance, successful implementation demands substantial administrative capacity, specialized expertise, and sustained coordination among diverse institutional partners. Limited administration capacity in smaller organizations makes the intensive monitoring, reporting, and contracting requirements of the VBP model difficult to sustain.353
Performance Matrix – Value Based Payment Method
VBP requires high philanthropic participation, particularly in pilot and innovation funding, but it is primarily driven by healthcare payers and private insurers rather than foundations alone. Philanthropy plays a key role in financing early-stage demonstration projects, providing upfront capital. City institutions have a low presence, although the public health department may support implementation and coordination. The range of applicability is low as VBP has been deployed in healthcare settings, with application to housing and community development limited to interventions such as weatherization, structural repairs, or mold remediation. The certainty of success is low as outcomes vary widely depending on the data quality, implementation capacity, and the strength of cross-sector coordination. Successful implementation demands specialized expertise in data systems, contract structuring, and impact measurement.
Case Study – Value Based Payment Method
New York Healthy Homes Collaborative (New York City, NY)
The New York Healthy Homes Collaborative is a cross sector partnership launched in December 2021 to reduce asthma related emergency visits among 850 Medicaid enrolled children living in poor housing conditions. The initiative brought together seven core partner organizations, each playing a distinct role in financing, service delivery and program management.
Northern Trust, as the senior investor, and the Green & Healthy Homes Initiative (GHHI), as the subordinate investor, provided $4.75 million in upfront working capital to fund four years of services. Repayment is based entirely on realized Medicaid cost savings, meaning investors assume the financial risk upfront. Through VBP contracts, Affinity by Molina Healthcare uses Medicaid funds for non-clinical, home-based asthma interventions, such as mold removal, pest management, plumbing repairs, weatherization, and air quality improvements. AIRnyc, a community organization with a mission to improve the health and wellbeing of underresourced communities in NYC, and the Association for Energy Affordability implemented these services through home visits, case management, environmental assessments, remediation, and follow-up support.354 The program measured a reduction in asthma related ER visits, hospital admissions, and overall healthcare cost for participating households. Verified savings were then used to repay investors with a modest return, creating a sustainable financing model.355 356
AIRnyc functioned as the lead community-based service provider generating revenue through contracted service delivery model.357 This model enabled AIRnyc to transition its asthma prevention programming away from short-term, grant dependent funding cycles towards a more stable and recurring operating revenue stream anchored in Medicaid supported service delivery. AIRnyc reported a 40 percent reduction in hospitalisation and a 43 percent reduction in emergency room visits among participating households.358
This case illustrates the kind of role a CDO could play within outcome-driven financing structures. AIRnyc’s early neighborhood based work in Harlem of delivering targeted environmental health interventions, coordinating home-based services, and operating through value-based payment (VBP) contracts shows how a place-based organization could integrate health programming into broader community development strategies, linking housing remediation to measurable health outcomes and long-term revenue stability.359
8. Fee Based Payment Method
A fee based payment method is a revenue model in which CDOs generate income by providing services to the community in exchange for direct compensation from funders such as government agencies, philanthropic institutions, or intermediaries.360 CDOs are paid for delivering defined outputs like housing counseling, homeownership education, and financial coaching rather than relying solely on grants.361
Under this model, a CDO identifies a community need and develops a structured service program to address specific outcomes related to housing stability, health, or financial well-being. A contract is established between a funder and a CDO, including the scope of work, performance indicators, reporting requirements, and repayment terms.362 Payments are typically structured around services units, milestones, or outcomes achieved, and are disbursed upon completion in stages tied to verified output, reinforcing accountability and measurable impact.363 Government agencies like HUD-certified housing counselling systems use this structure to standardize service delivery across providers.364
Role of CDO – Fee Based Payment Method
CDOs function as frontline service providers and implementation partners within the fee based system. They are responsible for delivering services, tracking outcomes, and ensuring compliance with contractual obligations. Their proximity to communities enables them to deliver targeted interventions such as foreclosure prevention, first-time home buyer counselling, and financial education that larger institutions may not be able to provide effectively.365
Barriers to Adoption – Fee Based Payment Method
Many CDOS lack the financial systems, reporting infrastructure, and compliance capacity required to manage contract-based funding effectively. These contracts have high administrative burdens and inconsistent payment timelines, creating cash flow challenges for smaller organizations. Funders may also prioritize short-term measurable outputs over long-term community change, constraining the types of interventions CDOs can pursue. There is a persistent risk that reliance on performance based contracts can shift organizational priorities toward funder defined metrics, leading to mission drift.366
Performance Matrix – Fee Based Payment Method
The fee based model performs best where both philanthropic and institutional presence are high. Philanthropy provides initial capital and supports contract formation, while
government and city institutions create a stable demand and regulatory framework for service delivery. The range of applicability is high, as it can support a broad range of clearly defined service areas including housing counseling, education programs, and community services across varying organizational contexts. Certainty of success is high where contracts are tied to defined outputs and measurable performance, which improves accountability and predictability. This is a promising practice for CDOs that are able to meet outcomes that depend on organizational capacity.
Case Study – Fee Based Payment Method
Wealth Opportunity Realized Through Homeownership (WORTH) (Virginia)
In 2022, Wells Fargo Foundation awarded $7.5 million to LISC Virginia, to implement the Wealth Opportunity Realized Through Homeownership (WORTH) program, an initiative aimed at reducing racial disparities in homeownership.367 LISC Virginia coordinated with a regional network of CDOs to deliver housing counseling and down payment assistance to BIPOC households in underserved communities.
South Community Development and Housing Corporation enrolled 72 pre-purchase counseling clients shortly after the program’s launch with 11 households advancing toward mortgage readiness.368 The program tracked participants from enrollment to homeownership readiness, focusing on measurable outcomes. This case demonstrates that CDOs with strong coordination capacity, data tracking systems, and partner networks are better positioned to succeed under fee based payment models. This structure allowed CDOs to build earned income streams tied to service delivery, strengthening operational capacity, and enabling them to scale housing counseling services while maintaining accountability to measurable outcomes.
9. Pay for Success
Pay for Success (PFS) is a financing model that draws on private or philanthropic investment to provide upfront capital for social programs, with repayment tied to whether the program achieves agreed-upon outcomes. Rather than a government or public agency funding programs directly, investors assume the initial financial risk and are repaid typically with a return only if the intervention meets its performance targets. This structure shifts risk away from public funders and links public payment to demonstrated social impact.369 PFS has been applied most commonly to interventions with measurable, near-term outcomes, including workforce development and job training, supportive housing and homelessness prevention, early childhood education, criminal justice and recidivism reduction, and preventive healthcare programs.370
Role of CDOs – Pay for Success
In the PFS model, nonprofits primarily act as service providers who receive upfront capital from investors to deliver social interventions, such as workforce development or supportive housing. Additionally, specialized nonprofits and CDOs often serve as technical advisors or project managers, providing the analytical expertise needed to develop project ideas, conduct feasibility studies, and coordinate the various stakeholders required to assemble a complex PFS contract. They can also conduct feasibility studies and manage the rigorous data collection necessary to evaluate outcomes.371
Barriers to Adoption – Pay for Success
A PFS project requires developing an outcomes-based contract with a clear target population, specified intervention, data collection methods, and robust framework. In this model, the government plays a dual role, it acts as the outcome payer committing to repay investors if performance targets are met while also serving as the entity that defines what outcomes matter and sets the standards against which success is measured. Rather than delivering services, the government effectively outsources program delivery to nonprofit services providers while retaining contractual authority over outcomes and payment.372 Most PFS projects require a substantial investment of time and energy from all partners, typically taking a year or more to launch. Attracting traditional investors is one of the major obstacles to PFS projects due to their low, risk-adjusted returns, but philanthropy has the potential to offset this aversion through their own investment, serving as subordinate investors and providing other credit enhancements.373
Performance Matrix – Pay for Success
PFS relies on a strong philanthropic presence, as foundations often provide early-stage or “first-loss” capital that reduces risk for other investors. City institutions also play a central role as outcome payers, entering into performance-based contracts and repaying investors only if agreed-upon results are achieved. The tool has a moderate range of applicability, as it is best suited to interventions with clearly defined, measurable outcomes rather than broad or diffuse community development efforts. Although several high-profile pilots demonstrate its potential, certainty of success remains low due to high transaction costs, complex deal structuring, and challenges in attributing outcomes directly to specific interventions.
Case Study – Pay for Success Social Impact Bond (Denver, CO)
Denver’s Social Impact Bonds (SIBs), launched in 2016, are a PFS initiative designed to improve housing stability and reduce jail stays among individuals experiencing chronic homelessness. As a performance-based financing model, the City of Denver secured upfront capital from private and philanthropic investors, with repayment contingent on whether agreed-upon outcomes were achieved. The program was implemented on the ground by CDOs, most notably the Colorado Coalition for the Homeless (CCH), a community based nonprofit specializing in supportive housing and healthcare services for people experiencing homelessness. Colorado Coalition for the Homelessness delivered supportive housing services, case management, and wraparound health and social support to participants. CCH was responsible for translating outcome-based financing into direct service provision, coordinating housing placement, and sustaining participant engagement over time.374
Repayment to investors was tied directly to program performance, with government payments increasing as positive outcomes were verified. Evaluation by the Urban Institute found that the program improved housing stability, reduced jail stays and police interactions, and increased access to treatment services, indicating strong overall performance.375
Though CCH is not a community development organization in the traditional sense, this case highlights how CDOs with comparable housing development and case management capacity can step into the service provider role in PFS transactions by delivering measurable, outcome-verified interventions that justify investor repayment, generate long-term cost savings for the government, and establish a more stable and recurring revenue stream than traditional grant-dependent funding.
Tax Incentive Based Tools
Tax inventive based tools use regulatory mechanisms to influence behavior and encourage desired development outcomes. Tools such as the underused housing tax penalises vacancy376 and CDC Tax Credit programs reward investment in targeted community development activities. These tools align market-based decision making with public policy goals by reshaping economic incentives to promote equitable and efficient use of resources.377
The two tools studied under tax incentive based tools are:
- Underused Housing Tax
- Tax Credit Programs
10. Underused Housing Tax
The Underused Housing Tax (UHT) is a policy instrument that imposes an annual charge on owners of vacant housing. The tool is designed to address housing affordability by penalizing speculative holding and discouraging prolonged vacancy by imposing taxes on underutilized housing.378 These penalties target owners who hold housing as a financial asset rather than productive residential use, treating housing as a commodity rather than social good.379 The revenue collected is earmarked for housing subsidies and affordability programs.
The tax works through an annual declaration and assessment process where property owners who are not using the home as a principal residence or renting it for a required period are charged a percentage of the property’s assessed value.380 This creates a financial incentive to avoid leaving homes vacant, encouraging owners to either occupy, rent, or sell their properties. As a result, some units are brought back onto the housing market, increasing supply, while non-compliant owners contribute tax revenue toward affordable housing programs.381
Role of Cities & CDOs – Underused Housing Tax
City governments enable this model by collecting declarations from property owners, enforcing compliance, assessing property values, collecting tax revenue, and reinvesting that tax revenue into housing. It is important to note that the model is only effective when cities use the generated revenue for affordable housing delivery, rather than allocating it to the general budget.382
CDOs act as the main delivery partners, using these subsidies to develop affordable housing units. Because they are mission-driven rather than profit-driven, CDOs are well-positioned to deliver affordable housing that markets and governments often fail to produce.383
Barriers to Adoption – Underused Housing Tax
The Canadian Underused Housing Tax highlights how complex design can undermine a well-intentioned policy. Its requirement for a separate multi-page filing per property, even when no tax was owed, created significant compliance challenges, leading to roughly $2.5 billion in waived penalties. In FY 2023–24, the tax generated only $49 million while costing $59 million to administer, prompting the federal government to propose eliminating it in the 2025 budget.384 Beyond administrative issues, research shows that vacancy taxes can reduce empty homes but do not significantly lower rents, meaning they improve housing availability without directly improving affordability for low-income households.385 Additional challenges
include political resistance from property owners, legal disputes over assessments, and the lack of clear mechanisms to channel revenues through CDOs for reinvestment.386
Performance Matrix – Underused Housing Tax
Philanthropy plays a supporting role by helping CDOs meet co-investment requirements tied to city grants, but they do not drive this model. City institutions are the key enabler, as municipal governments are responsible for administering declarations, enforcing compliance, collecting revenue, and managing reinvestment programs that channel funds to CDOs; without this capacity, the model cannot function effectively. The model has low applicability, as it works best in high-cost urban markets where vacancy is a significant issue and property taxes are meaningful enough to influence behaviour, but it is less effective in smaller or low-vacancy contexts.387 Overall, certainty of success is high where implementation design is strong, administrative pathways are clear, and reinvestment mechanisms are wellestablished.
Case Study – Underused Housing Tax
Community Housing Incentive Program (Vancouver, Canada)
In 2017, Vancouver introduced the Empty Homes Tax (EHT) which applied a three percent tax on vacant residential properties and generated about $194.3 million in dedicated revenue for affordable housing while reducing the vacancy rate from 0.90 percent to 0.49 percent from 2017 to 2024.388
A key channel for reinvestment is the Community Housing Incentive Program (CHIP), which uses EHT revenues to fund nonprofit and cooperative housing providers. CHIP offers capital grants of up to $65,000 per affordable unit, covering roughly 20 percent of construction costs and helping projects secure additional public funding. Since 2019, nearly $47 million in CHIP funding has supported over 1,200 homes, including a 2024 allocation of $9.6 million for 334 units.389 In addition, a portion of EHT revenue is used for land acquisition, allowing nonprofit developers to access land at nominal lease rates and significantly reducing one of the biggest barriers to affordable housing production.390 Together, EHT & CHIP grant mechanisms demonstrate how a well-designed vacancy tax can move beyond a deterrent instrument to become a sustained funding pipeline to provide affordable housing.
11. Tax Credit Programs
As community development finance evolves, CDOs increasingly leverage tax credit programs as a source of catalytic funding. Tax credits are federal or state incentives that reduce tax liability for eligible investors in exchange for investments that support public policy goals.391 The field distinguishes two primary approaches: the use of existing federal tax credit programs and state- or municipal-level CDC tax credit programs.
Existing programs—such as the New Markets Tax Credit (NMTC), Low-Income Housing Tax
Credit (LIHTC), and Tax Increment Financing (TIF)—are project-based tools that CDOs access by structuring qualifying developments. In the NMTC model, for example, CDOs or affiliated entities are certified as Community Development Entities (CDEs) and receive allocations of tax credits, which are then sold to private investors. These investors receive tax reductions over a defined compliance period, while the resulting capital is deployed by the CDE to finance below-market loans or investments in low-income communities.392
While these programs are well-established tools, CDOs can apply them in more innovative ways and strategically to address community needs. By engaging early in local planning processes, CDOs can shape TIF districts to include affordable housing set-asides and use transit-oriented TIF to secure affordable housing near future transit corridors before displacement pressures intensify. They can also layer NMTCs with LIHTC or Historic Tax Credits to finance mixed-use community assets such as clinics, childcare centers, and affordable commercial spaces. In addition, LIHTC can support community land trusts and limited-equity cooperatives that preserve long-term affordability and resident ownership. By serving as co-developers or managing members, CDOs gain greater influence over long-term community benefit outcomes.393
In contrast, CDC or Community Investment Tax Credit (CITC) programs are not tied to specific projects. Instead, they allow individuals or businesses to donate directly to a qualified CDO and receive a state tax credit, typically 50% of their contribution in return, cutting the real cost of giving in half while channeling flexible capital to community organizations. Thirteen states currently operate these programs, and Philadelphia’s CDC Tax Credit stands as the only citylevel equivalent in the country. Their collective impact is substantial, in FY 2022-2023, the 13 programs leveraged over $350 million in donations to more than 1,500 nonprofits, with state allocations ranging from $350,000 to $36 million annually. CDOs deploy these funds toward approved community priorities such as housing, small business support, and workforce development, and in several states, funds can also cover general operating costs, a critical flexibility for organizations that are chronically under-resourced.394
Role of CDOs – Tax Credit Programs
Federal/State Tax Credit Programs
CDOs play both intermediary and project-level roles in federal tax credit programs. In the New Market Tax Credit Program (NMTC), high-capacity organizations may become certified Community Development Entities (CDEs), enabling them to secure tax credit allocations, attract private investors, and structure community investments.395 If CDOs participate as project developers, they can partner with larger CDEs to access subsidized capital for housing, commercial development, and community facilities. 396 Beyond these standard roles, CDOs can apply these tools more creatively by stacking NMTC with LIHTC or Historic Tax Credits to finance mixed-use community assets, using LIHTC to support community land trusts and limited-equity cooperatives for long-term affordability, and shaping TIF districts early to secure affordable housing set-asides before revenues are allocated elsewhere.397
CDC Tax Credit Programs
In CDC tax credit programs, CDOs serve primarily as qualified recipient organizations through which tax-incentivised private contributions flow to community priorities.398 In every state, CDOs are responsible for documenting and confirming to the state that a donation was made and meets program requirements, a process known as validating the donation, so that the donor can claim their tax credit at filing. In some states, CDOs take on a broader
set of responsibility by recruiting prospective donors, receiving contributions, and formally certifying these donations to both the donor and the state’s tax collection department. A few states give CDOs discretion in determining the level of tax credit offered to individual donors, allowing organizations to tailor their fundraising approach.⁷ In most programs, donated funds must be directed toward approved projects rather than general operating costs, though Massachusetts, New Jersey, and Pennsylvania are notable exceptions that permit flexible use for operating support, a meaningful advantage for CDOs seeking to build organizational capacity alongside project impact.399
Barriers to Adoption – Tax Credit Programs
Tax credit programs often involve significant administrative and compliance burdens, including detailed reporting requirements, legal structuring, and ongoing regulatory oversight. These demands can limit participation among CDOs with smaller administrative teams or limited financial and legal expertise.400 Access to tax credit allocations is also highly competitive, which tends to advantage larger and more established CDOs. Emerging organizations often lack the corporate networks, investor relationships, or underwriting capacity needed to secure allocations or structure deals, resulting in a concentration of resources among better-resourced intermediaries and developers.401
Performance Matrix – Tax Credit Programs
As tax credit programs are created and administered through federal, state, or municipal legislation, they exhibit low philanthropic presence and strong involvement of federal or state institutions. These programs are designed to channel private contributions into community development organizations through government-issued tax incentives. The range of applicability is moderate because, while there provides a large variety of tax credit programs, including CDC Tax Credit, the use of each program is still bounded by program eligibility rules that vary by jurisdiction.402 Certainty of success is high because CDC tax credit programs are a well-established policy tool with a long track record across multiple states. Decades of implementation evidence demonstrate consistent ability to attract private investment and generate sustained funding flows for CDOs.403 404
Case Study – Tax Credit Programs
Neighborhood Revitalization Tax Credit (Orange, New Jersey)
Housing and Neighborhood Development Services, Inc. (HANDS) is a nonprofit community development corporation founded in 1986 and based in Orange, New Jersey, illustrates how CDO can leverage a state tax credit program to drive sustained neighborhood transformation. HANDS has been a sustained participant in New Jersey’s Neighborhood Revitalization Tax Credit (NRTC) program. The NRTC offers business entities a 100% tax credit against various New Jersey state taxes in exchange for investments in the revitalization of low- and moderate-income neighborhoods in eligible cities, with at least 60% of funds directed toward housing and economic development activities and the remainder available for complementary uses such as small business support and mixed-income community building. A total of $15 million per year is available in tax credits statewide.405 To access
funding, CDOs must first develop and receive state approval for a long-term neighborhood plan. HANDS has held approved NRTC plans for Orange’s Valley neighborhood since 2004 and the Heart of Orange neighborhood since 2010.406
HANDS, Inc. redevelopment of the F. Berg Hat Factory Complex in Orange’s Central Valley Redevelopment Area demonstrates how tax credit financing can be strategically leveraged for neighborhood revitalization. Located adjacent to the Valley NJ Transit station, the formerly vacant industrial site was transformed into Hat City Lofts, a mixed-use affordable housing and arts development that became a catalyst for neighborhood revitalization.407
In 2013, HANDS received a $985,000 Neighborhood Revitalization Tax Credit (NRTC) award to redevelop two buildings within the complex.408 The project converted the historic 1864 and 1907 factory structures into 32 affordable loft condominiums and 10 commercial arts and studio spaces.Financing was assembled through a layered capital stack combining NRTC funds with support from the New Jersey Housing and Mortgage Finance Agency’s CHOICE program, HUD Economic Development Initiative funds, CDFI financing, and private lenders including JPMorgan Chase and PNC Bank.409
The project illustrates how CDOs can strategically combine tax credit programs and partnerships to finance mixed-use community assets that single funding sources could not support independently. By serving as co-developer alongside New Jersey Community Capital, HANDS retained influence over affordability, design, and long-term community outcomes rather than acting solely as a grant recipient.410
The redevelopment generated broader neighborhood impacts beyond housing production. The formerly blighted site became an anchor for the Valley Arts District, attracting artists, entrepreneurs, and private investment while increasing local economic activity and the municipal tax base. HANDS later secured additional NRTC grants, including a $244,750 award in 2016 for a transit gateway and entrepreneurship hub adjacent to the Highland Avenue NJ Transit station, and two $750,000 grants for the Heart of Orange and Valley neighborhoods to expand arts programming, entrepreneurship initiatives, and neighborhood gateway improvements around the transit corridor.412
The case highlights several lessons for CDOs: the importance of long-term neighborhood planning, the necessity of layering multiple financing tools, the value of transit-oriented redevelopment, and the benefits of CDOs taking active co-developer or managing-member roles to secure lasting community benefits.
Community Ownership Models
Community ownership models enable collective control and long-term stewardship of land, housing, and community assets. Tools such as Community Investment Vehicles and Community Land Trusts restructure ownership to prioritize affordability, prevent displacement, and keep land value within the community. These models strengthen local governance, support intergenerational wealth, and protect community assets from speculative markets.413 414
The two tools studied under Community Ownership Models are:
- Community Investment Vehicles
- Community Land Trust
12. Community Investment Vehicles
A Community Investment Vehicle (CIV) is a financial structure that pools capital from diverse sources like philanthropic organizations, government agencies, institutions, private investors, and community residents, and channels it into community development projects that are typically underserved by traditional finance.415 These projects include affordable housing, small business support, and community facilities in low- and moderate-income areas. CIVs are designed to balance two goals: generating modest financial returns for investors while producing measurable social impact.416
CIVs work by combining different types of capital in a “blended” structure. Philanthropic and public funds usually take the highest risk, reducing risk for private and community investors and making otherwise risky community projects financially viable.417 CIVs may issue notes or bonds, invest through intermediary funds, and recycle repayments into new projects, creating a revolving pool of capital.418
Role of CDOs – Community Investment Vehicles
CDOs are the key implementers and beneficiaries of this tool. They receive below-market financing from CIVs to develop housing and community projects. They also serve as local partners, identifying community needs, structuring projects, and ensuring funds are effectively deployed. Larger intermediaries like LISC help connect institutional investors with smaller nonprofit developers who lack direct access to capital.419
Barriers to Adoption – Community Investment Vehicles
The key barriers to adoption include strict track record and scale requirements that disadvantage smaller or emerging CDOs, especially minority-led organizations. Regulatory compliance for public investment offerings (SEC rules) add cost and complexity.420 Community investors often face high minimum investment thresholds and limited liquidity.421 Additionally, CIVs struggle to fund deeply affordable or high-need projects because these may not generate sufficient financial returns without significant subsidy.
Performance Matrix – Community Investment Vehicles
CIVs have high philanthropic involvement, with foundations providing essential first-loss capital through grants and program-related investments that enable risk-sharing and attract private investment. City and government participation is high, mainly through tax credit programs (like LIHTC and NMTC), loan guarantees, and regulatory tools that help mitigate risk for investment and channel capital into underserved areas. Their range of applicability is high, as CIVs are most effective for asset-backed, revenue-generating projects like affordable housing, community facilities, and small business lending, but less suited for non-revenue social or advocacy work. Overall certainty of success is low. A well-established CIV can demonstrate stable performance and scalable impact, while newer or smaller communityled vehicles face higher uncertainty due to capital constraints, regulatory complexity, and difficulty attracting institutional investors without a proven track record.
Case Study – Community Investment Vehicles
Kensington Corridor Trust (Philadelphia, PA)
Kensington Avenue is a 1.6-mile commercial corridor historically and presently frequented by working class Philadelphians. Its revitalization faces challenges such as decades of disinvestment and the threat of rapid, speculative redevelopment that displaces the communities the local community members serve. Kensington Corridor Trust (KCT) in Philadelphia was created in 2019 to combat speculative displacement along Kensington Avenue.422 It leverages neighborhood assets to maintain community control of property use and values in perpetuity while reinvesting income into community programs. It is governed by local residents and small business owners through a Board of Directors and a Perpetual Purpose Trust Stewardship Committee, making community control a legally enforceable structural feature rather than a design aspiration.423
KCT’s unique capital stack combines non-recoverable grants for operations and patient, low-interest loans for property acquisition—deliberately prioritizing long-term affordability over investor returns. Coming off its busiest year yet, the trust now owns 30 properties along Kensington Avenue, including 26 actively leased affordable apartments and 14 active storefronts, with another 25 apartments and seven storefronts in the rehabilitation pipeline.424 In total, KCT has raised $2.5 million in grants and $10.85 million in loans. The trust is the nation’s first neighborhood trust focused on a commercial corridor,425 offering cities a replicable model for community-driven revitalization that resists gentrification from within.
13. Community Land Trust
A community land trust (CLT) is a nonprofit, community-based corporation that owns land in trust for the benefit of a defined geographic area and manages that land in the long-term on behalf of the community.426 CLTs typically retain ownership of the land and convey longterm ground leases to individual homeowners, housing cooperatives, nonprofit organizations, or other entities that own the buildings and improvements. By separating the ownership of land from the ownership of housing and other structures, CLTs seek to preserve long-term affordability and protect community assets from speculative increases in land value.427
CLTs accomplish their goals by first, making homeownership affordable through the use of subsidies that bring down the initial purchase price for qualified buyers, and second, maintaining long-term affordability to future purchasers through a legally binding mechanism, such as a long-term ground lease or a deed covenant. The CLT retains title to the land and grants a lease (often for 99 years) to the owner.428 Ground leases typically include a resale formula that balances the goals of preserving long-term affordability and allowing the homeowner to build wealth. Because the land cost is removed from the purchase price,
homes in a CLT can be sold at significantly below-market prices. When homeowners sell, they retain the equity accrued through mortgage down payments and permitted appreciation, but at a limited amount that keeps the home affordable for the next buyer.
Role of CDOs – Community Land Trust
CDOs are the primary stewards of the CLT model. They acquire land, develop or rehabilitate housing on that land, sell structures to income-qualifying buyers, and hold the land in perpetual trust. The typical CLT board may comprise community members, housing experts, funders, and CLT homebuyers. Besides creating a homeownership and wealth-building opportunity for families who otherwise could not qualify for mortgage financing, the CLT model also creates sustainability and long-term affordability for communities by preserving the “one-time” infusion of capital from philanthropy and/or governmental sources.429 CDOs also provide ongoing stewardship services: pre-purchase counseling, monitoring of ground lease compliance, and coordinating with lenders to prevent foreclosures.
CDOs can also establish themselves as CLTs, taking on the role of real estate developer, landowner, and long-term community steward. They handle land acquisition, oversee home construction, qualify buyers, and actively enforce the ground lease restrictions and resale formulas.430
Barriers to Adoption – Community Land Trust
The CLT model requires significant up-front capital to acquire land. In high-cost urban markets, where CLTs are most needed, land acquisition is prohibitively expensive without substantial public or philanthropic subsidy. Financing CLT homes can also be complicated. Many conventional lenders are unfamiliar with the dual-ownership structure of groundleased properties, though Fannie Mae and a growing number of CDFIs now have CLT-specific products. Additionally, resale restrictions—while essential to long-term affordability— can reduce homeowner equity accumulation relative to the open market, making CLT homeownership a harder “sell.” Finally, preserving the “one-time” infusion of capital from philanthropy is not guaranteed, and the long-term financial sustainability of CLTs depends on consistent stewardship of funding and organizational capacity.
Performance Matrix – Community Land Trust
CLTs rely on both philanthropic and public support, especially for initial land acquisition and development, but become more self-sustaining once established. City institutions often support CLTs through funding, land contributions, or policy alignment, though ongoing operation does not depend on them. The model has a low range of applicability because it is narrowly focused on land ownership and permanent housing affordability rather than broader CDO activities. Overall, CLTs have a high certainty of success, given their strong track record of maintaining long-term affordability and preventing displacement.
Case Study – Community Land Trust Community Land Trust (Frankfurt, MI)
The Frankfort Area Community Land Trust (CLT) in Michigan was established to provide housing for local workers who were being priced out of a rapidly inflating, tourism-driven housing market. Its model combines public subsidy with innovative local financing strategies to expand access to permanently affordable housing.
In addition to receiving a state grant, the CLT partnered with a local credit union to create a community investment program, allowing residents to deposit personal savings into a land acquisition fund. In return, the credit union offers a modest, stable interest rate backed by the CLT’s underlying land assets, effectively aligning local financial participation with long-term housing affordability.
In its first round of funding, the broader program allocated $15 million for nonprofit developers, with approximately $9.5 million awarded, including $240,000 to Frankfort’s CLT. Collectively, these investments supported 158 housing units, 121 of which are designated for homebuyers.431
Innovative Financial Tools: Performance Matrix
Table 6 presents a comparative performance matrix of all thirteen financial tools studied. The matrix compares tools across key dimensions including the presence of philanthropic support, involvement of city institutions, range of applicability, and certainty of success. The purpose of this matrix is to provide a structured framework for understanding how different financial mechanisms function within community development practice and how they contribute to long-term organizational resilience and equitable development outcomes.
Table 6. Performance Matrix of Innovative Financial Tools
Systemic Strategies for CDOs
Long-term financial resilience in CDOs is shaped not only by accessing funds but also by structuring, integrating, and sustaining their financial, relational, and institutional system over time.432 This reduces vulnerability to funding volatility, addresses structural inequities in access to capital, and enables a more adaptive and sustained community development field. This section describes three key strategies CDOs can implement to build long-term financial resilience: (1) building a diverse portfolio; (2) nvesting in organizational infrastructure; and (3) cultivating relational capital.433
Diverse Portfolio
A central resilience strategy for CDOs is developing diversified and coordinated portfolios of programs, revenue streams, and financial instruments. On average, CDOs receive program and project funding from only 3.4 distinct sources, which provides a little or no buffer when any single source is disrupted.434 Rather than relying on a limited number of funding relationships, CDOs benefit from coordinating arrangements across philanthropic funders, public institutions, local economic actors, community investment vehicles, and earned revenue streams generated through fee-for-service contracts, social enterprise activities, and outcomes-based financing models.435
In interviews, portfolio diversification was cited as a key strategy for fostering CDO financial resilience. This diversification involves maintaining a wide portfolio of funds including home repair programs, LIHTC developer fees, shared services agreements, and additional revenue generated through real estate assets and other revenue. In addition to facilitating financial stability and organizational sustainability, the diversification of services and funding sources expands the overall capacity of CDOs, allowing them to become more responsive to the needs of their communities.436 The Green & Healthy Homes Initiative (GHHI), a national nonprofit and intermediary, emphasizes the importance of resource diversification through their model of “align, braid, coordinate,” a strategy involving in-depth asset mapping and identification of available resources across an ecosystem to holistically meet the needs of communities and residents.437 By aligning various types of services and funding, braiding together the relevant resources, and coordinating their service delivery in this way, CDOs can help realize marked improvements in the health, economy, and social conditions of the communities they serve.438
Case Studies - Resource Diversification Across Citywide Partnerships
The Detroit Home Repair Fund
The Detroit Home Repair Fund (DHRF), a home repair initiative managed by Enterprise Community Partners and supported by technical assistance from GHHI, exemplifies the power in the align, braid, coordinate model. Implemented by 13 local CDOs and nonprofits, “DHRF strategically works with nonprofits already delivering other repair programs to improve access to multiple funding sources, streamline project delivery, and maximize impact.”439 As of May 1, 2025, DHRF used this strategy to invest more than $15 million in Detroit communities, including $2.8 million in direct staffing resources for the community organizations implementing the work as well as $4.2 million in funds leveraged from other programs and resources operating in the city.440 Overall, this diversification of resources facilitated both increased housing stability for nearly 500 households and “tangible improvements in internal operations, capacity, and effective program delivery” for the program’s CDOs and nonprofit partners.441
Jefferson East, Inc.’s Diverse Portfolio Jefferson East, Inc. (JEI) introduced earlier as case study for Resource Capacity exemplifies the “align, braid, coordinate” funding model by building a diversified portfolio of governmental grants, philanthropic support, corporate partnerships, academic collaborations, and earned revenue streams that reinforce one another.442 Its university partnerships generated program funding through the NSF Smart and Connected Communities Program, staffing support through the Community Tech Workers initiative, and low-cost planning assistance through student capstone projects.443 Most notably, JEI’s for-profit subsidiary, the East Jefferson Development Corporation (EJDevCO), demonstrates how earned revenue and missionaligned investment can be integrated into a CDO funding model.444 EJDevCO generates profits that support JEI’s programming while attracting investment capital, including a $2 million equity investment from the Kresge Foundation. Together, these coordinated funding streams have strengthened JEI’s financial resilience and expanded its capacity to pursue community development opportunities.445
Portfolio diversification is not simply a financial strategy, but an organizational approach to resilience. By leveraging multiple streams of capital, programs, and partnerships, CDOs can withstand funding volatility, respond to community needs, and sustain their mission over the long-term. When implemented intentionally, this approach shifts the sector away from reactive, scarcity-driven models toward a more stable and adaptive system of community development finance.
Nonprofit Starvation Cycle: Capacity Building through Investment in CDO Infrastructure
The nonprofit starvation cycle is a vicious cycle in which funders’ unrealistic expectations about low overhead forces nonprofits to underinvest in essential infrastructure and underreport their true costs. This reinforces the belief that nonprofits can operate on a shoestring budget.446 The chronic underfunding of nonprofit overhead systematically weakens the core administrative systems required for effective grant management, financial oversight, and compliance.
For CDOs in affordable housing, this appears in the form of insufficiently resourced grant tracking systems, limited financial reporting capacity, and under-resourced accounting functions, increasing exposure to audit risks, funder disqualification, and long-term financial instability.447 At the root of this starvation cycle is the tendency of funders to underestimate the true cost of nonprofit operations, which pressures organizations to suppress reported overhead costs and underinvest in internal systems, reinforcing underfunding assumptions over time.448
In Detroit between 2018 and 2020, CDOs only experienced a 30 percent increase in general operating support. While this funding supported critical activities such as resident engagement and community planning, it often came at the expense of investment in internal systems like HR, IT, and finance management.449 This demonstrates that even “flexible” funding does not automatically resolve the starvation cycle; instead, it forces organizations to continue making trade-offs between programmatic work and institutional capacity.450
This dynamic compounds existing racial funding disparities. Research by Echoing Green and The Bridgespan Group found that the net assets of Black-led organizations are 76 percent smaller than their white-led organizations. Funders often cite a “lack of capacity” or “lack of evidence” to justify decisions not to invest, even though historic underfunding is frequently
the real cause. The result is a self-reinforcing inequity underfunded organizations cannot build the systems that funders require to demonstrate fundability.451
Funders need to take the lead in breaking this vicious cycle and expanding support in the form of tools like capacity-building grants and Program Related Investments (PRIs, to strengthen internal CDO infrastructure and support long-term institutional capacity.452 Strengthening the financial and administrative system should not be considered overhead, but a foundational condition for long-term resilience. Reframing capacity building enables a more stable, mission-driven community development ecosystem.
Relational Capital as Organizational Infrastructure
Newer organizations, and particularly Black-led and other BIPOC-led developers, including CDOs, often enter the field without inherited networks of funders, intermediaries, and decision makers that facilitate deals, underwriting credibility, and early-stage project advocacy.453 This gap is rooted in multigenerational racial wealth disparities shaped by historically exclusionary housing and lending policies, which have constrained the ability of BIPOC developers to accumulate seed capital through personal and familial networks.454 As a result, relational access functions as an upstream gatekeeper to financial tools including CDBG allocation, LIHTC syndication, and philanthropic funding, long before any project proposal is evaluated on its merit.
The consequences of this relational gap extend across the non-profit and philanthropic sector broadly. The world of philanthropy is built on relationships and the ease with which trust and relationships are built travels quite differently across lines of difference, particularly race. Currently, 92 percent of US foundation presidents are white, 83 percent of other fulltime executive staff are white, and 68 percent of program officers are white, meaning that the networks through which funding flows are overwhelmingly shaped by a narrow slice of social experience. For BIPOC-led organizations, this translates into being less likely to receive informal technical guidance during predevelopment, less likely to be introduced to competitive funding opportunities, and less likely to have advocates present when underwriting decisions are made.455
These barriers cannot be solved by CDOs alone and require intentional intervention across the broader community development ecosystem. Intermediaries play a critical role by providing cohort-based learning, networking opportunities, technical assistance, and flexible operating support that help organizations build relationships and institutional credibility often unavailable through inherited networks.
Co.act Detroit illustrates this approach. Launched in 2019, Co.act serves as a hub for collaborative action in Southeast Michigan’s nonprofit sector, providing tailored support through grants, peer-learning cohorts, workshops, and convening space.456 By creating recurring opportunities for nonprofit leaders to connect with one another, funders, and service providers, Co.act helps organizations build the relational infrastructure often missing in under-resourced communities.457
Enterprise Community Partners’ CDO Fund and Elevating CDO (ECDO) Fund similarly pair flexible funding with relationship-building. Phase 1 of the ECDO Fund provided operating support and technical assistance to six BIPOC-led Detroit nonprofits alongside cohort meetings, mentorship, and professional development.458 In Phase 2, the funds committed $23.7 million to 32 Detroit nonprofits with backing from a coalition of major foundations.459
Together, these efforts recognize that organizational sustainability depends not only on funding, but also on strong relational networks.
In Detroit, the BECDD System Capitalization Task Force was intentionally designed to address this relational asymmetry by convening philanthropy, CDOs, CDFIs, banks, and government actors within a shared platform.460 The initiative explicitly recognized that newer and BIPOC-led organizations lacked inherited access to decision-making networks, and therefore required structured opportunities to build relational capital.461 The Task Force’s guiding principle that “change moves at the speed of trust,” reflects an understanding that relationship infrastructure would not emerge organically and had to be built deliberately within a defined institutional window, with the explicit participation of those who control capital and those who have historically been excluded from the networks that access it.462
Co.act builds peer networks among nonprofits, ECDO builds organizational credibility with funders, and BECDD brings the ecosystem into the same room with shared accountability. Together these three models demonstrate that relational capital is a structural precondition for equitable access to the financial tools.
Closing this gap requires that relationship-building be treated not as an informal organizational advantage but as a funded, intentional component of financial system design, specifically for the organizations that enter the field without the network inheritance that has historically defined access to community development capital.463 464
Conclusion
Diversified financial portfolios, strengthened organizational capacity, and embedded relational infrastructure together form the foundation of long-term financial resilience in CDOs. No single dimension can work effectively on its own: diversified funding without the internal systems to manage it can create compliance risks, strong organizational capacity without access to partnerships limits funding opportunities, and relationships without the ability to deliver projects cannot turn trust into real outcomes. When these three dimensions are developed together, CDOs can move beyond reactive, grant-dependent survival strategies toward a more stable and adaptable model of community development, where resilience comes from the strength of the systems that support both finance and long-term impact.
Scenario 3: Consolidations & Convenings
Scenario 3: Consolidations and Convenings
Scenario Explanation
In the Staying Rooted, Moving Forward session, COA identified a growing shift toward mergers, consolidations, and convenings between CDOs. In this scenario, CDOs may not be able to sustain themselves independently, leading to more frequent consolidations. At the same time, “Convenings [will] become essential ‘glue’ holding the field together, creating identity, legitimacy, and shared strategy.”465 The risk in this scenario is that “if consolidations are not intentional and convenings are not able to unite the field in identity and action,” there will be a loss of grassroots voices.466
Since the 1990s, nonprofits have participated in formalized discussions around mergers and consolidations.467 This was driven by a “war on waste,” centered on the belief that there is a “correct” number of organizations doing the job and this number is less than what exists today.468 Funders encouraged organizations to merge, partner, or collaborate on service provision and programming, rather than cutting funding and potentially destroying the organization.
A 1998 report from the Ford Foundation suggests that CDOS with successful track records in economic development achieved their goals by engaging in partnerships with public, private, and nonprofit funders. The source provides several case studies of CDOs partnering with other organizations to build affordable housing. In all cases, the “partnering relationships have allowed the organizations to broaden their range of community development activities and bases of support.”469
Google web search data shows that discussions around nonprofit partnerships and mergers remained low throughout the 2010s.470 In 2025, the topic of “Nonprofit Mergers” and “Nonprofit Partnerships” reached all-time high for web searches, indicating a strong interest in the topic from the nonprofit field.471
Figure 10. Google web search interest for “Nonprofit Mergers” between 2004-present, on a scale of 1-100, with 100 being the peak interest.472
11. Google web search interest for “Nonprofit Partnerships” between 2004-present, on a scale of 1-100, with 100 being the peak interest.473
Recent declines in federal funding have exposed underlying tensions that have been building among CDOs. A 2022 report from the Urban Institute found that among small CDOs, 23 percent face insolvency, and 20 percent experienced a significant funding disruption in a single year.474 COA’s scenario planning work underscores this fragility: nearly two-thirds of CDOs are vulnerable to financial disruption, and 10 percent are simultaneously experiencing threats to programs, financial instability, and exposure to disruption.475 It is fair to question whether the field can sustain its current number of organizations given the underlying financial strain coupled with the decline in federal funding.
Given this context, it is logical to assume that mergers occur because smaller organizations need support and larger organizations absorb them. However, interviews with CDOs revealed that both small and large organizations struggle to survive periods of funding austerity.476 While waves of “rescue mergers” (e.g., when one organization absorbs another in lieu of insolvency) come and go, many CDO mergers consist of strength-seeking-strength, where mission compatibility and business operations are more significant than revenue requirements.477
Because CDOs are fundamentally place-based and mission-driven, centering community voice in CDO relationship decisions is crucial. Communicating early and often avoids speculation and misinformation, which is bred by silence.478 CDOs considering a restructuring can explore forums, surveys, one-on-one conversations, or all of the above to ensure that community voice is at the table.479 Research shows that 80 percent of successful nonprofit restructuring instances included significant pre-merger collaboration that focused on trustbuilding and credibility with the community and stakeholders.480
The research team sought to both test and build on COA’s hypotheses for this scenario through four primary objectives: (1) defining terminology; (2) articulating rationale; (3) showcasing case studies of CDO relationships; and (4) communicating the important realities of this work to funders and other ecosystem participants. Through the exploration of these topics in both research and interviews, evidence of a range of relationship typologies that can serve CDOs well emerge.
Figure
Defining Terminology
Introduction
The first research objective asks: What is a simple set of terminology that clearly articulates and defines different ways that CDOs can work together? Conversations about strategic relationships between CDOs are inherently charged—emotionally, strategically, and culturally—and the absence of shared definitions only deepens that tension. As the 2016 Metro Chicago Nonprofit Merger Study notes, the word “merger” can mean many different things, ranging from cases where an acquired organization’s assets are fully subsumed into a larger one, to arrangements between organizations of equal standing.481
The term “merger” itself carries significant emotional weight, with two CDO executives interviewed by the team referring to it as “the M word.” Similarly, the Bridgespan Group’s Making Sense of Nonprofit Collaborations (2014) found that collaboration itself remains an ill-defined term, with too little known about the forms it takes and whether some forms are more effective than others.482 During COA’s Staying Rooted, Moving Forward session, participants suggested pivoting toward the more accessible language of “strategic partnerships” to reduce the resistance to charged terminology like “merger” or “consolidation.”483 By developing a clear, shared vocabulary—one that articulates a spectrum of CDO relationships rather than pre-empting one particular type—this research lays the groundwork for more productive and less fraught conversations across the field.
When determining the most appropriate terms to describe the types of relationships that CDOs can have with each other, the team considered multiple established frameworks. The team found that even between frameworks, terminology was inconsistent, with the same words used to describe different activities. Therefore, the team established a new framework as a synthesis of established frameworks and observations from the field.
The most foundational framework for this research was the Strategic Relationship Spectrum from Abundance Leadership Consulting, from which this project’s framework name is borrowed.423 La Piana’s Mergers & Alliance Toolkit, specifically the “Collaborative Map,” which outlines more than a dozen ways that nonprofits can work together, was also a key resource. A brief summary of each framework is outlined in the next page.485
Two or more organizations work together on specific projects without formal structures. Examples include co-sponsored programs, shared advocacy, or collaborative funding proposals. Risk is low; commitment is flexible.
Level 2: Formal Partnerships
Organizations establish memoranda of understanding (MOUs), joint committees, or shared staffing arrangements. Decision-making may be shared; resources are pooled for specific initiatives. Risk is moderate; commitment increases. Resources like the Local Initiatives Support Corporation (LISC) provide templates and guidance for formalized partnership structures.
Level 3: Federations or Networks
Multiple independent organizations maintain their legal status while coordinating strategy, sharing back-office functions, or presenting a unified front. Each member organization retains governance autonomy. Risk is moderate; alignment is intentional.
Level 4: Consolidation or Strategic Alliances
Organizations merge some functions while remaining separate legal entities. They might share executive leadership, back-office operations, or governance structures while preserving brand independence. Risk increases; organizational complexity rises.
Level 5: Full Merger
Two or more organizations combine into a single legal entity with unified governance, operations, and mission. Risk is high; integration challenges are complex.
Level 6: Acquisition
One organization absorbs another, maintaining its own legal structure while integrating the acquired organization’s assets, staff, and programs. Leadership, mission, and culture typically reflect the acquiring organization’s predominant identity.
Critique: Strategic Relationship Spectrum
The Strategic Relationship Spectrum provides a clear and accessible framework for understanding a range of organizational relationships along a continuum from informal to formal. The project team quickly adopted this terminology and began using it in discussions, however, several areas of ambiguity emerged. For instance, level three, “Networks,” proved difficult to clearly define in practice, while level four, “Strategic Alliances,” often caused confusion given the interchangeable use of “alliance” and “partnership” within the field. Additionally, although levels five (“Full Merger”) and six (“Acquisition”) are conceptually distinct, the team observed that, in practice, many arrangements described as “mergers” more closely resemble acquisitions from a legal standpoint.
Benchmark: La Piana’s “Collaborative Map”
La Piana’s “Collaborative Map” (Figure 12) illustrates the range of ways independent organizations can work together to pursue shared goals, organized along a continuum of increasing formality. The framework is depicted as three nested circles: the outer circle captures informal collaboration, emphasizing flexible and often overlapping partnerships; the middle circle represents more structured alliances, in which organizations coordinate specific functions or align around shared initiatives; and the innermost circle highlights strategic restructuring, where collaboration involves formal organizational change or the creation of new entities.487
Critique:
La Piana’s “Collaborative Map”
The “Collaborative Map” provides a high-level overview of the different tiers of working together, as well as the various activities that could be associated with each tier. From this model, the terms “collaboration” and “strategic restructuring” are particularly useful because of their general applicability and set of activities. In contrast, however, the “alliance” tier proved less functional, encompassing an overly broad set of activities.
Figure 12. La Piana’s “Collaborative Map” graphic.488
Understanding Rationale, Benefits, and Considerations
The second research objective asks: What are the primary reasons why CDOs explore a strategic relationship, and what are the possible benefits and considerations? Strategic relationships are not one-size-fits-all, and understanding what motivates organizations to pursue them is essential for informing best practices. La Piana Consulting’s Merger and Alliance Toolkit emphasizes that the most important question before entering any formal partnership is not what structure to use, but why an organization is considering a strategic relationship in the first place, since different goals lend themselves to very different arrangements.489
The Bridgespan research reinforces this, finding that while 91 percent of nonprofit CEOs surveyed had engaged in at least one form of collaboration in the prior three years, both funders and nonprofits identified persistent barriers—including difficulty finding the right partner, lack of funder support, and underestimation of ongoing costs.490 For CDOs in particular, understanding the benefits and trade-offs ahead of time is especially important. As COA’s scenario planning materials make clear, the risk in this scenario is not consolidation itself, but consolidation that is poorly executed, reduces resident services, and fails to preserve community voice. This research objective, and the following recommended model of strategic relationships, therefore aims to help the field distinguish between relationships that advance mission and those that may compromise it.
Synthesis and Recommendation: The Strategic Relationship Framework
Building on the six-stage Strategic Relationship Spectrum and three-stage Collaborative Map, the team created a four-stage “Strategic Relationship Framework.” The four stages in this framework are collaboration, partnership, resource sharing, and restructuring. From left to right, each stage represents a deeper level of integration between CDOs.
diagram.
Collaboration was selected as the first stage, reflecting its role as the entry point in both Abundance Leadership Consulting’s Strategic Relationship Spectrum and La Piana’s “Collaborative Map.” Partnership follows as a more structured form of coordination, drawing primarily from the Spectrum as well as elements of the Collaborative Map’s “alliance” category. The third stage, Resource Sharing, synthesizes aspects of the Abundance Leadership Consulting’s intermediate levels—federations, networks, and strategic alliances— with La Piana’s “alliance” category. The final stage, Restructuring, represents the highest level of integration, aligning closely with La Piana’s “strategic restructuring” category and the Spectrum’s merger and acquisition levels. Table 7 compares these existing frameworks with the proposed Strategic Relationship Framework, illustrating how each stage corresponds across models.
Overall, the four-stage Strategic Relationship Framework is designed to be simple enough to be memorable, and distinctive enough for easy comparison between the stages. Importantly, the Framework is not meant to suggest a “ladder” that CDOs must continually move “up” over time. Rather, any stage by itself may be sufficient for a CDO given the unique aspects of its internal infrastucture programs, and surrounding ecosystem.
Collaboration is best suited for CDOs that are closely aligned in geography or mission, but distinct enough in their core work that formal integration would be unnecessary or counterproductive. La Piana’s framework describes this tier as appropriate for organizations that want to pool expertise, amplify a policy message, or tackle shared social issues requiring coordinated action, without changing how either partner is internally structured or managed.493 In practice, this describes a significant share of the community development field: CDOs that operate in overlapping neighborhoods, serve adjacent populations, or pursue complementary goals, but whose identities and programmatic approaches are distinct enough to warrant independence.
COA’s Staying Rooted, Moving Forward session at the 2025 People & Places Conference identified convening and coordination as the connective tissue of the field, noting that every group that participated in their 2025 deliberations pointed to convening as essential for field identity and learning, regardless of whether deeper structural arrangements were also warranted.494 Collaboration is particularly well-matched for organizations that are new to working together and need to develop mutual understanding before committing to anything more binding. Collaboration also fits CDOs with limited internal capacity that may not be able to absorb the transactional overhead of a more formal arrangement.
Benefits – Advantages of Collaboration
The defining advantage of collaboration is the low barrier to entry and exit. Either party can step back without legal or financial consequence, making it accessible to organizations that are risk-averse, resource-constrained, or simply uncertain about whether working together will add value. La Piana’s framework notes that collaborations offer great flexibility and only need to last as long as it takes for the shared goal to be reached—a key feature in a sector where organizational circumstances change frequently.495 This low-stakes arrangement also makes collaboration a productive first step toward something deeper. Frank Woodruff of COA put it plainly: “forever partnerships are rare,” and the relational capital built through even a short-term, purpose-specific collaboration can lay the groundwork for more durable arrangements over time.496
Collaboration also enables CDOs to amplify their advocacy voice and increase community visibility without changing how either organization operates internally. COA’s Staying Rooted framework specifically calls for developing inter-organizational, region-based communications infrastructure and institutionalizing peer-to-peer collaboration among intermediaries as a way to reduce duplication and speak with greater collective authority.497 The Bridgespan research similarly found that 56 percent of nonprofit CEOs engaged in associations reported developing a stronger and more effective collective voice as a primary outcome—the most commonly cited benefit of that form of collaboration.498 For CDOs navigating a hostile federal funding environment or advocating for policy priorities at the state level, this kind of coordinated voice can produce outsized returns relative to the effort required. Collaboration also generates shared knowledge within a geography, helping organizations learn from one another’s program models and avoid redundant investments in research or community engagement.
Considerations – Drawbacks of Collaboration
The principal vulnerability of informal collaboration is its susceptibility to erosion when pressure eases. Woodruff captured this dynamic clearly, explaining that calls for greater collaboration almost always peak when organizations feel financial, political, or other pressure, and when that pressure subsides, so does the motivation to collaborate. Without written commitments, participation can become inconsistent; attendance drops, followthrough falters, and the arrangement quietly dissolves without any party having to formally walk away. Where those structures are absent, the collaboration often fades into what Woodruff called the risk of “an illusion of coordination without producing meaningful change.”
Imbalances in contribution are another possible challenge in collaborative relationships. Due to the informal nature of collaborative relationships, in practice, one organization may carry more of the logistical or relational weight, such as convening meetings, tracking shared commitments, or navigating funder relationships on behalf of the group.499
Interviews reflected this dynamic across multiple cities, with practitioners noting that power struggles, lack of candor, and poor communication were among the most common reasons collaborative relationships broke down. Woodruff also flagged the importance of distinguishing between collaboration and partnership (the second stage in the framework), where both parties share decision-making, risk, vision, and form a contractual arrangement.500 Confusion between these two modes is one of the most common stumbling blocks in collaboration.
Finally, sustaining collaboration over time generally requires a strong support structure, including a dedicated convenor, an anchor funder willing to support the coordination infrastructure, and some formal structure to maintain momentum. The COA scenario planning process recognized this explicitly, with participants calling for the creation of spaces where funders and organizations can connect and coordinate action at a regional level, suggesting that without deliberate investment in convening infrastructure, even wellintentioned collaborative relationships risk breaking down over time.
Case Studies – Collaboration
Joint Corridor Study (Cleveland, OH)
The team interviewed a Cleveland CDO, which was founded in the 1970s by a group of residents and business owners concerned about the decline of their neighborhood.501 The CDO specializes in home repair, social service provision, community building, and business support. There is another CDO that shares a service area with the first CDO, providing housing assistance, business assistance, and youth and senior programming.502
Eight years ago, the two organizations explored merging and ultimately hired a consultant to explore the relationship. However, the major component holding the organizations back from merging was the Cleveland City Council. Each council member represents a CDO due to the division of wards, despite the fact that CDOs provide services in multiple neighborhoods. Because the council members were not interested in the idea of a shared merger, it failed to move forward after the consultant was hired because it ultimately lacked the political support needed to be successful. In 2025, the idea of the two organizations merging was reintroduced as Executive Director transitions occurring at both organizations. However, Cleveland City Council denied the idea again. As a means of proving the benefits of collaboration, the two organizations co-sponsored a Request for Proposal for a consultant to conduct a market study of their shared corridor to determine the direction of future commercial and residential development that aligns with both organization’s goals.
West Euclid Gateway (Detroit, MI)
Central Detroit Christian (CDC) is a faith-based CDO in Detroit committed to empowering people and creating positive opportunities for the community. CDC is concentrated on meeting the needs of low- to moderate-income populations, as well as providing education and employment support. CDC decided to collaborate with 360 Detroit, another CDO that partners with residents to revitalize communities and promote sustainable development. The goal of the collaboration was to implement a multifamily affordable housing project in two phases.503
The second phase, which began in 2024, will result in 20 renovated units that are guaranteed to remain affordable for the next 11 years.504 The units include eight vacant duplexes and a four-plex in Detroit’s Virginia Park neighborhood. This collaboration allowed them to secure funding from the Detroit Housing for the Future Fund, the Michigan State Housing Development Authority (MSHDA), and the Gilbert Family Foundation. It also resulted in multi-year funding for operating support from Enterprise, allowing the two organizations to hire support and programming staff.505 The Virginia Park units are located near community amenities, including the Joseph Walker Recreation Center, the Henry Ford Health System, and more, as illustrated in Figure 14. CDC and 360 Detroit received this funding because the Gilbert Family Foundation wanted to foster inclusive neighborhood development, something neither organization would have been able to provide at the same scale on their own. As the RFP closed in March 2026, there is no impact yet, but two CEOs remain highly motivated to explore a collaboration due to their shared geography and investment in bettering their community.506
Figure 14. Map of community amenities near the Virginia Park neighborhood.507
Relationship Type 2: Partnership
Rationale – Partnership
Partnerships make sense for CDOs in a variety of situations, as was observed in interviews and through synthesis of insights from secondary sources. They can be a natural next step for CDOs who have been collaborating, but are outgrowing the informal nature of the relationship. Partnerships are also well-suited for organizations that want to deliver a specific program or service more effectively, drawing on each other’s experience, location, skills, or access to funding. “Partnerships work best when they are purpose-specific,” Woodruff of COA observed from his experience brokering partnerships between community development and arts organizations.
Partnerships also make sense for CDOs who share a common funder or are a part of a collaborative network, as was observed in several successful partnerships in the field that emerged from a convening. Finally, partnerships can be powerful when piloting a novel or innovative program, particularly when organizations want to avoid bearing the full risk individually.508
Benefits
– Advantages of Partnership
Partnerships come with many benefits for CDOs. When done right, partnerships provide access to the strengths of each CDO while helping cover for weaknesses.509 For example, one partner may bring experience and relationships in housing development, while the other partner contributes trust and community knowledge in the neighborhood of a prospective development. Furthermore, partnerships have been viewed favorably by funders, as was noted by several CDOs interviewed in Detroit.
Considerations – Drawbacks of Partnership
Partnerships, like all types of relationships, work best when they form organically between CDOs, not when they are forced by funders. Bridgespan found that more integrated forms of relationships, which often build from earlier, lighter relationships, were rated by nonprofit CEOs as more effective than funder-driven joint programs that lacked relational foundation.510 By nature of the formal relationship, partnerships require longer commitments from participating organizations, which creates risk if the relationship is strained. Specifically, a strained relationship can cause program collapse, which ultimately hurts the community. Finally, partnerships require more work and time than informal collaboration. CDOs may be able to move faster without a formal governance structure between partners, but the tradeoff is shared understanding and efficiency.511
Case Study – Partnership
Common Grounds Community Land Trust (Detroit, MI)
The Common Grounds Community Land Trust (CLT) is a long-term partnership between GenesisHOPE CDC, MACC Development, and Doing Development Differently in Metro Detroit (D4).512 The focus of the partnership is creating affordable single-family homes and addressing displacement in gentrifying neighborhoods. The main drivers of success for the partnership are regular, mandatory meetings between the four participating organizations and candid articulation of why each organization chooses to be involved. The organizations create budgets jointly, designating one fiduciary lead, and the overall decision-making roles are clearly outlined.513
The Executive Director of GenesisHOPE was spurred to explore partnership over displacement and gentrification concerns. The idea was launched during a CDO Fund travel learning trip where GenesisHOPE was exposed to CDOs across the country—importantly, it was not prompted by a funder.514 Ultimately, a consultant was brought in for strategizing, fundraising, and project management. The resulting impact is the Common Grounds CLT who plans to purchase 10 lots from the Detroit Land Bank to build single-family homes that will remain affordable in perpetuity.
Relationship Type 3: Resource Sharing
Rationale – Resource Sharing
CDOs should consider resource sharing if they feel confident in their mission and ability to provide services, but lack the ability to perform key administrative functions due to funding, leadership transitions, or other internal issues. CDOs who feel pressure to merge should also explore resource sharing as a step in that direction while still maintaining separate governance. To that end, resource sharing is a great option for CDOs who serve distinct neighborhoods, either geographically or demographically, but are otherwise philosophically aligned.515 A full merger may not make sense in these circumstances, but organizations could still benefit from efficiency gains through sharing resources.516
Benefits – Advantages of Resource Sharing
One of the main benefits of resource sharing is saving both money and staff capacity.517 For organizations with a constrained budget, especially during periods of austerity, sharing back office or administrative functions can help save resources. Another benefit of resource sharing is the shared expertise between the two participating organizations. By sharing a staff member or resources, organizations can learn best practices by working together. Finally, being located within proximity of another CDO is a major resource sharing benefit. Simply sharing a space or an adjacent space provides a strong rationale for sharing duplicative functions that may be more efficient when jointly coordinated.
Considerations – Drawbacks of Resource Sharing
It is important for CDOs to consider all potential drawbacks of resource sharing. The first, and arguably the most important, is the potential for job loss. When organizations choose to decrease or outsource functions, existing staff may be at risk.518 While the organizations adjust to the new shared service model, there could be a temporary reduction in services due to restructuring. This can decrease trust in a community that may rely on individual staff members or specific services.519 Finally, the two organizations must build trust between each other. Incorporating frequent interactions not only improves communication, but also fosters appreciation and respect for the competence and reliability of the other CDO.520
Case Studies – Resource Sharing
CDO Shared Services Model (Boston, MA)
Opportunity Communities (OppCo) is a membership-based organization dedicated to building equitable communities of opportunity through strengthening the capacity, efficiency, and performance of local community developers in Boston, Massachusetts.521 OppCo was founded when the Executive Directors of two CDOs came together to discuss challenges with back office support, but did not want to merge because of concerns over
mission drift. As a result, Nuestra Comunidad and The Neighborhood Developers founded OppCo in 2018. In 2022, North Shore CDC joined the company as their third member.522
OppCo operates a shared staffing model. At first, staff worked for OppCo while providing services to its member organizations. Today, certain staff are embedded in the CDOs they originally served as they had deeper relationships and knowledge of the organization and its culture. The membership model is tiered, allowing CDOs to choose between full services or a set of fewer services. Stand-alone services include grant reporting, HR, finance, and more.523 As of recently, CDOs can opt to receive services without being a member, but the ultimate goal of OppCo is to create a pipeline to membership.534 CDOs find OppCo through convenings, event conversations, funders, and word-of-mouth. CDOs reach out to OppCo when they have budget savings from unfulfilled positions, are looking for an alternative consultant, are unable to afford the market salary for a position, or they have a need for a specialized skillset or short-term support for cyclical needs.525
There are several advantages of the OppCo model compared to a model in which multiple organizations share services. The first is that OppCo provides a range of services, structures, and systems (such as software programming). This model allows a CDO to buy into a set of services and skills that they wouldn’t necessarily get by hiring one individual. Some staff are designated to provide services for only one or two organizations so they become very familiar with the CDO and its culture over time and are able to provide more customized service provision. As seen in the snapshot from the OppCo 2025 annual report, revenue growth, homes built, and total assets all increased when CDOs became members of OppCo.526
Bridging Communities Inc., Congress of Communities, Detroit Hispanic Development Corporation, Southwest Detroit Business Association, and Urban Neighborhood Initiatives came together to form a new nonprofit, the Joint Operating Southwest Entity (JOSE). JOSE plans to use additional technical assistance funds to conduct a study of the status and future of Southwest Detroit’s labor market, address housing needs, conduct a feasibility study and site analyses for single-family infill development on land bank parcels, and identify sources of funding for each component of the work.528 JOSE operates as a shared service for the five aforementioned CDOs, bringing unique skills and increasing each organization’s organizational capacity. JOSE is located in District Six where there is a clear overlap of organizations funded by the CDO Fund.529 Given the geographic proximity and overlapping service provision between these CDOs, it was logical for the organizations in this area to collaborate through shared services.
Figure 15. Graphic from Opportunity Communities 2025 Annual Report.537
Relationship Type 4: Restructuring
Rationale – Restructuring
CDOs whose missions, service areas, and organizational cultures are genuinely compatible are suitable candidates for restructuring. CDOs that have already built a collaborative or resource-driven relationship and have developed the necessary trust and operational familiarity makes this integration feasible.531 Additionally, when an executive director is planning for succession, restructuring opportunities can emerge from efforts to improve organizational efficiency.532 CDOs may also be suitable for a restructuring if they have conducted honest internal assessment and reach the conclusion that their current model is unsustainable. CDOs entering the restructuring conversation from a position of relative health, agency, and strategic clarity are best suited to explore a restructuring.
Figure 16: Map of CDO and ECDO service areas.530
Abundance Leadership Consulting outlines six particular situations when a merger makes sense:
1. Growth and Expansion. Two organizations merge to expand their reach, geographic footprint, or program offerings.
2. Mission Expansion or Program Consolidation. Organizations with complementary but distinct missions merge to create more integrated, holistic service delivery.
3. Financial Stability. When organizations face financial challenges, a merger with a stronger partner may ensure mission continuity.
4. Leadership Transition. Mergers can be a tool for navigating leadership changes, particularly when founder-led organizations lack succession plans.
5. Governance Efficiency. Mergers can reduce overhead, improve operational efficiency, and strengthen back office functions.
6. Acquisition of Program-Specific Organizations. Sometimes, larger organizations may acquire smaller ones specifically for programs, staff expertise, or community relationships.533
Benefits – Advantages of Restructuring
There are myriad benefits to restructuring. The first is to preserv a community-oriented mission and community relationships while achieving meaningful efficiency and capacity gains.534 Meaningful restructuring events preserve the soul of place-based CDOs while relieving back-office burdens, allowing for more capacity to conduct community-facing work. Restructuring does not necessarily equate to merging; it can be tiered and customized to fit each CDO’s needs. Restructuring also affords the opportunity to provide new or improved services while reducing costs by sharing resources.535 Nonprofit restructurings have also been found to potentially improve staff benefits by providing HR teams an opportunity to assess current benefits packages and look for ways to improve.536 Finally, restructuring sets CDOs up for future resilience by optimizing resources, funding security, and time spent strategically planning for the future.537
Considerations – Drawbacks of Restructuring
The majority of restructuring considerations are sourced from interviews where restructuring was described as requiring significant upfront investment in infrastructure and due diligence that funders are often unwilling to treat as a standalone grantmaking priority. CDOs are understandably reluctant to cede control over activities tied to their brand, culture, or service provision, which can significantly set the restructuring process back. The due diligence period that must occur at the exploration stage is long and demanding, which can be offputting for the under-resourced organizations that stand to benefit the most.
When restructuring, it is also important for CDOs to be inclusive of community voice and to be cognizant of the racial, socioeconomic, and cultural aspects of the communities they serve because the communities served by CDOs stand to lose the most if restructuring fails; ensuring that crucial services are retained throughout the restructuring process is paramount.
Funders often view mergers and other restructuring events as a cost-saving measure, so when the organizations merge, the funder may view the new organization financially stronger and as a redundant investment. In this light, it is important to consider that when two organizations merge, the size of grants to the new organizations are not larger than donations each grants received independently.538
Preserving identity is a major concern of CDOs, especially smaller organizations that may not boast substantial capital but rely on identity and culture as hallmarks for their service.539 However, it should be noted that “losing identity is not an inherent aspect of a merger.”540 Valuable brands and social capital built up over years can be retained and new names can become programmatic names. The final consideration shared in interviews and substantiated via research, is strong communication to community members and stakeholders is one of the most important considerations of a restructuring.
Restructuring is a unique and intense relationship and it is important to highlight moments when restructuring could pose harm to both communities and CDOs. Due to funding constraints, CDOs are often pushed towards merging without genuine internal buy-in or consideration for service provision by funders looking to reduce duplication in the CDO field. Furthermore, CDOs that are in acute financial distress may not actually be saved by a merger if their financial model is fundamentally flawed; in this case, a restructuring effort with another CDO is likely an unwise decision.
“Rescue mergers” are situations where struggling organizations (either financially or due to size) seek relief by becoming part of a larger organization.541 However, CDOs looking to restructure should proceed cautiously when organizations have fundamentally different political cultures, governance philosophies, or community relationships. These differences often do not subside over time, and entering into a restructuring agreement for perceived funding benefits is unwise. Thinking deliberately about the choice to restructure is important because the financial costs of moving, new marketing or branding, and the loss of funding due to mission change, service shift, or relationship changes can be insurmountable.542 If a restructuring moves forward and without community input, it may result in a fundamental culture mismatch, leading to low staff morale, leadership issues, staff turnover, loss of services for the community, and loss of identity.543
Figure 17. Merger Strategy Diagram, created by the research team544
Case Studies – Restructuring
People’s Housing+ (New Orleans, LA)
People’s Housing+ is the result of a merger between Home by Hand, Crescent City Community Land Trust, and Tulane Canal Neighborhood Development Corporation.545 The relationship is a merger, but technically Home by Hand acquired the other two organizations to create People’s Housing+. This was a highly successful example of a strategic restructuring for several reasons. The conversations began informally in 2020 when the three organizations began working together on a grant application.546 The organizations ultimately explored a partnership before deliberately heading towards a merger—this is one of the recommended best practices for CDOs looking to explore a relationship with another CDO.547
Another recommendation is that CDOs engage in succession planning. Crescent City CLT recognized that their organization’s model was unsustainable and they included a merger in their strategic plan.548 The executive director of the Crescent City CLT was one of the driving forces behind the merger. This is remarkable because one of the main reasons mergers fail is that executive directors struggle to relinquish power.549
Once a consultant was hired, the organizations leaned into the process, spending time deliberating the benefits and consequences of all relationship options. Once the relationship progressed, it became clear that a merger was the best option. The three organizations were fortunate to receive funding to explore the merger and plan for it. Once the paperwork and planning stages were complete, the work was still far from over. There were plenty of funders funneling resources into the merger when it was a novel idea, but once the novelty wore off, funding dissipated. The implementation phase requires intense resources due to hiring frenzies, IRS documentation, and closing and opening bank accounts, which are cited as one of the most time and resource consuming phases of the merger.550
As a result, a staff member from People’s Housing+ reports that there was a strong threat of mission creep for the organizations that combined to create People’s Housing+, which may have been avoided if there was ample funding to implement the merger. Through this resource-intensive implementation period, a staff member from People’s Housing+ reports that the merger was further threatened as conflicts arose around mission priorities, with each of the original organizations advocating for their own priorities. This source of friction could have proven detrimental to merger and could have been avoided if there was continued funding of the implementation phase. Despite this, however, People’s Housing+ was able to work through these challenges, resulting in a stronger organization that provides support at all stages of wealth building, not just affordable housing development. The major lesson from this merger is that organizations should attempt to spread resources between all phases of the merger.
Jefferson East Business Association (Detroit, MI)
In 2009, Jefferson East Business Association (JEBA) and Creekside CDC explored a merger, which was ultimately not implemented.551 Eastern Michigan University (EMU) provided funding to Creekside CDC to explore a merger with JEBA. During the process, the two organizations found that they each possessed vastly different cultures and collectively decided against pursuing a merger.
The major takeaway from this merger attempt is that culture and mission alignment are paramount. While it is also important for executive directors to be willing to relinquish some of their goals or vision to find compromise, mission alignment is crucial for future service
provision and to maintain trust with community members.552 If these criteria are impossible, the organizations will likely enter into a tumultuous relationship and the merger will not succeed.
Key Takeaways: How Funders and Other Ecosystem Participants can Support CDOs in Forming Strategic Relationships
The fourth research objective of this scenario asks: How can funders, intermediaries, and other stakeholders best support CDOs who are exploring or implementing a strategic relationship? The role of external actors in shaping strategic relationship processes is one of the most consequential dynamics in this scenario. COA’s Staying Rooted, Moving Forward discussions identified two key risks in the consolidation landscape: poorly executed mergers that erase community voice, and “bad actors” who exploit distressed organizations.553
Bridgespan’s research adds a structural dimension to this concern, finding that only a small pool of funders is deeply committed to supporting formal collaborations, and that funders and nonprofits frequently misunderstand each other’s expectations around the costs and timelines involved.554 La Piana Consulting’s toolkit further cautions that even well-intentioned collaboration is not resource-neutral, it demands real capacity from organizations, even when grant funding is available to offset costs.555 Against this backdrop, CDOs must feel that they genuinely control their strategic futures if consolidation efforts are to produce durable, community-rooted outcomes rather than funder-driven reorganizations. This research objective therefore centers the CDO’s perspective, asking what kind of support enables CDOs to make sovereign decisions about their organizational futures on their own terms.
For funders, intermediaries, and other actors in the community development ecosystem seeking to support CDOs in forming strategic relationships, several themes emerged consistently in interviews with CDOs. The following points reflect these perspectives and are presented as guidance from CDOs to the funding community.
Relationship Building Requires Resources
Whether initiating collaboration or exploring a merger, spending time strategizing and building relationships ultimately takes staff and board members away from their core responsibilities. This comes with both opportunity and cost. Attending conferences, networking events, and convenings is a critical but expensive investment for many CDOs, particularly ones that could stand to benefit most from strategic relationships. Furthermore, investment is critical throughout the process. Several interviews with CDO executives and board members referenced the importance of funder support from due diligence through implementation.
CDOs Must Control Their Own Destiny
As representatives of their communities, many of which are historically disinvested, it is critical for CDOs to maintain sovereignty in their decision about whether and when to pursue highly integrated relationships such as mergers. Not only are mutually agreed upon mergers more likely to succeed, but they also uphold the dignity of the CDO and the residents it serves to make its own decisions about its future.556 This was explicitly and implicitly corroborated by multiple interviewees, ranging from CDOs to intermediaries to
resource providers. The best mergers came about naturally (e.g., not forced by funders), and several mergers that failed or went poorly were considered unnatural (e.g., forced or strongly suggested by funders).557
Furthermore, due to their inherent place-based mission, CDOs must be treated differently than other types of nonprofits, who may be focused on broader geographic regions or are non-geographic in nature.
Any Type of Relationship Should be Celebrated, not Just Mergers
A common pain point amongst CDOs interviewed was feeling pressure to merge, without exploring other types of relationships first. Through conversations with multiple CDOs who have attempted mergers, it became clear that mergers are not beneficial in all situations. Funders should encourage and celebrate any relationship between CDOs, because an effective collaboration is going to produce better results for communities than a failed merger. Often, successful mergers started with a less integrated relationship and research revealed that starting lower on the integration scale and working up over time leads to more productive collaborations.
Rationalizing Funding Shouldn’t be the Primary Goal of Strategic Relationships
The primary goal of strategic relationships should be increasing impact on the ground, not necessarily reducing costs. Building relationships often requires resource capacity, as leaders need to spend additional time developing and nurturing those relationships. While funders sometimes assume that merging two organizations will reduce funding redundancies, this is misguided. As La Piana says:
“One of the most common myths about nonprofit mergers is that they’re a way to achieve significant cost savings. While a merger may result in some reduction in administrative costs, it seldom results in the kind of cost reductions seen in the for-profit sector—at least not in the short term. Ultimately, it is useful to think about nonprofit partnerships overall as the opportunity not to do more with less, but to do more with more.”558
Strategic Relationships Should be Fostered in Good Times
Periods of crisis are generally not conducive to forming highly integrated organizational relationships. As the level of integration increases, so do time demands on executive leadership teams and boards. While collaborations can generally be executed at the staff level, partnerships, resource sharing, and restructuring (in that order) require increasing amounts of executive time due to escalating levels of strategic, financial, and legal ramifications of those relationship types. While resource sharing or restructuring may be pursued out of necessity, they are more effective when organizations are operating under stable conditions—when leadership isn’t focused on mitigating crises. Interview findings suggest that the most successful resource sharing and restructuring efforts are achieved not out of necessity, but out of opportunity.
Trusted Intermediaries and Third Parties are Helpful Facilitators
Intermediaries can play an important strategic role in facilitating relationships between CDOs. However, funders should not rely solely on intermediaries to initiate and manage these efforts. While funders often use intermediaries to “help them get closer to communities,” an improved relationship is largely dependent on the specific intermediary, and funders should not rely on intermediaries to communicate about topics that would be best communicated
from them directly.559 For example, foundations can take on the additional role of “cheerleader” by sharing grantee stories to attract anchor investors and to facilitate holistic engagement that could advance the mission.560 Examples from Detroit show that investing in intermediaries can help create opportunities for collaboration among CDOs.
Discussion & Reccomendations
Scenario 1: Service Collapse and Inequities Between ‘Earners’ and ‘Non-Earners’ Recommendations
For Intermediaries & Resource Providers:
Identify and address the context-specific barriers to earned revenue. Conduct thorough gap analyses of the real estate market in different communities, paying specific attention to locational differences. From these analyses, deploy strategies that are tailored to community-specific needs in order to facilitate increased CDO-led development and potential increases in, therefore, access to earned revenue. These strategies may include, but are not limited to, technical assistance focused on building CDO’s development capacity, flexible grants or lines of credit to subsidize funding gaps, and professional development initiatives to strengthen supporting sectors such as contractors.
Evaluate and plan for organizational and ecosystem resilience regularly. Prepare for organizational threats, such as financial, social, and environmental shocks, preemptively. The ability for both CDOs and their supporting ecosystems to forecast, withstand, and recuperate from periods of uncertainty and crisis requires a comprehensive approach to capacity building, covering a range of activities to minimize vulnerabilities and capitalize on strengths. Resilience is not simply a response to crisis, it is the longevity that results from the active and ongoing process of strategic organizational planning.
For CDOs:
Diversify and stabilize funding sources.
Develop a balanced revenue model that combines earned income, grants, and philanthropic support, which can be facilitated through strategic expansion of programmatic offerings. Additionally, strong financial management and oversight practices, such as maintaining a detailed budget and a financial reserve, are critical to lasting financial sustainability.
Invest in staff capacity and retention.
Build teams with both the technical expertise and cultural competence needed to carry out core functions and create long-term stability through competitive compensation, professional development, and tactics that preserve institutional knowledge. Staff should be strategically deployed to roles that best leverage their strengths and maximize program impacts.
Strengthen leadership and governance structures.
Ensure CDOs are guided by well-defined, place-based missions and skilled, communityresponsive leadership. Boards should be composed of capable and diverse individuals, with representation from the communities in which they serve. Engaging in succession planning will also prove critical for maintaining continuity and directing organizations through periods of change.
Leverage partnerships and community relationships. Engage in knowledge sharing, coalition building, and build strategic partnerships with other organizations, funders, and public agencies to expand capacity and access resources. Establishing trust within the community and acting as their advocates in the political arena further facilitates organizational capacity over time.
Scenario 2: Financial Innovation and Hybrid Capital Recommendations
Diversify Funding Streams
Role of Intermediaries & Resource Providers
Support CDOs with flexible, multi-year revenue streams effectively, and encourage blended financing approaches rather than siloed program funding to reduce administrative fragmentation and strengthen long-term financial stability.
Role of CDOs
Develop a diversified and coordinated financial portfolio that includes grants, earned revenue programs, capital recycling tools, and shared service agreements. Strategically align and braid sources so that each stream addresses different financial risks and organizational needs.
Leverage Cross-Sector Funding Model
Role of Intermediaries & Resource Providers
Adopt financing models that link financing to measurable social outcomes, enabling housing and community development interventions to access non-traditional capital by demonstrating cross-sector impact and shared cost savings.
Role of CDOs
Build partnerships across housing, healthcare, finance, and social service sectors to access cross-sector financing opportunities, and demonstrate how housing and community development outcomes contribute to broader system level benefits such as improved health outcomes and reduced public expenditure.
Investment in Organizational Capacity
Role of Intermediaries & Resource Providers
Recognize administrative and operational infrastructure as essential investment rather than overhead, and deploy financial tools to provide flexible, patient capital that strengthens internal systems. Invest in core operation as a foundation for impact, moving beyond projectspecific funding to support the full cost of delivering results.
Role of CDOs
Prioritize internal capacity-building by strengthening financial management systems, human resources infrastructure, compliance processes, and grant tracking mechanisms to build long-term resiliency and effectively manage complex funding portfolios.
Strengthen Financial and Technical Literacy
Role of Intermediaries & Resource Providers
Fund technical assistance, training programs, and capacity-building partnerships with universities, financial institutions, and intermediaries to ensure CDOs are equipped to manage, structure, and evaluate innovative financial tools effectively.
Role of CDOs
Invest in internal capacity building around financial literacy, underwriting, risk management, legal structuring, impact evaluation systems, and other necessary skills to effectively engage with complex financial instruments.
Develop Shared Regional Resources Pool
Role of Intermediaries & Resource Providers
Invest in regional financing hubs and shared infrastructure systems that reduce transaction costs, distribute risk, and provide centralized legal, financial, and technical support, enabling broader access to advanced financing tools.
Role of CDOs
Collaborate to form regional coalitions and shared platforms that pool projects, financial pipelines, and technical expertise, enabling smaller organizations to access complex financial instruments that would otherwise be inaccessible individually.
Scenario 3: Consolidations and Convenings Recommendations
For Funders and Intermediaries:
Utilize clear and consistent terminology.
Utilize uniform language to articulate options for collaboration or partnership to reduce ambiguity and improve communication among stakeholders. Terms like “merger” may carry negative connotations that can influence negotiations. The Strategic Relationship Framework provides a clear understanding of various terminology for effective communication.
Avoid initiating mergers prematurely.
Consider a wide spectrum of relationship types for CDOs, beginning with collaboration or partnership. Mergers are not always the best choice for the organizations or for the communities they serve, as they require deep levels of philosophical, cultural, and strategic alignment from leadership and boards.
Invest in convening infrastructure
Provide dedicated resources for convening (e.g., intermediaries, conferences, alliances, coalitions, working groups) where CDOs can identify areas of shared strength and opportunities. Many successful relationships are formed through these convenings.
Fund the restructuring process across its entire lifespan.
Invest in third-party support for restructuring from the beginning (e.g., due diligence) all the way through post-deal implementation support to minimize risk of failure. While resources are often plentiful in the exploration phase, the post-merger implementation phase is often underfunded, despite increased complexity and lost organizational knowledge.
Focus on increasing impact, not rationalizing grant dollars.
Strategic relationship-building should center increases in impact that can result from combined strength, rather than cutting costs or reducing granted funds. “Doing more with less” is not achievable through mergers, and instead of “doing the same with less,” the goal should be to “do more with more.”
For CDOs:
Use strategic relationships to expand mission impact.
Strategic relationships can expand mission impact by increasing capacity, providing access to more resources, and expanding reach, but it is important for CDOs to ensure that the mission remains centered throughout the relationship lifespan. Maintain commitment to the organization’s mission, using strategic relationships as a way to bolster, not compromise, them.
Center community voice.
Ensure residents are considered and engaged when pursuing different types of relationships with other CDOs, especially mergers. Relationships absent of community voice can result in more harm than good, and can disenfranchise communities that are most in need of services.
Consider the Strategic Relationship Framework in succession planning.
Consider strategic relationships, such as resource sharing and restructuring, in succession planning to promote mission longevity and continued service provision during times
of natural organizational transition. Prioritize mission continuity over organizational preservation.
Start small and scale (if appropriate).
Begin by collaborating or partnering with another CDO as a way to build trust, test compatibility, and determine whether a more integrated relationship would be worthwhile. A great place to start is by participating in convening infrastructure with other CDOs.
Conclusion
Conclusion
In many communities across the United States, community development organizations are the cornerstone of their neighborhoods. Since their emergence in the 1960s as a response to widespread disinvestment, CDOs have retained their core mission of supporting vulnerable and underserved neighborhoods. These communities rely on CDOs to provide critical services, including affordable housing, corridor development, community planning, workforce development, youth programs, and much more.561
Currently, the future of these invaluable organizations and the services they provide is characterized by one overarching theme: uncertainty. This uncertainty, driven by the reduction of funding, resources, and support from government agencies and philanthropic organizations, threatens the stability of the community development field as a whole. With the provision of key services at risk, this period of financial austerity comes with serious equity implications, diverting crucial resources away from some of the most vulnerable communities in the country—those which have been made vulnerable through this country’s long history of disinvestment driven by institutionalized racism and classism.
Though these times present significant challenges, they also provide an opportunity for CDOs, intermediaries, and funders to reimagine their core functions, financing, and relationships with one another to build a stronger and more resilient ecosystem of community development. Through key strategies such as investments in staff and organizational capacity, diversification of funding streams and tools, and the strategic development of partnerships, stakeholders across the community development field can fortify the ecosystem through increased adaptability and knowledge sharing.
These recommendations can be leveraged by COA and the wider field to prepare for and recover from periods of uncertainty and austerity. However, they only represent one part of the path forward. Wider actions, such as sustained advocacy for the field to secure funding and political support and continued research of community development activities are essential for the ongoing function of the field and service to vulnerable communities. This report is one response to the wider call to action that must be answered in order to strengthen the field of community development—not only for this moment of crisis, but to ensure the long-term success of this critical ecosystem.
Endnotes
1. Community Opportunity Alliance (COA). (2025A). What We Do. Community Opportunity Alliance. Retrieved April 28, 2026, from https://www.communityopportunityalliance.org/-whatwe-do
2. Community Opportunity Alliance, 2025A.
3. Community Opportunity Alliance (COA). (2025B). Community Opportunity Alliance: Staying Rooted, Moving Forward. Community Opportunity Alliance.
4. Walker, C. (2002). Community development corporations and their changing support systems. Urban Institute. p. 12-13.
5. Community Opportunity Alliance, 2025A.
6. Community Opportunity Alliance. (2025C). Who We Are. Community Opportunity Alliance. https://www.communityopportunityalliance.org/-who-we-are
7. Community Opportunity Alliance, 2025A.
8. Community Opportunity Alliance. (2025D). Grounding Values In Research. https://www. communityopportunityalliance.org/-grounding-values-in-research
9. Community Opportunity Alliance, 2025B.
10. Vidal, A. C. (1995). Reintegrating disadvantaged communities into the fabric of urban life: The role of community development. Housing Policy Debate, 6(1), 169. https://doi.org/10.1080/1 0511482.1995.9521185
11. Woodruff, F. & Walker, C. (2023). Community economic organizations and their activities. National Alliance of Community Economic Development Associations (NACEDA). https:// commoppall.memberclicks.net/assets/gv/MoneyMeetsCommunity/activities.pdf. p. 2.
12. Woodruff & Walker. (2023). p. 5.
13. Walker, 2002. p. 6.
14. von Hoffman, A. (2012). The past, present, and future of community development in the United States. In Investing in What Works for America’s Communities. Joint Center for Housing Studies Harvard University. p. 19.
15. Woodruff, F. (2023). What Is a Community Development Corporation? Nonprofit Quarterly. https://nonprofitquarterly.org/what-is-a-community-development-corporation/
16. Woodruff. (2023).
17. Woodruff. (2023).
18. von Hoffman. (2012).
19. Frisch, M., & Servon, L. J. (2006). CDCs and the changing context for urban community development: A review of the field and the environment. Community Development, 37(4), 88–108. https://doi.org/10.1080/15575330609490197. p. 89.
20. Walker, 2002, pp. 12-13.
21. Vidal. (1995). p. 208.
22. Craig, G. (2007). Preface: Defining community and its development. Journal of Community Practice, 15(1-2), xxiii-xxvii. https://doi.org/10.1300/J125v15n01_a. p. xxiii.
23. Vidal. (1995). p. 172.
24. Frisch and Servon, 2006, p. 91).
25. Community Opportunity Alliance. (2025E). Who We Are. Community Opportunity Alliance. https://www.communityopportunityalliance.org/-who-we-are
26. Scally, C. P., Curran-Groome, W., Kort, A., Kumari, S., & Lo, L. (2023). The state of communitybased development organizations. Urban Institute.
27. Walker, 2002.
28. Frisch and Servon, 2006, pp. 92-93.
29. Walker, 2002, pp. 1, 34.
30. Walker, 2002, p. 40.
31. Enterprise Community Partners. (2026A). Strengthening organizations, strengthening communities: Lessons from phase II of the Detroit CDO and ECDO Funds. Enterprise Community Partners. https://www.enterprisecommunity.org/sites/default/files/2026-04/2026Enterprise-CDO-and-ECDO-PhaseII-Evaluation-Report.pdf
32. Heron, K. (2021, June 11). Eight Black-led community development organizations in New Orleans share $750,000 from new foundation-backed fund. Kresge Foundation. https:// kresge.org/news-views/eight-black-led-new-orleans-nonprofits-share-750000-from-newfoundation-backed-fund/
33. Enterprise Community Partners, 2026A.
34. Heron, K., 2021.
35. Enterprise Community Partners, 2026A.
36. Walker, 2002, p. 42.
37. Walker, 2002, p. 42.
38. Walker, 2002, p.42.
39. Rumbach, A., McTarnaghan, S., Curran-Groome, W., & Lloyd, K. (2025, August 13). Disasters and the Gulf Coast, 20 years after Hurricane Katrina. Urban Institute. https://www.urban.org/ stories/disasters-gulf-coast-katrina
40. Williams, S., & Nash, K. (2023). A restorative framework for funding equitable community and economic development in Detroit. Detroit Future City. https://detroitfuturecity.com/wpcontent/uploads/2023/05/NEW_Restorative-Framework-for-Funding-Equitable-Community. pdf?pid=8675
41. Barrett, M. (2022). Only 6% of Detroit’s pandemic relief has been spent. See what’s next. BridgeDetroit. BridgeDetroit. https://www.bridgedetroit.com/only-6-of-detroits-pandemicrelief-has-been-spent-see-whats-next/
42. American Planning Association (APA). (2025, May 7). Trump budget proposes cuts to key housing, community development programs. American Planning Association. https:// www.planning.org/blog/9310444/trump-budget-proposes-cuts-to-key-housing-communitydevelopment-programs/
43. Barrett, 2022.
44. Transportation, Housing and Urban Development, and Related Agencies (THUD) Appropriations for FY2025. (2026, April 28). https://www.congress.gov/crs-product/R48253
45. Goodwin, L., Sotomayor, M., & Beggin, R. (2025, October 13). Congress is losing its grip on the power to spend Americans’ money. The Washington Post. https://www.washingtonpost. com/politics/2025/10/13/congress-spending-shutdown-budget-trump-vought/
46. Axel-Lute, M. (2025, July 31). Some NeighborWorks members struggle under new funding schedule. Shelterforce. https://shelterforce.org/2025/07/31/some-neighborworks-membersstruggle-under-new-funding-schedule/
47. American Planning Association (APA). (2023). House bill maintains CDBG, slashes funding for zoning reform. American Planning Association. Retrieved April 28, 2026, from https://www. planning.org/blog/9314488/house-bill-maintains-cdbg-slashes-funding-for-zoning-reform/
48. Dobosz, M. (2026). Beyond the mega-gift. Stanford Social Innovation Review, 24(2), 46–53. https://doi.org/10.48558/EN8A-R095
49. Dobosz, 2026.
50. Dobosz, 2026.
51. Han, X., Hungerman, D. M., & Ottoni-Wilhelm, M. (2024). Tax Incentives For Charitable Giving: New Findings From The TCJA (Working Paper No. 32737; NBER Working Paper Series). National Bureau of Economic Research. https://doi.org/10.3386/w32737.
52. Van Steenburg, E., Anaza, N. A., Ashhar, A., Barrios, A., Deutsch, A. R., Gardner, M. P., Priya, P., Roy, A., Sivaraman, A., & Taylor, K. A. (2022). The new world of philanthropy: How changing financial behavior, public policies, and COVID-19 affect nonprofit fundraising and marketing. Journal of Consumer Affairs, 56(3), 1079–1105. https://doi.org/10.1111/joca.12461
53. Osili, U., & Han, X. “Jimmy.” (2025, January 28). Donors are down, but dollars are up – how US charitable giving is changing. The Conversation. https://doi.org/10.64628/AAI.ujp5ma5y5
54. Dorthy A. Johnson Center for Philanthropy. (2026). 11 trends in philanthropy for 2026. Johnson Center for Philanthropy. https://johnsoncenter.org/blog/11-trends-in-philanthropyfor-2026/
55. Dorthy A. Johnson Center for Philanthropy, 2026.
56. Roberts, A. S., Alec Glassford, Ash Ngu, Brandon. (2013, May 9). Nonprofit Explorer. ProPublica. https://projects.propublica.org/nonprofits/
57. Roberts et al., 2013.
58. Tomasko, L., Martin, H., Fallon, K., Kim, M., Faulk, L., & Boris, E. T. (2025). How government funding disruptions affected nonprofits in early 2025: Nationally representative findings from the nonprofit trends and impacts study. Urban Institute. https://www.urban.org/research/ publication/how-government-funding-disruptions-affected-nonprofits-early-2025
71. Bedayn, J. (2025). Trump administration throws hundreds of affordable housing projects into limbo after contract cuts. AP News. https://apnews.com/article/affordable-housingtrump-doge-hud-funding-af0cadf5238f1654d723350cc2e8e0f7
72. Bedayn, 2025.
73. Enterprise Community Partners. (2025A). Enterprise responds to proposed termination of Section 4, technical assistance grants. Enterprise Community Partners. https://www. enterprisecommunity.org/news/enterprise-responds-proposed-termination-section-4technical-assistance-grants
74. Scally, C. P., Curran-Groome, W., Kort, A., Kumari, S., & Lo, L. (2023). The state of communitybased development organizations: Results from the sixth national census of communitybased development organizations. Urban Institute. https://www.urban.org/research/ publication/state-community-based-development-organizations
75. Walker, 2002.
76. Lowe, J. S. (2008). Limitations of community development partnerships: Cleveland Ohio and Neighborhood Progress Inc. Cities, 25(1), 37–44. https://doi.org/10.1016/j.cities.2007.11.005
77. The State of Ohio. (2026). Ohio Housing Trust Fund. Department of Development. https:// development.ohio.gov/community/community-resources/ohio-housing-trust-fund
78. Cleveland Documenters. (2022). Community Development Block Grants: What are they? How do they work? Signal Cleveland. https://signalcleveland.org/a-guide-to-communitydevelopment-block-grants-cdbgs/?utm_source
79. City of Cleveland. (2010). Philanthropy grows over the decades in Cleveland: a timeline. City of Cleveland. https://www.cleveland.com/philanthropy/2010/12/philanthropy_grows_and_ branch.html
80. City of Cleveland, 2010.
81. Fidelity Charitable. (2023). 2023 geography of giving: Most charitable U.S. cities. Fidelity Charitable. https://www.fidelitycharitable.org/insights/2023-geography-of-giving.html
82. Howard, J. (April 21, 2025). How Ohio gives 2025. Philanthropy Ohio. https://www. philanthropyohio.org/news/how-ohio-gives-2025
83. Howard, 2025.
84. Howard, 2025.
85. Stewart, S. (2025). 2025 vs 2026: Should you move now or wait on interest rates? Keller Williams. https://www.stewartteamhomes.com/2025-vs-2026-should-you-move-now-or-waiton-interest-rates.
86. Mendez, P. (2015). Community Development through people and place. University of Michigan. https://hdl.handle.net/2027.42/116282
87. Building the Engine of Community Development in Detroit. (2026). 7 system elements. Building the Engine of Community Development in Detroit (BECDD). https:// detroitcommunitydevelopmentengine.com/7systemelements/
88. Mendez, 2015.
89. Enterprise Community Partners. (2023). Foundational Change: How the Detroit CDO Fund is transforming the ecosystem for BIPOC-led and BIPOC-serving nonprofits. Enterprise Community Partners. https://www.enterprisecommunity.org/sites/default/files/2023-08/2023Detroit-CDO-Fund-Report-Fund.pdf
90. Mallach, A. (2018). The divided city: Poverty and prosperity in urban America. Island Press.
91. Community Development Advocates of Detroit (CDAD). (2023). Guide to equitable use of CDBG in the City of Detroit. Community Development Advocates of Detroit (CDAD). https://cdad-online.org/wp-content/uploads/2023/06/Equitable-Use-of-CDBG-Final-ReportApril-2023-.pdf
92. Mallach, 2018.
93. Mallach, 2018.
94. Whyte, L. E. (n.d.). Philanthropy keeps the lights on in Detroit. Philanthropy Roundtable. Retrieved April 29, 2026, from https://www.philanthropyroundtable.org/magazine/ philanthropy-keeps-the-lights-on-in-detroit/
95. Mallach, 2018.
96. Dandridge, A. (2026). Five years on: Rocket Community Fund and Gilbert Family Foundation share progress on $500 million commitment to building opportunity in Detroit neighborhoods. Gilbert Family Foundation. https://gilbertfamilyfoundation.org/news-andstories/five-years-in-rocket-community-fund-and-gilbert-family-foundation-share-progresson-500-million-commitment-to-building-opportunity-in-detroit-neighborhoods/
97. Dandridge, 2026.
98. Eller, T. (2013, January). Subject focus: Poverty and charity in turn-of-the-century Detroit. Walter P. Reuther Library Wayne State University. https://reuther.wayne.edu/node/9957
99. Owens, R. (2016, September 4). Detroit’s complex legacy in the National Florence Crittenton Mission. Rudy Owens’ Blog. https://rudyowensblog.com/2016/09/03/detroitscomplex-legacy-in-the-national-forence-crittenton-mission/
100. CCS Fundraising. (2024). 2024 Metro Detroit philanthropic landscape. CCS Fundraising. https://www.impact100oaklandcounty.org/wp-content/uploads/2025/06/CCS-DetroitLandscape-2024_Presentation-Version.pdf
101. Realtor.com. (2026A). Real Estate Market Trends in New Orleans, LA: Prices Fall. Realtor. Com. https://www.realtor.com/news/local/new-orleans-la/real-estate-market-new-orleans-la-
march-2026/
102. McBride, D. (2016). Urban power and community development in the ‘world risk society’: post-Hurricane Katrina New Orleans (usa). Perspectives on Global Development and Technology, 15(1–2), 128–142. https://doi.org/10.1163/15691497-12341379
103. Heron, K. (2021, June 11). Eight Black-led community development organizations in New Orleans share $750,000 from new foundation-backed fund. Kresge Foundation. https:// kresge.org/news-views/eight-black-led-new-orleans-nonprofits-share-750000-from-newfoundation-backed-fund/
104. Heron, 2021.
105. Gotham, K. (2014). Reinforcing inequalities: The impact of the CDBG program on PostKatrina Rebuilding. Housing Policy Debate, 24(1). https://doi.org/10.1080/10511482.2013.840666
106. Greater New Orleans Foundation. (2024). About The Foundation. Greater New Orleans Foundation. Retrieved April 29, 2026, from https://www.gnof.org/who-we-are/about-gnof/
107. Feoli, L. (2020). Katrina and the philanthropic landscape in New Orleans. 32(1). https:// scholarworks.umb.edu/nejpp/vol32/iss1/19/
108. Leak Francis, H. (2025, August 22). Resourcing resilience and prosperity: Philanthropic investment in New Orleans’ nonprofit sector after Hurricane Katrina. Brookings Institute. https://www.brookings.edu/articles/resourcing-resilience-and-prosperity-philanthropicinvestment-in-new-orleans-nonprofit-sector-after-hurricane-katrina/
109. Leak Francis, 2025.
110. Leak Francis, 2025.
111. Leak Francis, 2025.
112. Leak Francis, 2025.
113. Leak Francis, 2025.
114. Realtor.com. (2026B). Real Estate Market Trends in Detroit, MI: Prices Fall. Realtor.com. https://www.realtor.com/news/local/detroit-mi/real-estate-market-detroit-mi-march-2026/
115. Pooley, K. B. (2014). Using Community Development Block Grant dollars to revitalize neighborhoods: The impact of program spending in Philadelphia. Housing Policy Debate, 24(1), 172–191. https://doi.org/10.1080/10511482.2013.851100
116. Walliser-Wejebe, M. (2020, August 25). The Pennsylvania Neighborhood Assistance Program uses state incentives to drive neighborhood investment. Greater Ohio Policy Center. https://www.greaterohio.org/blog/2020/8/25/the-pennsylvania-neighborhood-assistanceprogram-uses-state-incentives-to-drive-neighborhood-investment
118. Turku Topa, M. (2025). The hidden force behind Philadelphia’s growth is nonprofits. Capital Analytics Associates. https://capitalanalyticsassociates.com/the-hidden-force-behindphiladelphias-growth-is-nonprofits/
119. Turku Topa, 2025.
120. Fidelity Charitable. (2023). 2023 Geography of Giving (p. 14). Fidelity Investments Charitable Gift Fund. https://www.fidelitycharitable.org/content/dam/fc-public/docs/ insights/2023-geography-of-giving.pdf
121. Twombly, E. C., Vita, C. J. D., & Garrick, N. (2000). Mapping nonprofits in Philadelphia, Pennsylvania. Center on Nonprofits and Philanthropy (CNP) at the Urban Institute. https:// www.urban.org/sites/default/files/publication/62581/410015-Mapping-Nonprofits-inPhiladelphia-Pennsylvania.PDF
122. Philadelphia Association of Community Development Corporations (PACDC). (n.d.). Member List. PACDC. https://pacdc.org/members/member-list/
123. Grantmakers of Western Pennsylvania, Northeastern Pennsylvania Grantmakers Alliance, and Philanthropy Network Greater Philadelphia. (2023). Philadelphia Foundation stats. https://pennsylvania.foundationcenter.org/dashboard/year/2023/region/philadelphia-area/tab/ overview
124. Grantmakers of Western Philadelphia et al., 2023.
125. Santarelli, M. (2025, September 3). Philadelphia housing market: Trends and forecast 2025-2026. Norada Real Estate Investments. https://www.noradarealestate.com/blog/ philadelphia-real-estate/
126. Woodruff and Walker, 2023, p. 2.
127. Community Opportunity Alliance, 2025B.
128. Lo, L., Scally, C. P., Lecy, J., & Kumari, S. (2022). The financial health of community-based development organizations: State and Metropolitan Statistical Area fact sheets. Urban Institute. https://www.urban.org/research/publication/financial-health-community-baseddevelopment-organizations-state
129. Scally et al., 2023, p. viii.
130. Lo et al., 2022.
131. Axel-Lute, J. B., Miriam. (2016). Getting beyond the developer fee. Shelterforce. https:// shelterforce.org/2016/07/25/getting-beyond-the-developer-fee/
132. Adger, W. N. (2000). Social and ecological resilience: Are they related? Progress in Human Geography, 24(3), 347–364. https://doi.org/10.1191/030913200701540465
133. Cafer, A., Green, J., & Goreham, G. (2022). A community resilience framework for community development practitioners building equity and adaptive capacity. In M. A. Brennan, R. Phillips, N. Walzer, & B. D. Hales (Eds.), Community Development for Times of Crisis. https://doi.org/10.4324/9781003212652
134. Matarrita-Cascante, D., Trejos, B., Qin, H., Joo, D., & Debner, S. (2017). Conceptualizing community resilience: Revisiting conceptual distinctions. Community Development, 48(1), 105–123. https://doi.org/10.1080/15575330.2016.1248458
135. Cavaye, J., & Ross, H. (2022). Community resilience and community development: What mutual opportunities arise from interactions between the two concepts? In Community Development for Times of Crisis. Routledge. https://doi.org/10.4324/9781003212652
136. Scally et al., 2023.
137. Scally et al., 2023.
138. Scally et al., 2023.
139. Scally et al., 2023.
140. Scally et al., 2023.
141. Scally et al., 2023.
142. Scally et al., 2022.
143. Scally et al., 2022.
144. Scally et al., 2023.
145. Community Development Advocates of Detroit. (2023). Community development reflection report. Community Development Advocates of Detroit.
147. Glickman, N. J., & Servon, L. J. (1998). More than bricks and sticks: Five components of community development corporation capacity. Housing Policy Debate, 9(3), p. 501–505. https://doi.org/10.1080/10511482.1998.9521306
148. Glickman & Servon, 1998, pp. 506.
149. Glickman & Servon, 1998, pp. 506-511.
150. Glickman & Servon, 1998, pp. 511.
151. U.S. Economic Development Administration. (2026). Key definitions. U.S. Department of Commerce. EDA | U.S. Economic Development Administration. https://www.eda.gov/
performance/key-definitions
152. Glickman & Servon, 1998, pp. 510–511.
153. Glickman & Servon, 1998, pp. 508.
154. Jefferson East, Inc. (2026A). Vision & Our Neighborhoods. Jefferson East, Inc. https://www. jeffersoneast.org/neighborhoods
155. Jefferson East, Inc. (2026B). Programs & Services. Jefferson East, Inc. https://www. jeffersoneast.org/neighborhoods
156. Jefferson East, Inc., 2026B.
157. Zaniewski, A. (2023). DNEP Partner Profile: Jefferson East Inc. fosters growth in five neighborhoods. University of Michigan Center on Finance, Law & Policy. https:// financelawpolicy.umich.edu/news/2023/dnep-partner-profile-jefferson-east-inc-fostersgrowth-five-neighborhoods
158. Zaniewski, 2023.
159. Zaniewski, 2023.
160. Zaniewski, 2023.
161. Seybert, A. (2018). Social Investment Practice Case Study: East Jefferson Development Corporation (EJDevCo). The Kresge Foundation. https://kresge.org/wp-content/ uploads/2020/06/east_jefferson_development_corp.pdf. p. 1.
162. East Jefferson Development Corp. (2021). Who We Are. East Jefferson Development Corp. https://www.ejdevco.com/
163. Seybert, 2018.
164. Glickman & Servon, 1998, p. 512.
165. Glickman & Servon, 1998, p. 512-518.
166. Mercado, A. (2024, June 14). Defining community development in order to fund it. Shelterforce. https://shelterforce.org/2024/06/14/defining-community-development-in-orderto-fund-it/
167. Mercado, 2024.
168. Grandmont Rosedale Development Corporation. (2024A). What We Do. Grandmont Rosedale Development Corporation. https://www.grandmontrosedale.com/what-we-do
169. Grandmont Rosedale Development Corporation, 2024A.
170. Grandmont Rosedale Development Corporation. (2024B). Board Members. https://www.
grandmontrosedale.com/board-members
171. Kenderes, B. (n.d.). Resident Task Force Manages Neighborhoods Through Thick and Thin (pp. 1–6). Grandmont Rosedale Development Corporation. https://ncst.org/wp-content/ uploads/Resident-Task-Force-Manages-Neighborhoods-Through-Thick-and-Thin-FINAL.pdf
172. Fernandez, D. (2026, January 21). Northwest Detroit sees surge in development, from Housing to retail. WDIV. https://www.clickondetroit.com/news/local/2026/01/21/northwestdetroit-sees-surge-in-development-from-housing-to-retail/
173. Fernandez, 2026.
174. Castillo, E. A. (2019, July 16). Nonprofit capacity building: A multiple-capitals approach. Nonprofit Quarterly. https://nonprofitquarterly.org/nonprofit-capacity-building-a-multiplecapitals-approach/
183. Kapucu, N., & Demiroz, F. (2013). Collaborative capacity building for community-based small nonprofit organizations. Journal of Economic and Social Studies, 3, 83–117. https://doi. org/10.14706/JECOSS11313
184. McQuarrie, M., & Krumholz, N. (2011). Institutionalized social skill and the rise of mediating organizations in urban governance: The case of the Cleveland Housing Network. Housing Policy Debate, 21(3), pp. 422. https://doi.org/10.1080/10511482.2011.591408
193. Eastside Community Network. (2019A). Mission & History. Eastside Community Network. ECN | About Us. https://www.ecn-detroit.org/mission-and-history
194. Eastside Community Network, 2019A.
195. Eastside Community Network. (2019B). Neighborhoods First Engagement Model. Eastside Community Network. ECN. https://www.ecn-detroit.org/neighborhoods-first
196. Eastside Community Network, 2019B.
197. Eastside Community Network. (2019C). LEAP Sustainability Fellowship. Eastside Community Network. ECN. https://www.ecn-detroit.org/leap-fellowship
198. Eastside Community Network, 2019C.
199. Sands, D. (2021). Resilient Neighborhoods: These east side groups are helping to reimagine sustainability in Detroit. Model D Media. https://modeldmedia.com/resilientneighborhoods-eastside-community-network-bailey-park-neighborhood-development/
200. Sands, 2021..
201. Scally et al., 2023, p. 12, 14, 17-19.
202. Interview with Resource Provider Organization, Detroit, Michigan (2026).
203. Scally et al., 2023, p. 12, 14, 17-19.
204. Fukuzawa et al., 2025.
205. National Low Income Housing Coalition. (2024A). Out of Reach. National Low Income Housing Coalition. https://nlihc.org/oor/about
206. National Low Income Housing Coalition, 2024A.
207. Colón-Bermúdez, E., Emmanuel, D., Harati, R., & Renzi, K. (2025). Out of Reach . National Low Income Housing Coalition. https://nlihc.org/oor
208. Emmanuel, D., Harati, R., Colón-Bermúdez, E., & Eutsler, T. (2026). The Gap: A Shortage of Affordable Homes. https://nlihc.org/gap
209. Emmanuel et al., 2026.
210. Emmanuel et al., 2026.
211. Emmanuel et al., 2026.
212. Emmanuel et al., 2026.
213. McCue, D., Airgood-Obrycki, W., & Whitney, P. (2025). Rising Costs of Homeownership Are a Growing Burden (p. 12). Joint Center of Housing Studies of Harvard University. https://www.jchs.harvard.edu/sites/default/files/research/files/harvard_jchs_homeowner_ affordability_mccue_2025.pdf
214. McCue et al., 2025.
215. McCue et al., 2025.
216. McCue et al., 2025.
217. Krigman, Y. (2010). The Role of Community Development Corporations in Affordable Housing. Journal of Affordable Housing & Community Development Law, 19(2), 231–253. https://www.jstor.org/stable/25782873
218. Bratt, R. G. (2007). Should We Foster the Nonprofit Housing Sector As Developers and Owners of Subsidized Rental Housing? Revisiting Rental Housing: A National Policy Summit, RR07-12. Joint Center of Housing Studies at Harvard University. https://www.jchs.harvard.edu/ sites/default/files/rr07-12_bratt.pdf#:~:text=The%20nonprofit%20housing%20sector%2C%20 including%20both%20community,sector%2C%20which%20totals%20about%204.6%20 million%20units.
219. Krigman, 2010.
220. Bratt, 2007.
221. Krigman, 2010.
222. Bratt, R. G. (2008). Nonprofit and for‐profit developers of subsidized rental housing: Comparative attributes and collaborative opportunities. Housing Policy Debate, 19(2), 323–365. https://doi.org/10.1080/10511482.2008.9521638
223. Walker, C. (1993). Nonprofit housing development: Status, trends, and prospects. Housing Policy Debate, 4(3), 369–414. https://doi.org/10.1080/10511482.1993.9521138
224. Scally et al., 2023.
225. Scally et al., 2023.
226. Scally et al., 2023.
227. Bratt, 2008.
228. Bratt, 2008.
229. Scally et al., 2023.
230. Scally et al., 2023.
231. Carrig, D. (2026, March 30). The future of CDFIs will shape the future of affordable housing. Kresge Foundation. https://kresge.org/news-views/the-future-of-cdfis-will-shape-the-futureof-affordable-housing
232. Walker, 1993.
233. Walker, 1993.
234. Grandmont Rosedale Development Corporation, 2024A.
235. Grandmont Rosedale Development Corporation, 2024A.
236. Grandmont Rosedale Development Corporation. (2024C). Vacant Property Task Force. Grandmont Rosedale Development Corporation. https://www.grandmontrosedale.com/ vacant-property-task-force
237. Grandmont Rosedale Development Corporation. (2024C).
238. Grandmont Rosedale Development Corporation. (2024C).
239. Kenderes, n.d..
240. Sanders, D. (2026). New $20 million development coming to Detroit’s GrandmontRosedale area. WXYZ Detroit. https://www.wxyz.com/news/region/detroit/new-20mdevelopment-brings-senior-housing-restaurant-to-detroits-grandmont-rosedale-area
241. Grandmont Rosedale Development Corporation. (2026). Minock Park Place. Grandmont Rosedale Development Corporation. https://www.grandmontrosedale.com/minock-parkplace
242. Grandmont Rosedale Development Corporation, 2026.
243. Sanders, 2026.
244. Scally et al., 2023.
245. Scally et al., 2023.
246. USNAPBAC. (n.d.). Home. USNAPBAC Retrieved April 30, 2026, from https://www. usnapbac.org
247. USNAPBAC, n.d.
248. USNAPBAC, n.d.
249. Colón-Bermúdez et al., 2025.
250. Colón-Bermúdez et al., 2025.
251. National Low Income Housing Coalition. (2024). The Problem. National Low Income Housing Coalition. Retrieved April 30, 2026, from https://nlihc.org/explore-issues/why-we-care/ problem
252. National Low Income Housing Coalition, 2024.
253. National Low Income Housing Coalition, 2024.
254. National Equity Atlas. (2022). Eliminate Rent Burden. National Equity Atlas. Nationalequityatlas.org. https://www.nationalequityatlas.org/indicators/eliminate-rent-burden
255. Carrig, 2026.
256. HousingNOLA. (2025A). About Us. HousingNOLA. https://www.housingnola.org/about_us/
257. National Alliance to End Homelessness. (2022). Housing First. National Alliance to End Homelessness. https://endhomelessness.org/resources/toolkits-and-training-materials/ housing-first/
258. Center For Housing Opportunity. (2024). Cross-Sector Legislative Fact Sheets. Centers for Housing Opportunity. https://cho.thehousingcollective.org/impact/housing-cross-sector-factsheets
259. HousingNOLA. (2025B). Housing for All: 10 Year Investment Plan. HousingNOLA. https:// www.housingnola.org/wp-content/uploads/2025/10/2025-Housing-For-All-10-Year-Plan-10.27. pdf
260. HousingNOLA, 2025B.
261. Habitat for Humanity. (2020). Wealth Accumulation and Homeownership: Evidence for Low-Income Households. https://www.habitat.org/our-work/impact/research-series-howdoes-homeownership-contribute-to-wealth-building
262. Habitat for Humanity, 2020.
263. Herbert, C. E., McCue, D. T., & Sanchez-Moyano, R. (2013). Is Homeownership Still an Effective Means of Building Wealth for Low-income and Minority Households? (Was it Ever?) (HBTL-06) Joint Center for Housing Studies Harvard University. https://www.jchs.harvard.edu/ sites/default/files/hbtl-06.pdf
264. Herbert et al., 2013.
265. Herbert et al., 2013.
266. Herbert et al., 2013.
267. Herbert et al., 2013.
268. Herbert et al., 2013.
269. Habitat for Humanity, 2020.
270. Herbert et al., 2013.
271. Herbert et al., 2013.
272. Herbert et al., 2013.
273. People’s Housing Plus. (2019B). What we do. https://phplusnola.org/homeownership
274. People’s Housing Plus, 2019B.
275. People’s Housing Plus, 2019B.
276. People’s Housing Plus. (2019C). Stewardship. People’s Housing Plus. People’s Housing Plus, Affordable Housing in Greater New Orleans. https://phplusnola.org/stewardship
277. People’s Housing Plus, 2019C.
278. People’s Housing Plus, 2019C.
279. Krigtnan, Y. (2010). The Role of Community Development Corporations in Affordable Housing. Journal of Affordable Housing & Community Development Law, 19(2), 231–253.https:// www.jstor.org/stable/25782873
280. Krigtnan, Y, 2010.
281. Krigtnan, Y, 2010.
282. Smith, B. C. (2003). The Impact of Community Development Corporations on Neighborhood Housing Markets: Modeling Appreciation. Urban Affairs Review, 39(2), 181–204. https://doi.org/10.1177/1078087403253903
283. Smith, B. C., 2003.
284. Smith, B. C., 2003.
285. Smith, B. C., 2003.
286. Gould Ellen, I., & Voicu, I. (2006). Nonprofit housing and neighborhood spillovers. Journal of Policy Analysis and Management, 25(1), 31–52. https://doi.org/10.1002/pam.20155
291. Center for American Progress. (2013). Social Finance: A Primer. Center for American Progress. https://www.americanprogress.org/article/social-finance-a-primer/
292. Panorama Global. (2026). What Flexible Funding Makes Possible. Panorama Global. https://panoramaglobal.org/knowledge-center/articles/what-flexible-funding-makes-possible/
293. Bromberger, A. (2020). Recoverable Grants as a Tool for Impact. Bromberger Law. https:// www.brombergerlaw.com/post/recoverable-grants-as-a-tool-for-impact
294. Golla, C. (2024). Recoverable Grants: The Gifts That Keep on Giving. Bernstein.Com; Bernstein. https://www.bernstein.com/our-insights/insights/2024/articles/recoverable-grantsthe-gifts-that-keep-on-giving.html
295. Bromberger, 2020.
296. Hill, K. (2020). Recoverable Grants. Seattle Foundation. https://www.seattlefoundation.org/ recoverable-grants/
297. The Conservation Fund. Recoverable Grants to Advance Conservation. The Conservation Fund. https://www.conservationfund.org/get-involved/more-ways-to-give/recoverable-grants/.
298. Hill, 2020.
299. Golla, 2024.
300. Ford Foundation Program Staff. (n.d.). Program Related Investment and Recoverable Grant Primer. https://web.cof.org/2013fall/docs/resources/PRI-Recoverable-Grant-Prime.pdf
301. Bromberger, 2020.
302. New Roots Community Farm. (n.d.). Who we are. New Roots Community Farm. https:// www.newrootscommunityfarm.com.
305. Invest Appalachia. (2023). Invest Appalachia deploys $1 million in Catalytic Capital to build vibrant economies. Invest Appalachia. https://investappalachia.org/catalytic-capital-2023/
306. Pepper, E. (2024). Invest Appalachia Fund Closes with $35M for Community-First Impact Investing. Invest Appalachia. https://investappalachia.org/ia-fund-closes-35m/
307. Posner, M., & Briggs, X. de S. (2025). Rethinking our assumptions and financing tools for community resilience in the face of growing climate loss and risk. Brookings. https://www. brookings.edu/articles/rethinking-our-assumptions-and-financing-tools-for-communityresilience-in-the-face-of-growing-climate-loss-and-risk/
309. FreshWater Staff. (2025). Cleveland Neighborhood Progress invests $2 million in area CDCs for strong community growth. FreshWater Cleveland. https://www.freshwatercleveland. com/breaking-ground/Cleveland-Neighborhood-Progress-Invests-2-Million-In-Area-CDCSFor-Strong-Community-Growth_062425.aspx
310. Cleveland City Council. (2025). The Neighborhood Development Fund. Cleveland City Council—113-2025. https://cityofcleveland.legistar.com/LegislationDetail. aspx?ID=7104942&GUID=EA920230-6A92-49AD-9D26-B311D81637F2
311. Enterprise Community Partners, 2026A.
312. Enterprise Community Partners, 2026A.
313. Enterprise Community Partners, 2026A.
314. Grantmakers for Effective Organizations. (2014). What Is General Operating Support and Why Is It Important? Grantmakers for Effective Organizations. https://www.geofunders.org/resource/what-is-general-operating-support-and-why-is-itimportant/ .
315. Smith, H. (2026). Multiyear Funding and General Operating Support: Why They’re Stronger Together. Exponent Philanthropy. https://exponentphilanthropy.org/blog/multiyearfunding-and-general-operating-support-why-theyre-stronger-together/.
316. Smith, 2026.
317. Garcia, K. (2025A). Councilmember Gauthier Introduces Bill to Help Community Development Corporations Build Affordable Housing and Defy Displacement. Philadelphia City Council, https://phlcouncil.com/fundcdcs/.
318. Exponent Philanthropy. (2024). The Power of Flexibility: Why General Operating Support Matters. Exponent Philanthropy. https://exponentphilanthropy.org/blog/the-power-offlexibility-why-general-operating-support-matters/
319. Philadelphia Association of Community Development Corporations. (2017). Community Capacity Building Fund. Philadelphia Association of Community Development Corporations. https://pacdc.org/ccbf/.
320. Mazelis, B. (2025). City Councilmember Proposes Funding Boost for CDCs. Globe Times, https://www.swglobetimes.com/city-councilmember-proposes-funding-boost-for-cdcs/.
321. Garcia, K. (2025B). Summer report for July 19, 2025: A busy summer continues as councilmembers dealt with a strike & lobbied for more funding for SEPTA. Philadelphia City Council. https://phlcouncil.com/summer-report-for-july-19-2025-a-busy-summer-continuesas-councilmembers-dealt-with-a-strike-lobbied-for-more-funding-for-septa/.
322. Philadelphia Association of Community Development Corporations, 2017.
323. Grantmakers for Effective Organizations, 2014.
324. Getter, D. E. (2023). Community Development Financial Institutions (CDFIs): Overview and Selected Issues. https://www.congress.gov/crs-product/R47217
325. National Council of Nonprofits. (2023). Endowments. National Council of Nonprofits. https://www.councilofnonprofits.org/running-nonprofit/fundraising-and-resourcedevelopment/endowments
326.Center for High Impact Philanthropy. (2025). Program-Related Investments (PRI). University of Pennsylvania. Retrieved https://www.impact.upenn.edu/program-relatedinvestments/
327. Foundation Source. (2022). Program-Related Investments Overview. Foundation Source. https://foundationsource.com/resources/white-papers/program-related-investmentsoverview/
328. Bishop, C. G. (2010). The Low-Profit LLC (L3C): Program Related Investment by Proxy or Perversion. Arkansas Law Review, 63(2), 243–268.
329. International Center for Not-For-Profit Law. (1999). Creative Uses of Program Related Investments. International Center for Not-For-Profit Law. https://www.icnl.org/resources/ research/ijnl/creative-uses-of-program-related-investments
330. Grantcraft. (n.d.). Program-Related Investing Skills & Strategies for New PRI Funders. Grantcraft.
331. Center for High Impact Philanthropy, 2025.
332. Seybert, A. (n.d.). Social Investment Practice Case Study: LISC Affordable Housing Leverage Fund. The Kresge Foundation. https://kresge.org/wp-content/uploads/DetroitAffordable-Housing-Fund.pdf
333. Seybert, n.d.
334. Getter, 2023.
335. Getter, 2023.
336. New Hampshire Community Development Finance Authority. Section 6.7 Revolving Loan Funds. Resources from NHCDFA. https://resources.nhcdfa.org/programs/community-
337. Urban Redevelopment Authority of Pittsburgh. (2026). Business Loans & Resources. Urban Redevelopment Authority of Pittsburgh. https://www.ura.org/pages/access-to-capital
338. Council of Development Finance Agencies. (2016). Revolving Loan Fund Overview. Council of Development Finance Agencies. https://www.cdfa.net/cdfa/cdfaweb.nsf/pages/ revolving-loan-funds.html.
339. National Council of Nonprofits, 2023.
340. Bruner, A. (2024). Understanding Nonprofit Endowment Funds: A Path to Sustainable Financial Support. Shiawassee Community Foundation. https://www.shiacf.org/funds/ understanding-nonprofit-endowment-funds-a-path-to-sustainable-financial-support/.
341. Picket, K. (2025). How to Create an Endowment Fund. Greater Houston Community Foundation. https://ghcf.org/articles/create-an-endowment-fund/.
342. Community Foundation for Southeast Michigan. (2025). Nonprofit Endowment Funds. Community Foundation for Southeast Michigan. https://cfsem.org/ways-to-give-2/nonprofitendowment-funds/.
343. Ford Foundation. (2001). A Primer for Endowment Grantmakers: Endowment strategies to assist and enhance the work of nonprofit organizations. Ford Foundation. https://www. fordfoundation.org/wp-content/uploads/2015/03/2001-primer_for_grantmakers.pdf
344. Ford Foundation, 2001.
345. Werner, R. M., Emanuel, E. J., Pham, H. H., & Navathe, A. S. (2021). The Future of Value-Based Payment: A Road Map to 2030. https://repository.upenn.edu/entities/ publication/53dadd14-870d-4ab9-a470-0052e37a6cc4
346. Olson, A. E., & McKnight, M. T. (2020). Value-based payments within Medicaid and Medicare: How to pay for what works in public health. Green & Healthy Homes Initiative. https://www.greenandhealthyhomes.org/wp-content/uploads/GHHI-Outcomes-BasedPayments-Handbook_final.pdf
347. The Commonwealth Fund. (2023). Value-Based Care: What It Is, and Why It’s Needed. https://doi.org/10.26099/fw31-3463
348. Olson & McKnight, 2020.
349. Miller, H. D. (2018). How to create an alternative payment model: Designing value-based payments that support affordable, high-quality healthcare services. Center for Healthcare Quality & Payment Reform. https://www.chqpr.org/downloads/How_to_Create_an_Alternative_ Payment_Model.pdf
350. Werner et al., 2021.
351. Guest, D. (2025). Embracing new health care payment models. Deloitte. https://www. deloitte.com/us/en/Industries/life-sciences-health-care/articles/value-based-care-paymentmodels.html
352. Guest, 2025.
353. Edmiston, K. D. (2022). Alternative Payment Models, Value-Based Payments, and Health Disparities. Center for Insurance Policy and Research. https://content.naic.org/sites/default/ files/cipr-report-alternative-payment-methods.pdf
354. AIRnyc. (2026A). About Us: Mission & Vision. AIRnyc. https://www.air-nyc.org/missionvision
355. Green & Healthy Homes Initiative. (2021). New York Healthy Homes Collaborative Project Summary. https://www.greenandhealthyhomes.org/wp-content/uploads/NYHHC-2pgSummary_Dec2021.pdf
356. Olson & McKnight, 2020.
357. Green & Healthy Homes Initiative. (2022). Reimbursement Strategies for Healthy Homes Services. Green & Healthy Homes Initiative. https://www.greenandhealthyhomes.org/wpcontent/uploads/GHHI-State-Medicaid-Reimbursement-11.10.22.pdf
360. Fyffe, S. D. (2015). Nonprofit-Government Contracts and Grants: The State Agency Perspective. Urban Institute. https://www.urban.org/sites/default/files/ publication/72526/2000496-Nonprofit-Government-Contracts-and-Grants-The-State-AgencyPerspective.pdf
361. HUD Exchange. (2024). Latest Fee for Service Guidance Supports HUD HCAs Nationwide. HUD Exchange. https://www.hudexchange.info/programs/housing-counseling/housingcounseling-today/latest-fee-for-service-guidance-supports-hud-hcas-nationwide
362. National Council of Nonprofits. (2023) Common Problems in Government-Nonprofit Grants and Contracts. National Council of Nonprofits. https://www.councilofnonprofits.org/ trends-and-policy-issues/state-policy-tax-law/common-problems-government-nonprofitgrants-and
363. Fyffe, n.d.
364. HUD Exchange, 2024.
365. Bratt, R. G. (2006). Should We Foster the Nonprofit Housing Sector As Developers and Owners Of Subsidized Rental Housing. Joint Center for Housing Studies at Harvard University. https://www.jchs.harvard.edu/sites/default/files/rr07-12_bratt.pdf
366. FundsforNGOs. (2025). When Fundraising Success Masks Mission Drift. FundsforNGOs.
367. Local Initiatives Support Corporation. (2022). Wells Fargo Foundation Awards $22.5 Million to LISC to Expand Homeownership for BIPOC Families. Local Initiatives Support Corporation. https://www.lisc.org/our-stories/story/wells-fargo-foundation-awards-225-million-lisc-expandhomeownership-bipoc-families/
368. McKelvey, V. (2023). WORTH Program Provides Housing Resources and Promotes Homeownership Equity. Local Initiatives Support Corporation (LISC) Virginia. https://www. lisc.org/virginia/regional-stories/worth-program-provides-housing-resources-and-promoteshomeownership-equity/
369. Urban Institute. (2016). What is pay for success (PFS)? Urban Institute. https://pfs.urban. org/discover/content/what-pay-success-pfs.html
370. Milner, J. (2016). Evidence Toolkit: Pay for Success. Urban Institute https://www.urban.org/ sites/default/files/publication/99740/evidence_toolkit_pay_for_success_0.pdf
371. Romero, J. (2018). Paying for success: State and local governments are trying a new financing model for social programs. Federal Reserve Bank of Richmond. https://www. richmondfed.org/publications/research/econ_focus/2018/q1/feature1
372. Third Sector Capital Partners. (2016). What is Pay for Success? Third Sector Capital Partners. https://www.thirdsectorcap.org/what-is-pay-for-success_v1/
373. Urban Institute. What Are the Challenges of Pay for Success? https://pfs.urban.org/faq/ what-are-challenges-pay-success.html
374. Colorado Coalition for the Homeless. (2016). Social Impact Bond (SIB). Colorado Coalition for the Homeless. https://www.coloradocoalition.org/SIB.
375. Urban Institute. (2015). Chronic Homelessness Pay for Success Initiative. Urban Institute. https://pfs.urban.org/pfs-project-fact-sheets/content/chronic-homelessness-pay-successinitiative.html.
378. Noterman, E. (2022). Speculating on vacancy. Transactions of the Institute of British Geographers, 47(1), 123–138. https://doi.org/10.1111/tran.12477
379. Noterman, 2022.
380. Canada Revenue Agency, 2023.
381. City of Vancouver. (2024). New rental homes supported in part by Empty Homes Tax
revenue. City of Vancouver. https://vancouver.ca/news-calendar/rental-homes-supported-byempty-homes-tax-revenue-april-2024.aspx
382. City of Vancouver, 2024.
383. Shewchuk, S., & Lavoie, A. (2019). Rising to the challenge: How market and non-market partners can work together to strengthen Canada’s housing system. https://thehub. ca/2025/12/19/rising-to-the-challenge-how-market-and-non-market-partners-can-worktogether-to-strengthen-canadas-housing-system/
384. EY Global. (2023). Canada’s Underused Housing Tax Act: Canadian entities may be required to file new tax returns. EY Global. https://www.ey.com/en_gl/technical/tax-alerts/ canada-s-underused-housing-tax-act--canadian-entities-may-be-req
385. Caracciolo, G., & Miglino, E. (2024). Ripple effects: The impact of an empty-homes tax on the housing market. C.D. Howe Institute. https://cdhowe.org/publication/ripple-effectsimpact-empty-homes-tax-housing-market/
386. EY Global, 2023.
387. Power, M. (2025). Do vacancy taxes work? Yes, but speculators hate them. Green Builder. https://www.greenbuildermedia.com/blog/do-vacancy-taxes-work-yes-but-speculators-hatethem
392. Chicago Development Fund. (2026). How it Works: Basics of NMTC. Chicago Development Fund. https://chicagodevelopmentfund.org/how-it-works/the-basics-how-doesnmtc-work/.
393. National Housing Conference. (2017). How TIFs can be used for affordable housing. . National Housing Conference. https://nhc.org/policy-guide/tax-increment-financing-thebasics/how-tifs-can-be-used-for-affordable-housing/
394. DeSantis, M. (n.d.). Scan and analysis of thirteen donation-based community investment tax credit programs in the USA with lessons and applications for a Michigan program.
395. Community Development Financial Institutions Fund. (2026). CDE certification. U.S. Department of the Treasury. https://www.cdfifund.gov/programs-training/certification/cde.
396. Enterprise Community Partners. (2026B). New Markets Tax Credit. Enterprise Community Partners. https://www.enterprisecommunity.org/capabilities/new-markets-tax-credits.
397. National Housing Conference, 2017.
398. Steinbach, C. (1998). The CDC Tax Credit: An effective tool for attracting private resources to community economic development. Brookings. https://www.brookings.edu/articles/thecdc-tax-credit-an-effective-tool-for-attracting-private-resources-to-community-economicdevelopment/
399. DeSantis, n.d.
400. Steinbach, 1998.
401. Steinbach, 1998.
402. DeSantis, n.d.
403. Community Development Financial Institutions Fund. (n.d.). The Urban Institute’s New Markets Tax Credit Program evaluation: Key findings and lessons for future evaluations. U.S. Department of the Treasury. https://www.cdfifund.gov/system/files?file=documents/urbaninstitute-summary-cover-memo.pdf.
404. Philadelphia Association of Community Development Corporations. (2020). CDC impact report. Philadelphia Association of Community Development Corporations. https://pacdc.org/ cdcimpactreport/
405. New Jersey Department of Community Affairs. (2025). Neighborhood Revitalization Tax Credit Program. The State of New Jersey. https://www.nj.gov/dca/dhcr/offices/nrtc.shtml
406. New Jersey Department of Community Affairs. (2017). Christie administration awards Neighborhood Revitalization Tax Credit grants in Essex County. The State of New Jersey. https://nj.gov/dca/news/news/2017/approved/20170501d.html
407. Housing and Neighborhood Development Services. (2019). Berg Hat Factory Lofts. Housing and Neighborhood Development Services. https://www.handsinc.org/berg-hatfactory
408. NJ Department of Community Affairs, 2017.
409. Knopp, E. (2018). Former Orange hat factory transformed into mixed-use. NJBiz. https:// njbiz.com/former-orange-hat-factory-transformed-into-mixed-use/
410. Essex News Daily Editor. (2018). Hat City Lofts completion leading the way for neighborhood transformation in Orange. Essex News Daily. https://essexnewsdaily.com/ headlne-news/hat-city-lofts-completion-leading-the-way-for-neighborhood-transformationin-orange/
411. NJ Department of Community Affairs, 2017.
412. NJ Department of Community Affairs, 2025.
413. International Center for Community Land Trusts. (2024). What Is a Community Land
Trust? International Center for Community Land Trusts. Retrieved April 30, 2026, from https:// www.cltweb.org/resources/what-is-a-community-land-trust/
414. The Democracy Collaborative. (2019). Community Investment Vehicles. The Democracy Collaborative. https://www.democracycollaborative.org/community-investment-vehicles
415. The Democracy Collaborative, 2019.
416. Community Field Notes. (2019). Community Investment Fund. https://www.futureby. community/community-ownership/community-investment-fund
417. Hadden Loh, T., Richardson, L., & Krupicka, B. (2025). The community investment fund: An efficient, scalable vehicle for tax-incentivized place-based investment. Brookings. https:// www.brookings.edu/articles/the-community-investment-fund-an-efficient-scalable-vehiclefor-tax-incentivized-place-based-investment/
418. Jain, V. (2006). Investing in change. Stanford Social Innovation Review. Retrieved April 13, 2026, from https://ssir.org/articles/entry/investing_in_change
419. Dubb, S. (2020). LISC at 40: Coming to terms with the limits of markets. | Nonprofit Quarterly. Retrieved April 23, 2026, from https://nonprofitquarterly.org/lisc-at-40-the-seriouslimits-of-markets-and-the-crying-need-for-policy-change/
420. The Democracy Collaborative, 2019.
421. The U.S. Impact Investing Alliance. (2021). Impact in place: Emerging sources of community investment capital and strategies to direct it at scale. Federal Reserve Bank of New York. Retrieved April 13, 2026, from https://www.newyorkfed.org/medialibrary/media/ outreach-and-education/community-development/emerging-sources-of-communityinvestment/community-investing-bank-report-final-20210518
422. The Democracy Collaborative, 2019.
423. The Democracy Collaborative, 2019.
424. Abello, O. P. (2025). Five years in, Philly’s Kensington Corridor Trust is building momentum. Next City. https://nextcity.org/features/five-years-in-phillys-kensington-corridortrust-is-building-momentum.
425. Abizadeh, A. (2025). The neighborhood trust model works. The Kensington Corridor Trust is proof. The Philadelphia Inquirer. https://www.inquirer.com/opinion/commentary/ kensington-community-investment-development-business-corridor-20250425.html.
426. International Center for Community Land Trusts, 2024.
427. Greenstein, R., & Sungu-Eryilmaz, Y. (2021). Community land trusts: Leasing land for affordable housing. Lincoln Institute of Land Policy. https://www.lincolninst.edu/publications/articles/community-land-trusts.
428. Housing Solutions Lab. (2021) Community land trusts. Housing Lab Solutions. https://
429. Housing North. (2019). Community land trusts. https://www.housingnorth.org/ community-land-trusts.
430. Greenstein & Sungu-Eryilmaz, 2005.
431. Gardner, P. (2023). In Frankfort, small homes offer big hope in northern Michigan housing crunch. Bridge Michigan. https://bridgemi.com/business-watch/frankfort-smallhomes-offer-big-hope-northern-michigan-housing-crunch/.
432. Fukuzawa et al., 2025.
433. Howard, A. G. G. & Howard, D. (2009). The Nonprofit Starvation Cycle. Stanford Social Innovation Review. https://ssir.org/articles/entry/the_nonprofit_starvation_cycle
434. Scally et al., 2023.
435. Fukuzawa et al., 2025.
436. Axel-Lute, 2016.
437. Green & Healthy Homes Initiative. (2025A). Technical Assistance. Green & Healthy Homes Initiative. https://www.greenandhealthyhomes.org/services/technical-assistance-training/
438. Green & Healthy Homes Initiative. (2025B). About Us. Green & Healthy Homes Initiative. https://www.greenandhealthyhomes.org/about-us/
439. Enterprise Community Partners. (2025B). Detroit Home Repair Fund: Impact report May 2023-2025. Enterprise Community Partners. https://www.enterprisecommunity.org/sites/ default/files/2025-11/DHRF-Impact-Report.pdf. p. 3.
440. Enterprise Community Partners, 2025B. p. 3.
441. Enterprise Community Partners, 2025B. p. 3.
442. Jefferson East, Inc., 2026A.
443. Zaniewski, 2023.
444. East Jefferson Development Corp., 2021.
445. Seybert, 2018.
446. Howard, 2009.
447. Howard, 2009.
448. Howard, 2009.
449. Community Development Advocates of Detroit. (2022). Roadmap to equity: Sustainability strategies for Detroit’s community development ecosystem. Community Development Advocates of Detroit. https://cdad-online.org/roadmap-to-equity/
450. Community Development Advocates of Detroit, 2022.
451. Dorsey, C., Kim, P., Daniels, C., Sakaue, L., & Savage, B. (2020). Overcoming the racial bias in philanthropic funding. Stanford Social Innovation Review. https://ssir.org/articles/entry/ overcoming_the_racial_bias_in_philanthropic_funding
452. Community Development Advocates of Detroit, 2022.
453. Abu-Khalaf, A. (2022). Closing the racial capital gap. Enterprise Community Partners. https://www.enterprisecommunity.org/story/closing-racial-capital-gap
458. Davis, A., & Giffin, S. (2024). Elevating community development organizations in Detroit. Enterprise Community Partners. https://www.enterprisecommunity.org/learning-center/ resources/elevating-community-development-organizations-detroit
459. Enterprise Community Partners. (2024). Enterprise raises $23.7M to deepen support for Detroit community development organizations. Enterprise Community Partners. https:// www.enterprisecommunity.org/news/enterprise-raises-237m-deepen-support-detroitcommunity-development-organizations
460. Community Development Advocates of Detroit, 2022.
461. Community Development Advocates of Detroit, 2022.
462. Community Development Advocates of Detroit, 2022.
463. Abu-Khalaf, 2022.
464. Rockefeller Philanthropy Advisors, 2023.
465. Community Opportunity Alliance, 2025B.
466. Community Opportunity Alliance, 2025B.
467. Cooper, K.R. (2023). Nonprofit Mergers. In: List, R.A., Anheier, H.K., Toepler, S. (eds) International Encyclopedia of Civil Society. Springer, Cham. https://doi.org/10.1007/978-3-319-
99675-2_125-1
468. Light, P. (2004). The Capacity Building Challenge. The Foundation Center. https://www. issuelab.org/resources/6216/6216.pdf.
469. Gittell. R & Wilder, M. (1999) Community Development Corporations: Critical Factors That Influence Success. Journal of Urban Affairs, (21)3, 341-361, DOI: 10.1111/0735-2166.00021
470. Google Trends. “Nonprofit Partnership” Interest Over Time (United States, Web Search, 2004–Present). Accessed April 22, 2026. https://trends.google.com/explore?q=nonprofit percent2520partnership&date=all&geo=US&gprop=web.
471. Google Trends. “Nonprofit Partnership” (2004-present).
472. Google Trends. “Nonprofit Merger” Interest Over Time (United States, Web Search, 2004–Present). Accessed April 22, 2026. https://trends.google.com/explore?q=nonprofit percent2520partnership&date=all&geo=US&gprop=web.
473. Google Trends. “Nonprofit Partnership,” (2004-present).
474. Scally et al., 2022.
475. Community Opportunity Alliance, 2025B.
476. Various Detroit and New Orleans CDO stakeholders.
477. McLaughlin, T. (2010). Nonprofit Mergers and Alliances. John Wiley & Sons. https:// ebookcentral-proquest-com.proxy.lib.umich.edu/lib/umichigan/detail.action?docID=537361.
478. Fisher, R. (2025). Nonprofit mergers: 5 communication strategies that build trust. Mission+strategy: Nonprofit consultants in Chicago. https://www.missionplusstrategy.org/ blog/5-communication-strategies-that-build-trust-in-nonprofit-mergers
479. Fisher, 2025.
480. Glick Davis & Associates. (2025). Lessons learned from successful nonprofit mergers. Glick Davis and Associates. https://glickdavis.com/lessons-learned-from-successful-nonprofitmergers/
481. Haider, D., Cooper, K. & Maktoufi, R. (2016). Mergers as a strategy for success: 2016 report from the Metropolitan Chicago Nonprofit Merger Research Project. Mission+Strategy Consulting. https://missionplusstrategy.com/wp-content/uploads/2016/10/2016-MetroChicago-Nonprofit-Merger-Study-Report.pdf.
482. Neuhoff, A., Katie S. M., Kiernan, R. and Grehan, J. (2014). Making sense of nonprofit collaborations. The Bridgespan Group. https://www.bridgespan.org/getmedia/bf9e5578-68df43a8-9cfc-6a65d4371e21/making-sense-of-nonprofit-collaborations.pdf.
483. Community Opportunity Alliance, 2025B.
484. Sconyers, J. (2025). Nonprofit mergers & acquisitions: A mission-centered approach to organizational transformation. Abundance Leadership Consulting. https://www. jennifersconyers.com/blog/ percent2Fnonprofit-mergers-acquisitions-fabric-framework percent2F.
485. La Piana. (n.d.).
486. Sconyers, 2025.
487. La Piana. (2024). The Collaborative Map. La Piana Consulting. https://www.lapiana.org/ insight/the-collaborative-map
488. La Piana, 2024.
489. La Piana. (n.d). Merger and alliance toolkit: A guide for navigating nonprofit mergers and alliances. La Piana Consulting. https://www.lapiana.org/wp-content/uploads/2020/06/Mergerand-Alliance-Toolkit-Final.pdf.
490. Neuhoff et al., 2014.
491. Sconyers, 2025.
492. La Piana, 2024.
493. La Piana, n.d.
494. Community Opportunity Alliance, 2025B.
495. La Piana, 2024.
496. Interview with Frank Woodruff, COA.
497. Community Opportunity Alliance, 2025B.
498. Neuhoff et al., 2014.
499. Interview with various CDO stakeholders.
500. Interview with Frank Woodruff, COA.
501. Interview with Cleveland CDO.
502. Interview with Cleveland CDO.
503. Dandridge, A. (2026). New Rehab Construction begins on “west euclid gateway”, a new multifamily affordable housing project in Virginia Park. Gilbert Family Foundation. https:// gilbertfamilyfoundation.org/news-and-stories/new-rehab-construction-begins-on-westeuclid-gateway-a-new-multifamily-affordable-housing-project-in-virginia-park/
504. City of Detroit. (2024). New Rehab Construction begins on “west euclid gateway”, a new
multifamily affordable housing project in Virginia Park. City of Detroit. https://detroitmi.gov/ news/new-rehab-construction-begins-west-euclid-gateway-new-multifamily-affordablehousing-project
505. City of Detroit, 2024.
506. City of Detroit. 2024.
507. Emma Berger, April 10, 2026.
508. Various CDO stakeholders.
509. Shi, W. (March 26, 2026). Treat nonprofits as strategic partners, not just philanthropic recipients. Harvard Business Review. https://hbr.org/2026/03/treat-nonprofits-as-strategicpartners-not-just-philanthropic-recipients
510. Neuhoff et al., 2014.
511. Healsip, E. (2026). What is a general partnership? U.S. Chamber of Commerce. https:// www.uschamber.com/co/start/startup/general-partnerships
512. Jumi Consulting Group, LLC. (2019). Common Grounds CLT. https://www.jumicg.org/ourwork/common-grounds
513. Interview with Detroit CDO stakeholder
514. Interview with Detroit CDO staff.
515. Intermediary Interview.
516. Intermediary Interview.
517. Intermediary Interview.
518. Change Elemental. (2010). Outsourcing back-office services in small nonprofits: Pitfalls and possibilities. https://changeelemental.org/resources/outsourcing-back-office-services/
519. Purdy, J. (2024). The role of trust in non-profit and community benefit organizations. FIC Human Resource Partners. https://www.fichrpartners.com/post/the-role-of-trust-in-nonprofit-and-community-benefit-organizations.
520. Kohm, A., & LaPiana, D. (2003). Strategic restructuring for nonprofit organizations: Mergers, integrations, and alliances. Praeger.
521. OppCo. (2019). Shared services and programs. OppCo. https://www.oppcommunities.org/ shared-services
522. Intermediary Interview.
523. Intermediary Interview.
524. Intermediary Interview.
525. Intermediary Interview.
526. Intermediary Interview.
527. Intermediary Interview.
528. Enterprise Community Partners, 2026A.
529. Enterprise Community Partners, 2026A.
530. Enterprise Community Partners, 2026A.
531. Haque, S. (2005). An analysis of the impact of mergers between community development corporations (thesis). https://dspace.mit.edu/handle/1721.1/33410
532. McLaughlin, 2010.
533. Abundance Leadership Consulting, 2025.
534. Williamson, F. (2025, December 2). Council post: Why nonprofits should consider the benefits of a merger. Forbes. https://www.forbes.com/councils/ forbesbusinesscouncil/2025/12/02/why-nonprofits-should-consider-the-benefits-of-a-merger/
535. Haque, 2005.
536. PeopleJoy.. (2025). The impact of mergers and acquisitions on employee benefits: What HR leaders need to know. PeopleJoy. https://www.peoplejoy.com/article/the-impact-ofmergers-and-acquisitions-on-employee-benefits-what-hr-leaders-need-to-know
537. Williamson, 2005.
538. Kosofsky, S. (2024). When and why should nonprofits merge? The Nonprofit Fixer. https:// www.nonprofitfixer.com/nonprofit-fixer-blog/should-any-nonprofits-form-or-merge-in-thefirst-place
539. McLaughlin, 2010.
540. McLaughlin, 2010.
541. McLaughlin 2010.
542. Haque, 2005.
543. Haque, 2005.
544. Glick Davis & Associates, 2025.
545. People’s Housing Plus, 2019A.
546. Interview with New Orleans CDO.
547. Various interviews with CDO stakeholders.
548. Interview with New Orleans CDC.
549. Various interviews with stakeholders in the CDO field.
550. Interview with New Orleans CDC.
551. Interview with Detroit CDO stakeholder.
552. Interview with various CDO stakeholders.
553. Community Opportunity Alliance, 2025B.
554. Neuhoff et al., 2014.
555. La Piana, n.d.
556. Detroit CDO stakeholder.
557. Various CDO stakeholders.
558. La Piana, n.d.
559. Beasley, S. (2024). More funders are handing off grant-making duties to intermediaries. Is it a good idea? The Chronicle of Philanthropy. https://www.philanthropy.com/news/morefunders-are-handing-off-grant-making-duties-to-intermediaries-is-it-a-good-idea/
560. Hacke, R., Wood, D., Urquilla, M. (n.d.). What can foundations do to foster community investment? The Kresge Foundation and Initiative for Responsible Investment. https://kresge. org/sites/default/files/Foundation-roles-com-investment-121114-KF.pdf