
September 7 2022

September 7 2022
In February 2022, Summit Design & Engineering initiated the Citywide Housing Assessment for the City of Martinsville. During this project, the consultant assessed the condition of the current housing stock in Martinsville and provided information necessary for targeted housing improvement programs. This report will allow Martinsville staff to prioritize areas in the city most in need of housing rehabilitation. Funding for housing rehabilitation is available from various sources, including Community Development Block Grants (CDBG), United States Department of Agriculture Rural Development (USDA/RD) funds, and housing trust funds. The data in this report will help Martinsville staff in applications for grants and other funding sources.
Summit staff conducted the housing assessment with assistance from Virginia Tech graduate students to efficiently survey all residential areas of the city. Martinsville staff provided GIS data that Summit staff used to create base maps for the city, as well as nine neighborhood designations that were used in comparing housing conditions. Summit staff trained the survey team on the building condition scoring criteria before beginning the assessment on May 9, 2022. A second day of surveying was conducted on June 14, 2022 to complete the housing condition assessment. During the assessment, the survey team used multiple vehicles to traverse the city, ensuring that all residential structure conditions were documented.
After collecting housing condition data, Summit identified that the Southside neighborhood, bisected by Memorial Boulevard, has the greatest concentration of blighted structures of the nine sectors of Martinsville used for the assessment. This report provides demographic data and housing condition data, as well as the methodology used in selecting one the most blighted area, to help inform decision makers as they pursue revitalization projects in Martinsville.
Novogradac Consulting LLP conducted a Comprehensive Housing Market Study and Needs Analysis for the City of Martinsville and Henry County, Virginia in 2020. The consultants inspected the existing housing stock, conducted interviews with key stakeholders, estimated achievable monthly rents, and recommended future housing strategies. The study also included an analysis of demographic characteristics, economic trends, the local for-sale housing market, and the market for multifamily housing.
The study recommends that the City of Martinsville and Henry County explore opportunities to ease the financial burdens on the developers of housing for low- to moderate-income individuals. This could include land banking and/or applying for mixed-income housing grants and Low-Income Housing Tax Credits.
The City of Martinsville began the process of changing its status to a Town within Henry County in 2019. As a result, both the Comprehensive Plan and Zoning Ordinance for Martinsville need to be updated. The update process for these documents provides an opportunity to allow multifamily housing in more areas and provide incentives for developers adding to the multifamily housing stock.
Martinsville is an employment center that attracts workers throughout the region, from Danville to Greensboro, North Carolina. The trend of individuals working in Martinsville and living in Danville, which generally has housing with more amenities and higher rents than that of Martinsville, suggest that there is demand for new, higher-end housing in Martinsville.
Most residential properties with available units in Martinsville offer one-, two-, and three-bedroom units in garden-style apartment or townhome designs. The Housing Market Study suggests that one-, two-, and three-bedroom units in the ranges of 625 - 750 ft2, 900 - 1,025 ft2, and 1,125 - 1,250 ft2, respectively, would be well accepted in the Martinsville market. The study recommends amenities including community rooms, picnic areas, on-site laundry facilities, playgrounds, and offstreet parking to attract potential residents.
This report adds neighborhood-specific context to the data outlined in the Housing Market Study to help decision-makers develop strategies that are appropriate for the existing conditions of housing, as well as the local housing market.
On May 9th, 2022, six teams navigated the designated areas using field sheets from the City’s GIS records and information from the level one evaluation form, also known as “Guidance for Windshield Surveys.” This evaluation criteria form is provided in the appendix, along with a more in-depth description of the deficiencies.
When assessing structures, building data is divided into categories relating to the interior, utilities (mechanical systems), facilities (bath and kitchen), exterior, and environmental factors. Within each of those categories, defects are classified as first-level or second-level deficiencies. First-level deficiencies are those on vital structural elements on either the interior or exterior of a structure, such as the foundation, roof, or toilets. Second-level deficiencies are those on elements of a structure that are less critical, such as trim, gutters, doors, and windows. The severity of deterioration, whether it be due to first-level deficiencies, second-level deficiencies, or a combination of the two, determines the overall grade assigned to a building.
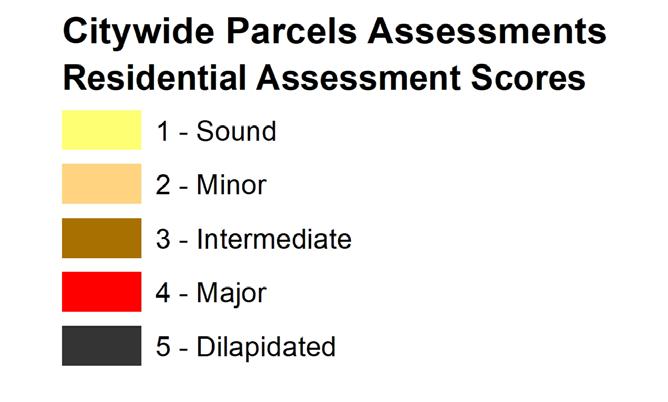
Structures are graded on a scale of 1-5, with a score of 1 representing the best conditions, and a scale of 5 representing the worst conditions. Each score is described briefly below:
1. Sound/Standard = in good condition or in need of minor repairs.
2. Minor Deficiencies = minor defects beyond regular maintenance.
3. Intermediate Deficiencies = significant defects requiring rehabilitation but do not require clearance.
4. Major Deficiencies = major defects requiring substantial reconstruction or clearance.
5. Dilapidated = structure has undergone severe damage/decay with defects requiring clearance
If a structure has one or more first level major deficiencies, two first level intermediate deficiencies, two or more second level deficiencies, or any five intermediate deficiencies then it is classified as "Major" or a four on the scale. A building is considered dilapidated when the structure has a first-level major deficiency and its structural integrity is compromised to the point of partial or total collapse. For buildings classified as dilapidated, repair to the structure would exceed the value of the property, making clearance of the structure the most viable option.
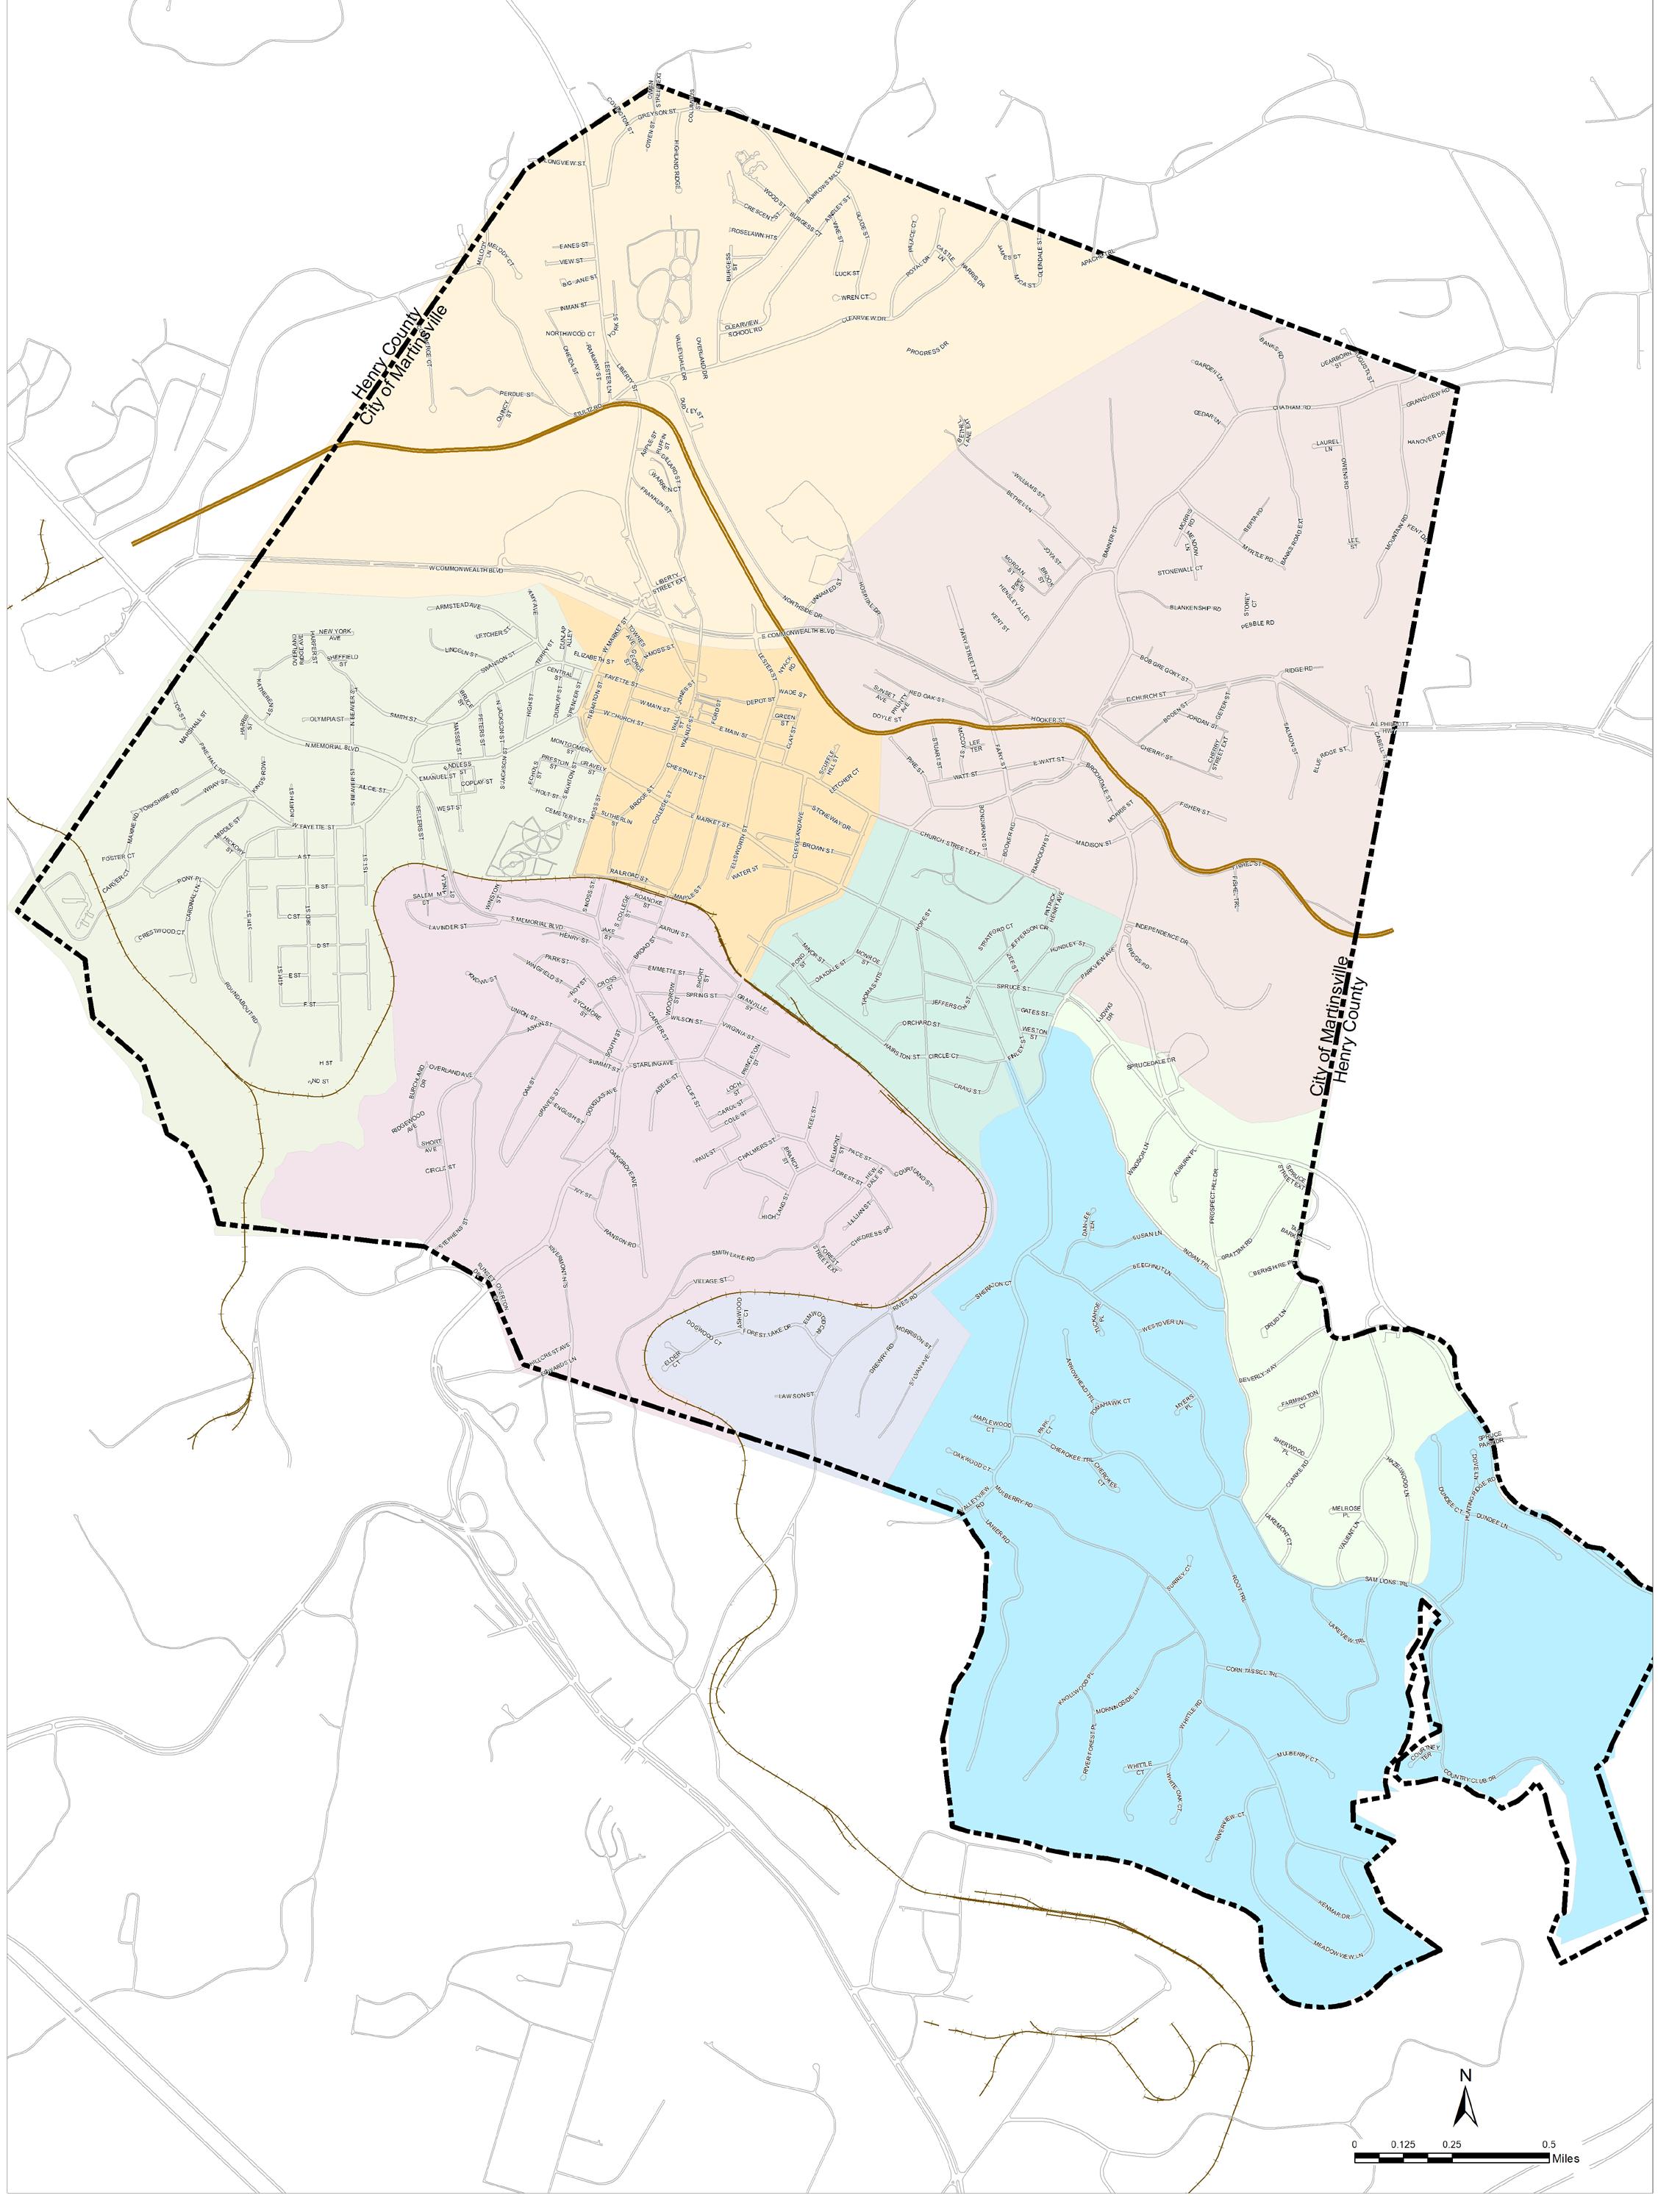
After scoring residential structures in Martinsville, Summit staff used GIS data to create maps of building conditions in the nine neighborhood areas designated by Martinsville staff:
• Northside
• West End
• Uptown
• East End
• Mulberry
• Rives Road Extension
• Forest Park
• Druid Hills
In addition to denoting building conditions, other information was gathered and mapped for residential structures, such as dwelling type (single-family or multifamily) and whether the structure was occupied or vacant. In addition, structures that are mixed-use (commercial and residential uses in the same building) or Cityowned are noted in the data. Large groupings of parcels that are owned by the same individual or group are also identified.
After recording building conditions for all residential structures, Summit staff identified areas with high concentrations of deteriorating housing. To provide context, housing conditions were reviewed alongside demographic information from the Decennial Census and the American Community Survey (ACS).
As part of the Housing Assessment, Summit staff researched large parcels (over 5 acres) in Martinsville with the possibility for development. This determination was based largely, but not solely, on:
• If the property is currently vacant.
• If the property had previously been utilized and had been cleared.
• If utilities are available on the property.
• Any other constraints of the property.
• Current ownership of the property.
This information has been compiled, analyzed, and summarized in this report.
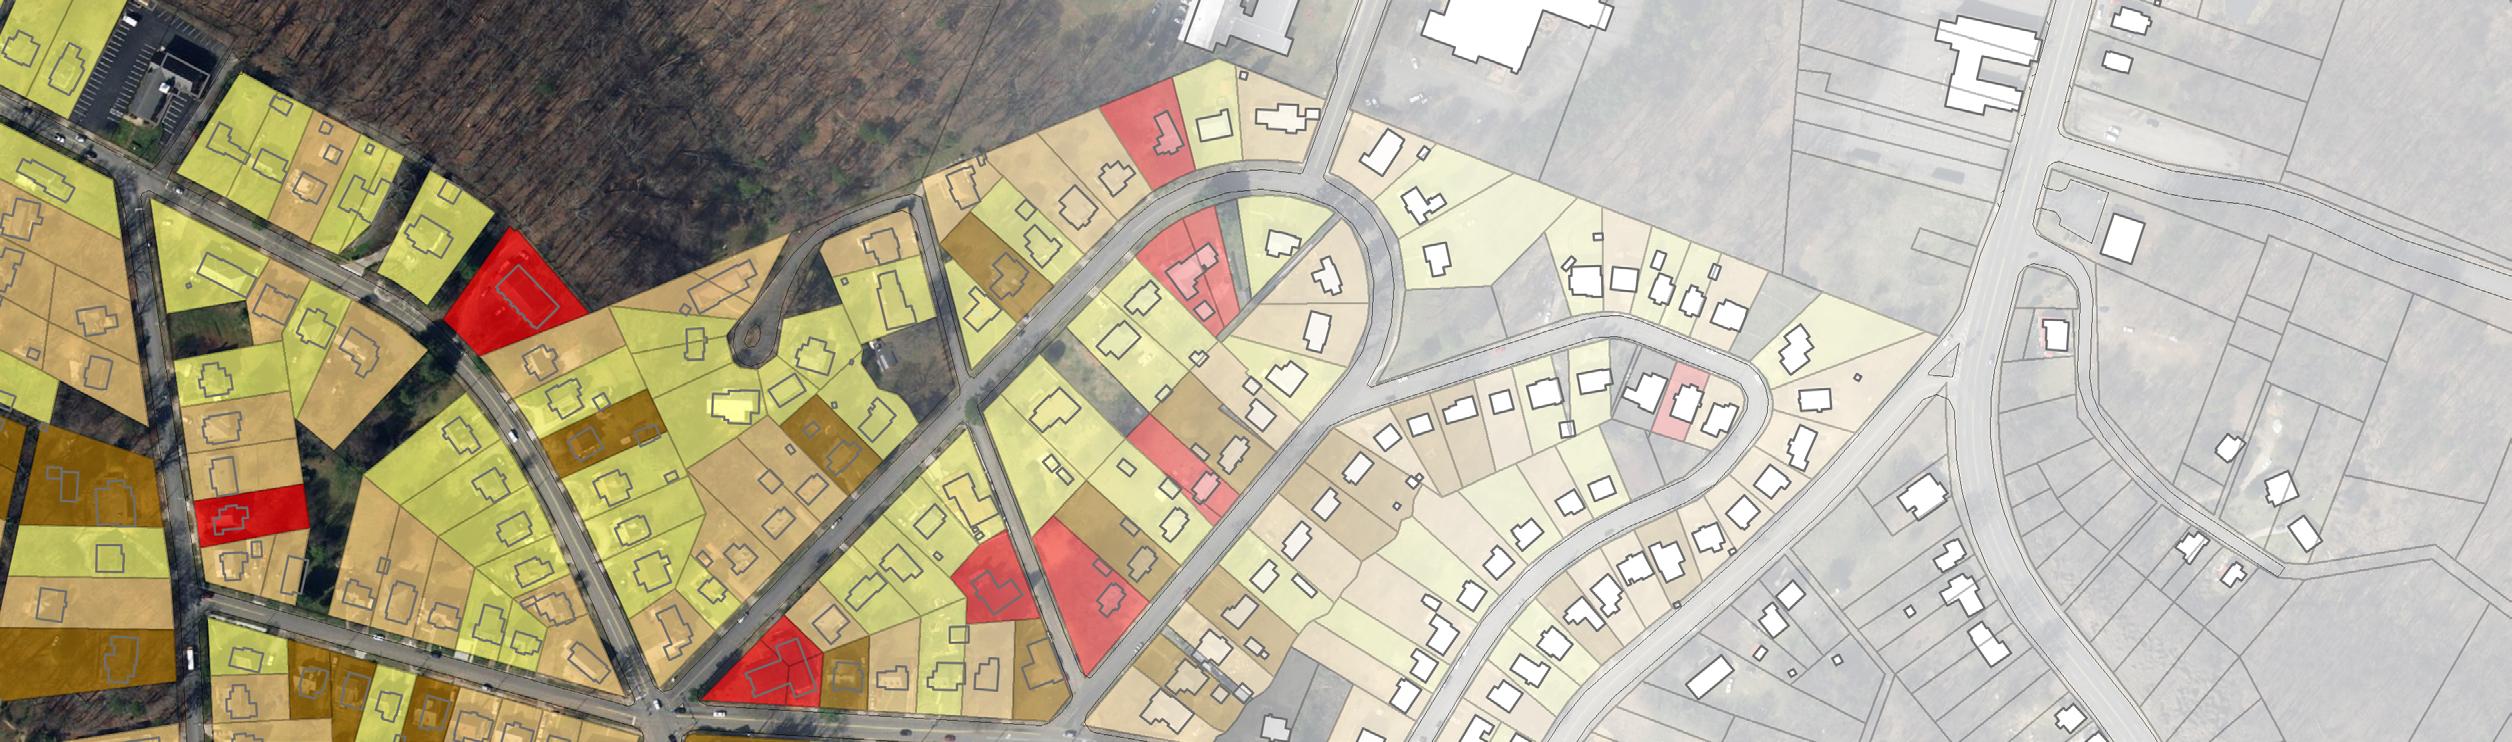
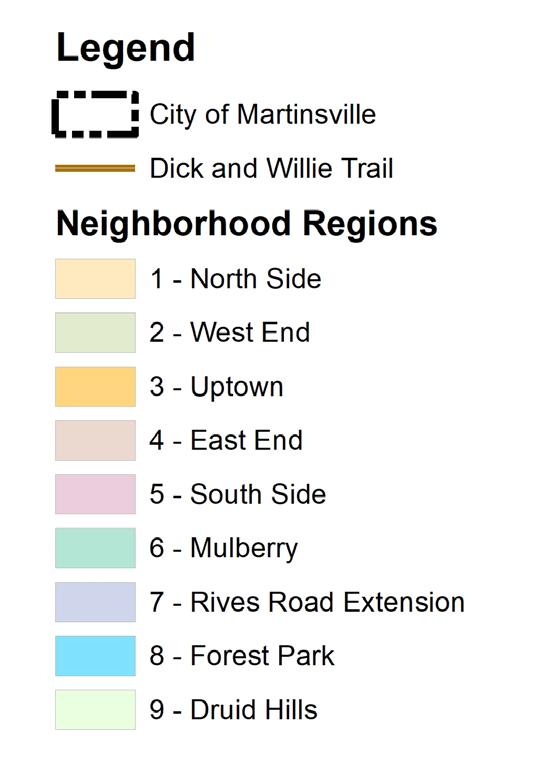
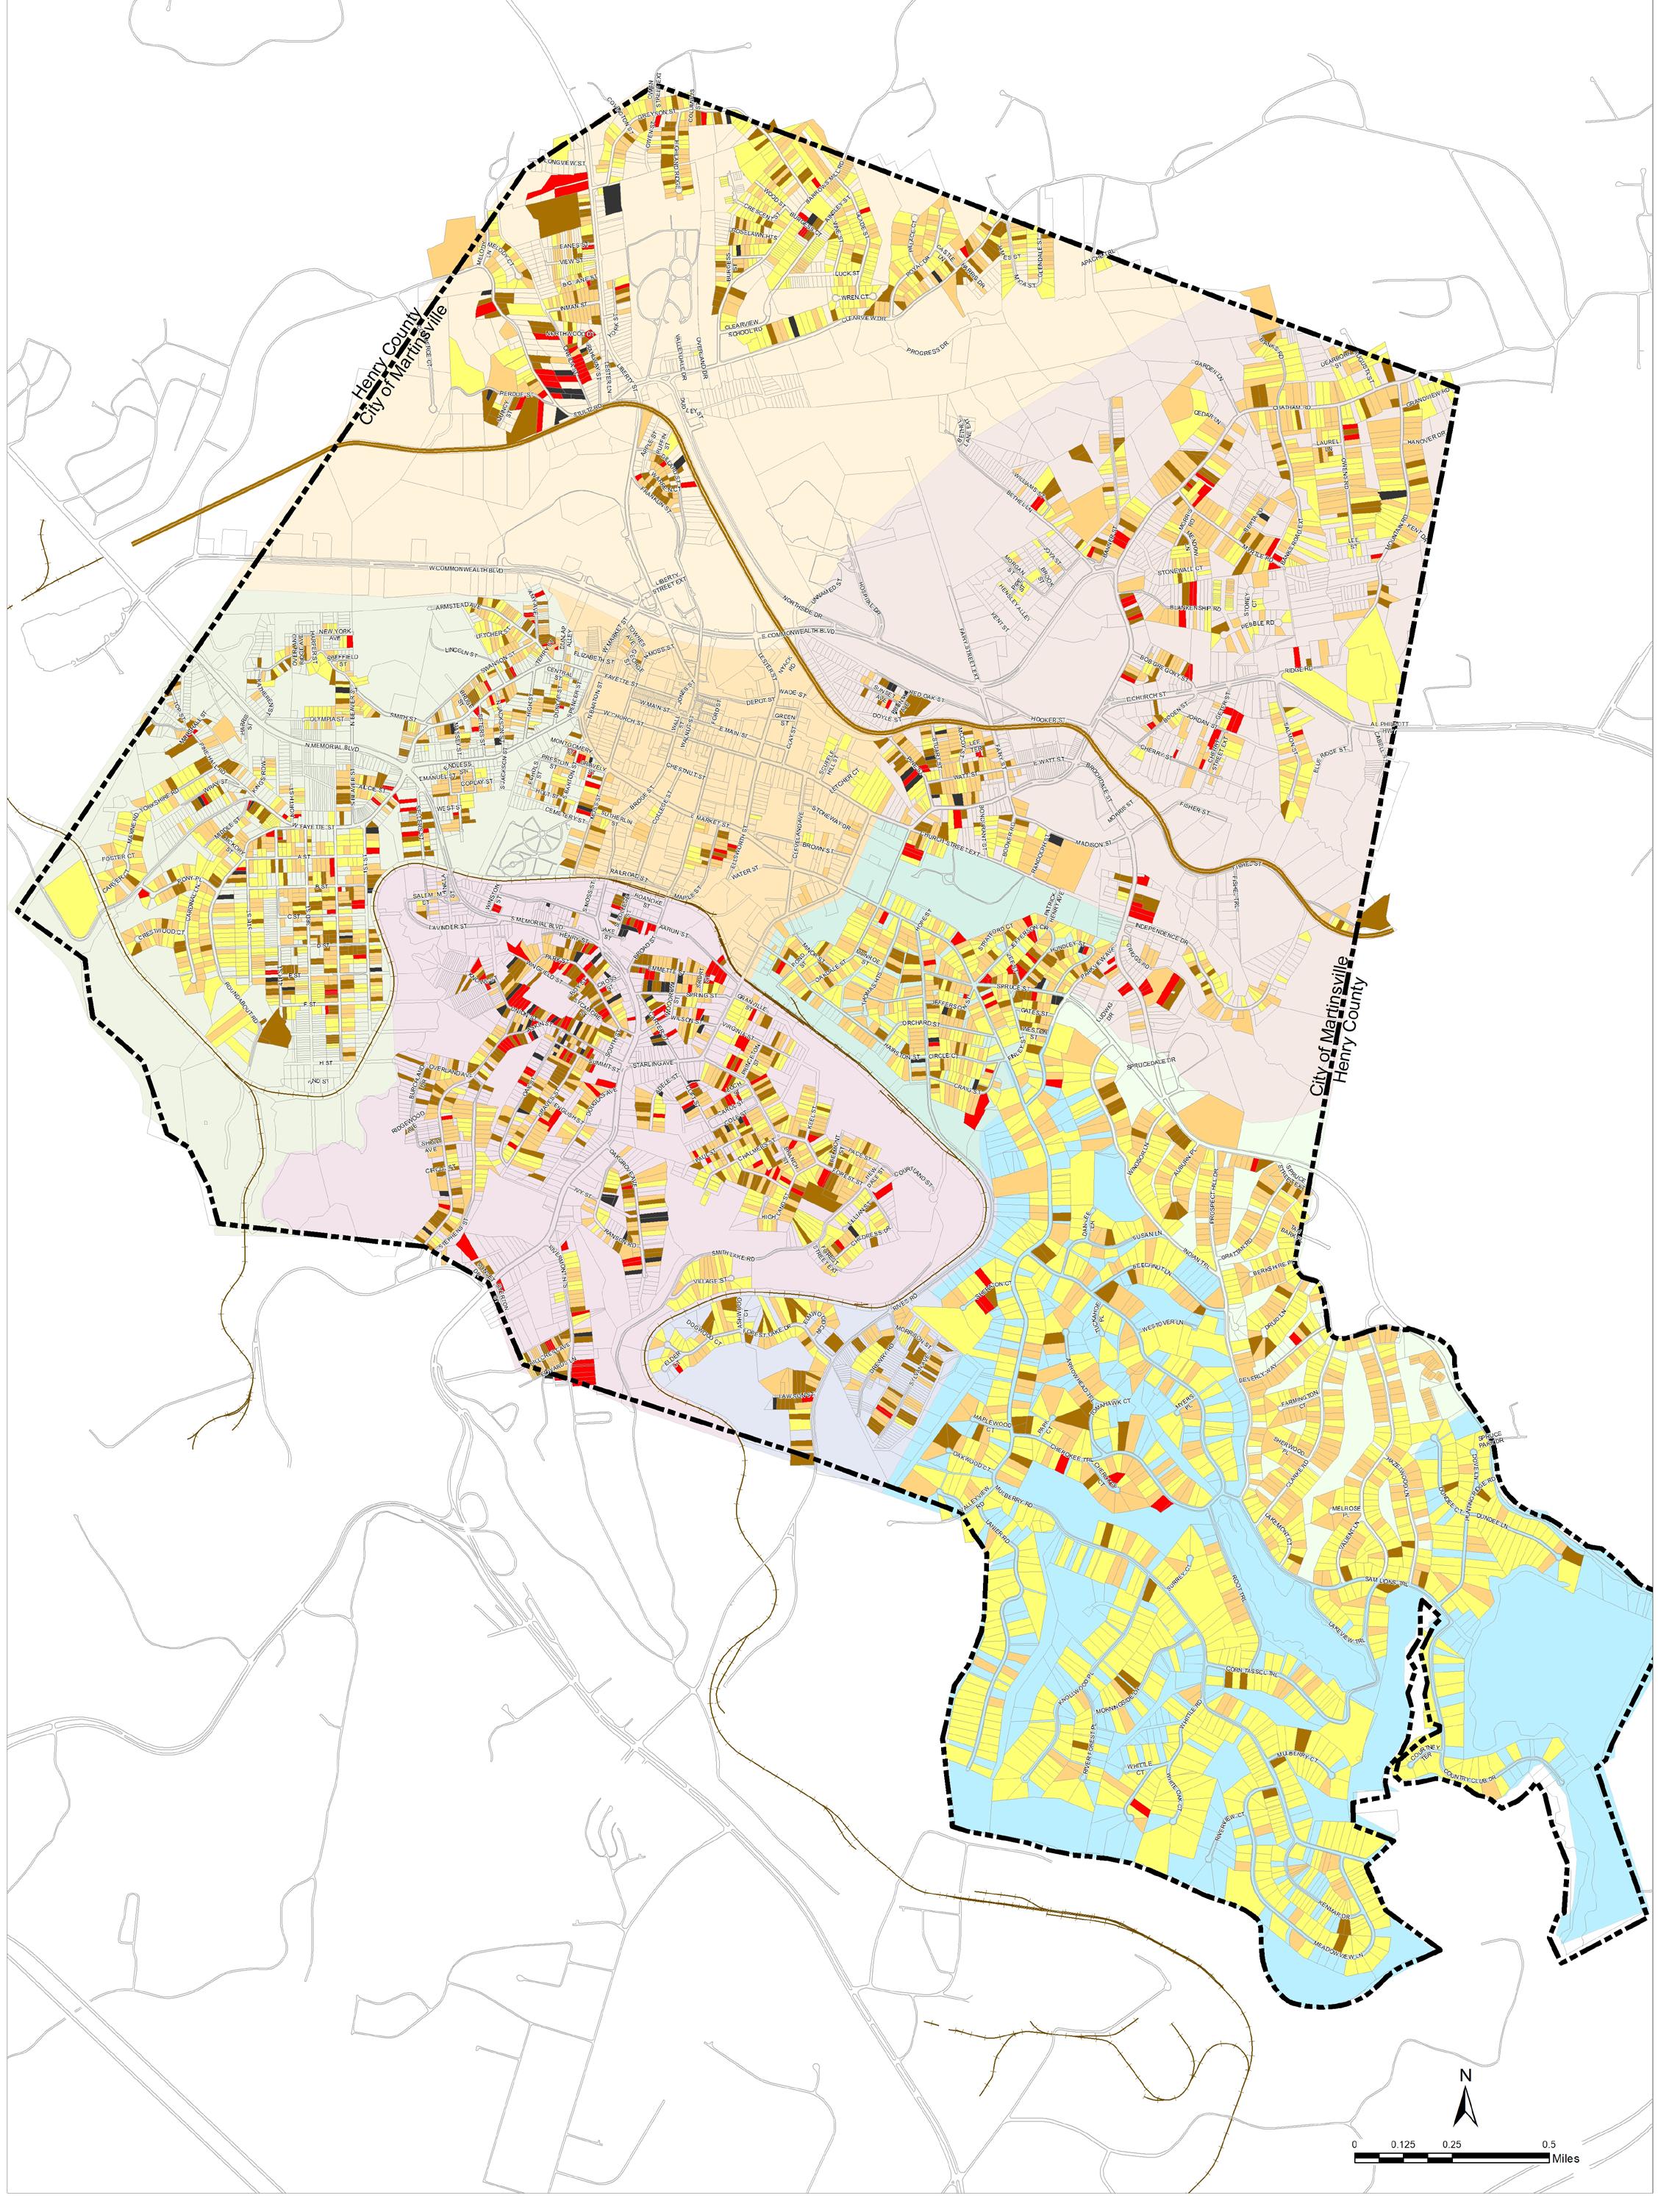
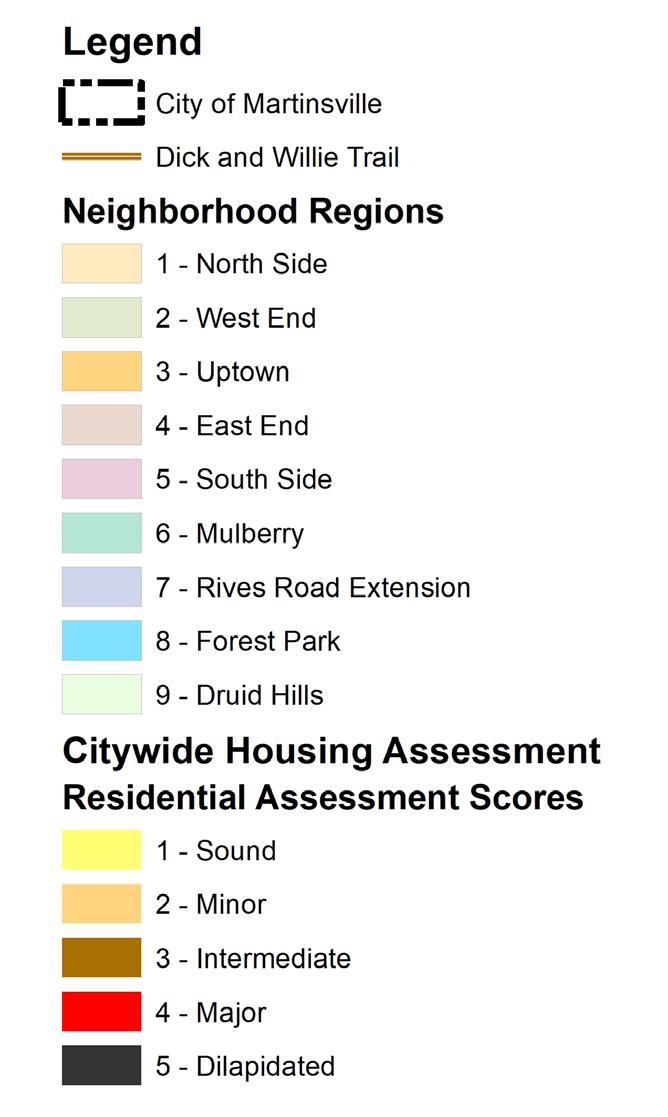
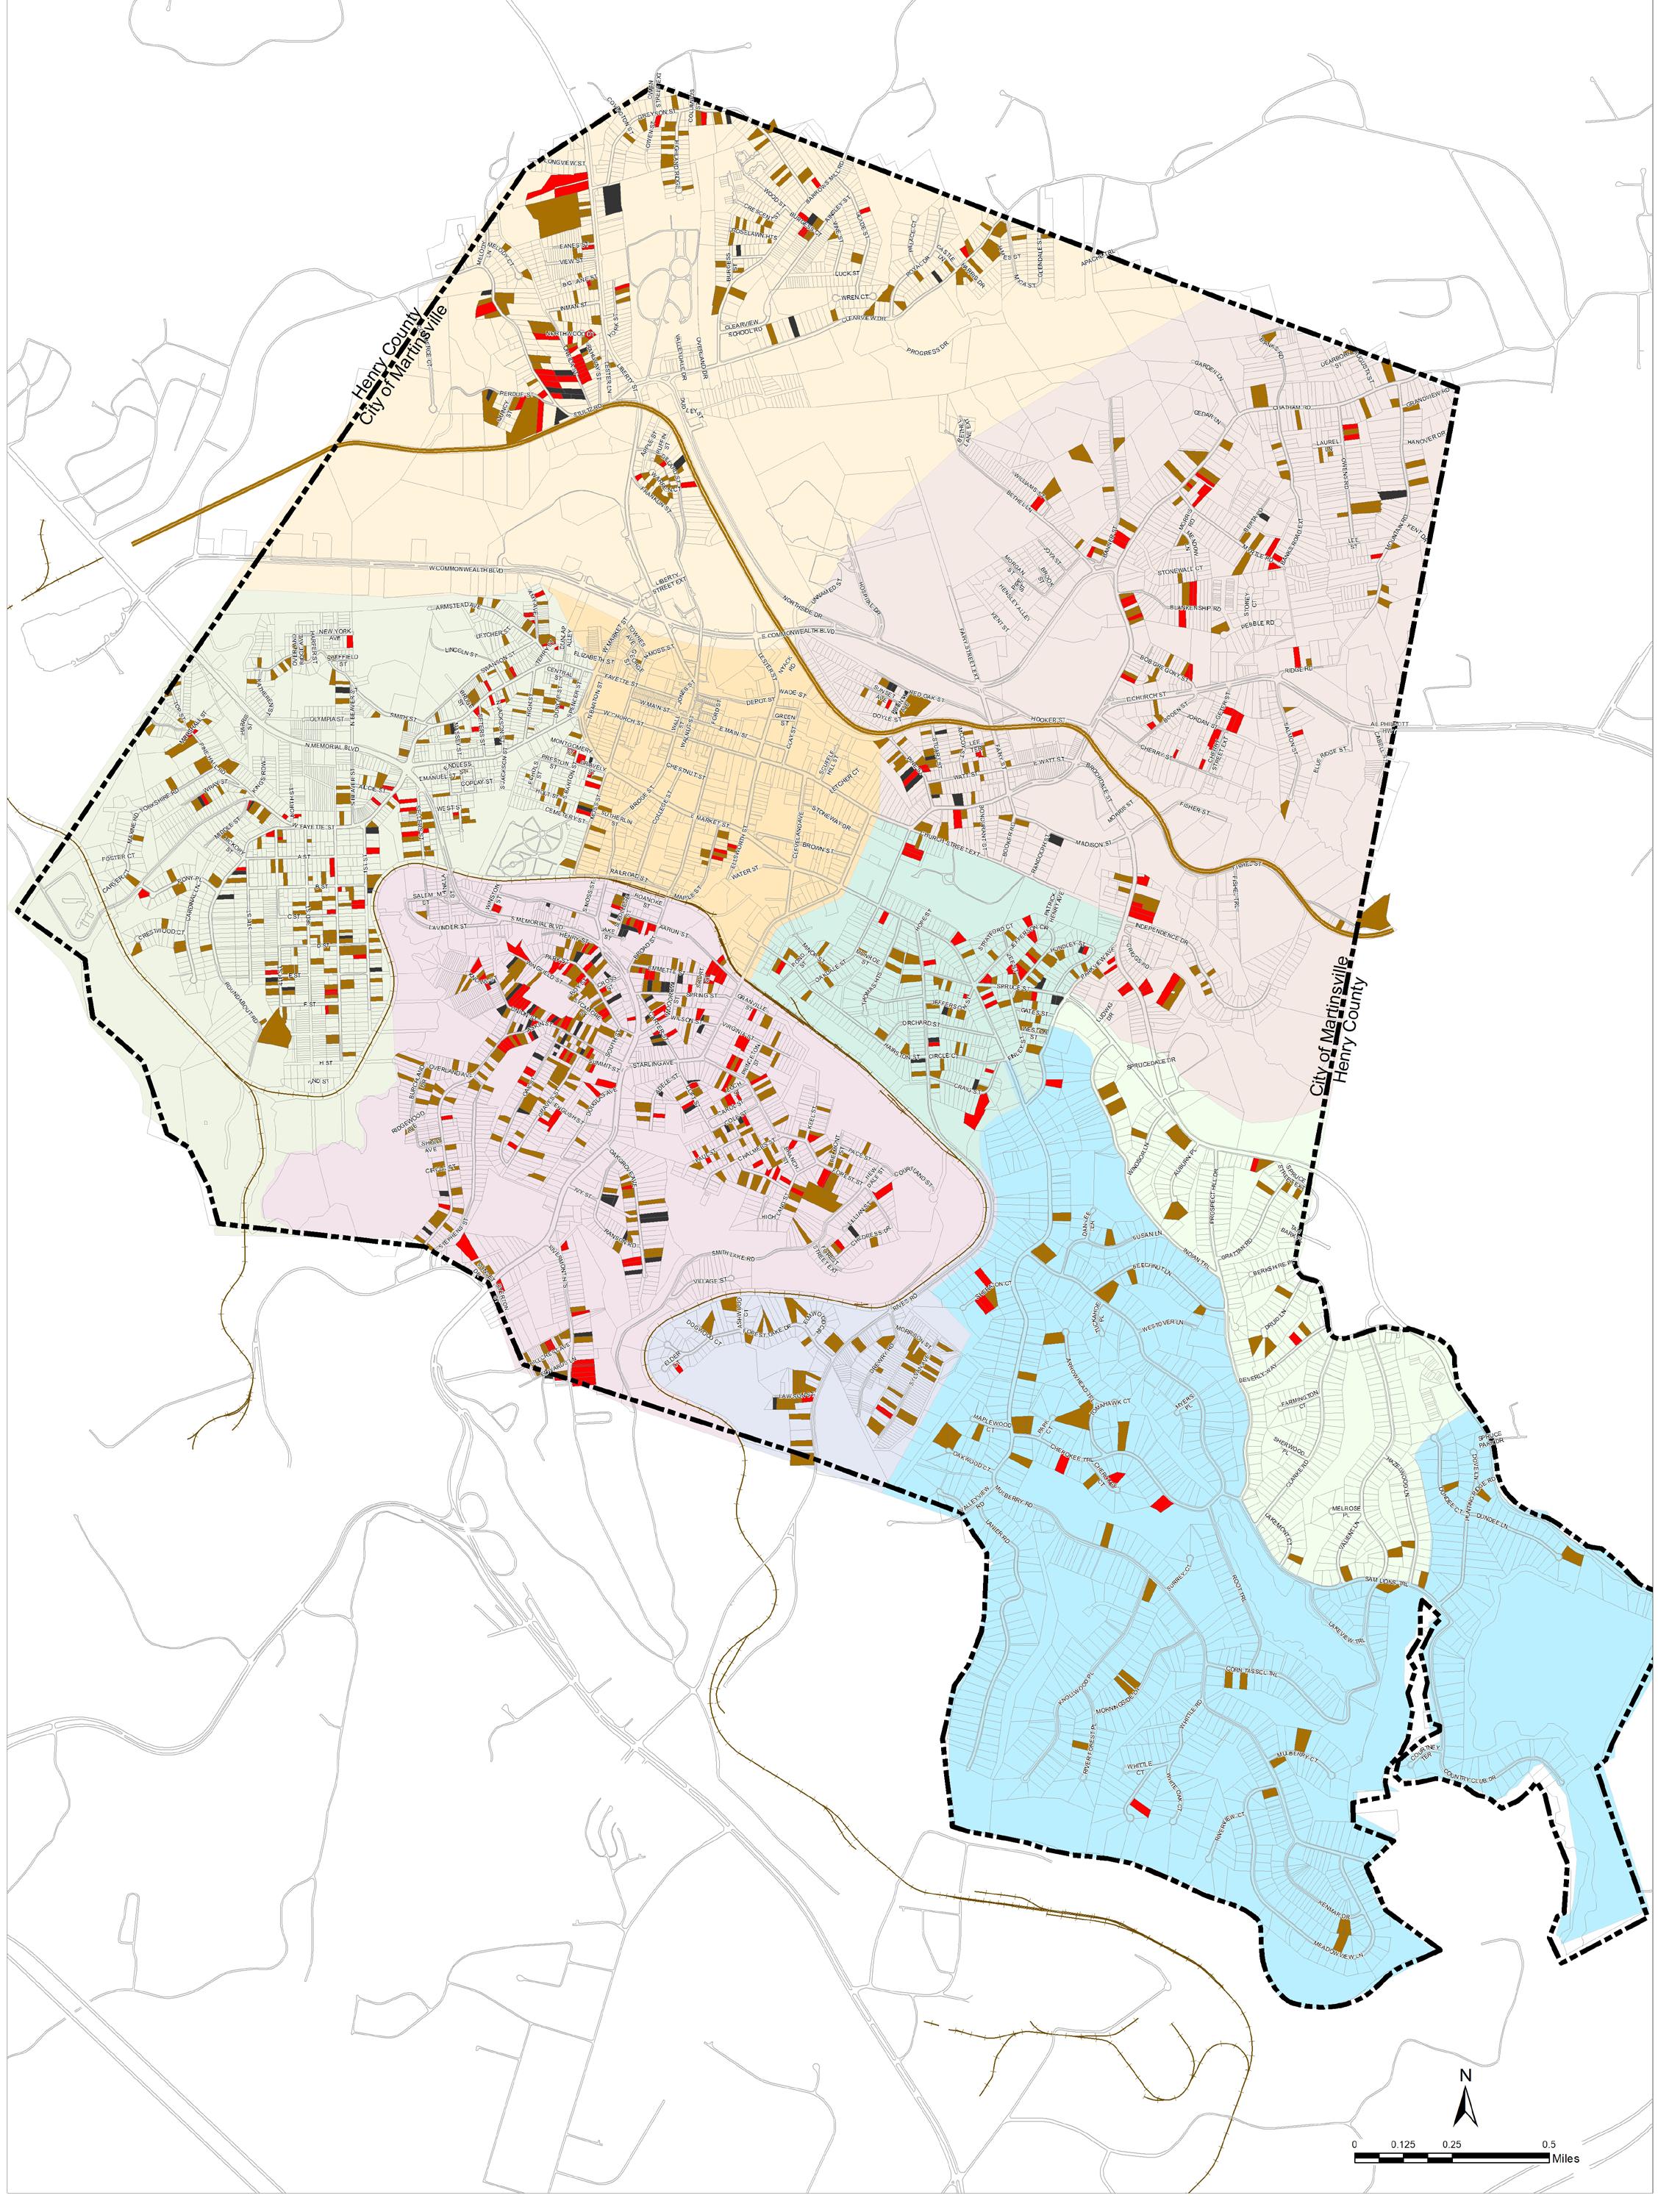
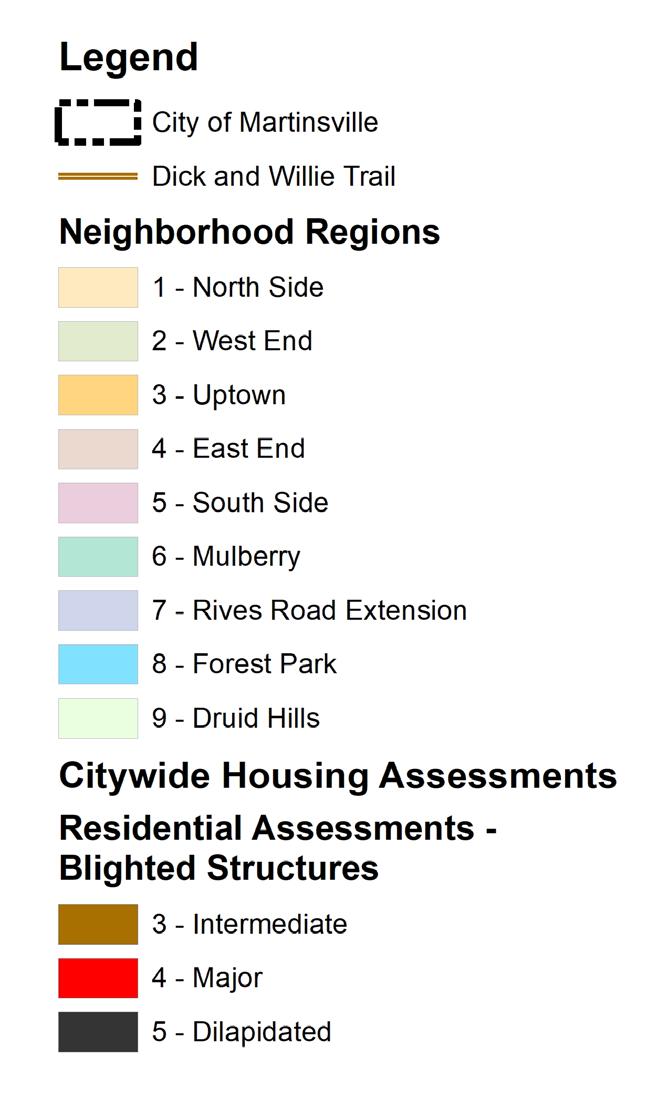
The following city-wide maps illustrate neighborhood regions used for analysis and the results of the citywide housing assessment. To help viewers focus on areas with deteriorating housing conditions, the second map titled Citywide Housing Assessment excludes structures that were deemed "sound" during the windshield survey. The citywide maps are followed by graphics that compare housing conditions in different neighborhoods of Martinsville.
Additionally, each designated neighborhood is mapped individually to show the detailed scoring of each residential parcel within the area.
2
1
4
3
6
5
7
8
9
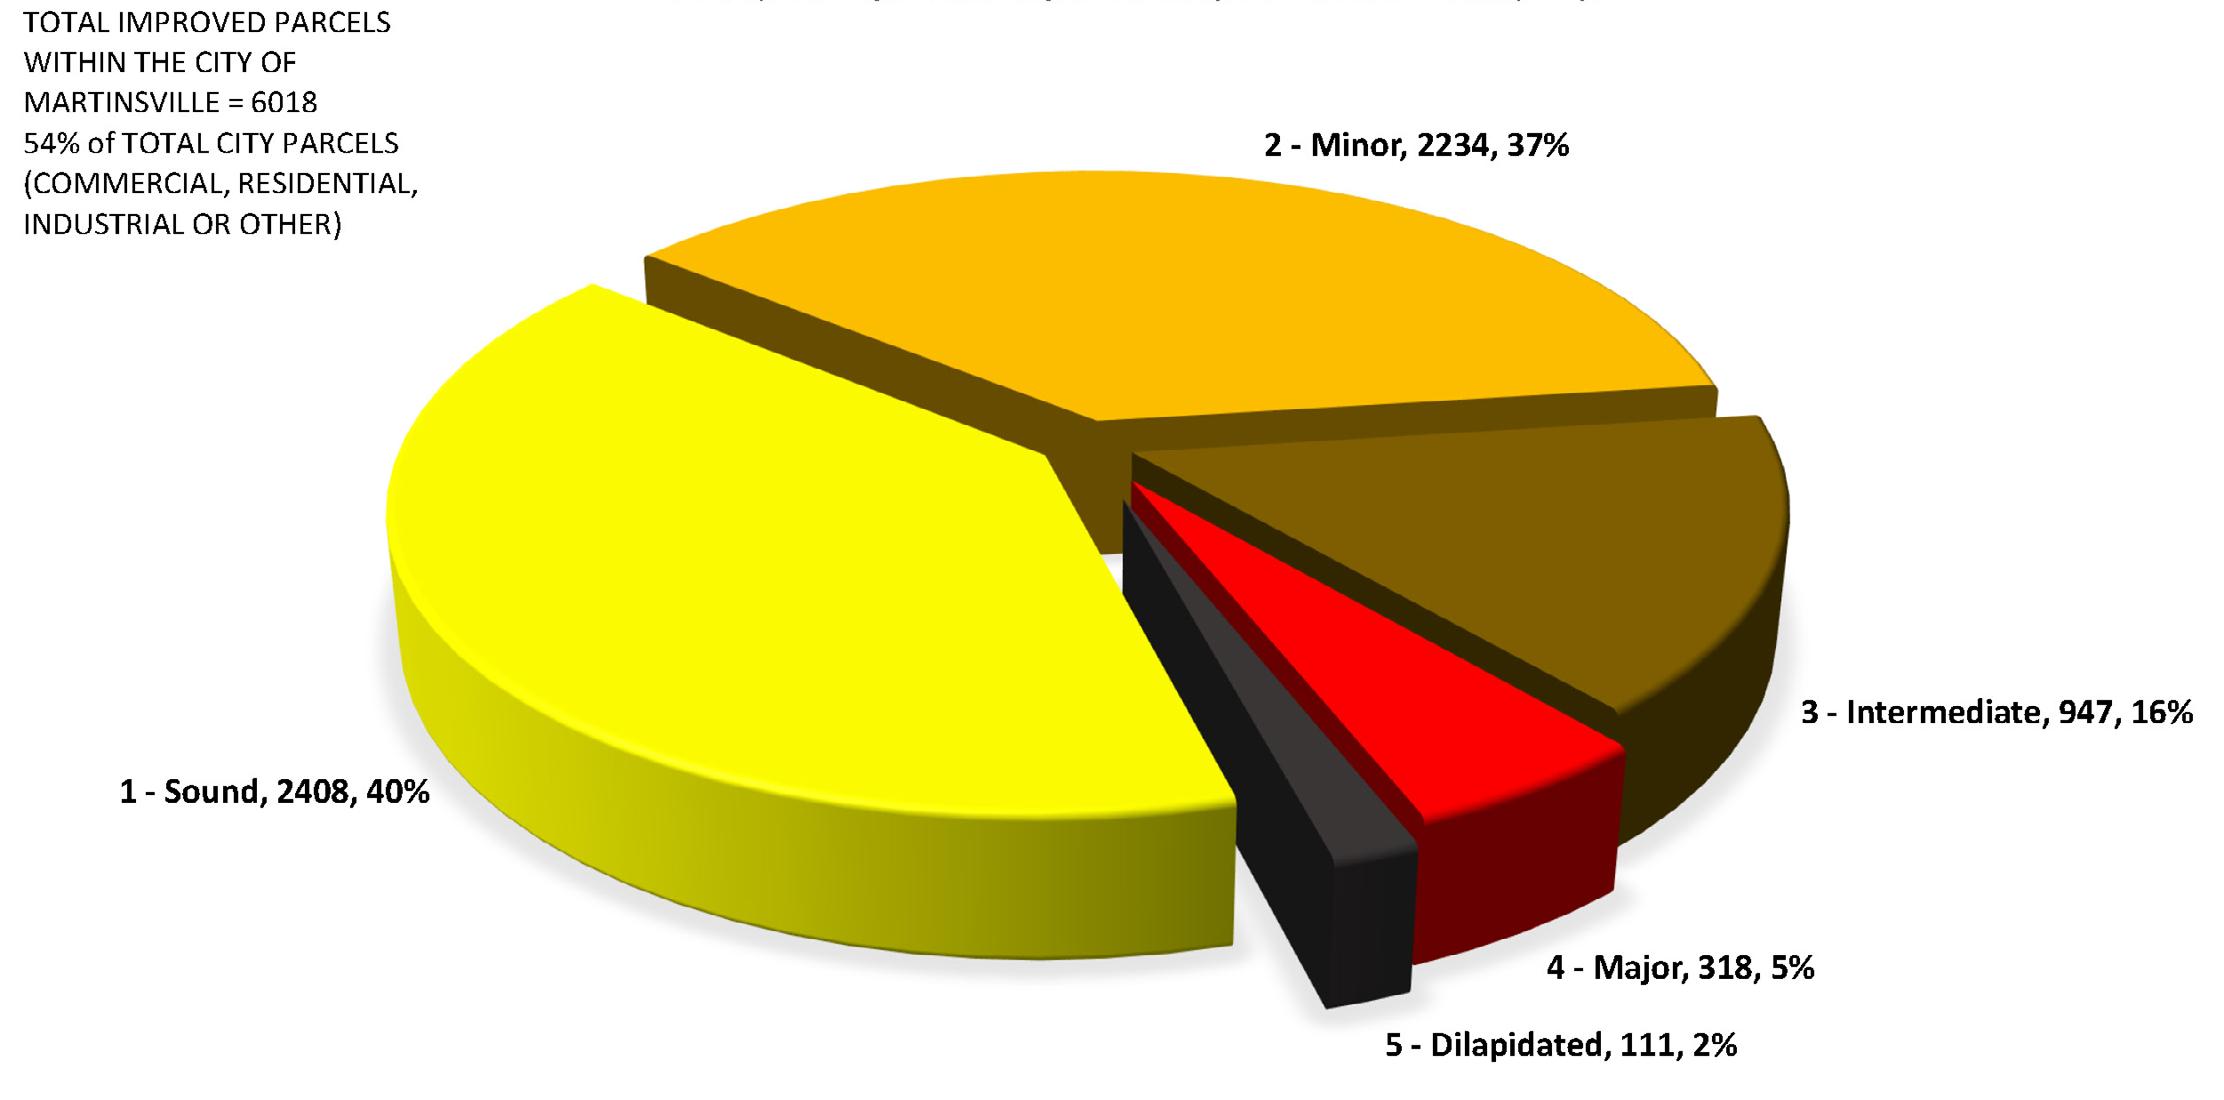
This pie chart shows the conditions of all residential parcels across the City of Martinsville separated by building condition. Approximately 23% of the city's residential structures were considered to have Intermediate, Major, or Dilapidated condition.
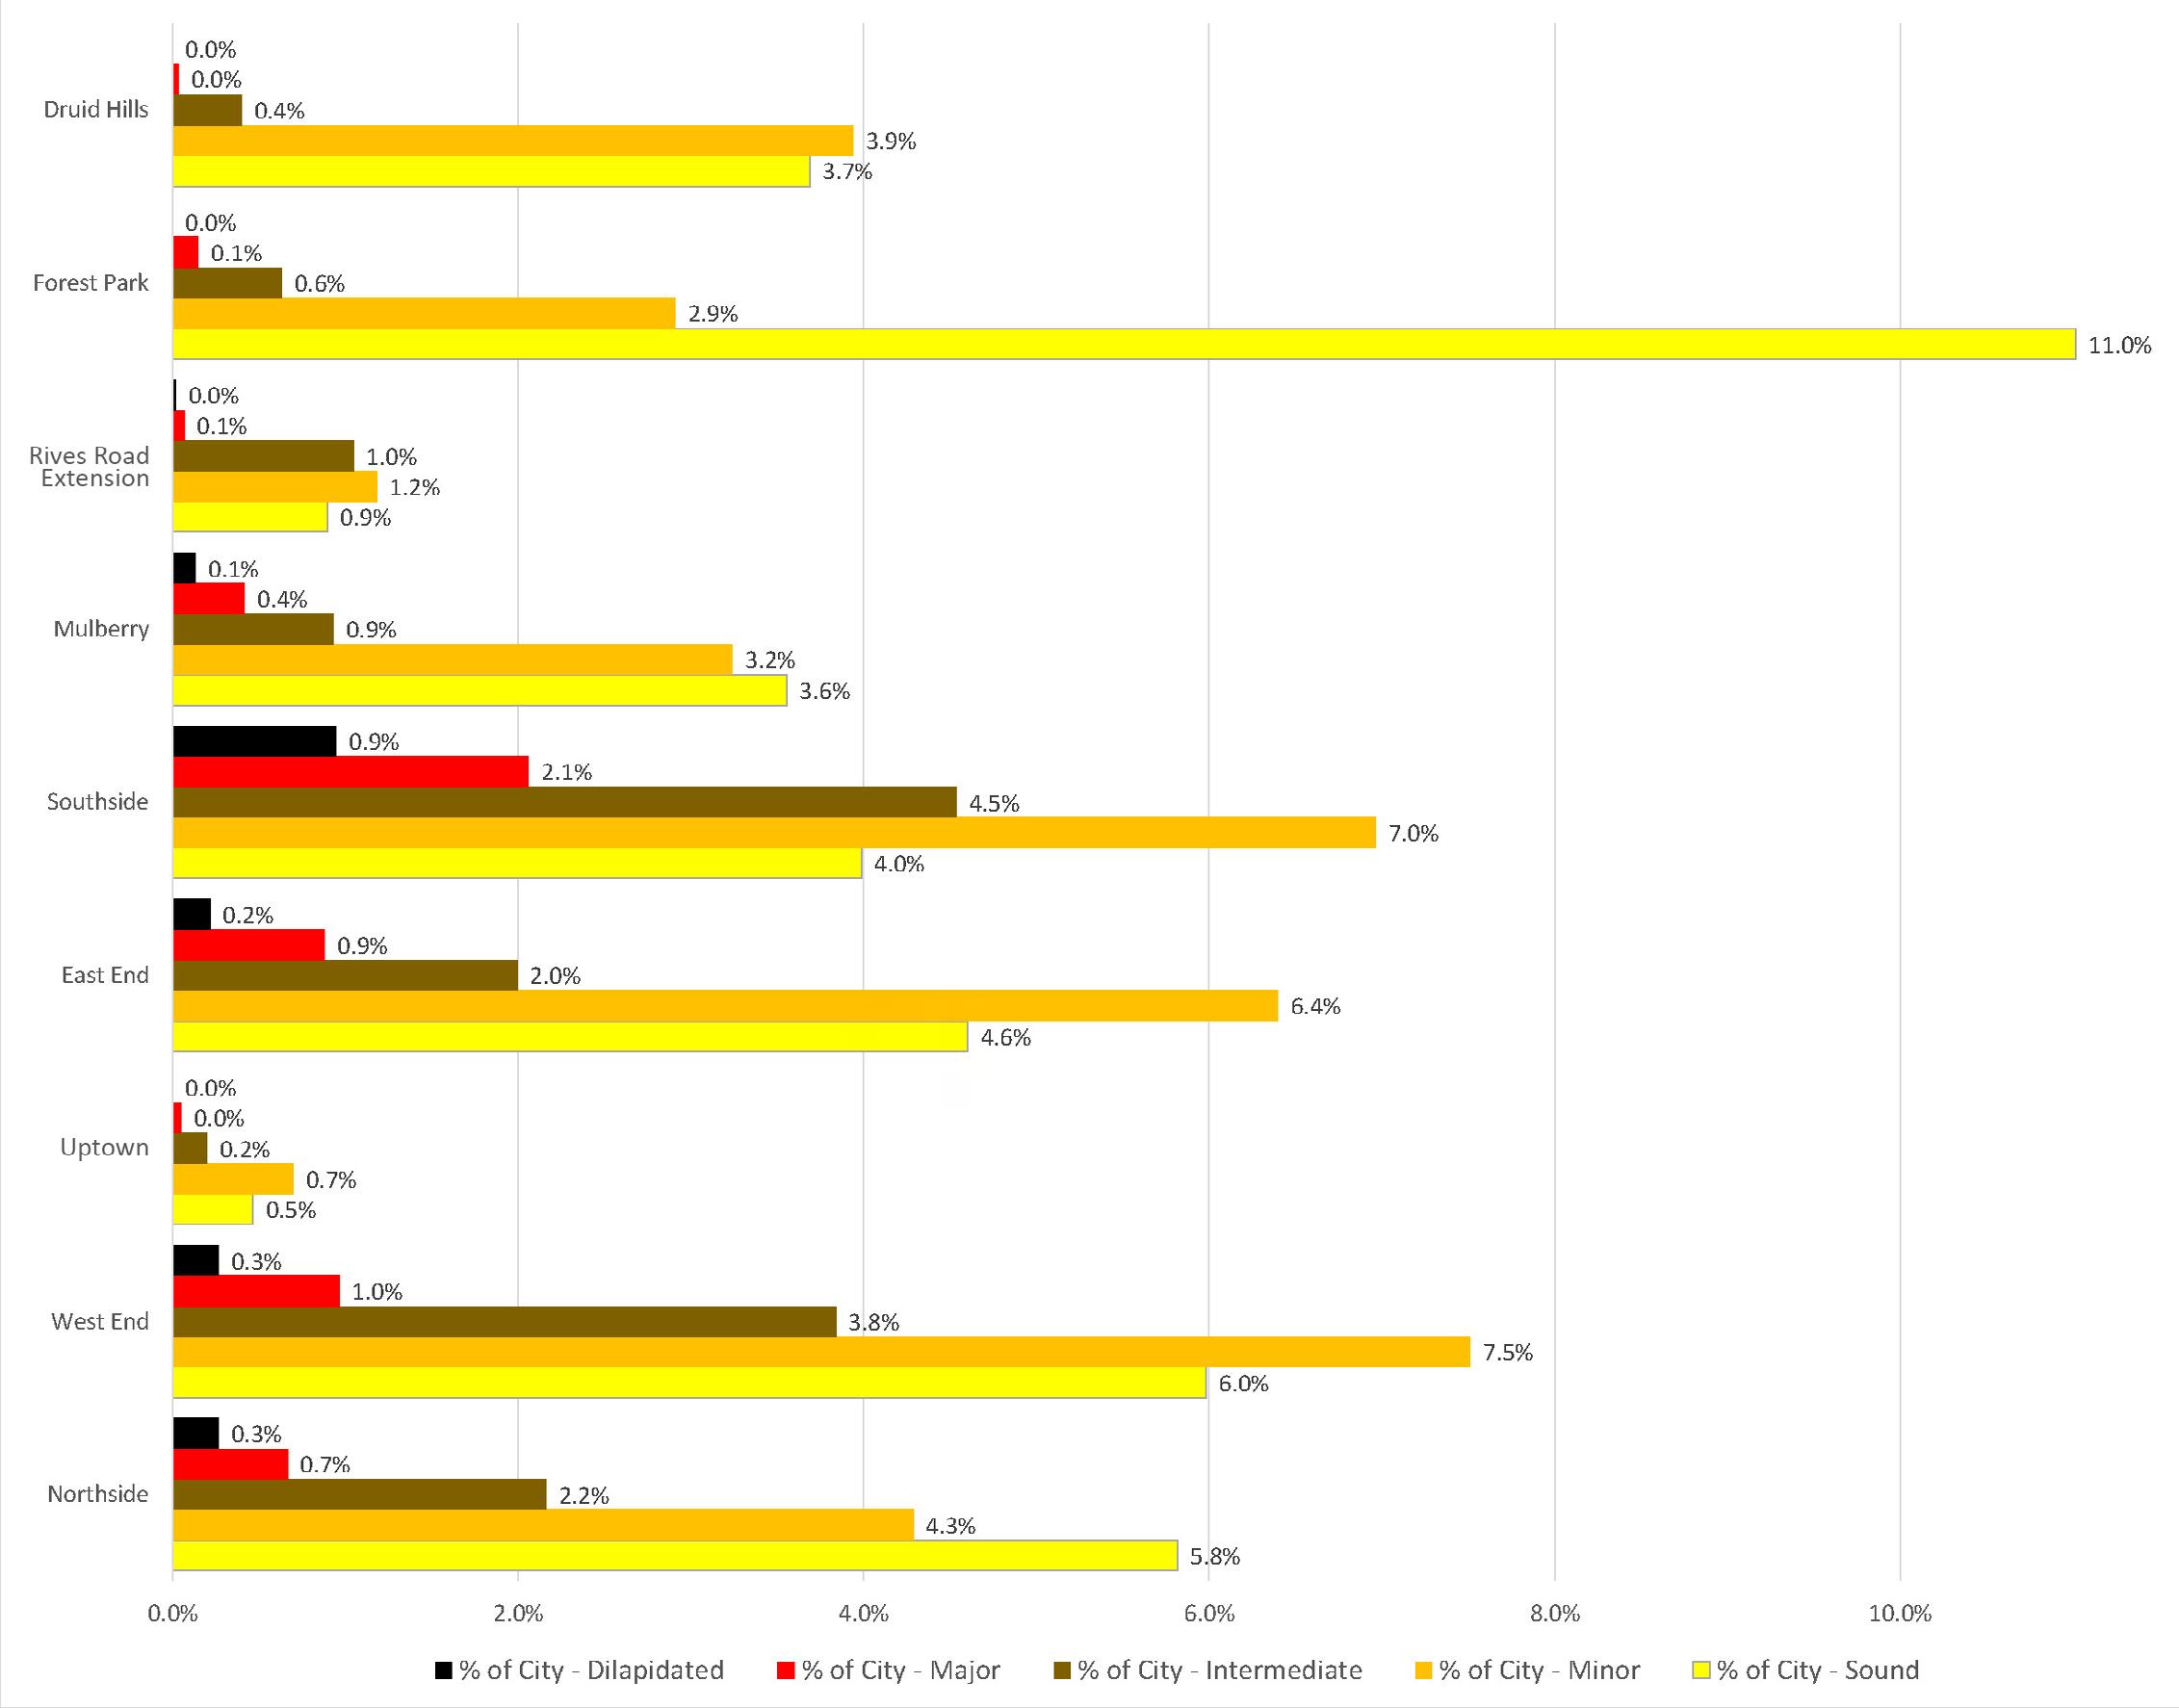
This graph shows the percentage of the conditions of all residential structures across the city. For example, the Southside area has 2.1% of structures with Major deficiencies and 0.9% of the city's structures that are dilapidated - the highest share of the city's total, of any designated neighborhood area.
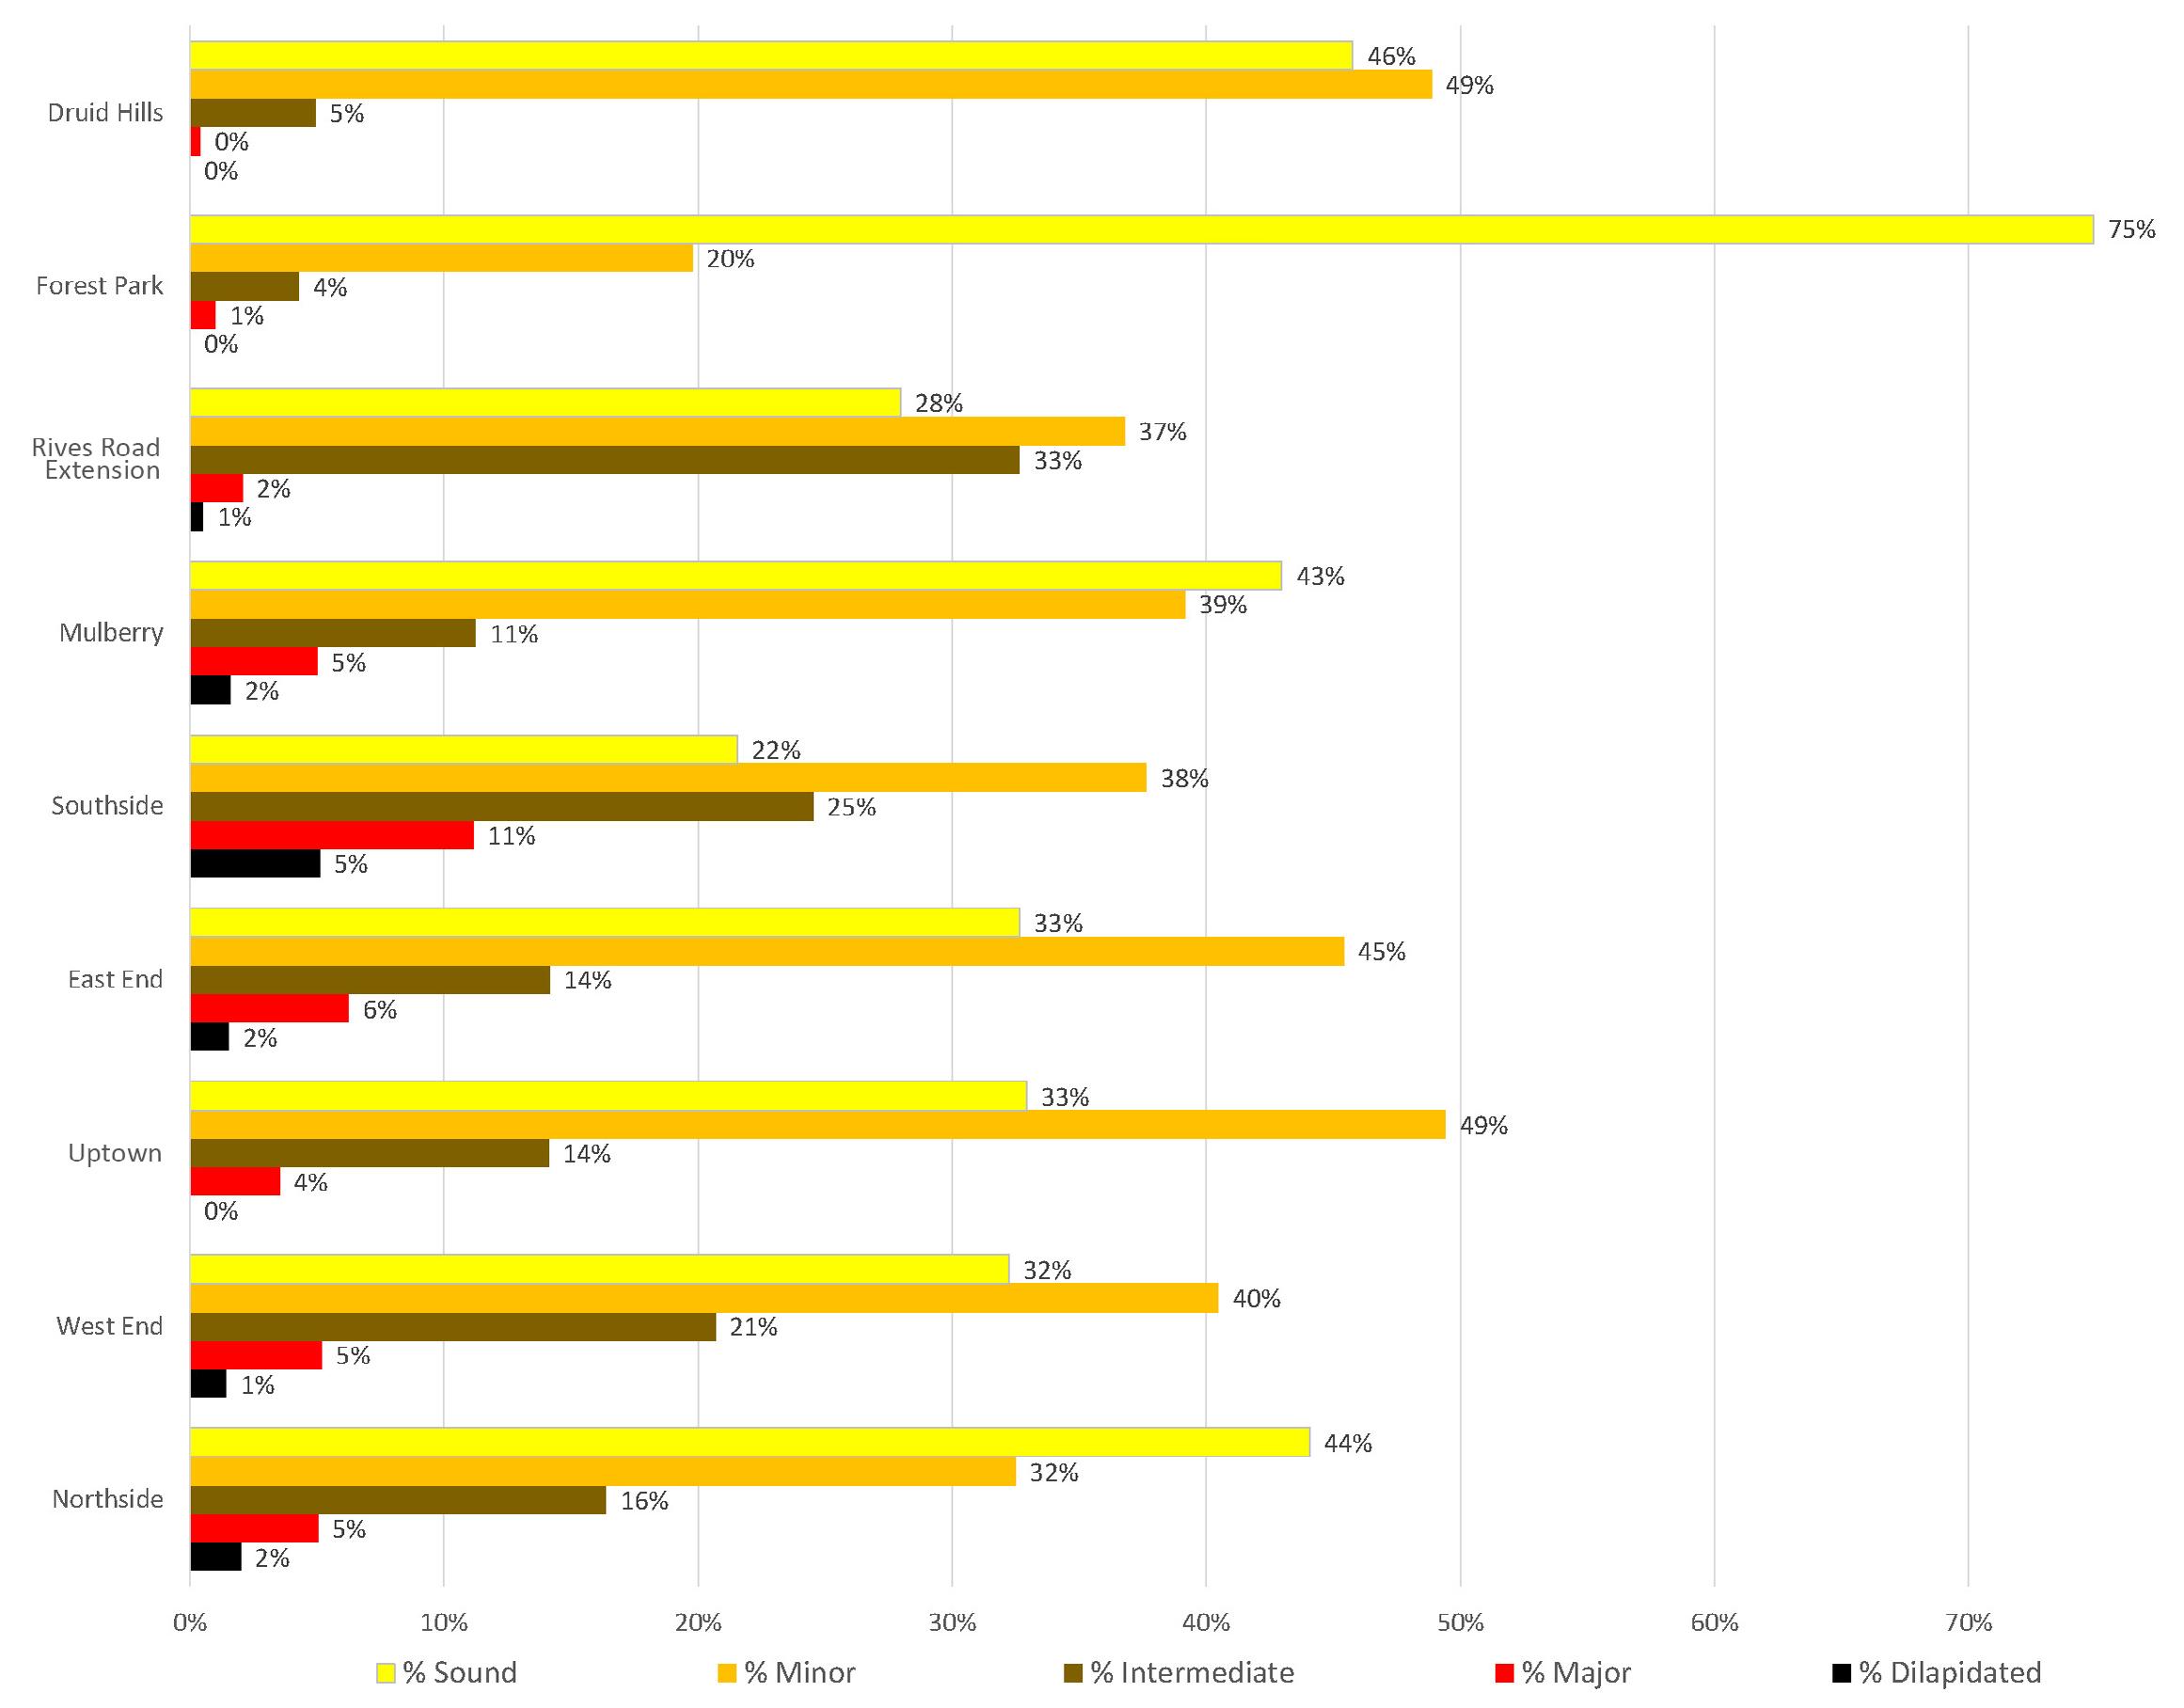
This graph shows the breakdown of residential structures' conditions within each separate neighborhood's total. For example, the Southside designated neighborhood area has 14% of its structures with Intermediate deficiencies, 11% of its structures with Major deficiencies, and 5% of its structures dilapidated.
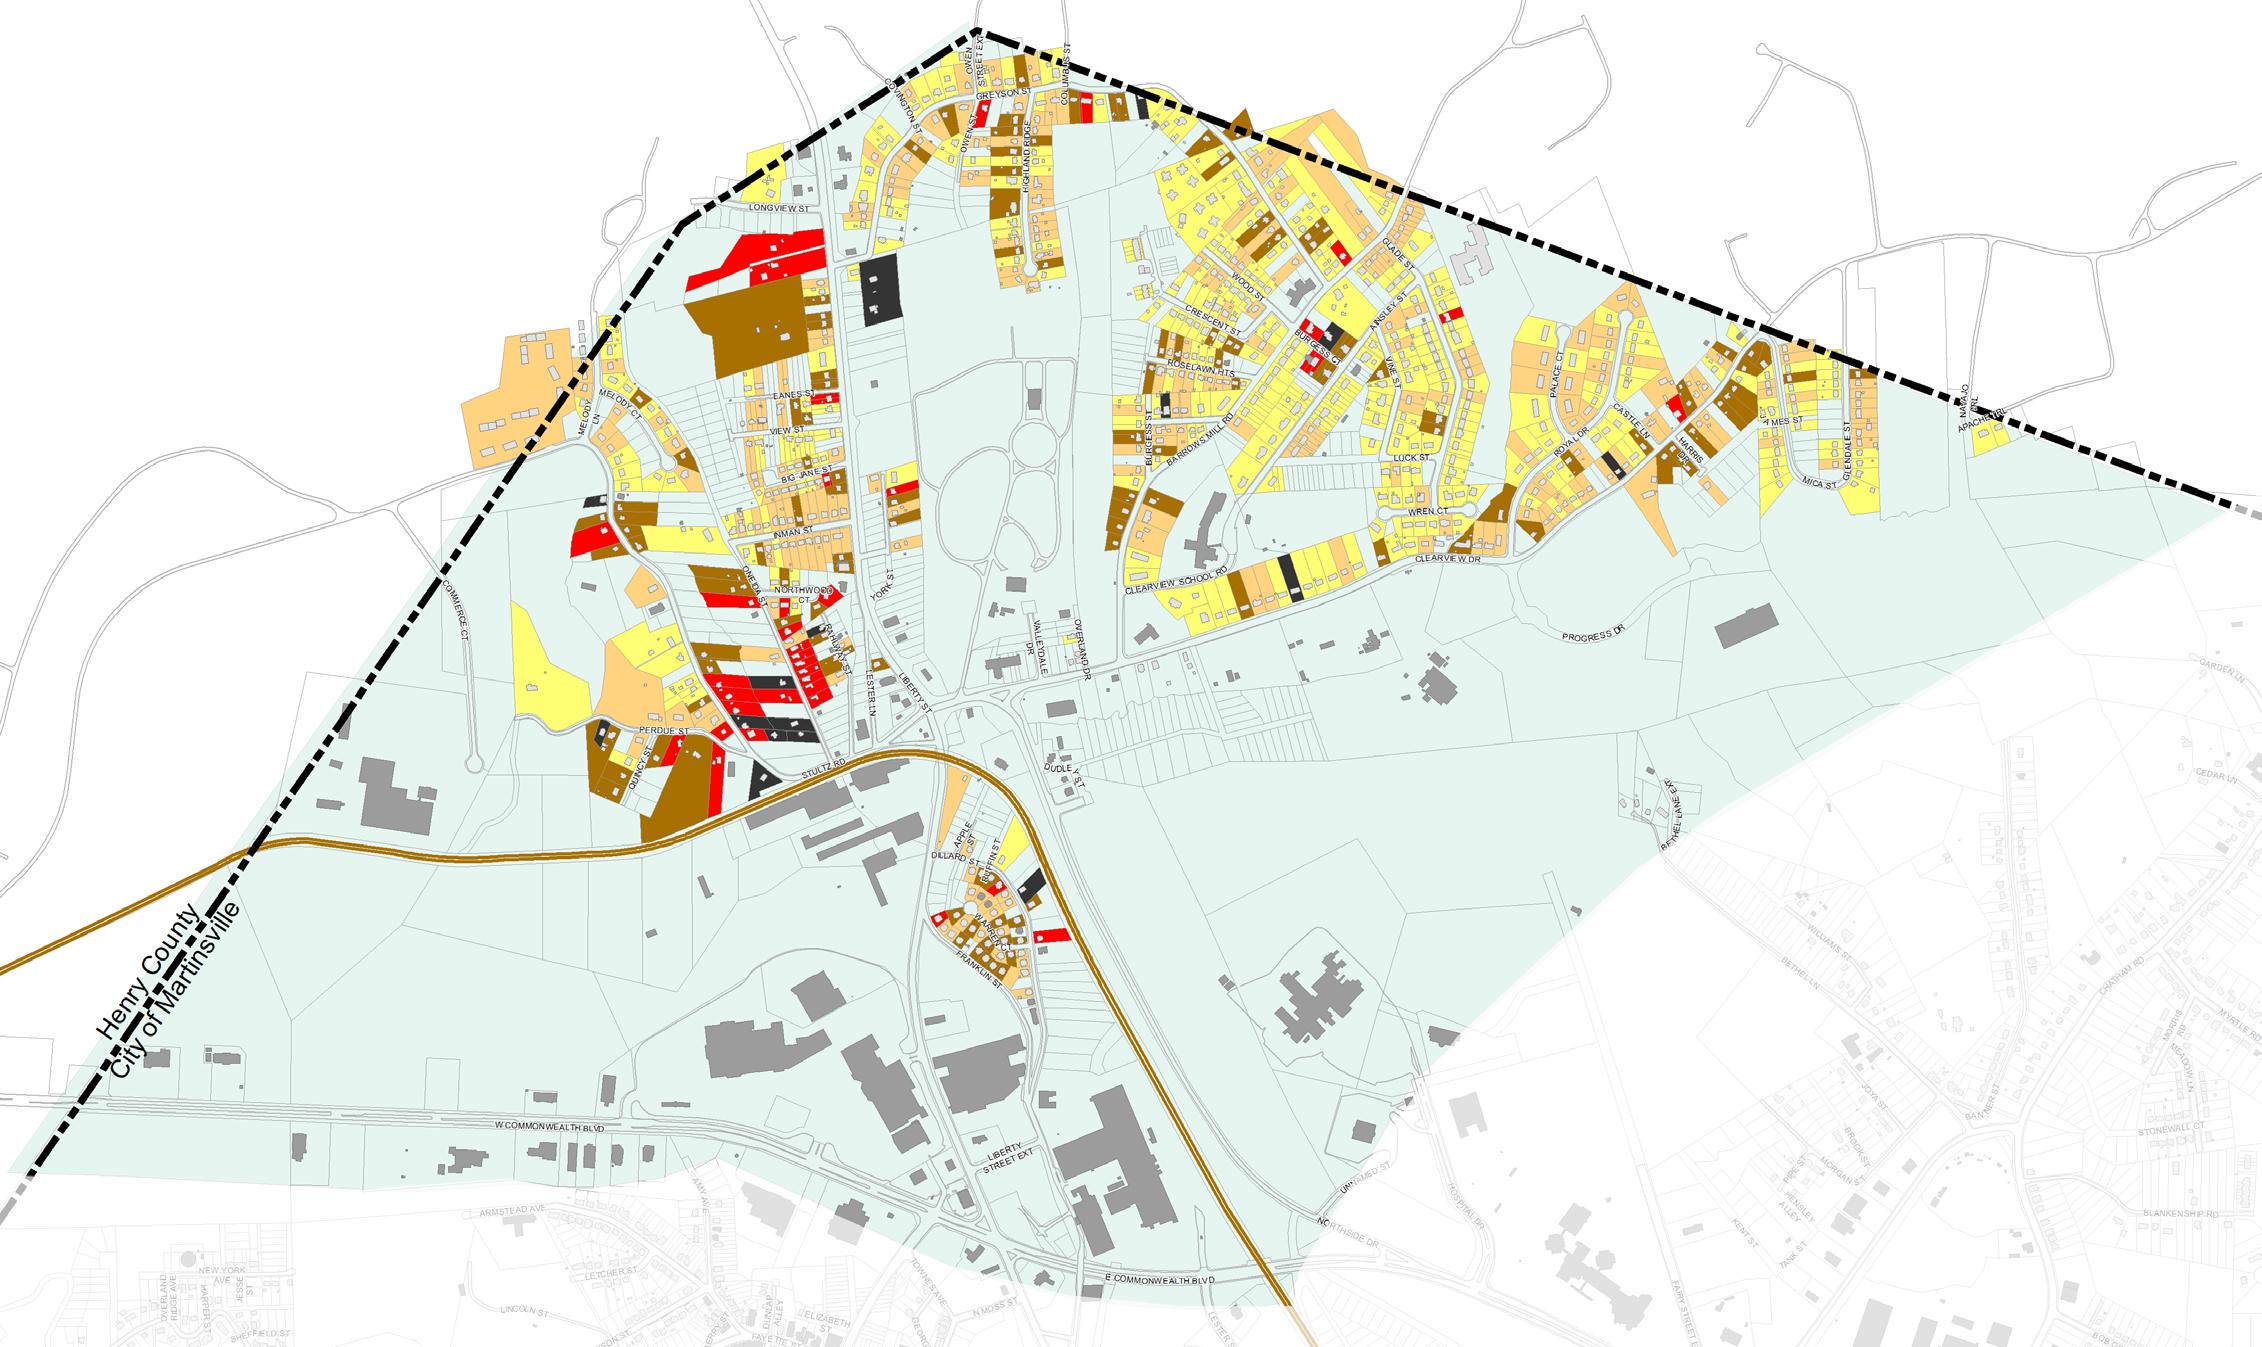
The Northside Neighborhood is the northernmost area of Martinsville. The table below shows the conditions of residential structures in the area. 1 (Sound) 2 (Minor) 3 (Inter.) 4 (Major) 5 (Dilap.)
Within the Northside Neighborhood, ESRI estimates that in 2022 there are approximately 500 Owner-Occupied Housing Units, which is 59% of the total neighborhood; 229 Renter-Occupied Housing Units, comprising 27% of the total neighborhood; and 118 Vacant Housing Units, making up 14% of the total neighborhood.
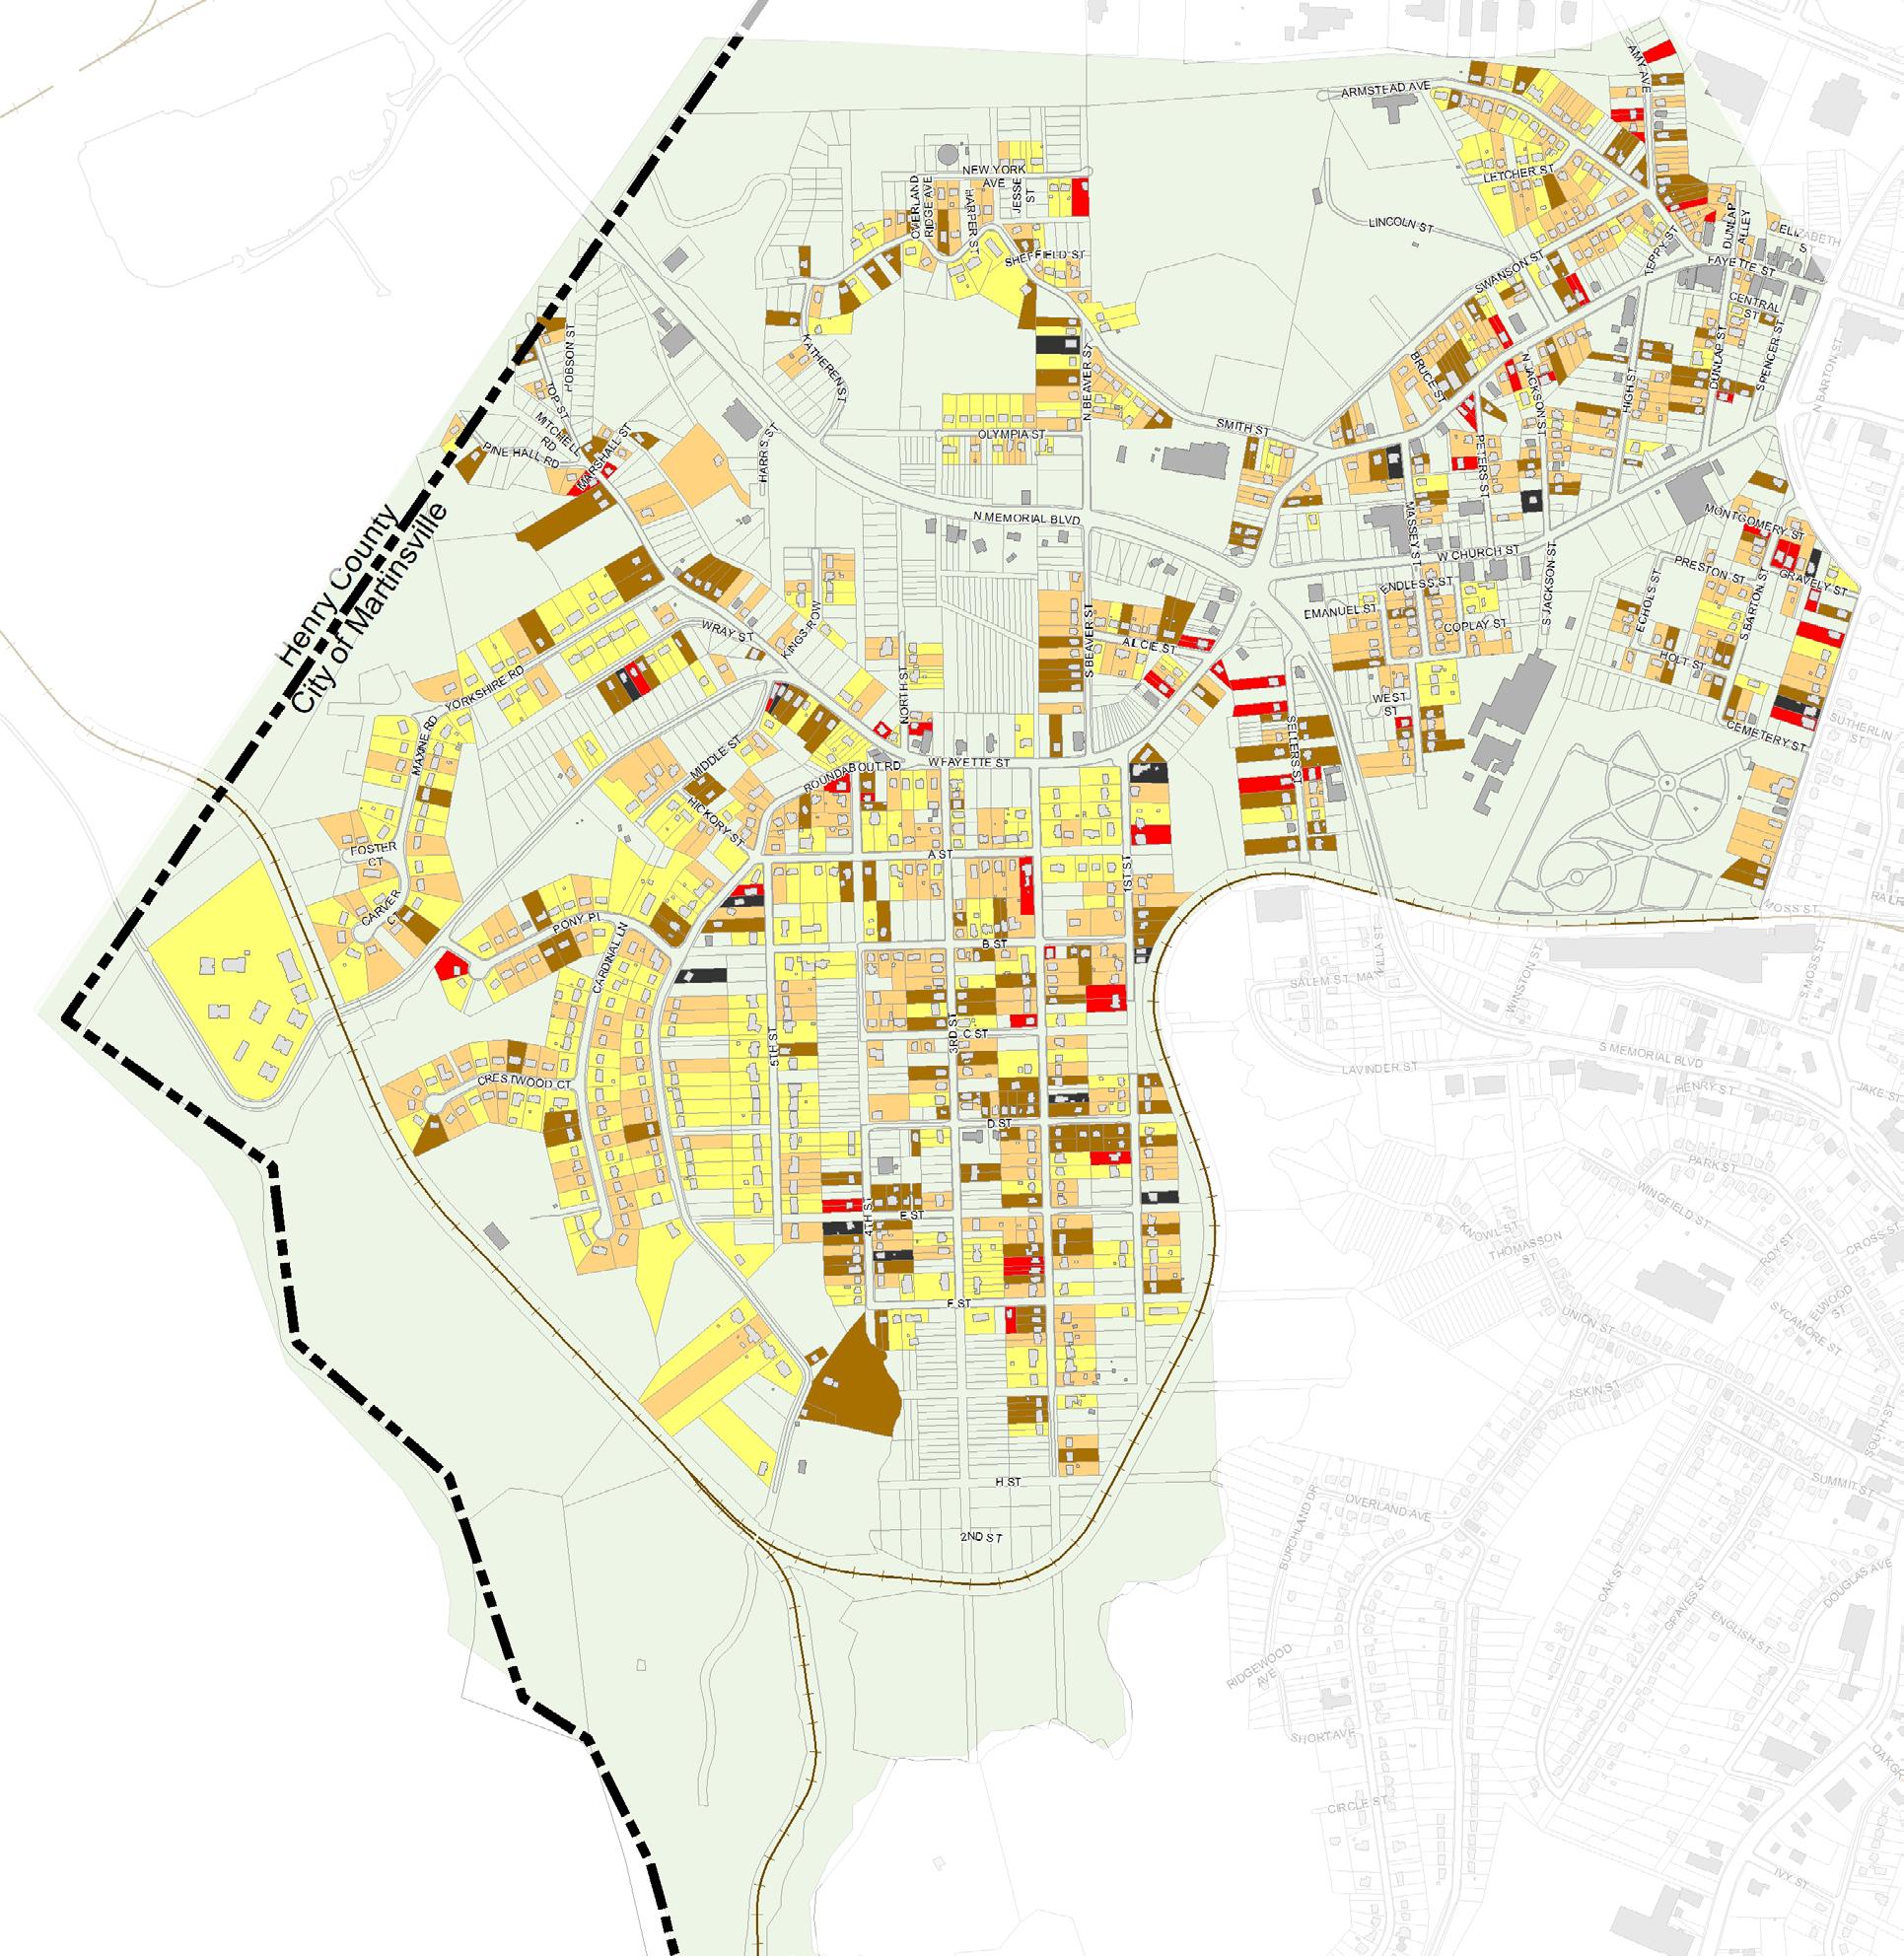
The West End Neighborhood is the western most area of Martinsville. The table below shows the conditions of residential structures in the area. ESRI estimates there are approximately 1,902 people in this area. The median age is 46.8, and the median household income is $31,277.
Within the West End Neighborhood, ESRI estimates that in 2022 there are approximately 453 Owner-Occupied Housing Units, which is 39% of the neighborhood; 403 Renter-Occupied Housing Units, comprising 35% of the neighborhood; and 118 Vacant Housing Units, making up 14% of the neighborhood.
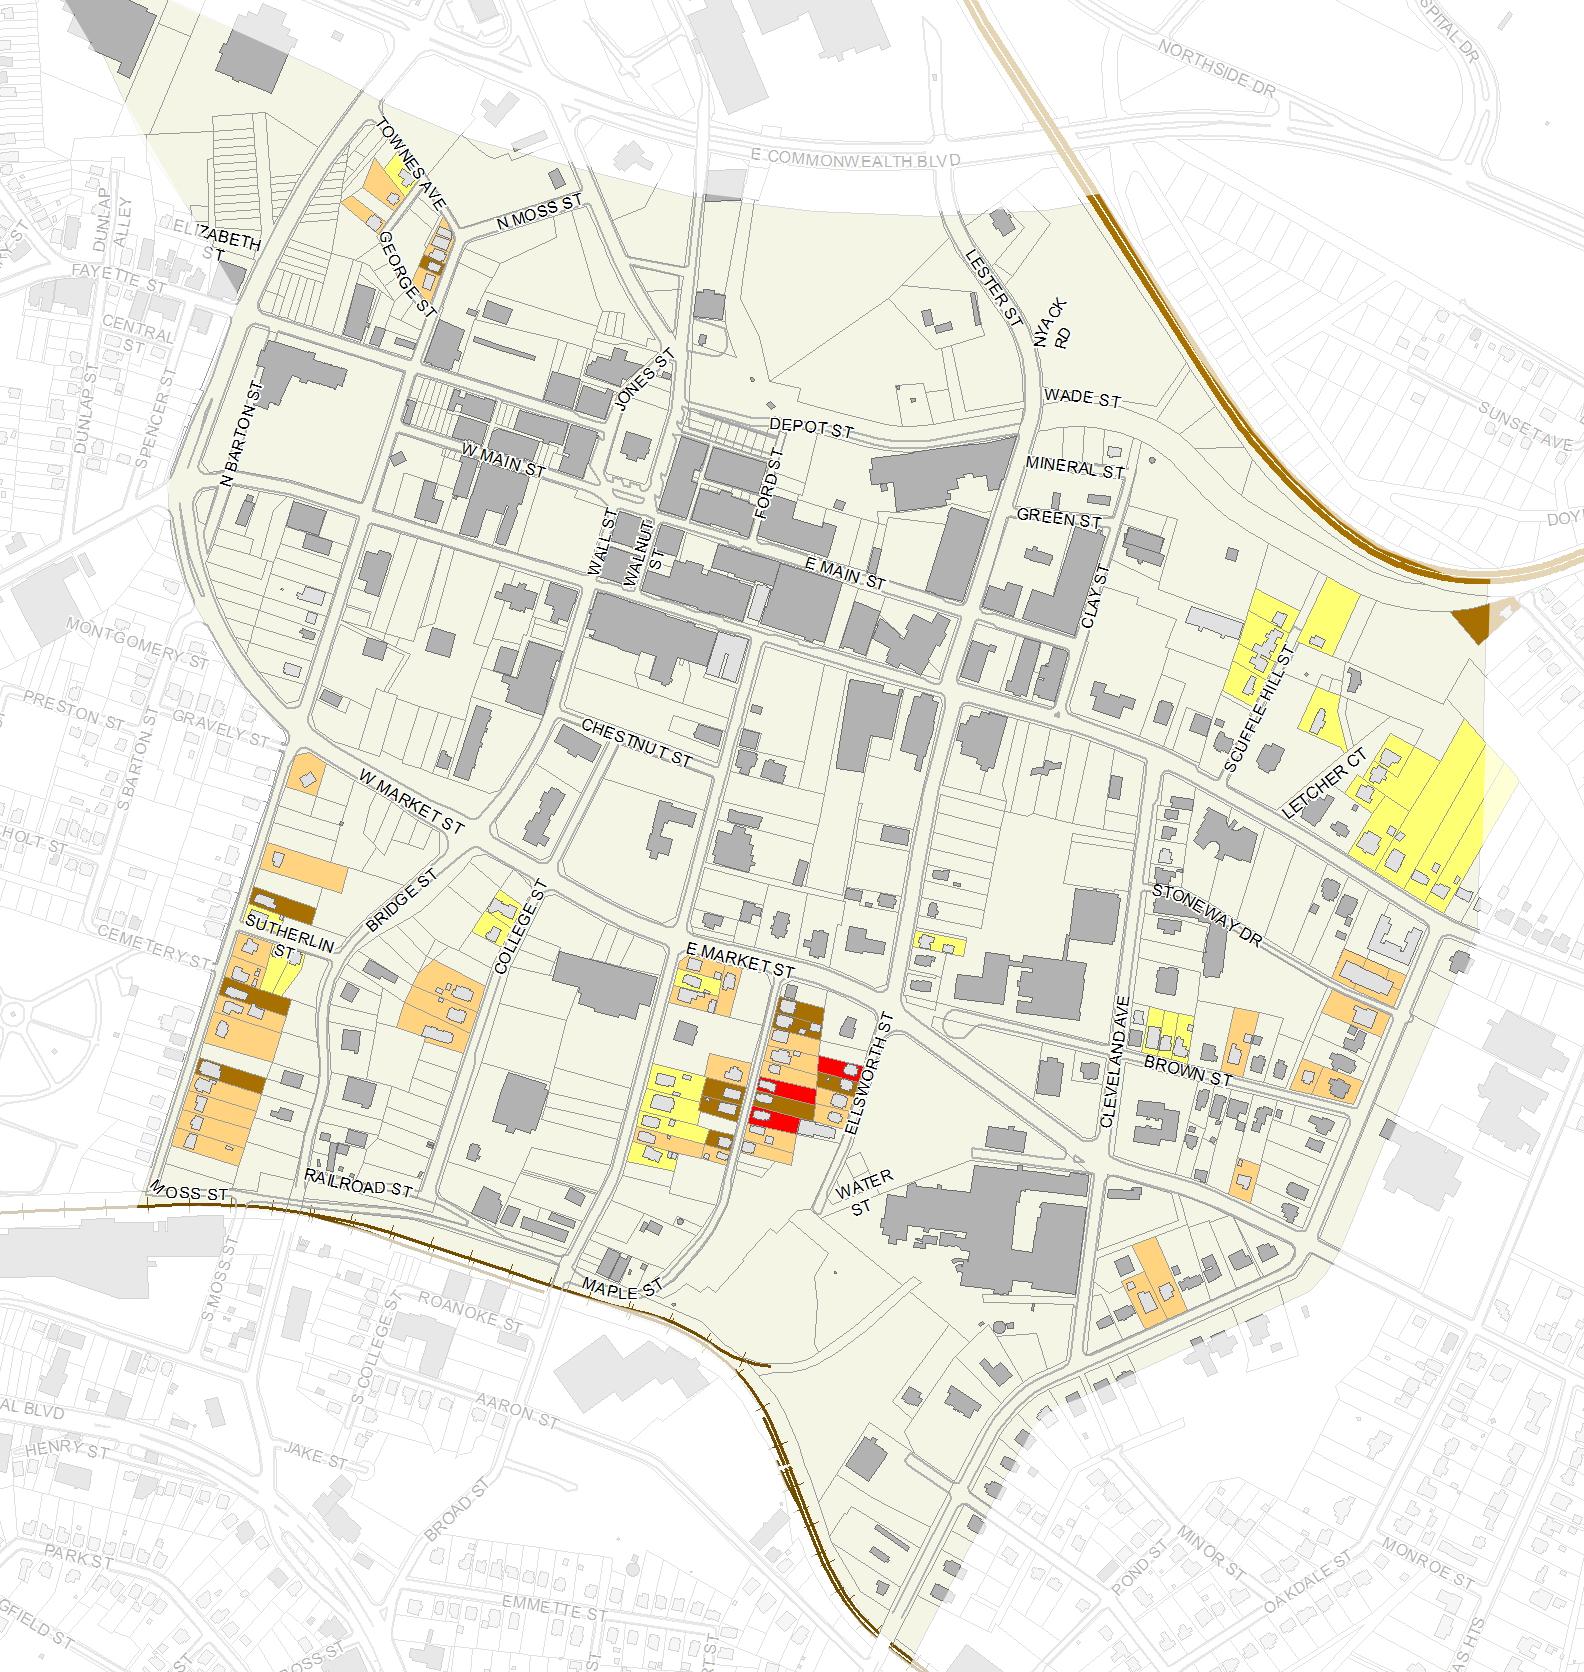
The Uptown Neighborhood is the central area of Martinsville. The table below shows the conditions of residential structures in the area. ESRI estimates there are approximately 473 people in this area. The median age is 40.8, and the median household income is $31,079.
Within the Uptown, ESRI estimates that in 2022 there are approximately 94 Owner-Occupied Housing Units, which is 36% of the neighborhood; 91 Renter-Occupied Housing Units, comprising 34% of the neighborhood; and 80 Vacant Housing Units, making up 30% of the neighborhood.
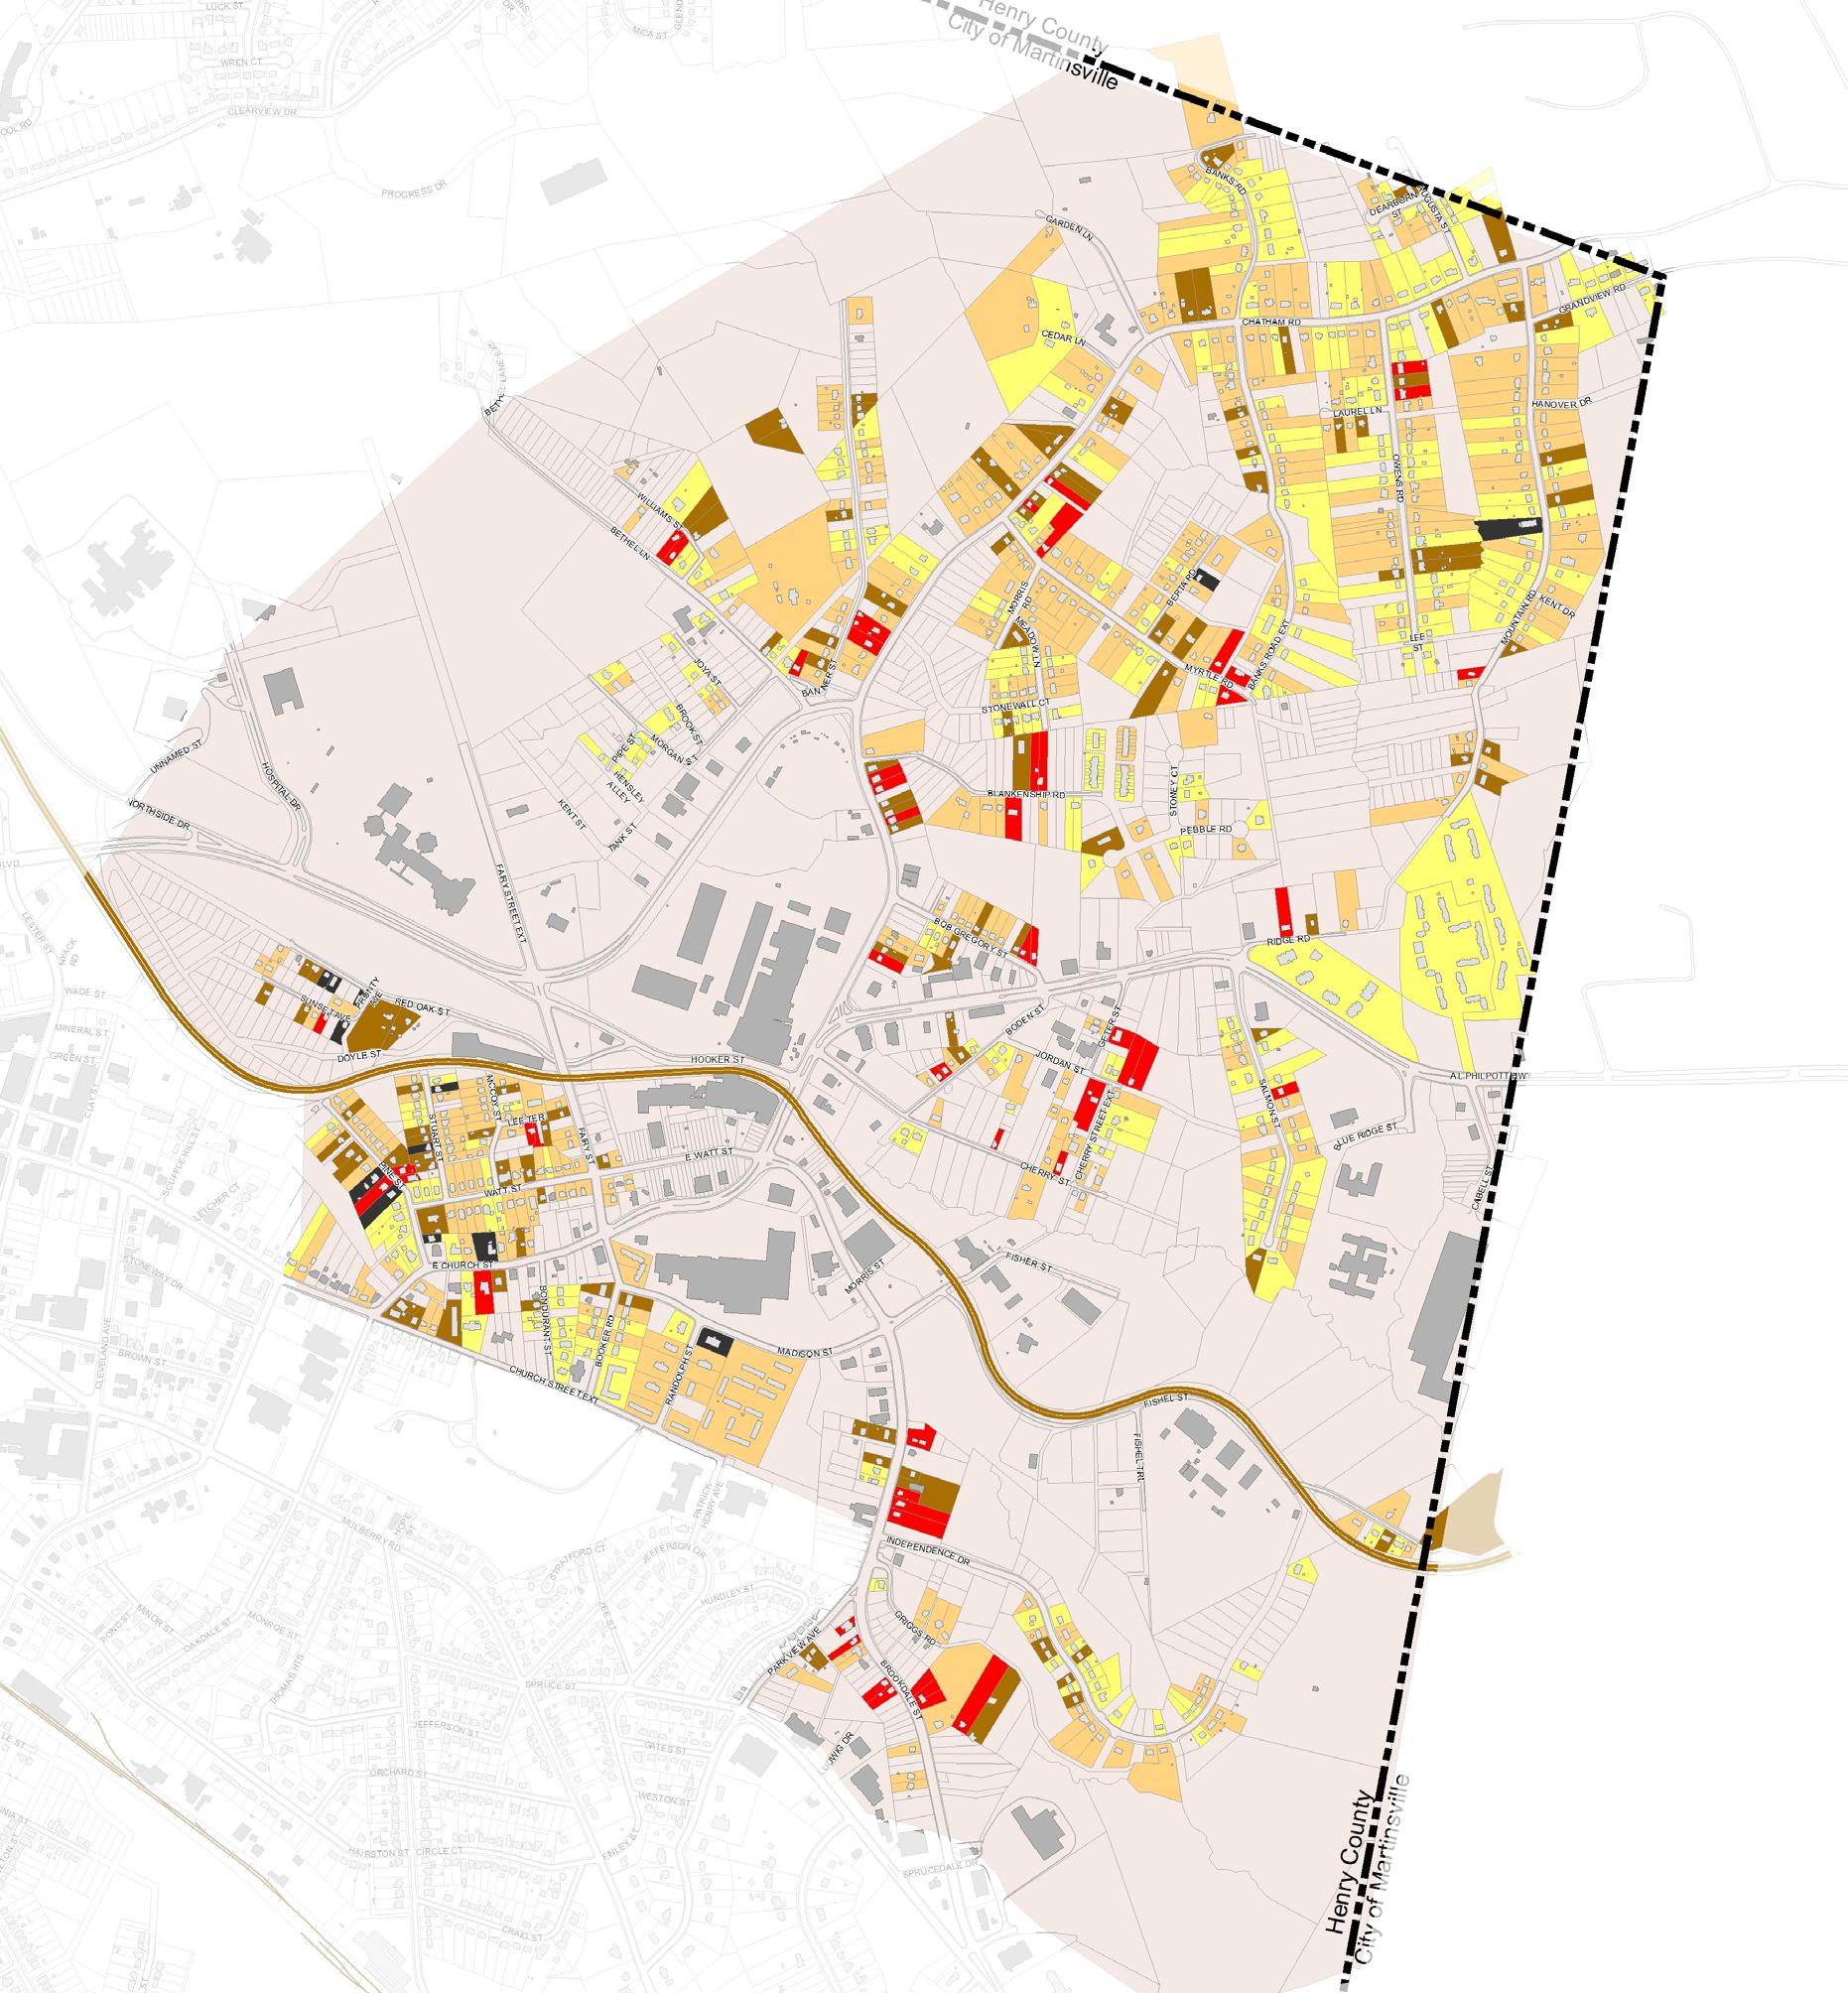
The East End Neighborhood is located in the northeastern area of Martinsville. The table below shows the conditions of residential structures in the area. ESRI estimates there are approximately 2,595 people in this area. The median age is 48.4, and the median household income is $29,305.
Within the East End, ESRI estimates that in 2022 there are approximately 572 Owner-Occupied Housing Units, which is 40% of the neighborhood; 659 Renter-Occupied Housing Units, comprising 46% of the neighborhood; and 208 Vacant Housing Units, making up 14% of the neighborhood.
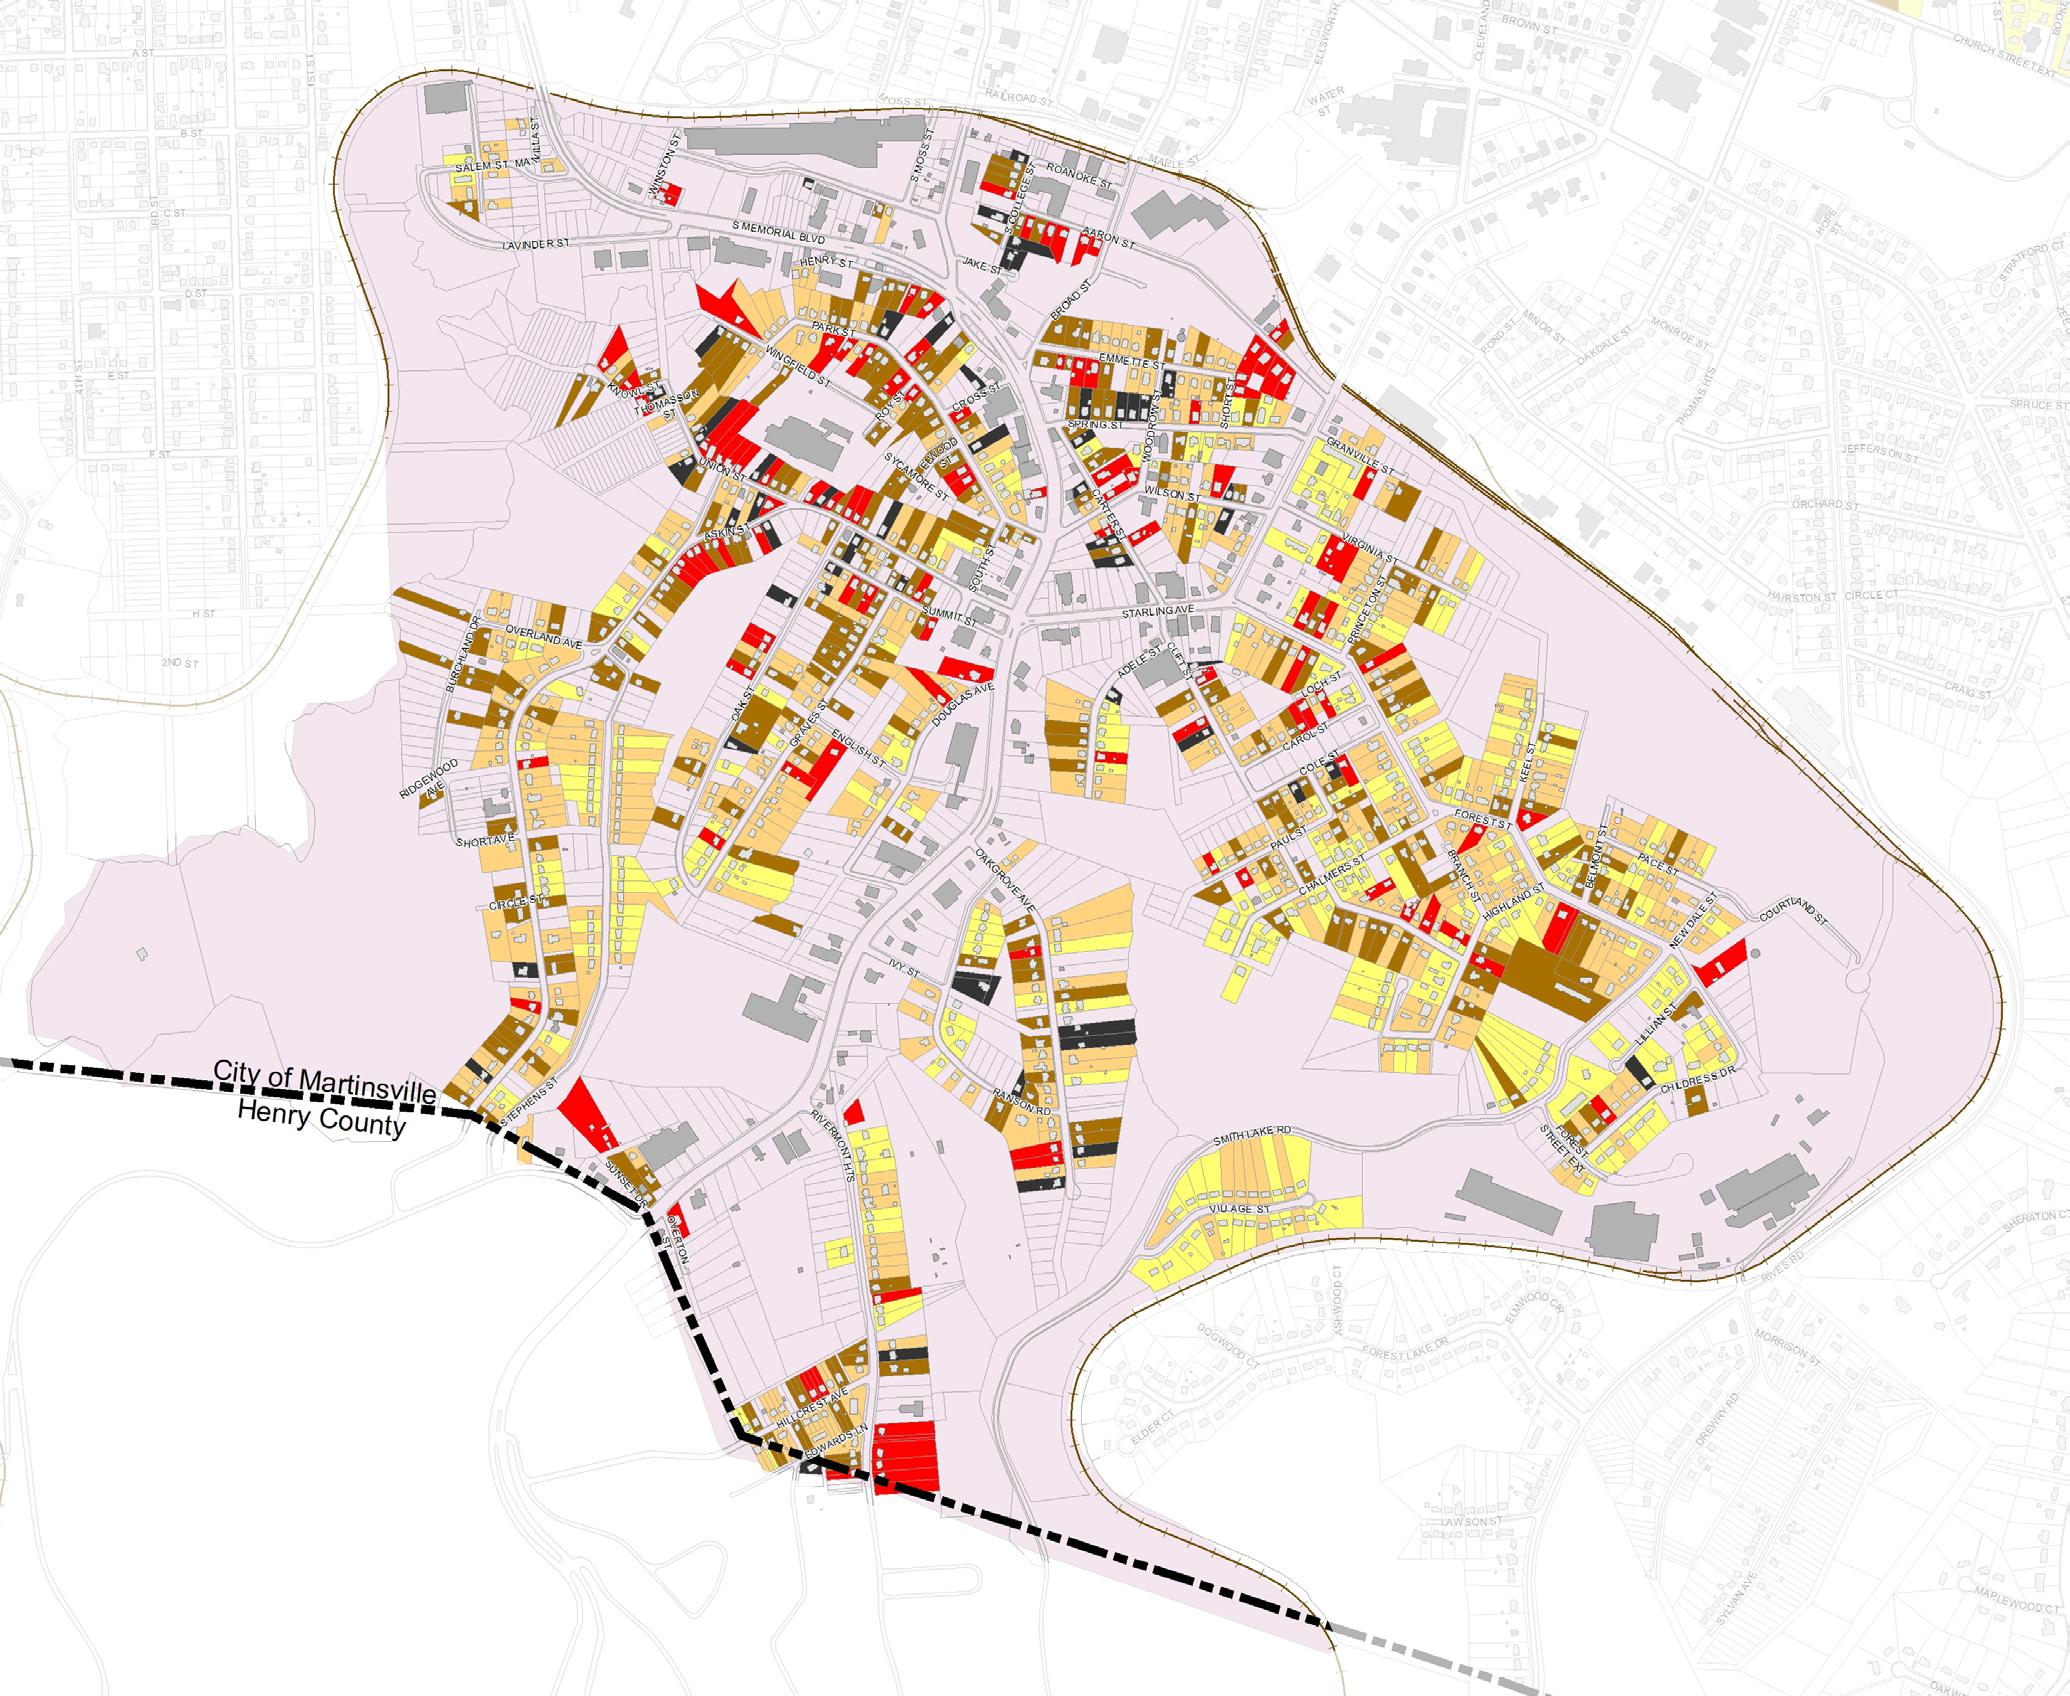
The Southside Neighborhood is located in the southern-middle area of Martinsville. The table below shows the conditions of residential structures in the area. ESRI estimates there are approximately 2,370 people in this area. The median age is 40.4, and the median household income is $30,361.
Within the Southside Neighborhood, ESRI estimates that in 2022 there are approximately 420 Owner-Occupied Housing Units, which is 36% of the neighborhood; 486 Renter-Occupied Housing Units, comprising 42% of the neighborhood; and 252 Vacant Housing Units, making up 22% of the neighborhood.
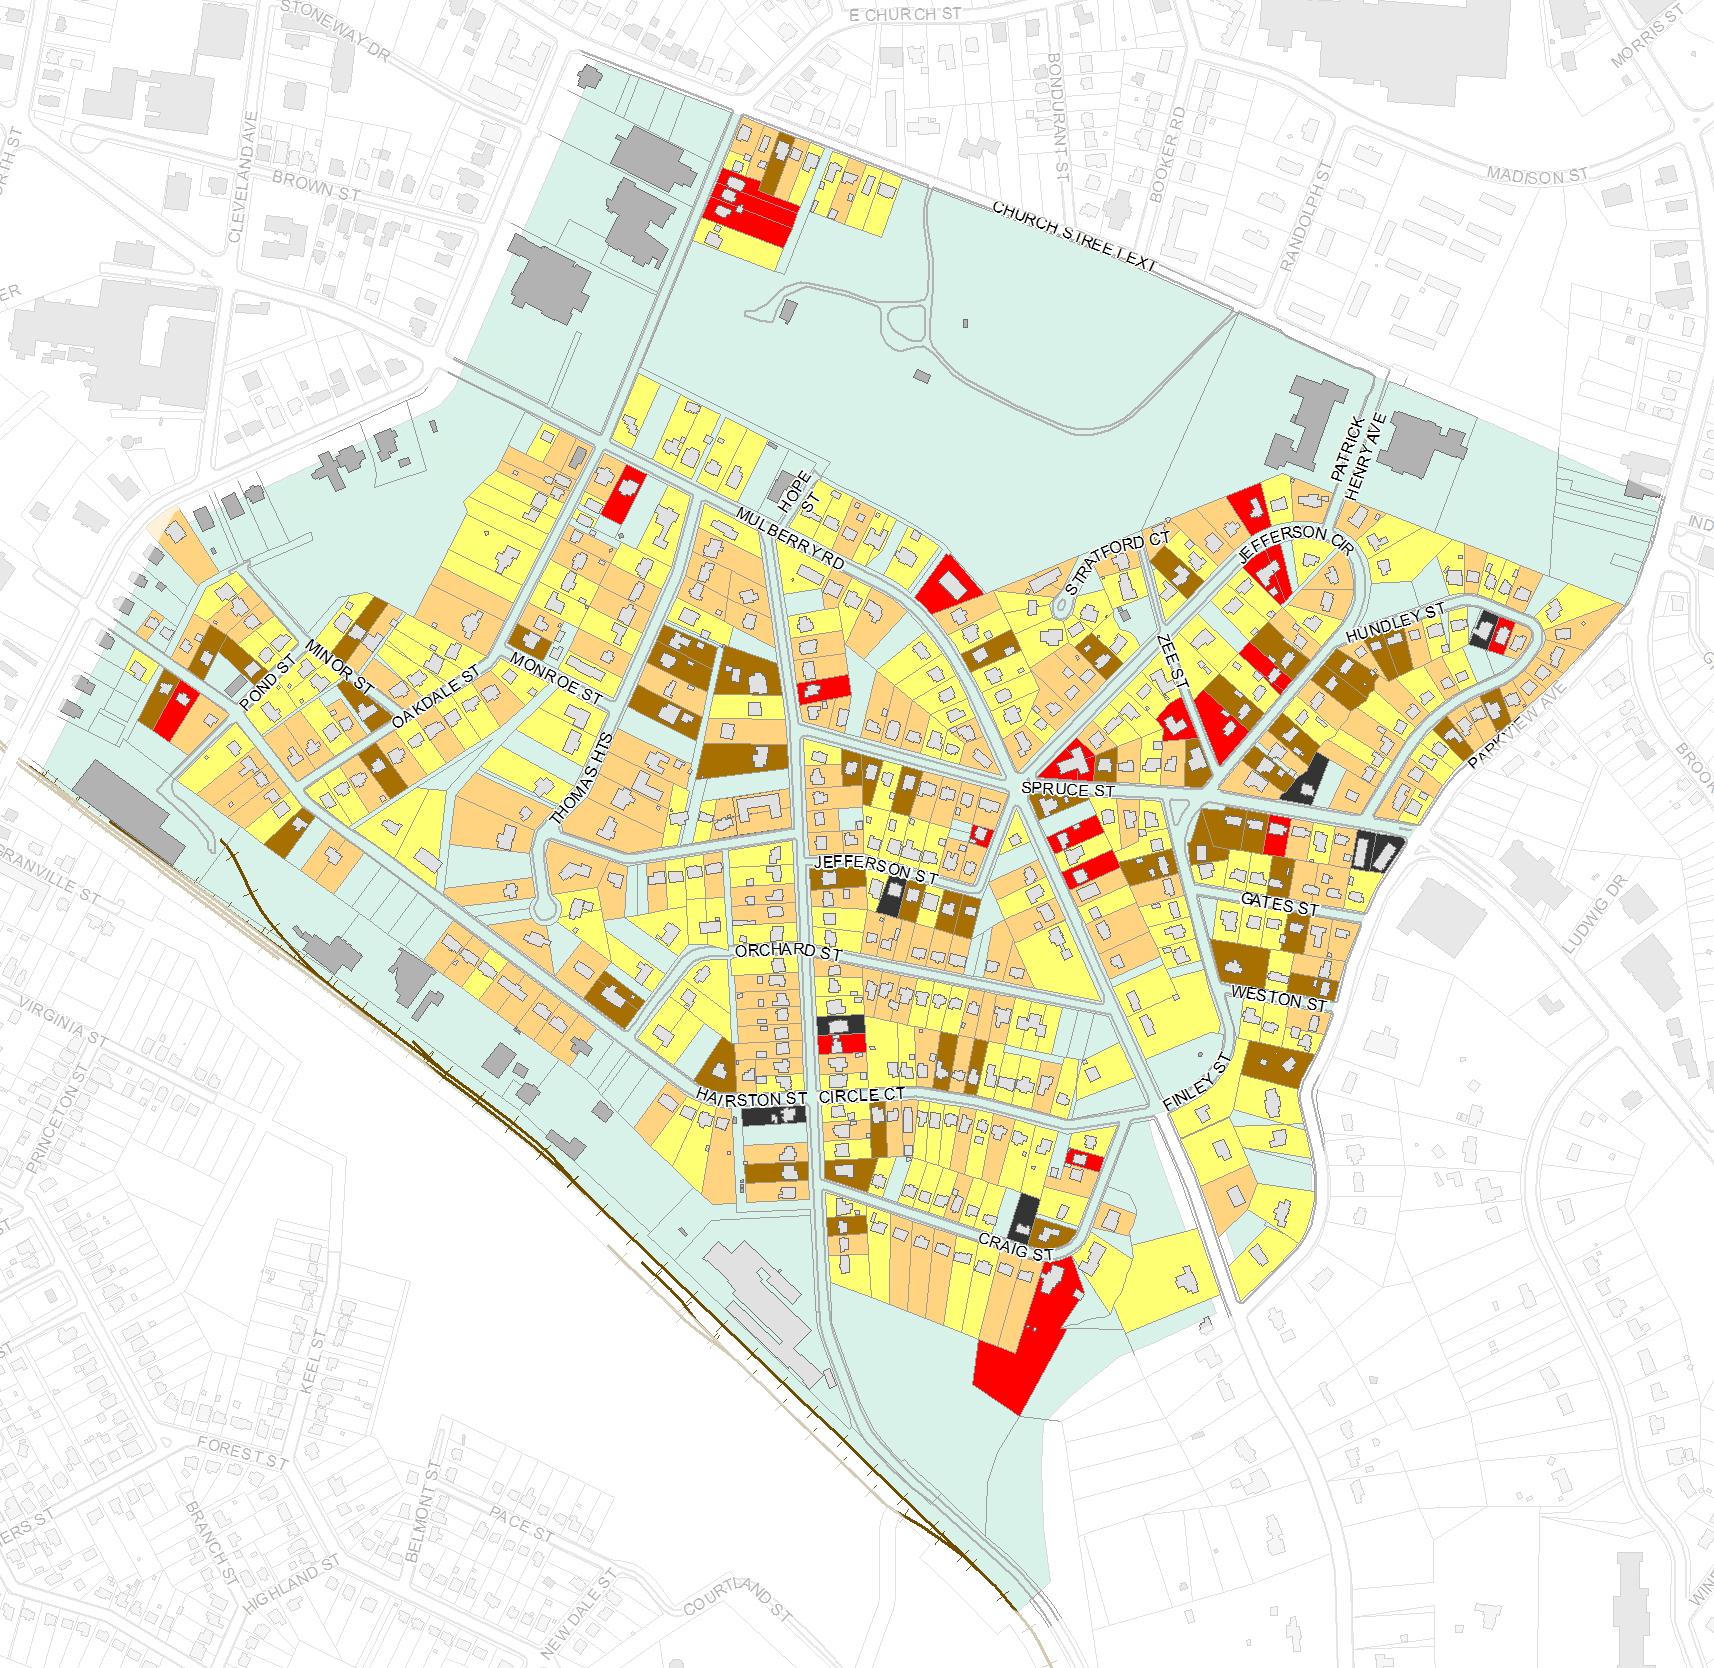
The Mulberry Neighborhood is located in the eastern-central area of Martinsville. The table below shows the conditions of residential structures in the area. ESRI estimates there are approximately 1,176 people in this area. The median age is 41.4, and the median household income is $32,415.
Within the Mulberry Neighborhood, ESRI estimates that in 2022 there are approximately 241 Owner-Occupied Housing Units, which is 38% of the neighborhood; 285 Renter-Occupied Housing Units, comprising 44% of the neighborhood; and 114 Vacant Housing Units, making up 18% of the neighborhood.
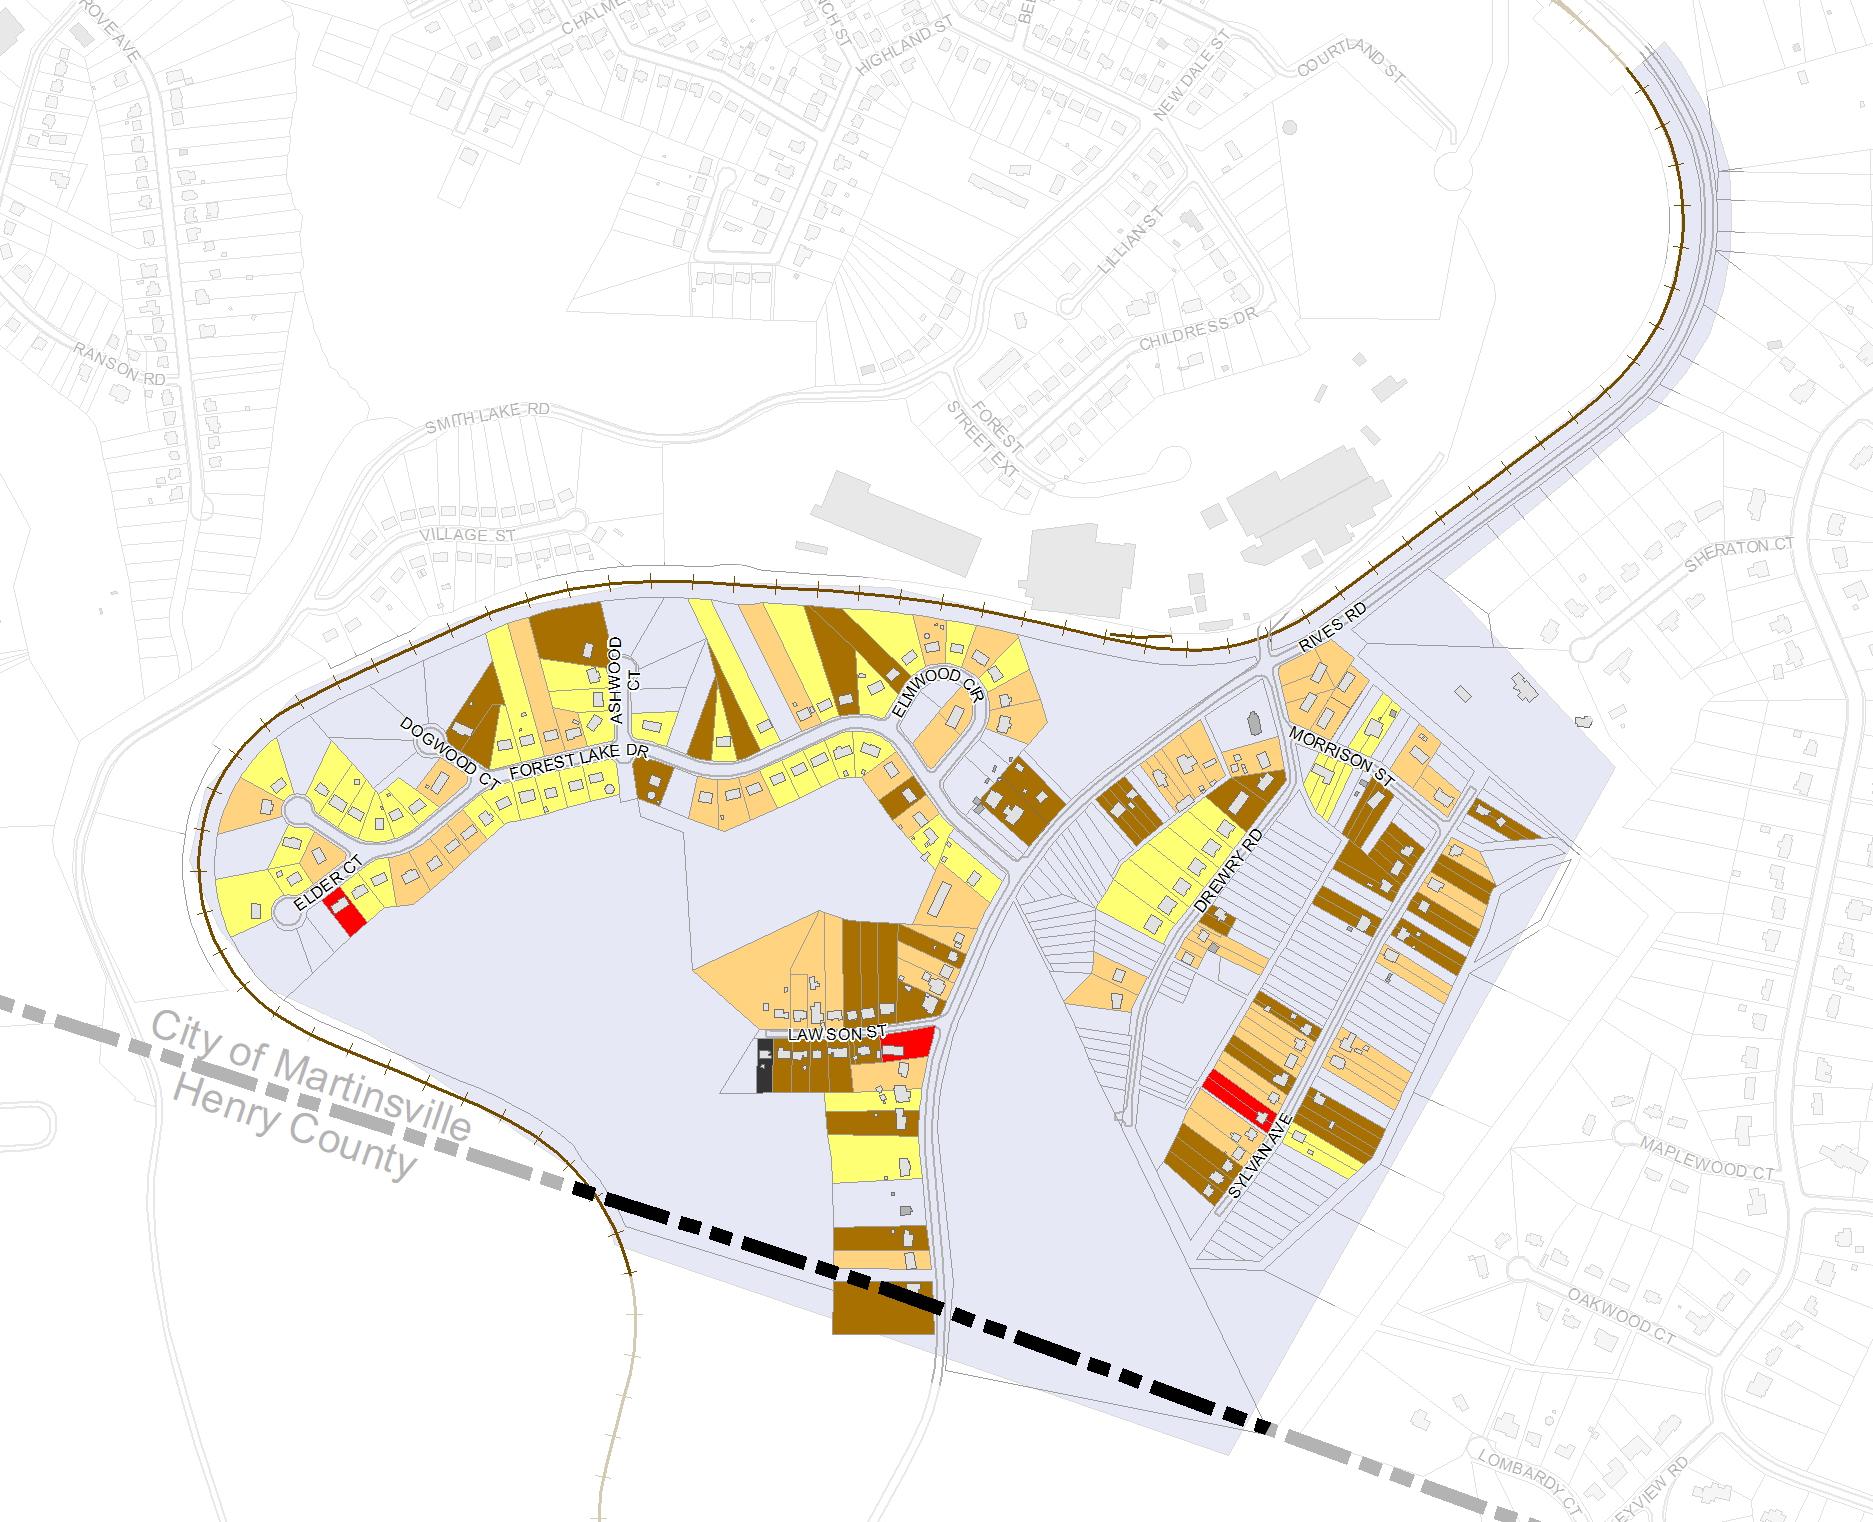
The Rives Road Extension Neighborhood is located in the southern area of Martinsville. The table below shows the conditions of residential structures in the area. ESRI estimates there are approximately 506 people in this area. The median age is 42.8, and the median household income is $43,896.
Within the Rives Road Extension Neighborhood, ESRI estimates that in 2022 there are approximately 198 Owner-Occupied Housing Units, which is 77% of the neighborhood; 41 RenterOccupied Housing Units, comprising 16% of the neighborhood; and 17 Vacant Housing Units, making up 7% of the neighborhood.
The Forest Park Neighborhood is located in the southeastern area of Martinsville. The table below shows the assessment scores of the conditions in the area. ESRI estimates there are approximately 1,754 people in this area. The median age is 54.5, and the median household income is $86,479.
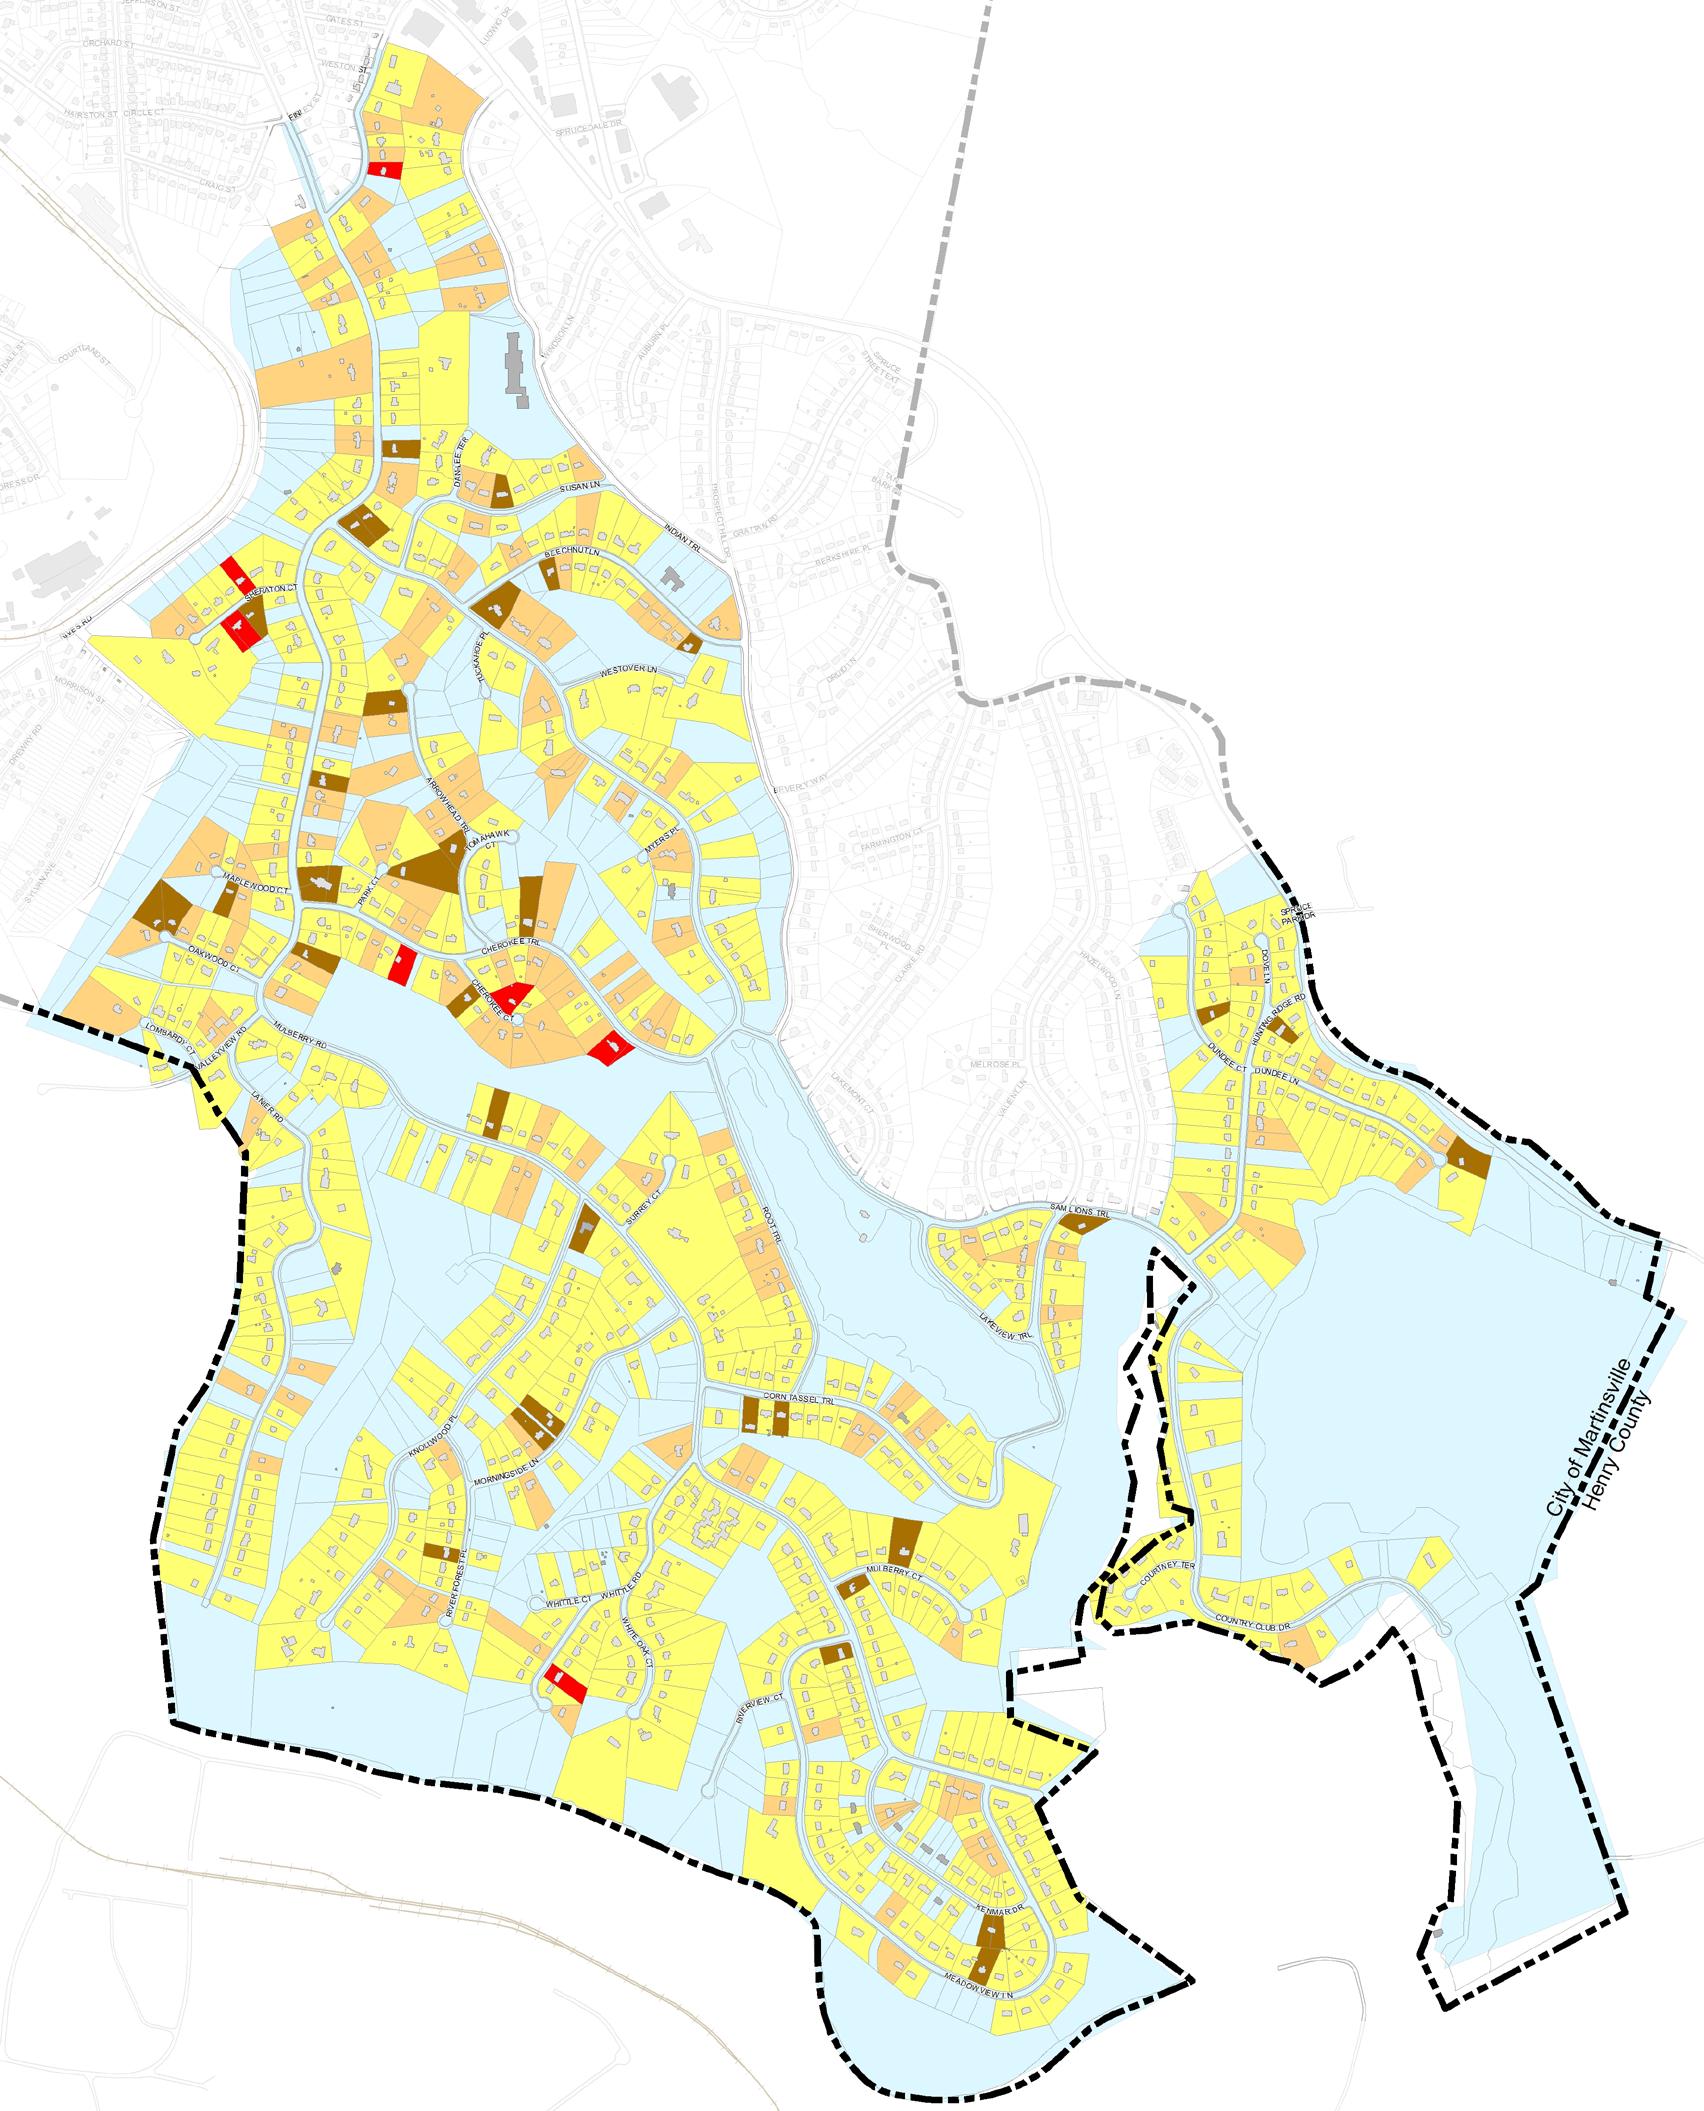
Within the Forest Park Neighborhood, ESRI estimates that in 2022 there are approximately 651 Owner-Occupied Housing Units, which is 79% of the neighborhood; 104 Renter-Occupied Housing Units, comprising 12% of the neighborhood; and 71 Vacant Housing Units, making up 9% of the neighborhood.
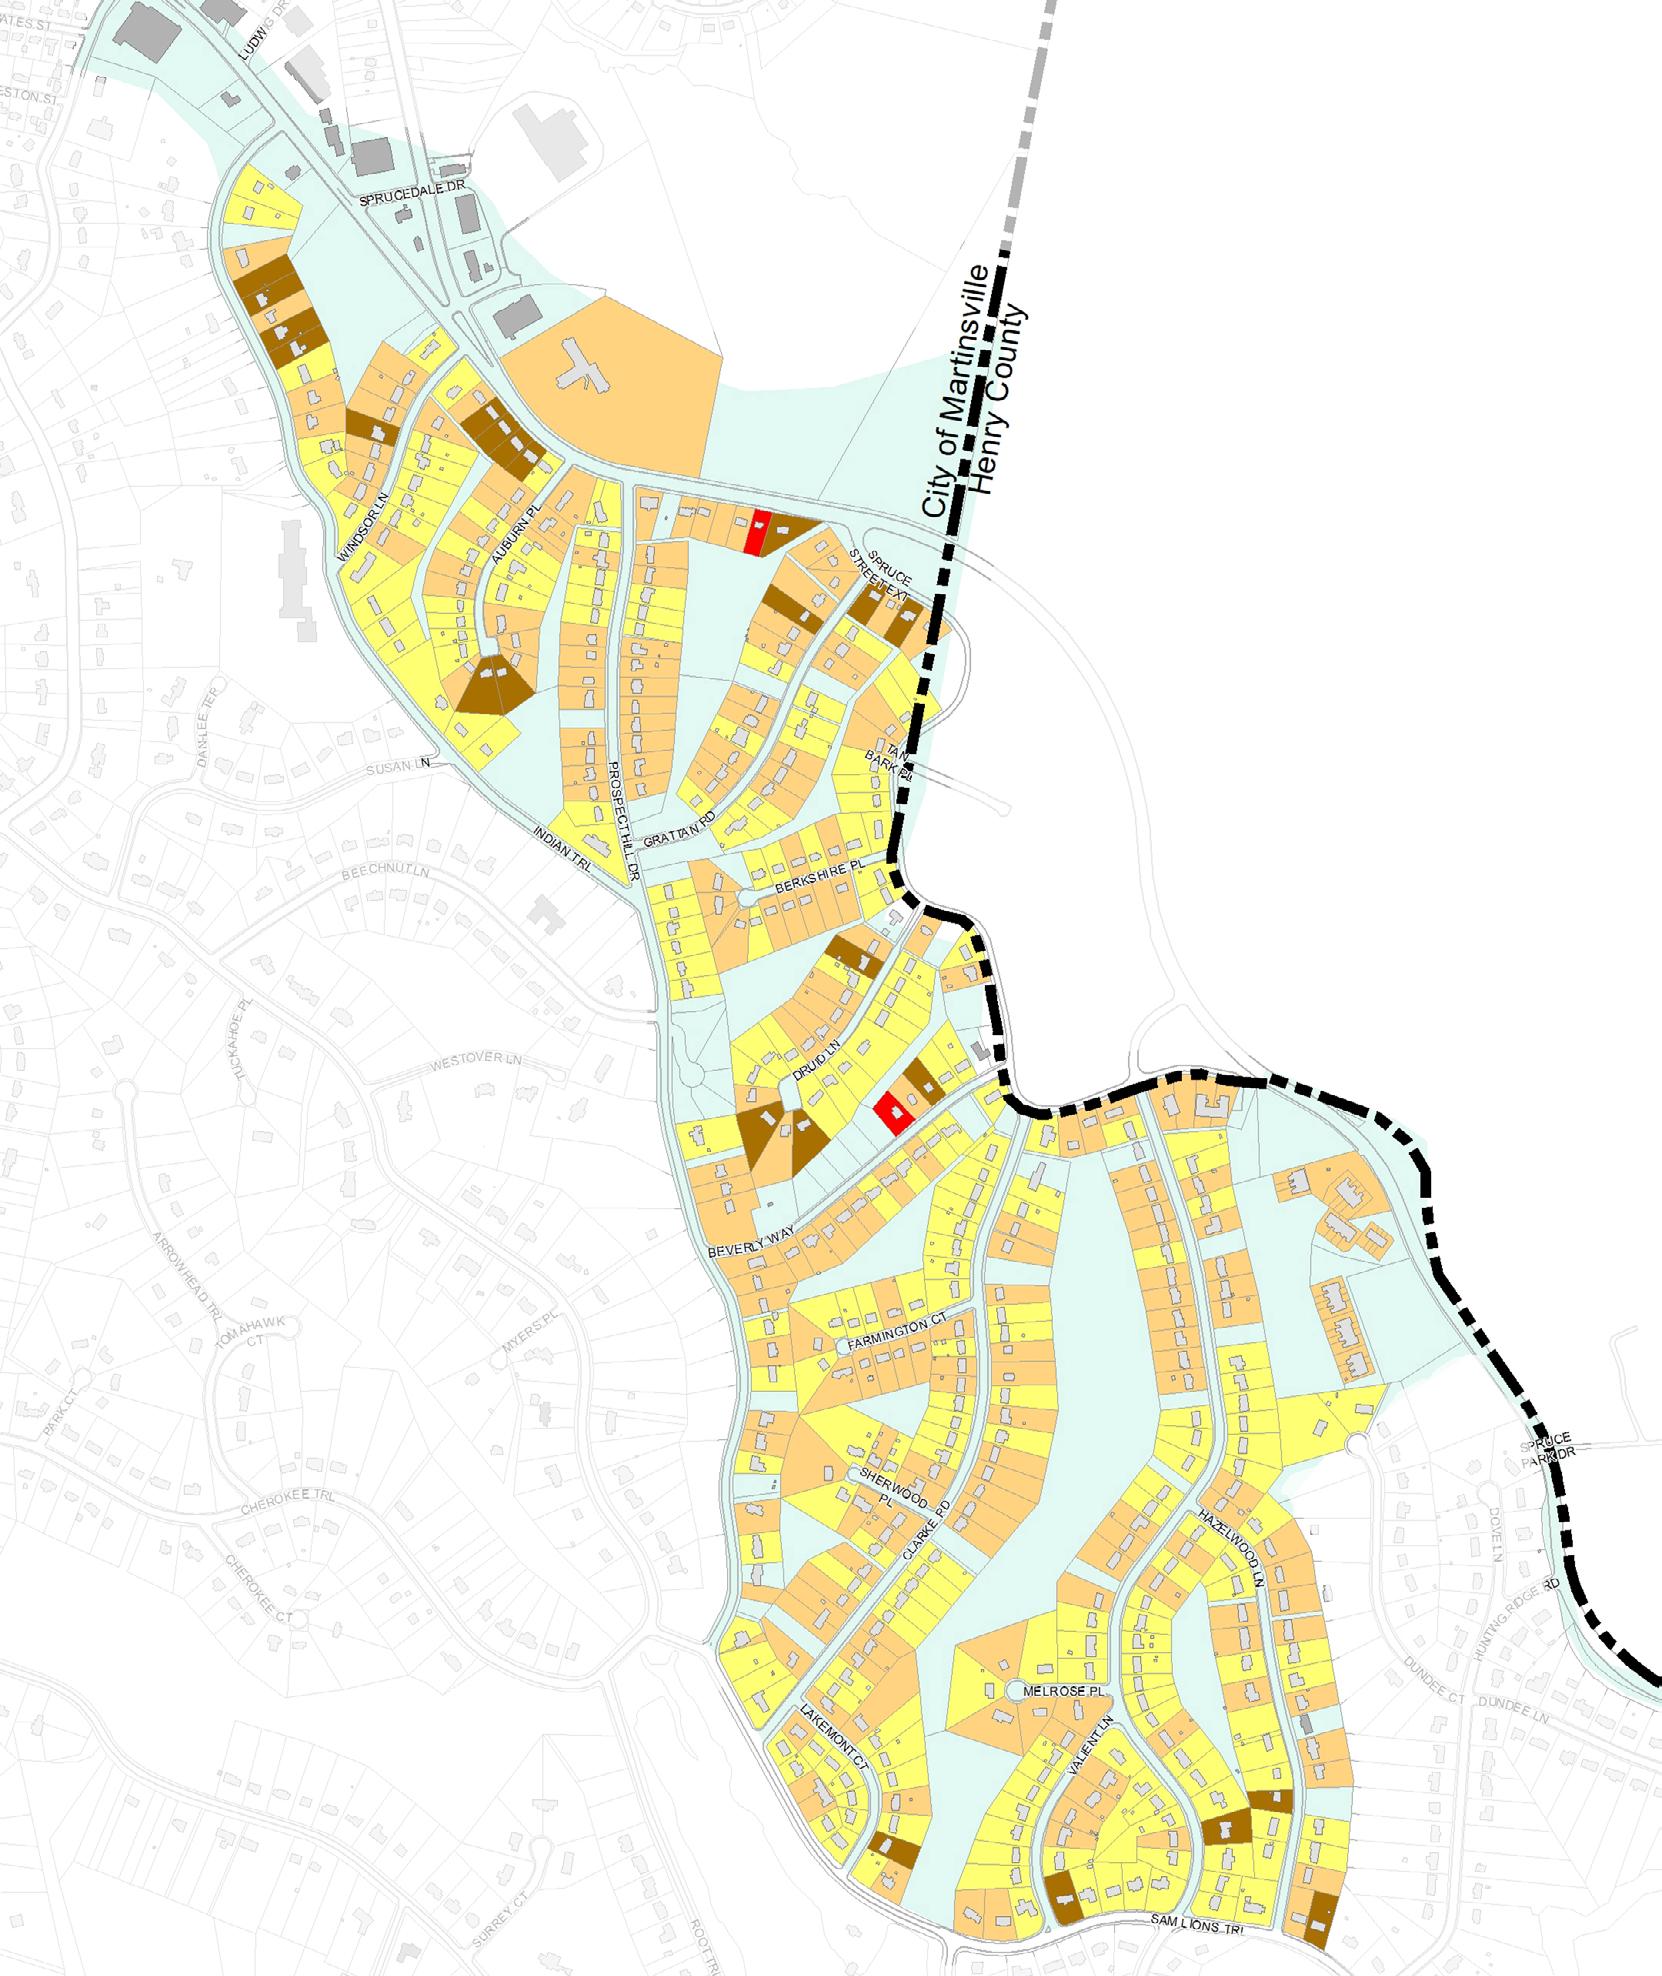
The Druid Hills Neighborhood is located in the southeastern area of Martinsville. The table below shows the conditions of residential structures in the area. ESRI estimates there are approximately 955 people in this area. The median age is 51.9, and the median household income is $77,648.
Within the Druid Hills Neighborhood, ESRI estimates that in 2022 there are approximately 300 Owner-Occupied Housing Units, which is 65% of the neighborhood; 115 Renter-Occupied Housing Units, comprising 25% of the neighborhood; and 47 Vacant Housing Units, making up 10% of the neighborhood.
Demographic data for Martinsville residents were collected and analyzed by designated neighborhood areas for comparison. The mapping of building conditions demonstrates higher concentrations of blighted structures in the Southside and West End neighborhoods. From that understanding, demographics were analyzed to identify areas that would benefit the most from intervention.
Martinsville Overall
2022 Population ESRI estimate 13,325
2022 Median Household Income $39,712
Total Housing Units (Vacant, Occupied, Renter) 7,205
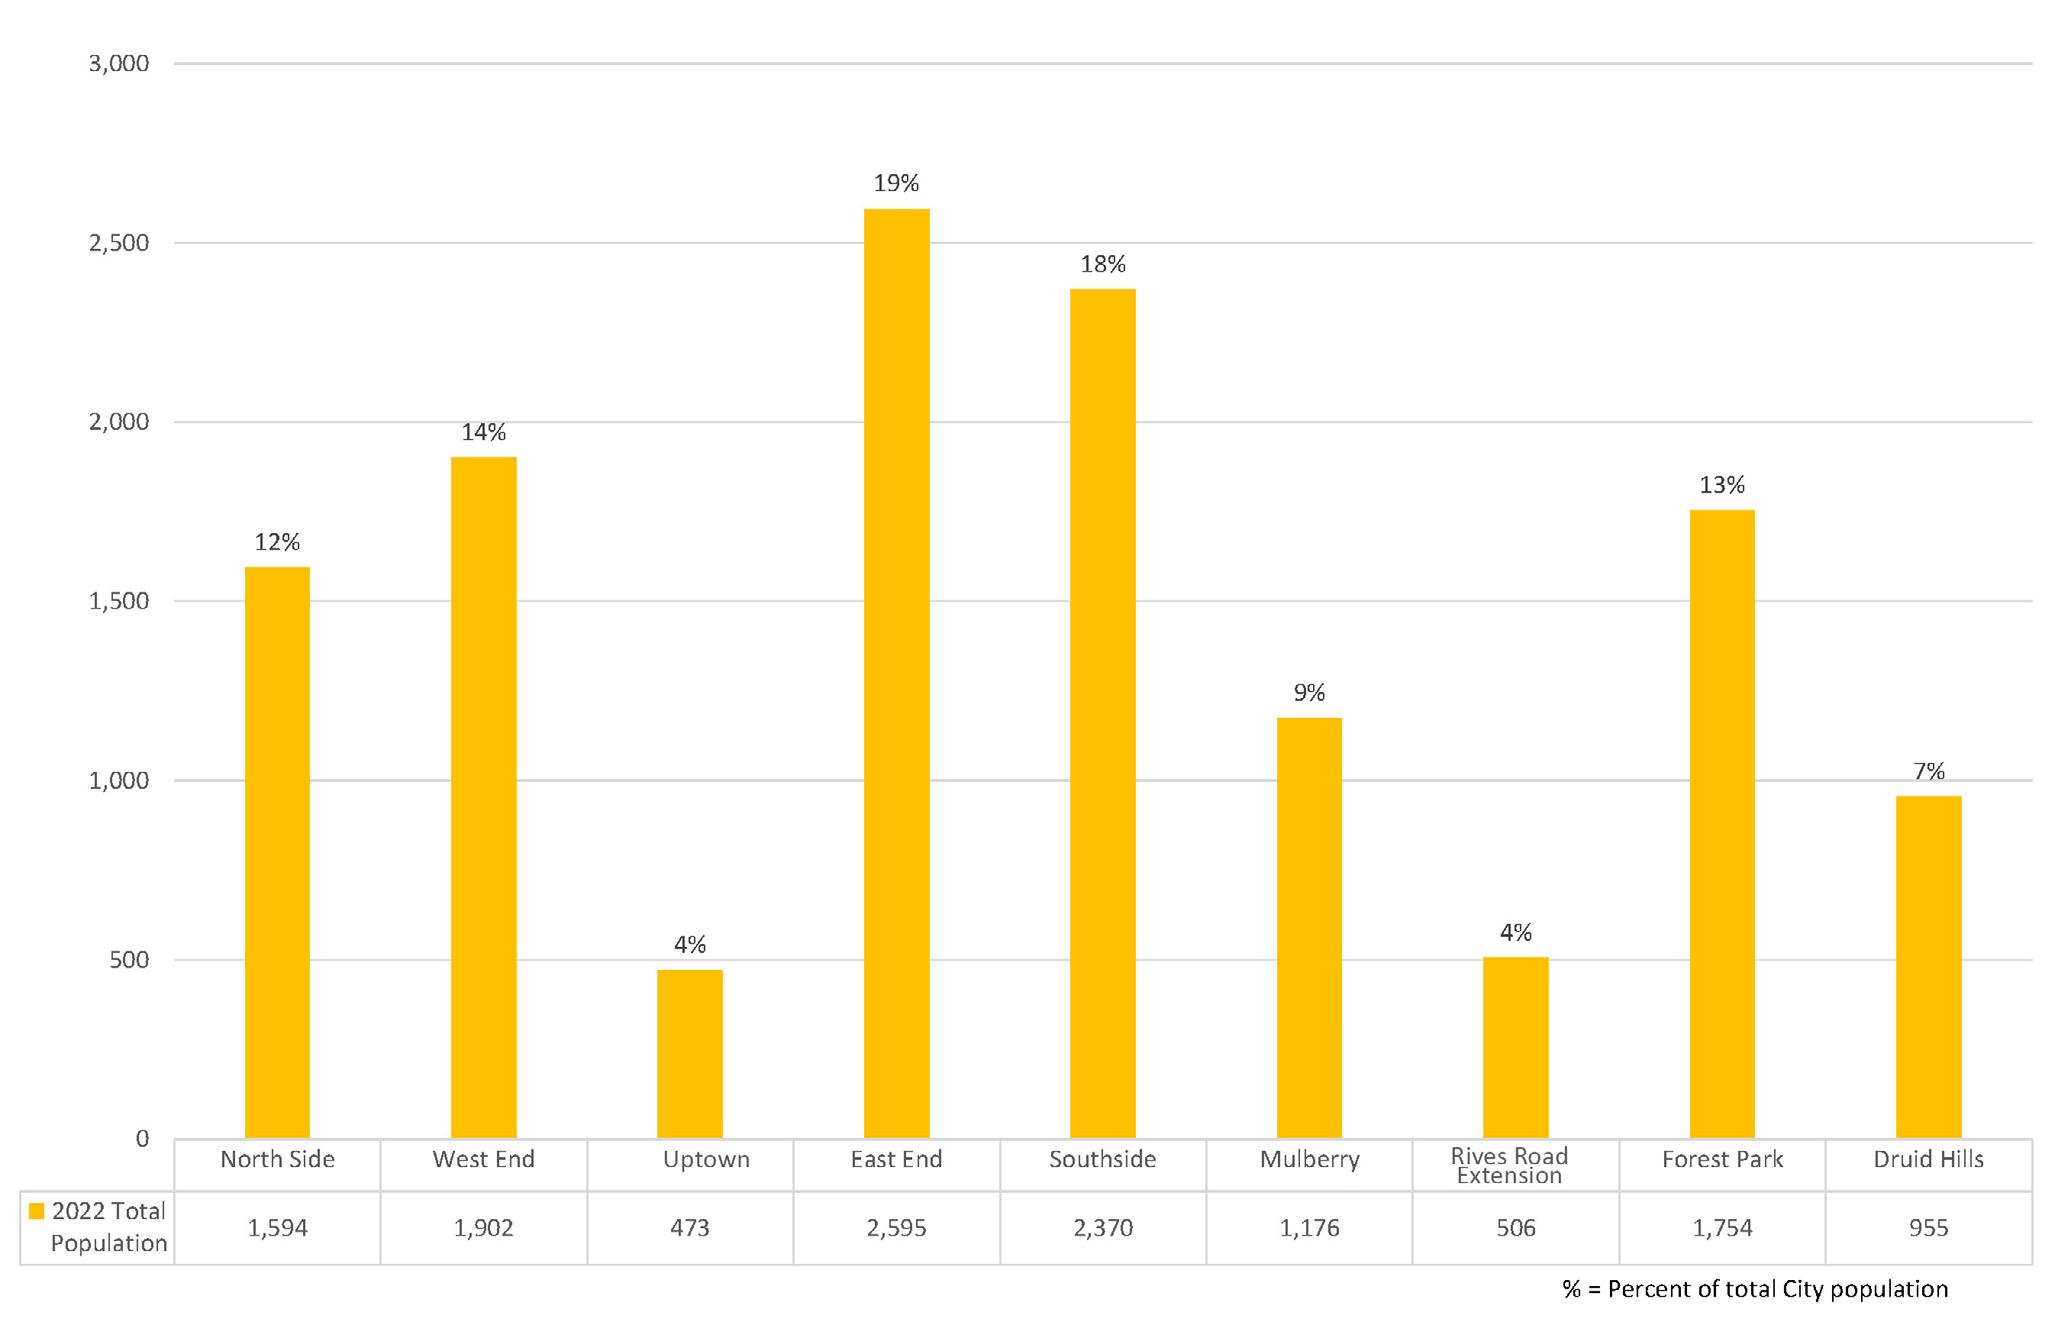
This graph shows that the Southside and East End neighborhoods are the city's most populous designated neighborhood areas.
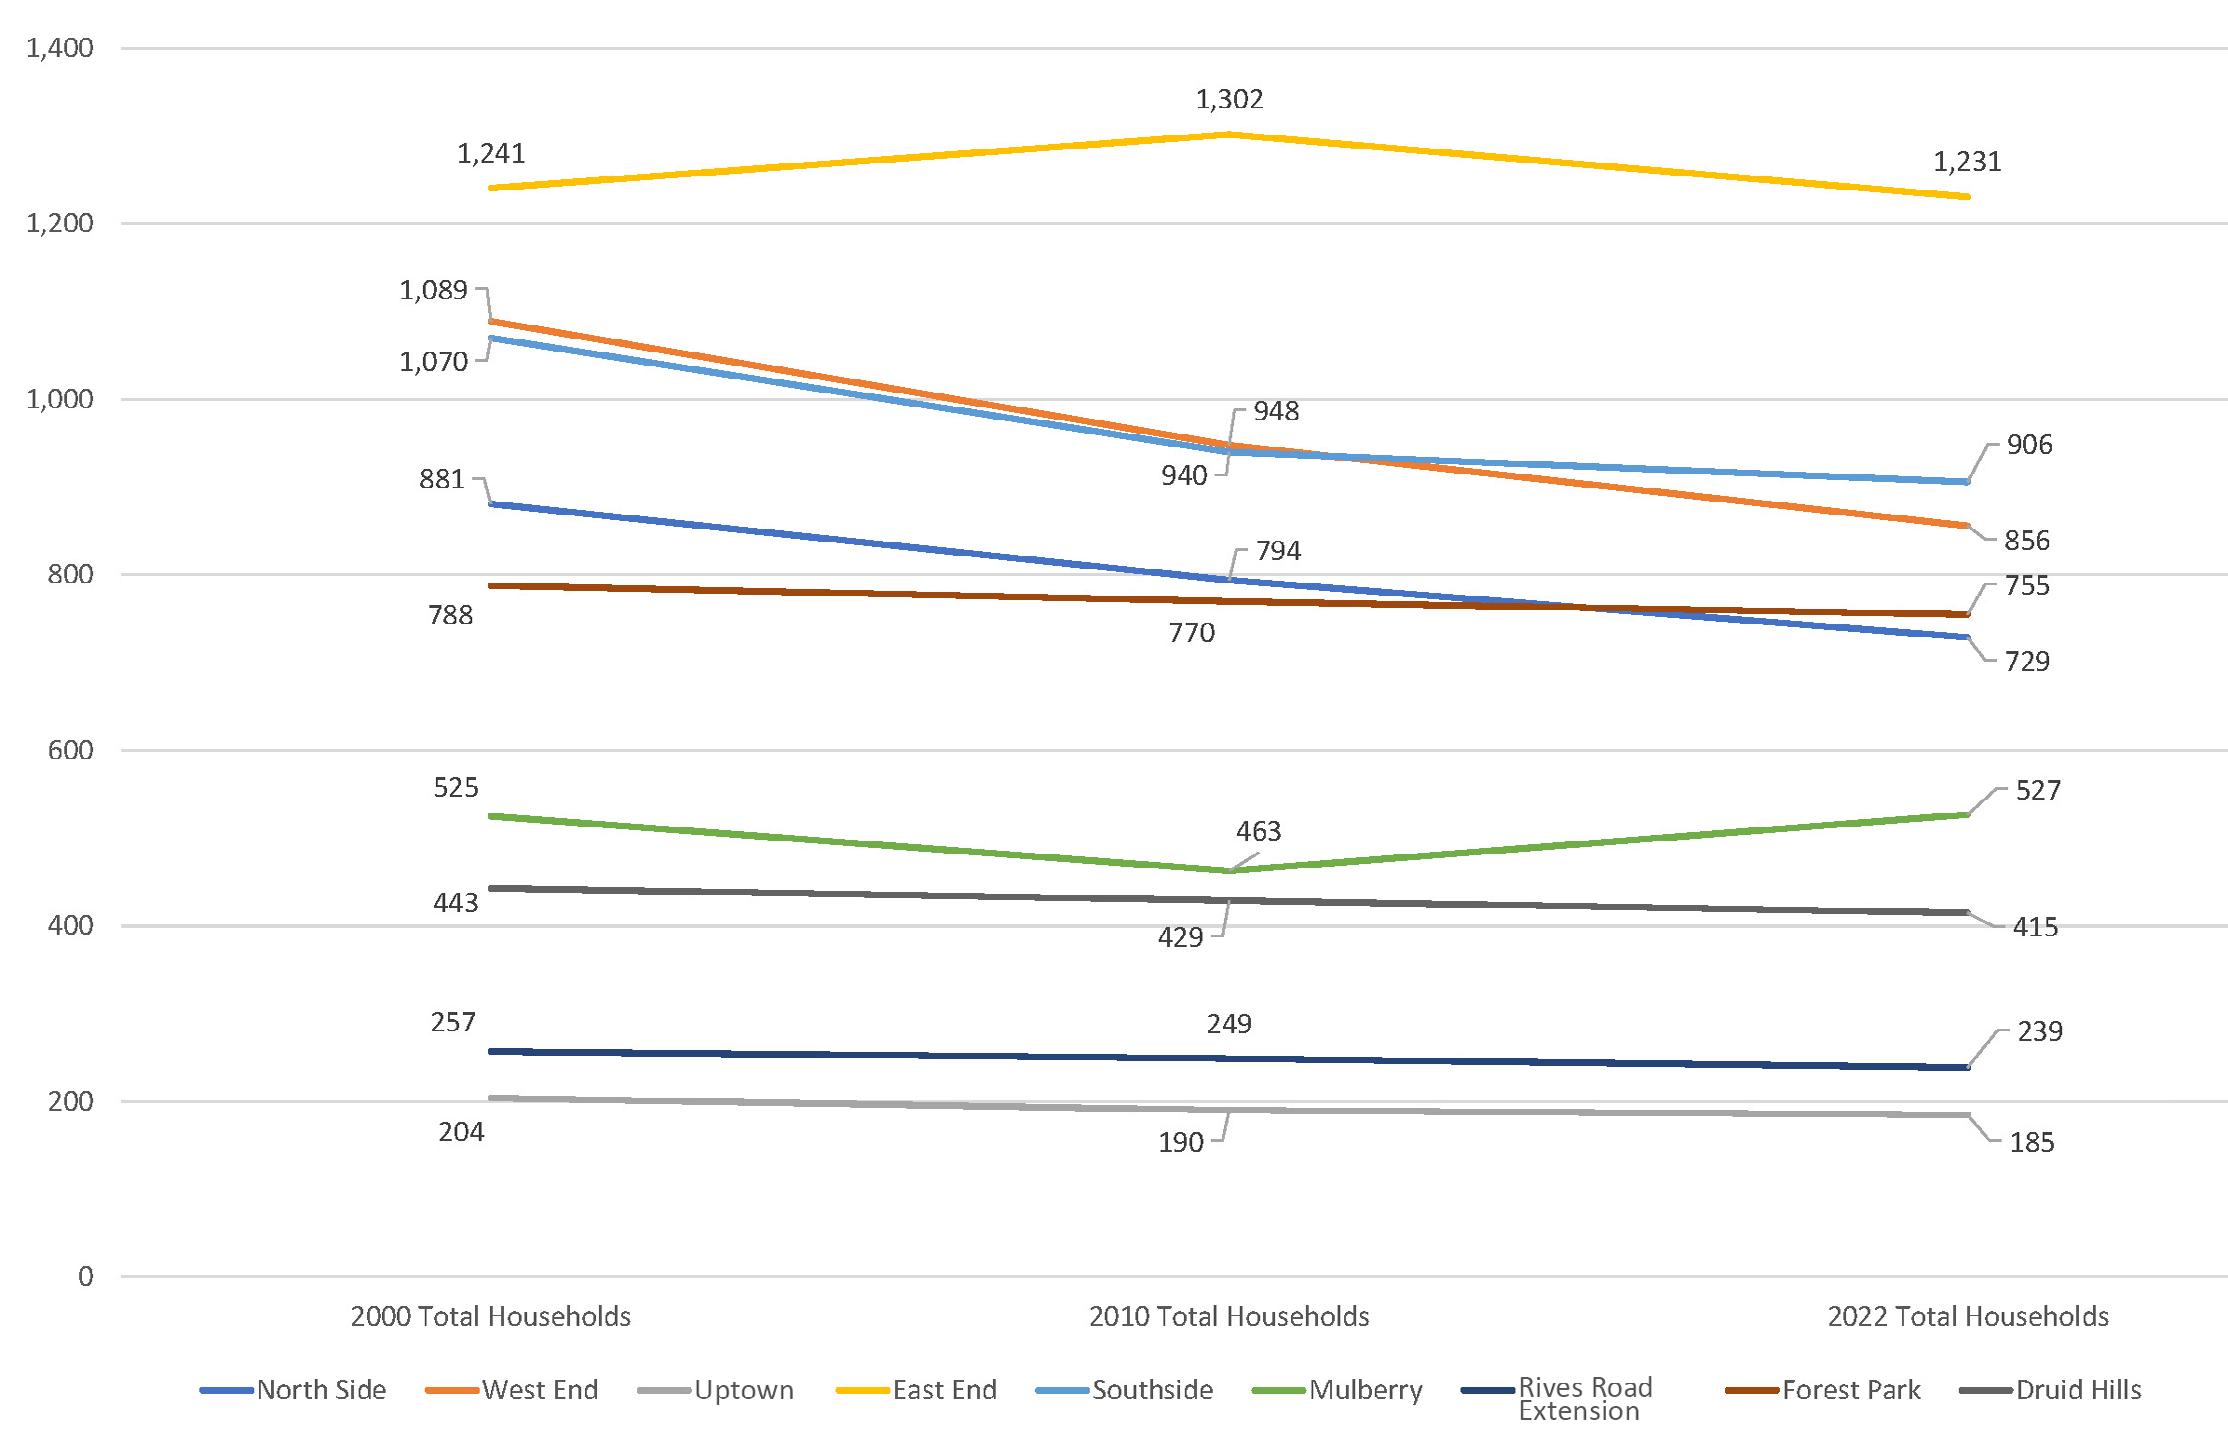
This graph shows the total households from the decennial censuses in 2000 and 2010, as well as the ESRI Business Analyst estimate for 2022. The census definition of a household includes all occupied single family homes, townhomes, apartments, or mobile homes and excludes residents of "Group Quarters," such as correctional facilities, skilled nursing facilities, juvenile facilities, college dorms, or military barracks. While the number of households in most neighborhoods was relatively constant over the past two decades, the West End and Southside neighborhoods each lost over 150 households.
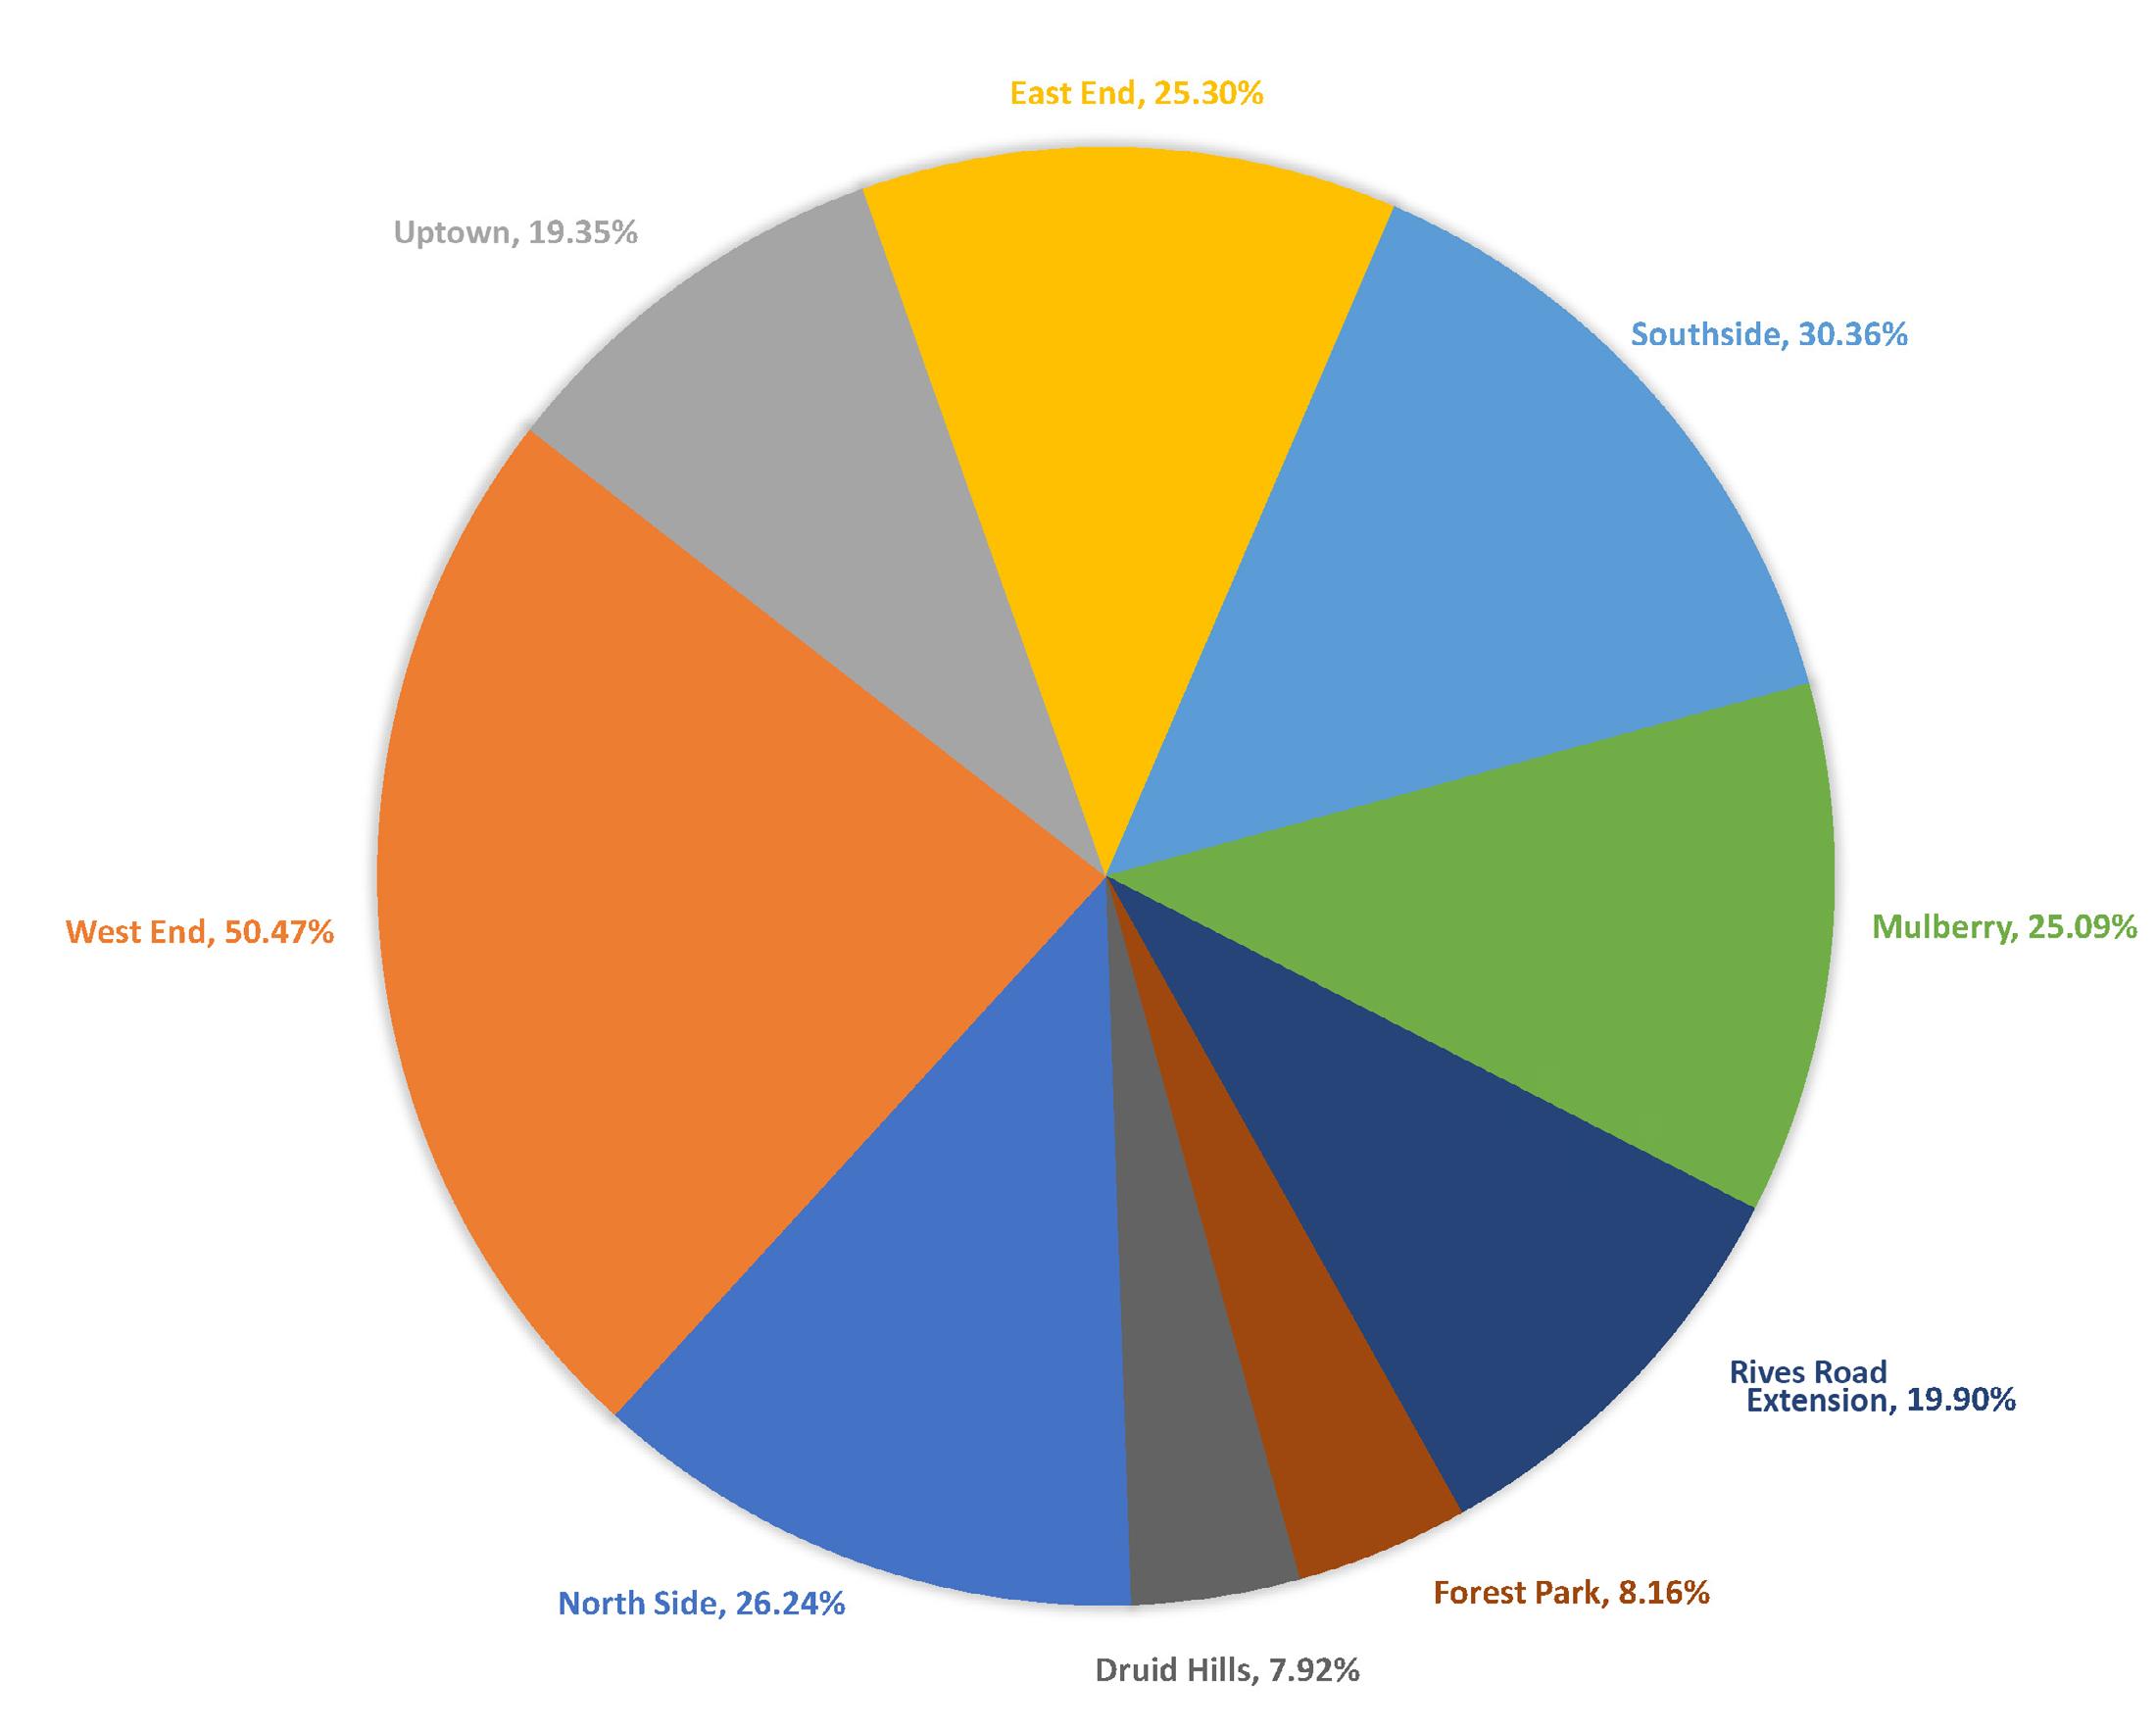
This pie chart shows each neighborhood's share of households living below the poverty line in the City of Martinsville. Of the 26.12% of the households within the City of Martinsville that are below the poverty level, the largest percentage of households are within the Southside (30.36%) and West End (50.47%) neighborhoods.
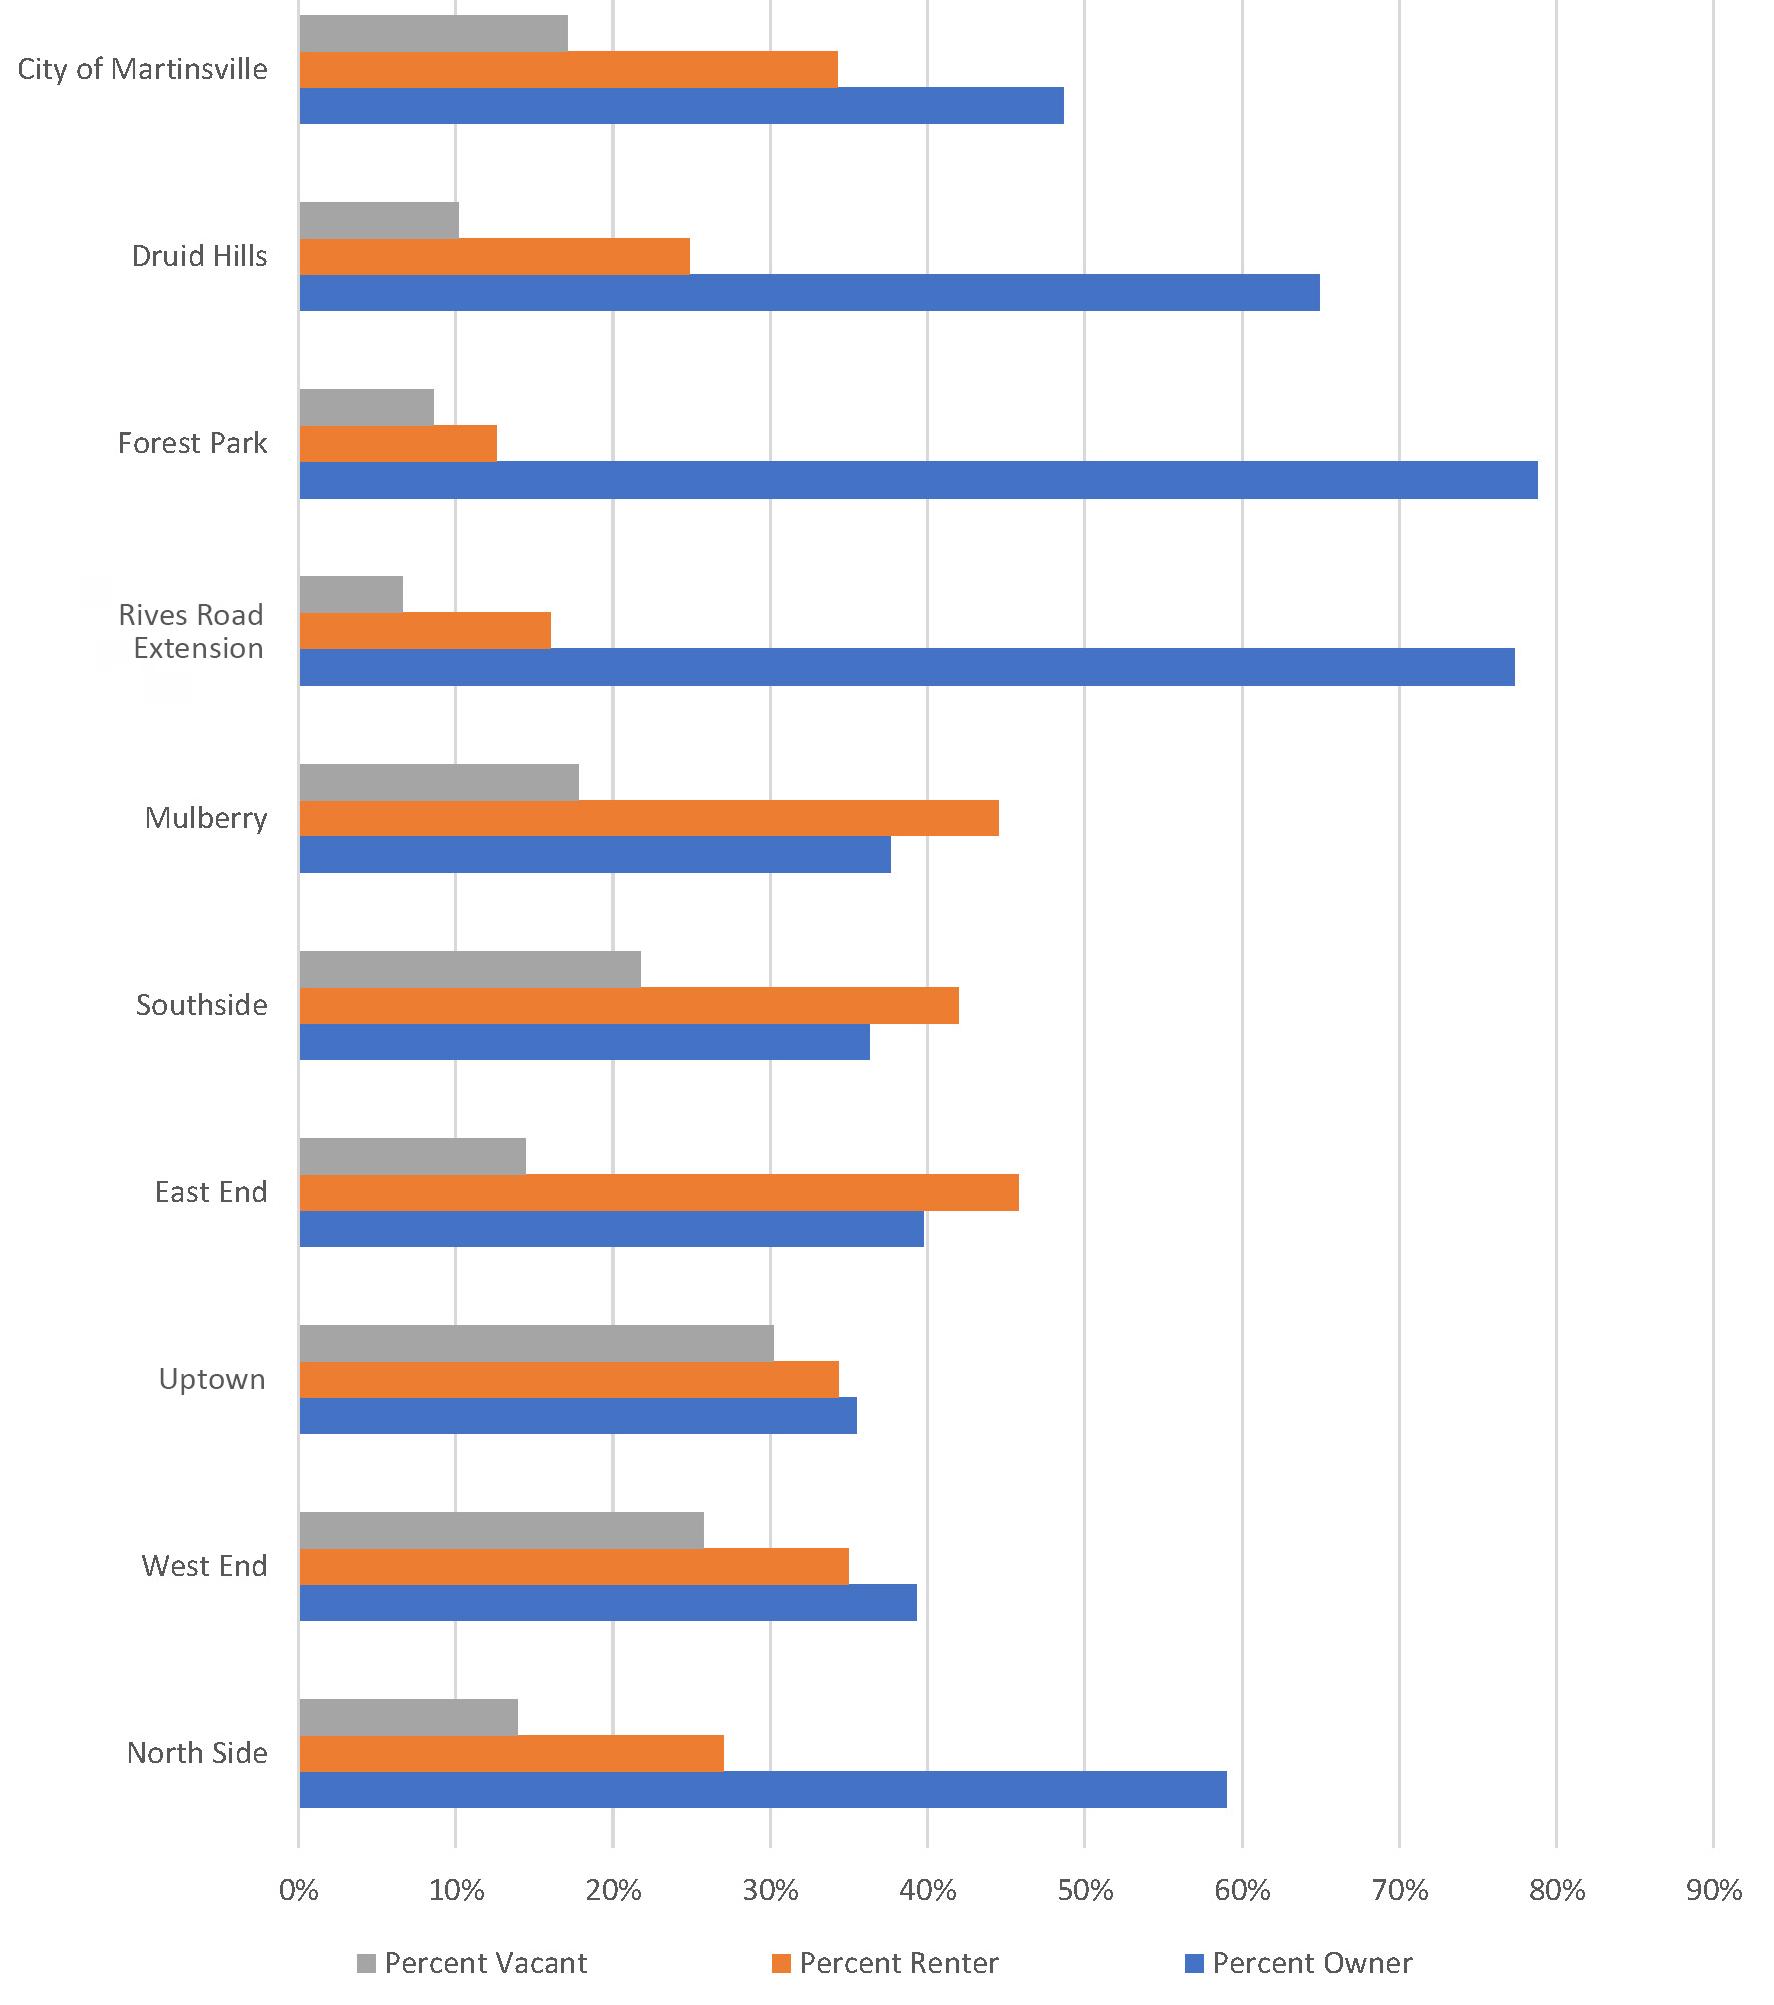
This graph shows the percentage of vacant, renter-occupied, and owneroccupied housing units per neighborhood. Mulberry, Southside, East End, and West End have roughly 40% renter-occupied housing units and higher levels of vacancy than other neighborhood areas.
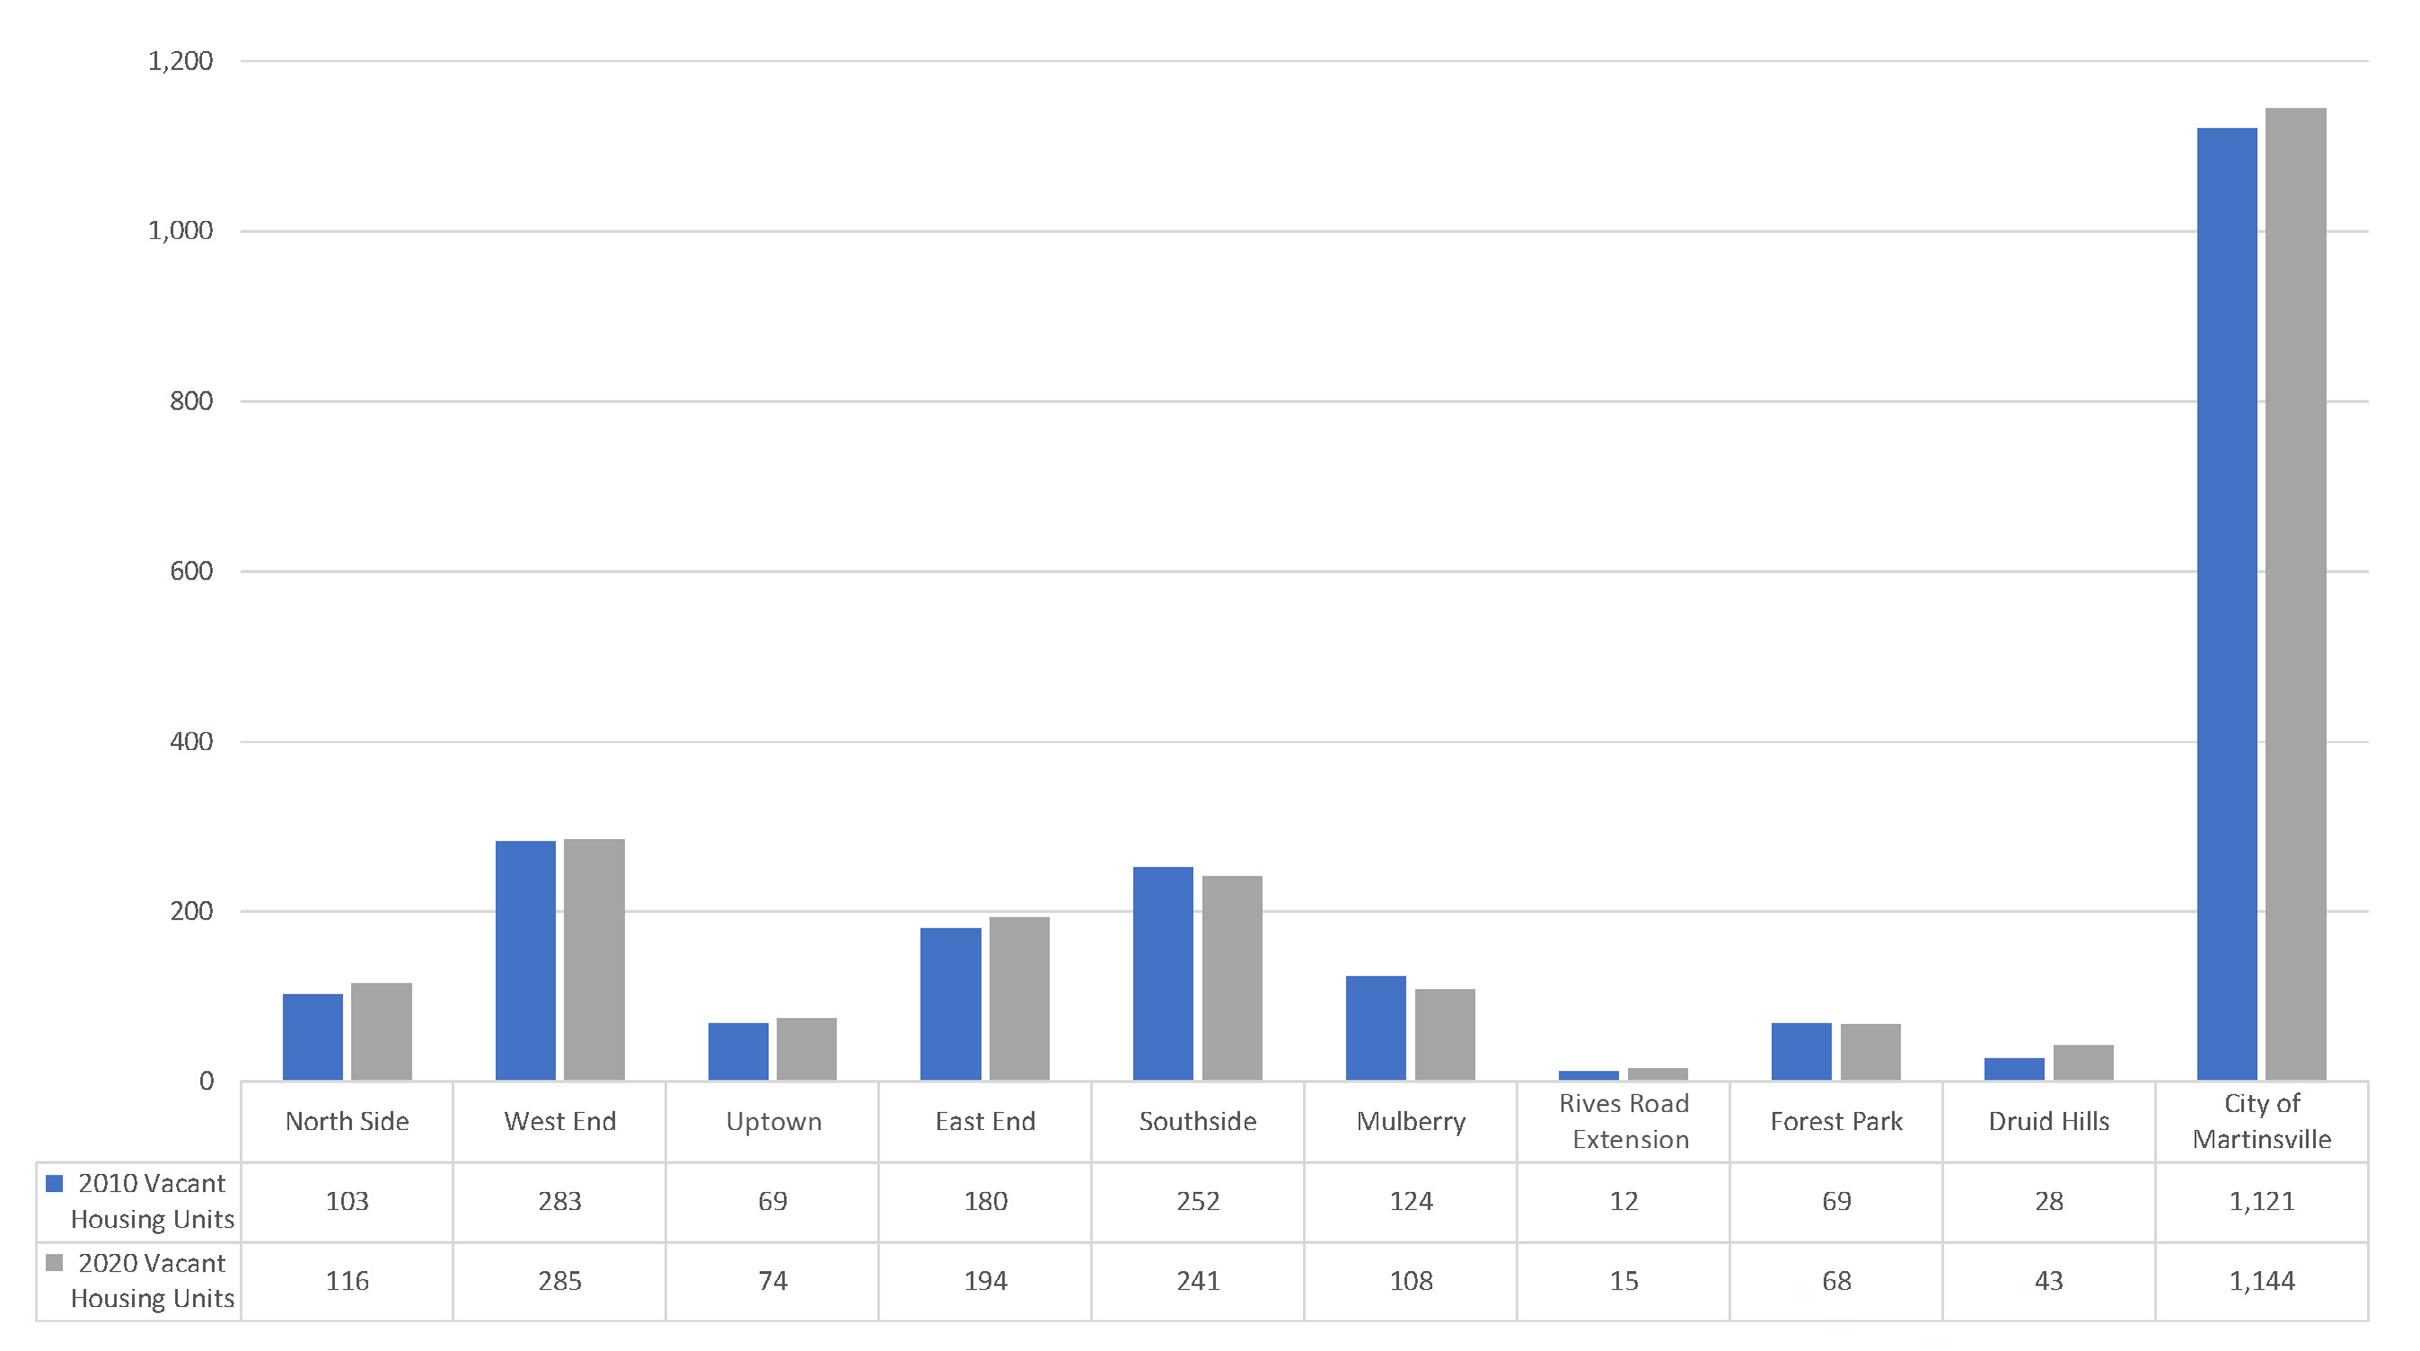
This graph shows the amount of vacant housing units in each neighborhood in both 2010 and 2020. The Southside and West End neighborhoods had the highest amount of vacant units in both 2010 and 2020.
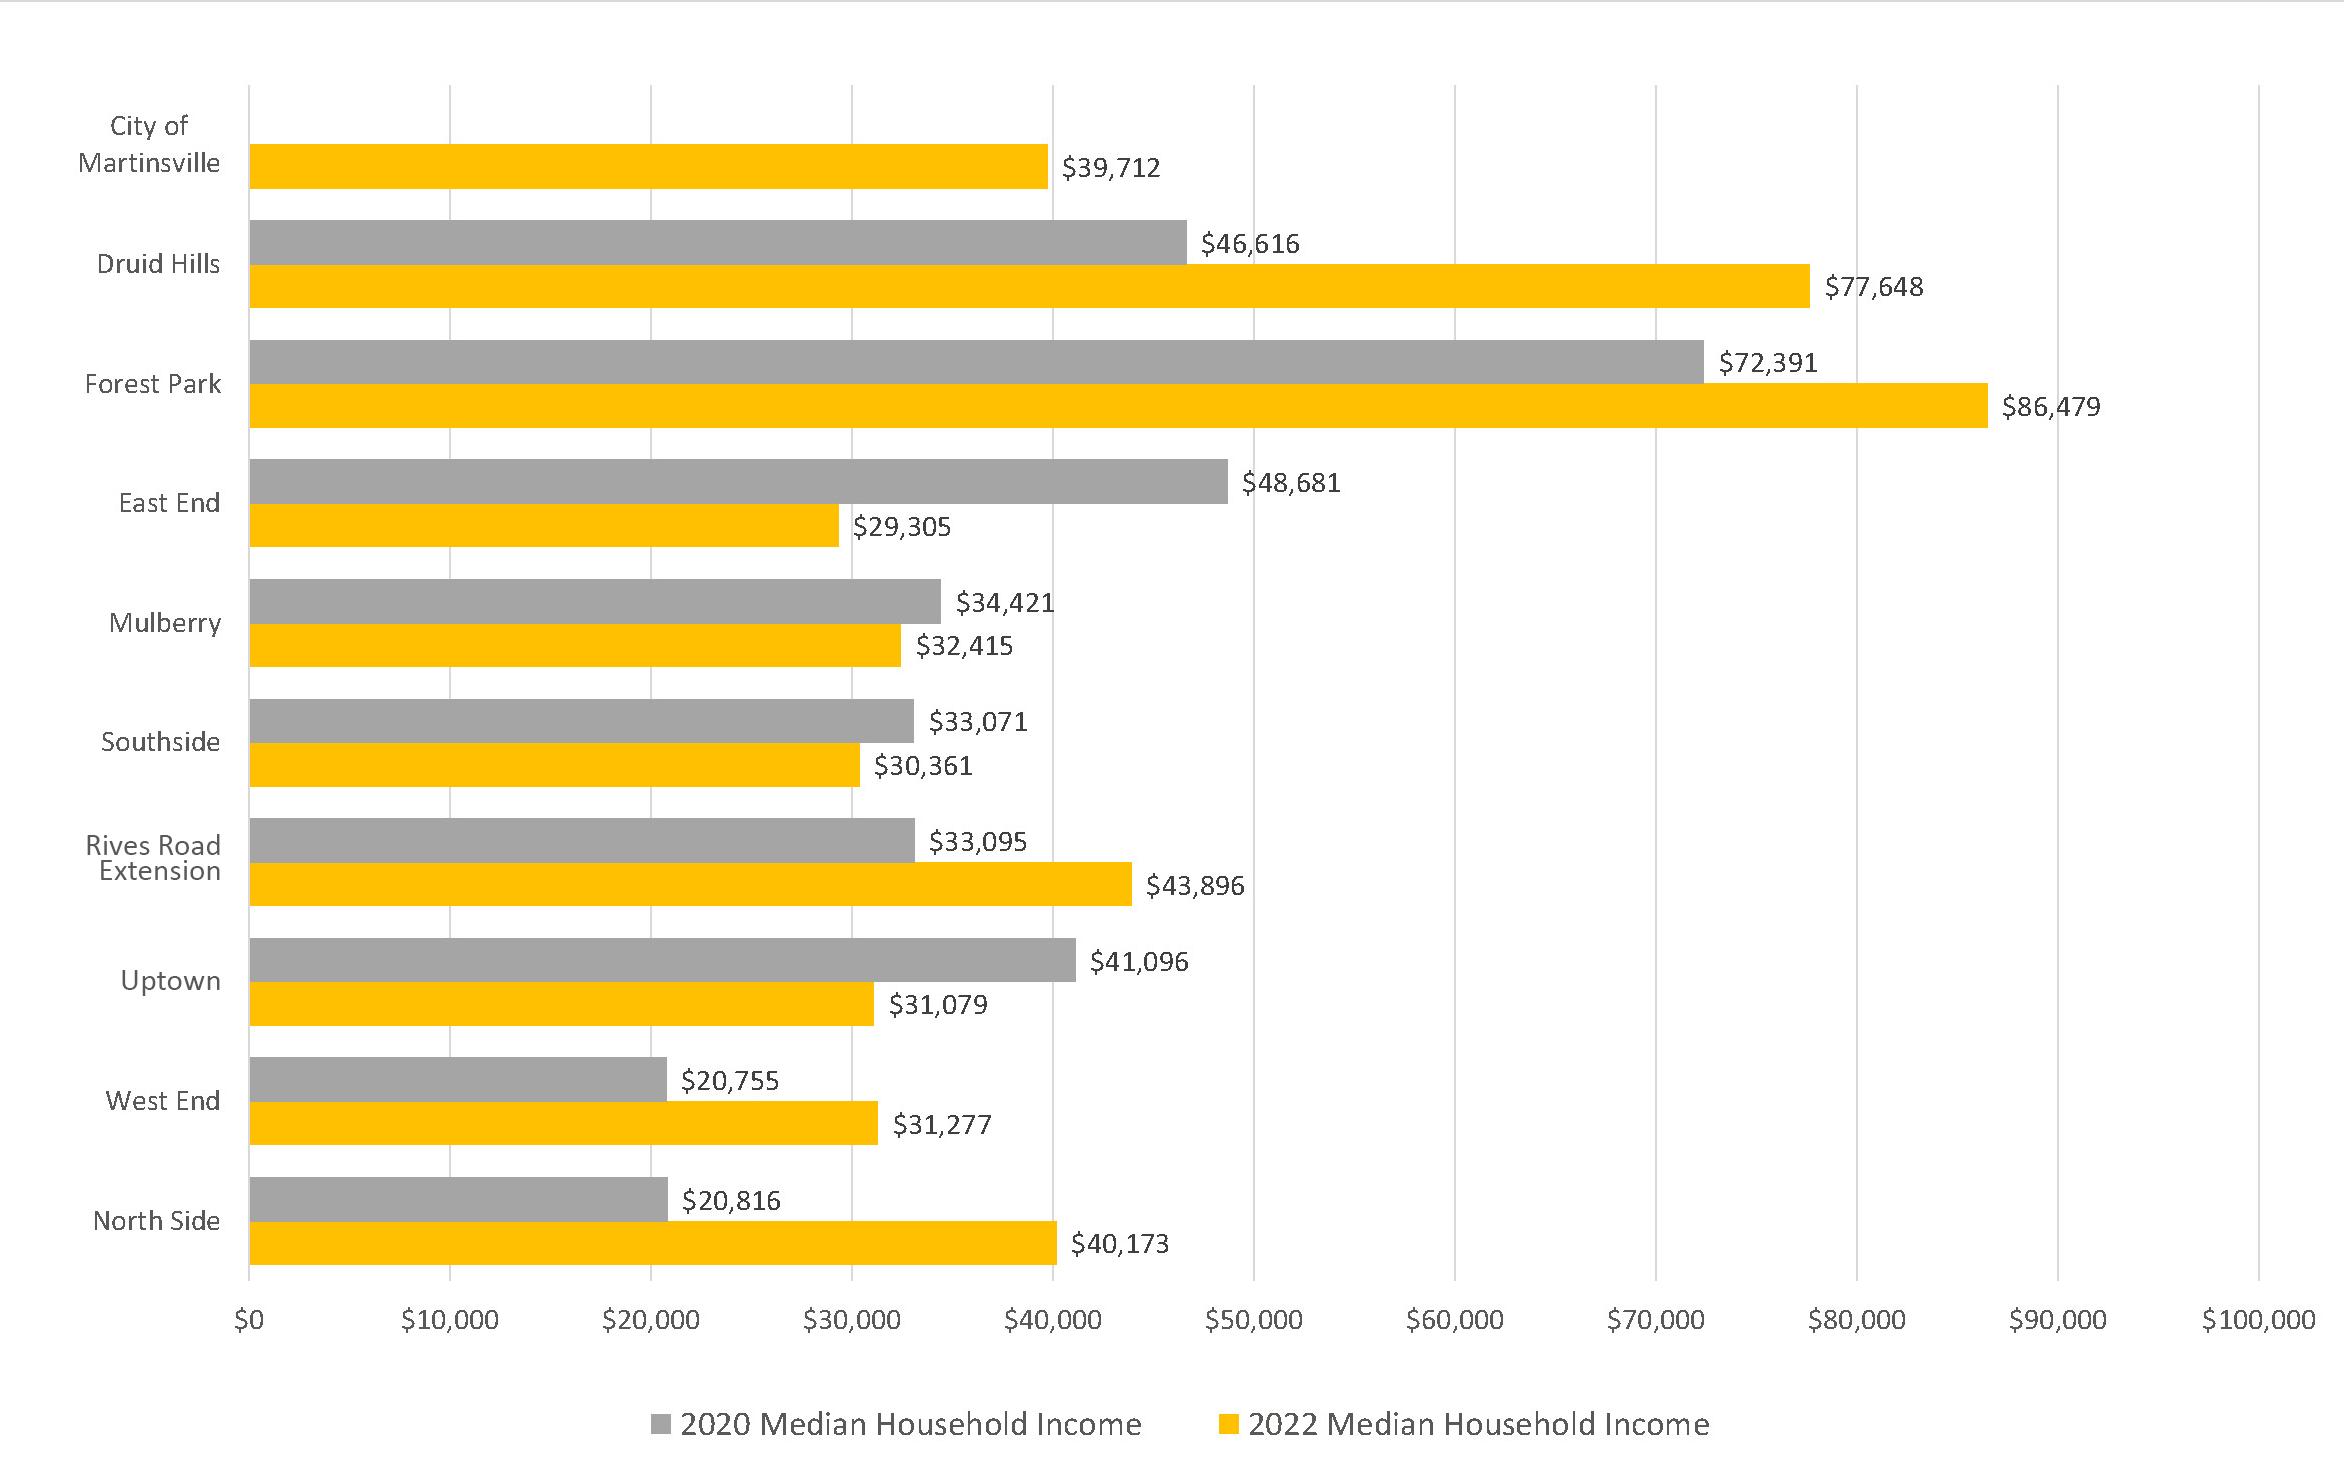
This graph uses ESRI Business Analyst data to compare median household income between 2020 and 2022. The East End, Southside, Uptown, and West End neighborhoods have median household incomes lower than that of the City. The Southside, Uptown, and Mulberry neighborhoods were the only three to experience a decrease in median household income over the two years.
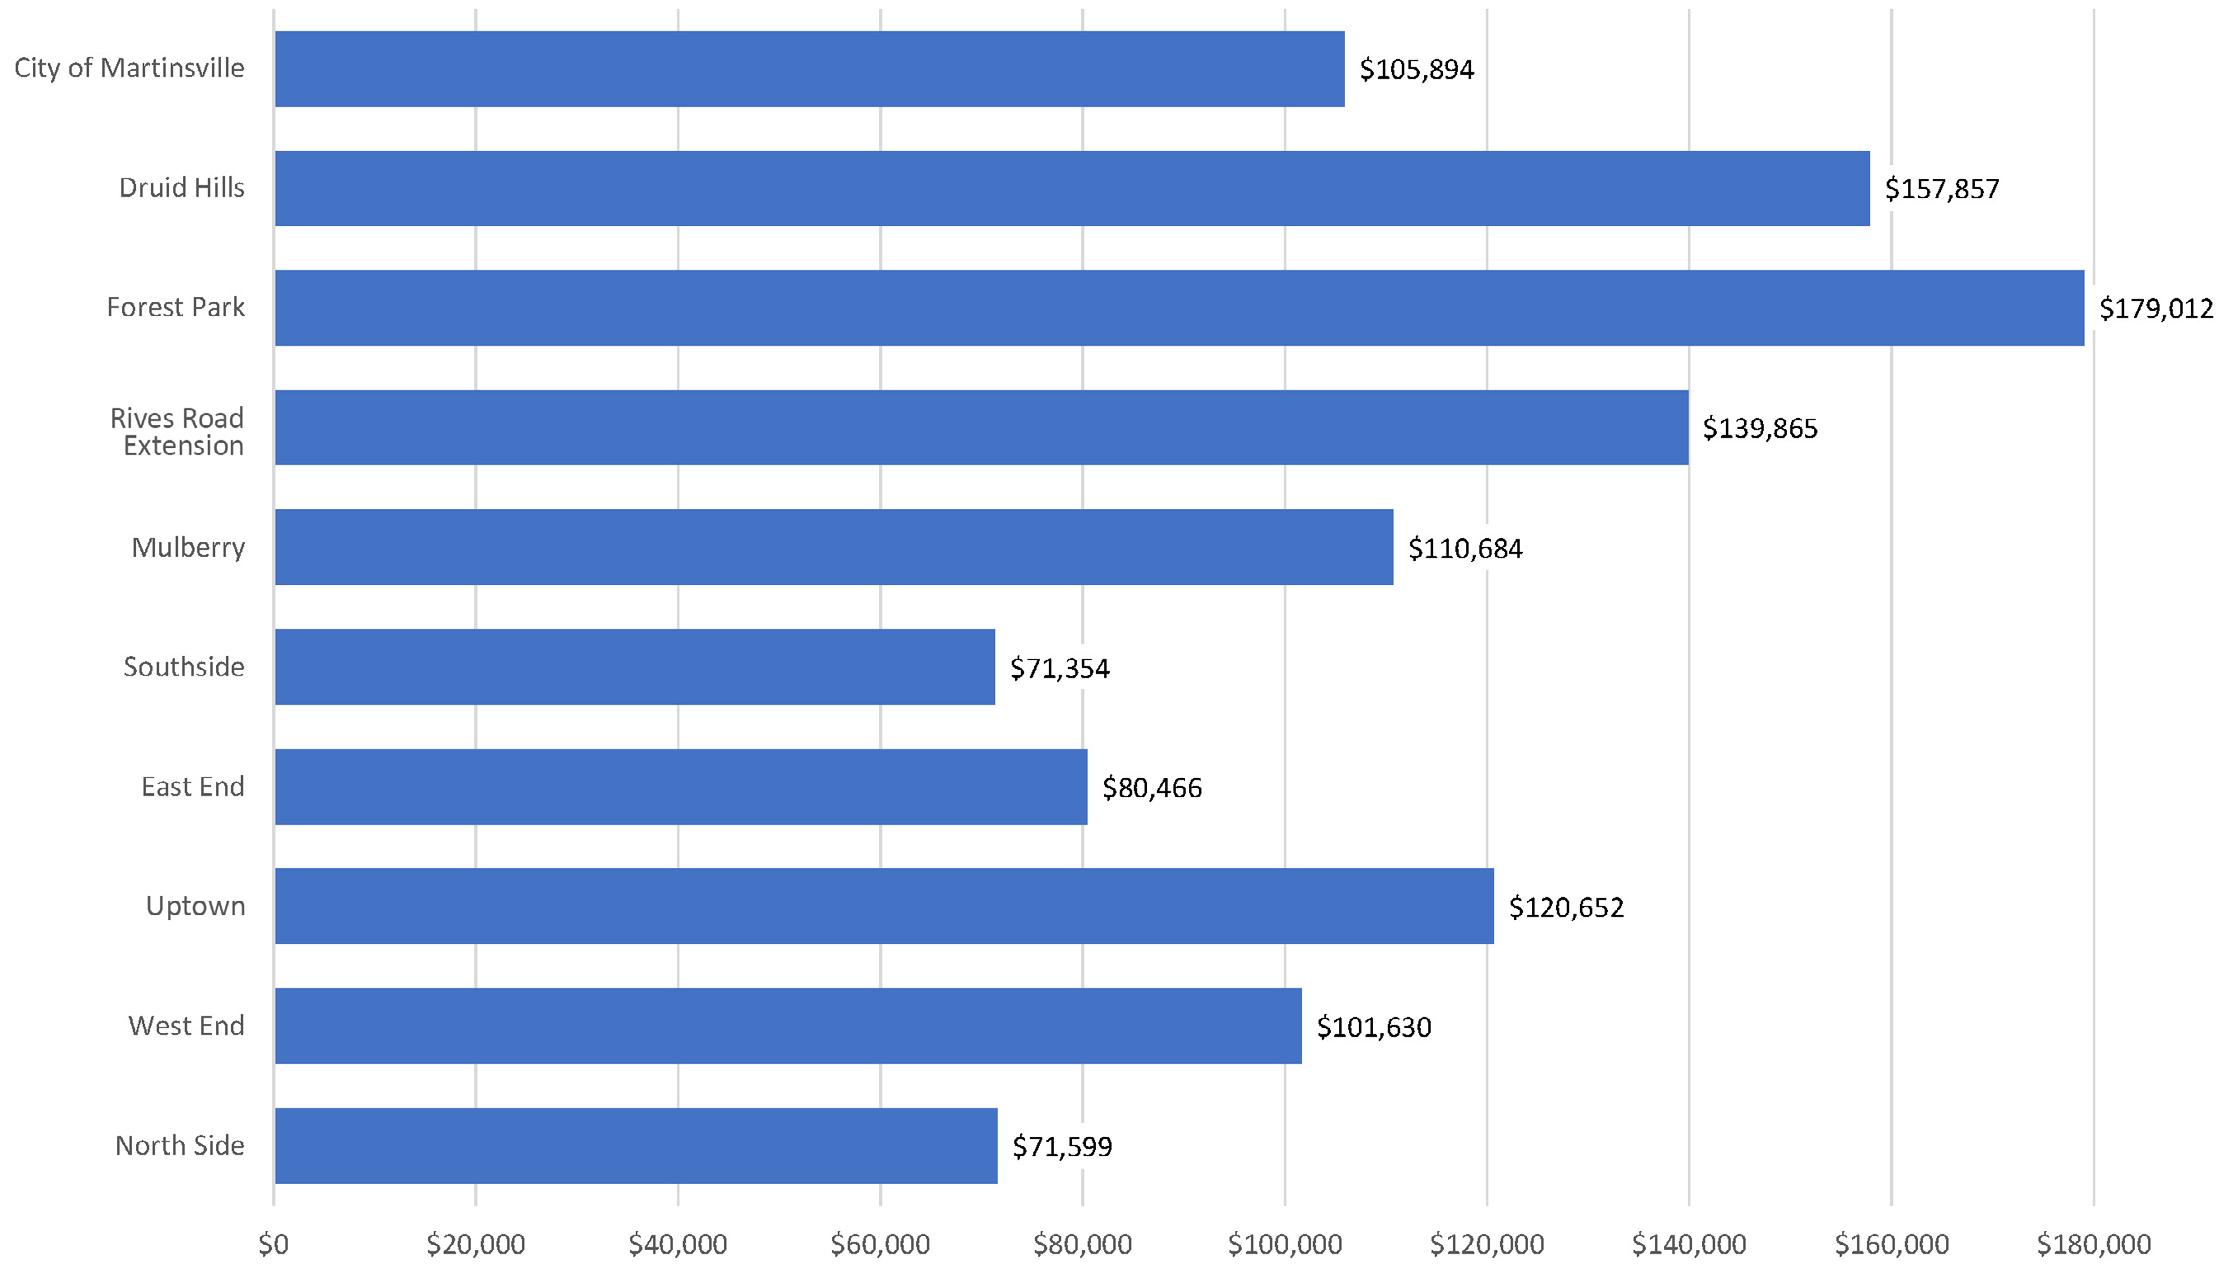
This graph uses ESRI Business Analyst data to show the estimated 2022 Median Home Value in each neighborhood. The Southside and North Side notably have the lowest home values around $71,000.
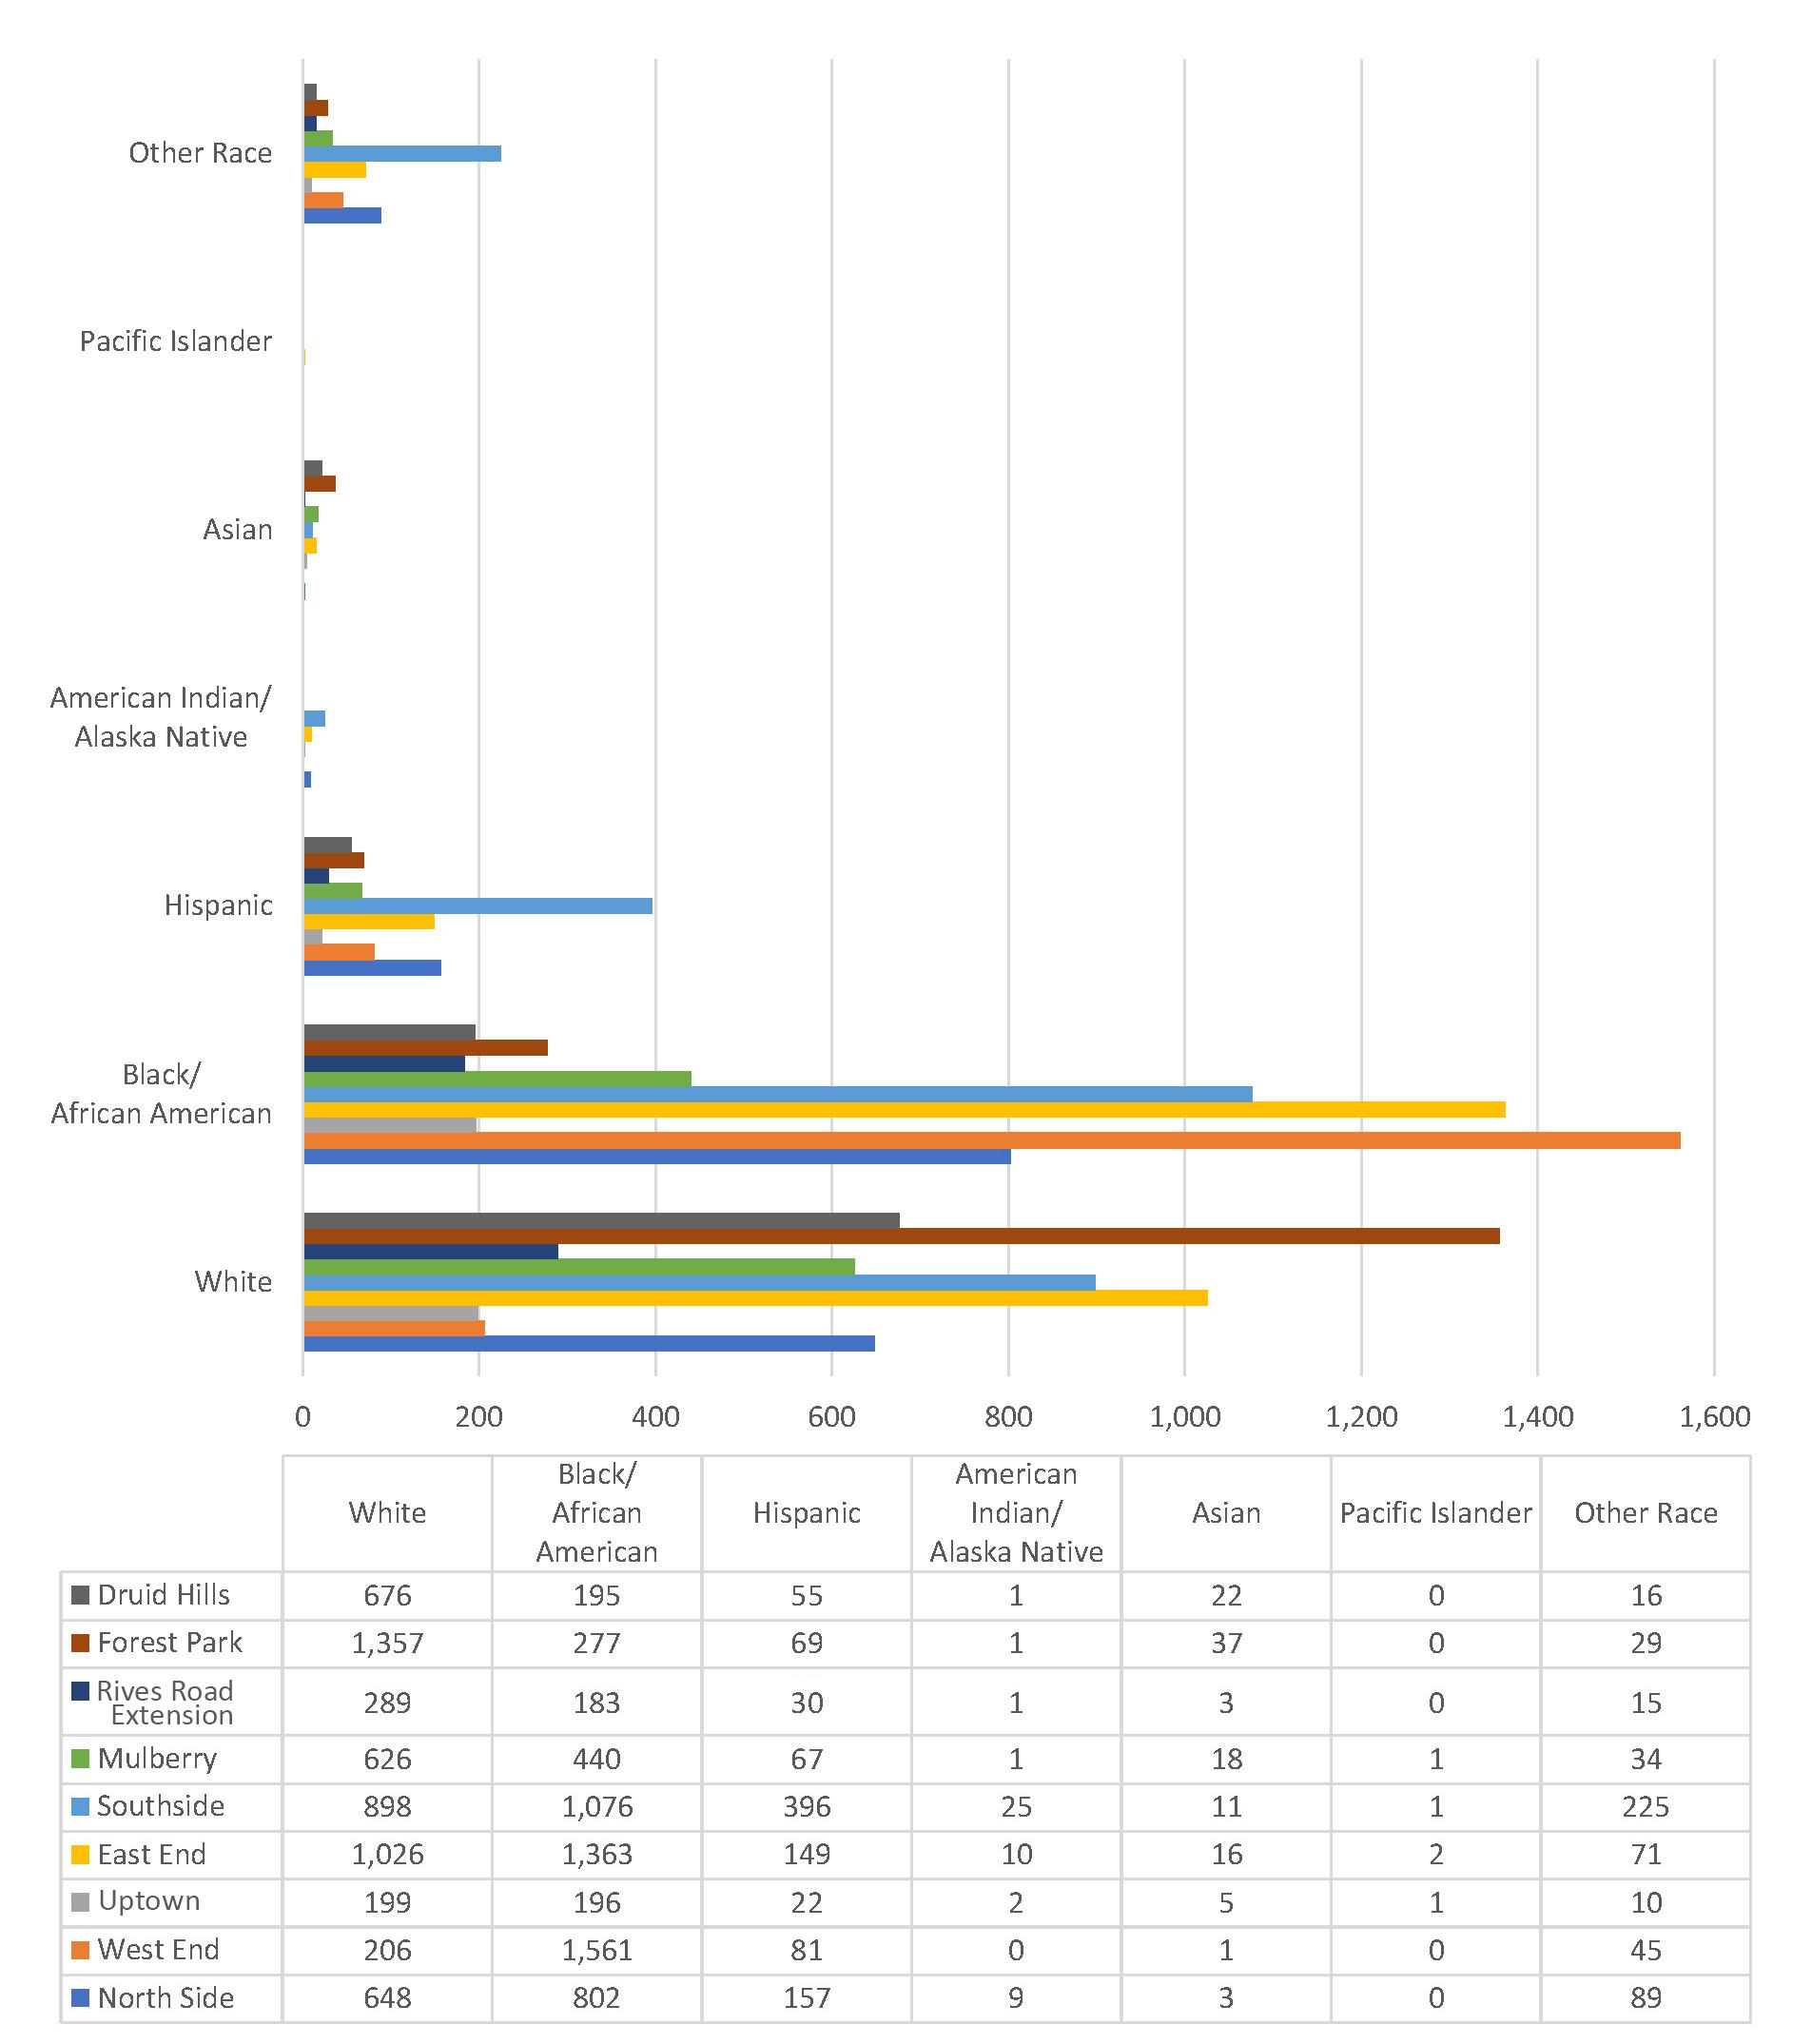
Through the analysis of both the physical conditions of Martinsville's housing stock and the investigation of key housing data, the Southside neighborhood emerged as the area with the highest concentration of residential structures in Intermediate, Major, and Dilapidated condition.
It should be noted that there are additional clusters in the West End and Mulberry neighborhoods with similar characteristics to the Southside neighborhood in terms of median household income, percentage of households below the poverty line, or the percentage of renters in an area.
As the Southside having the highest concentration of dilapidated and deficient structures together, revitalization efforts should target this area for the most efficient use of resources in rehabilitating homes. The Southside lost an estimated 164 households between 2000 and 2022, which has corresponded with a deterioration of the housing stock in the area.
The Southside neighborhoods lends itself well to revitalization efforts due to its proximity to the core of Martinsville. Those living in rehabilitated homes in the Southside will have closer access to a more dense, walkable environment in the future, as opposed to finding housing further from employment centers and relying more heavily on a car or public transportation.
There are many areas of need in Martinsville, however, areas such as the West End have showed improvement in the condition of housing as a result of previous Community Development Block Grant funded projects. Through working with the Southside, Martinsville can target the highest concentrations of blighted structures and make the most efficient use of resources.
The map on the following page depicts areas of focus that identify clusters of blight and would be suitable for targeted projects.
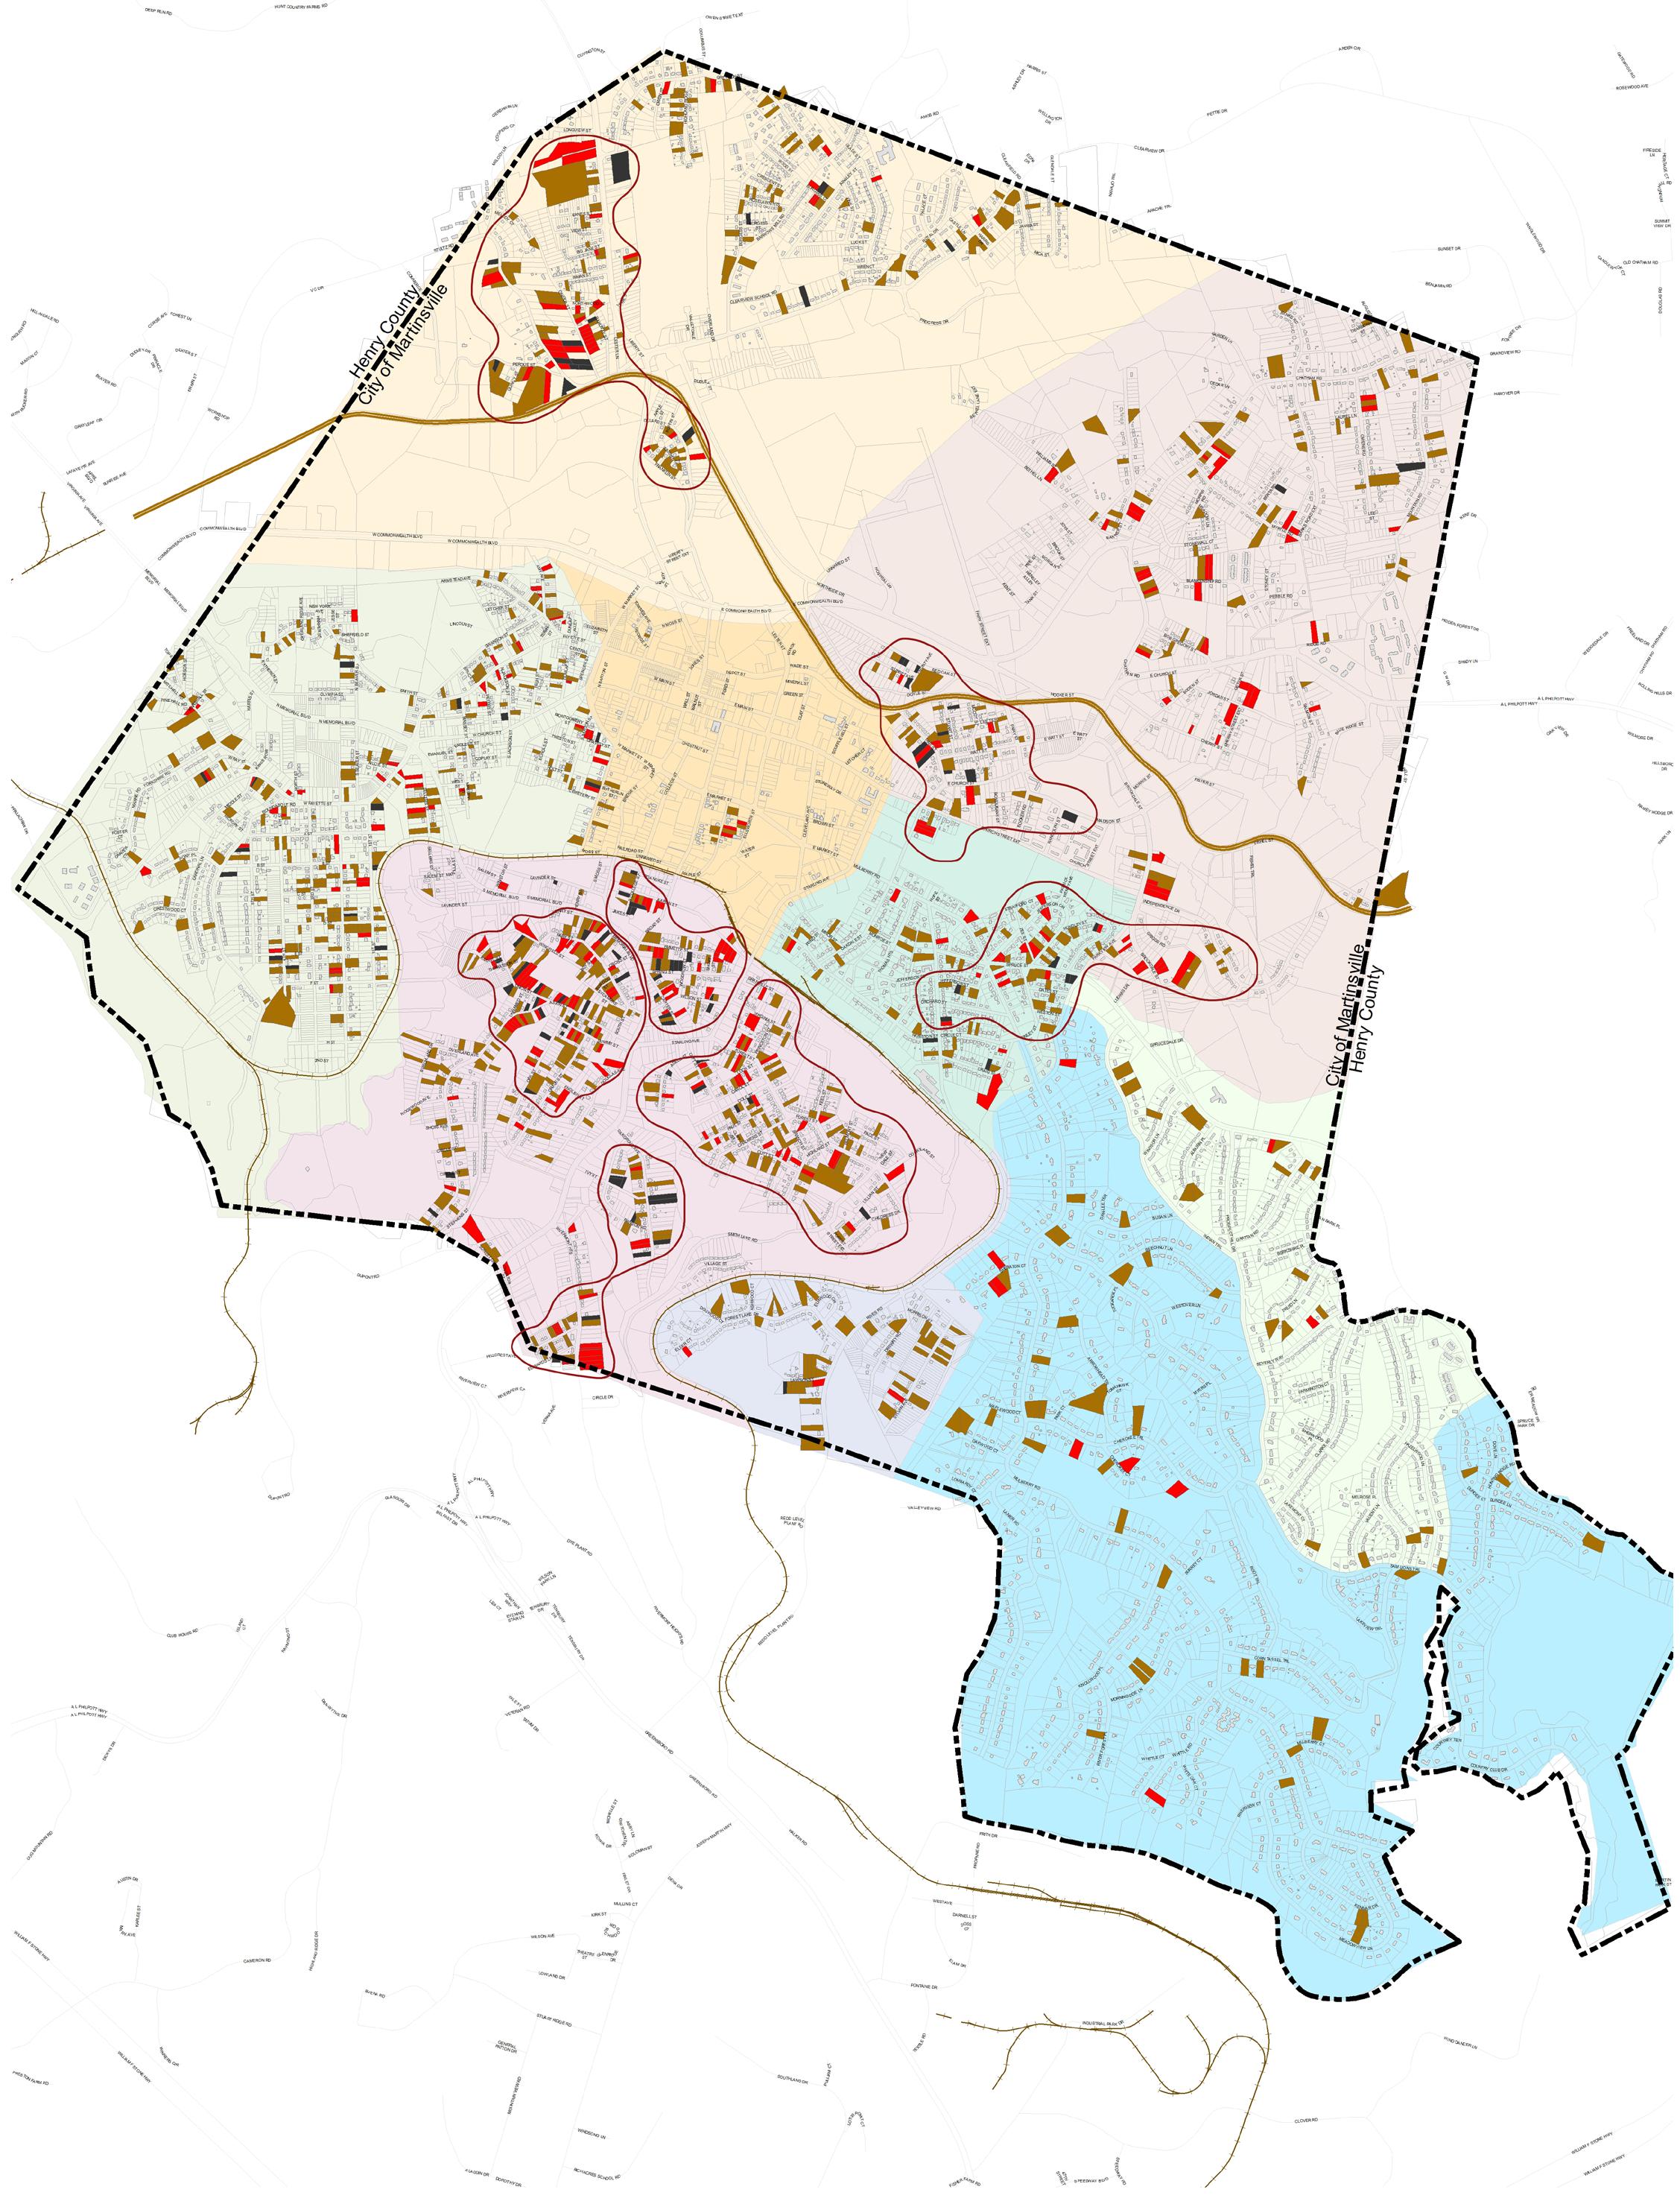
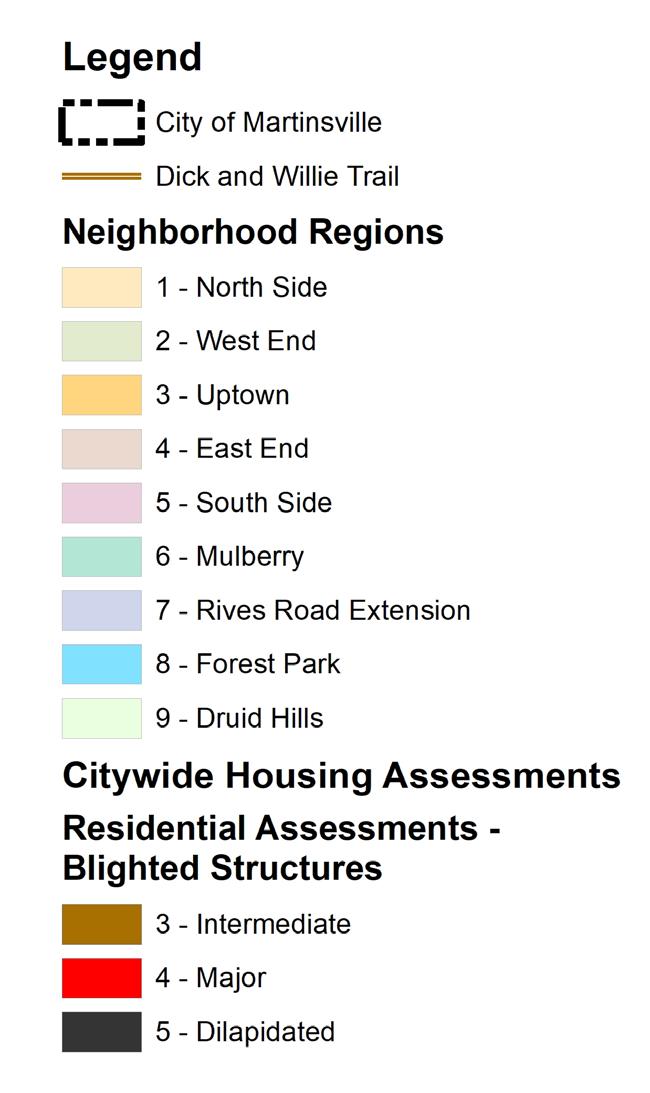
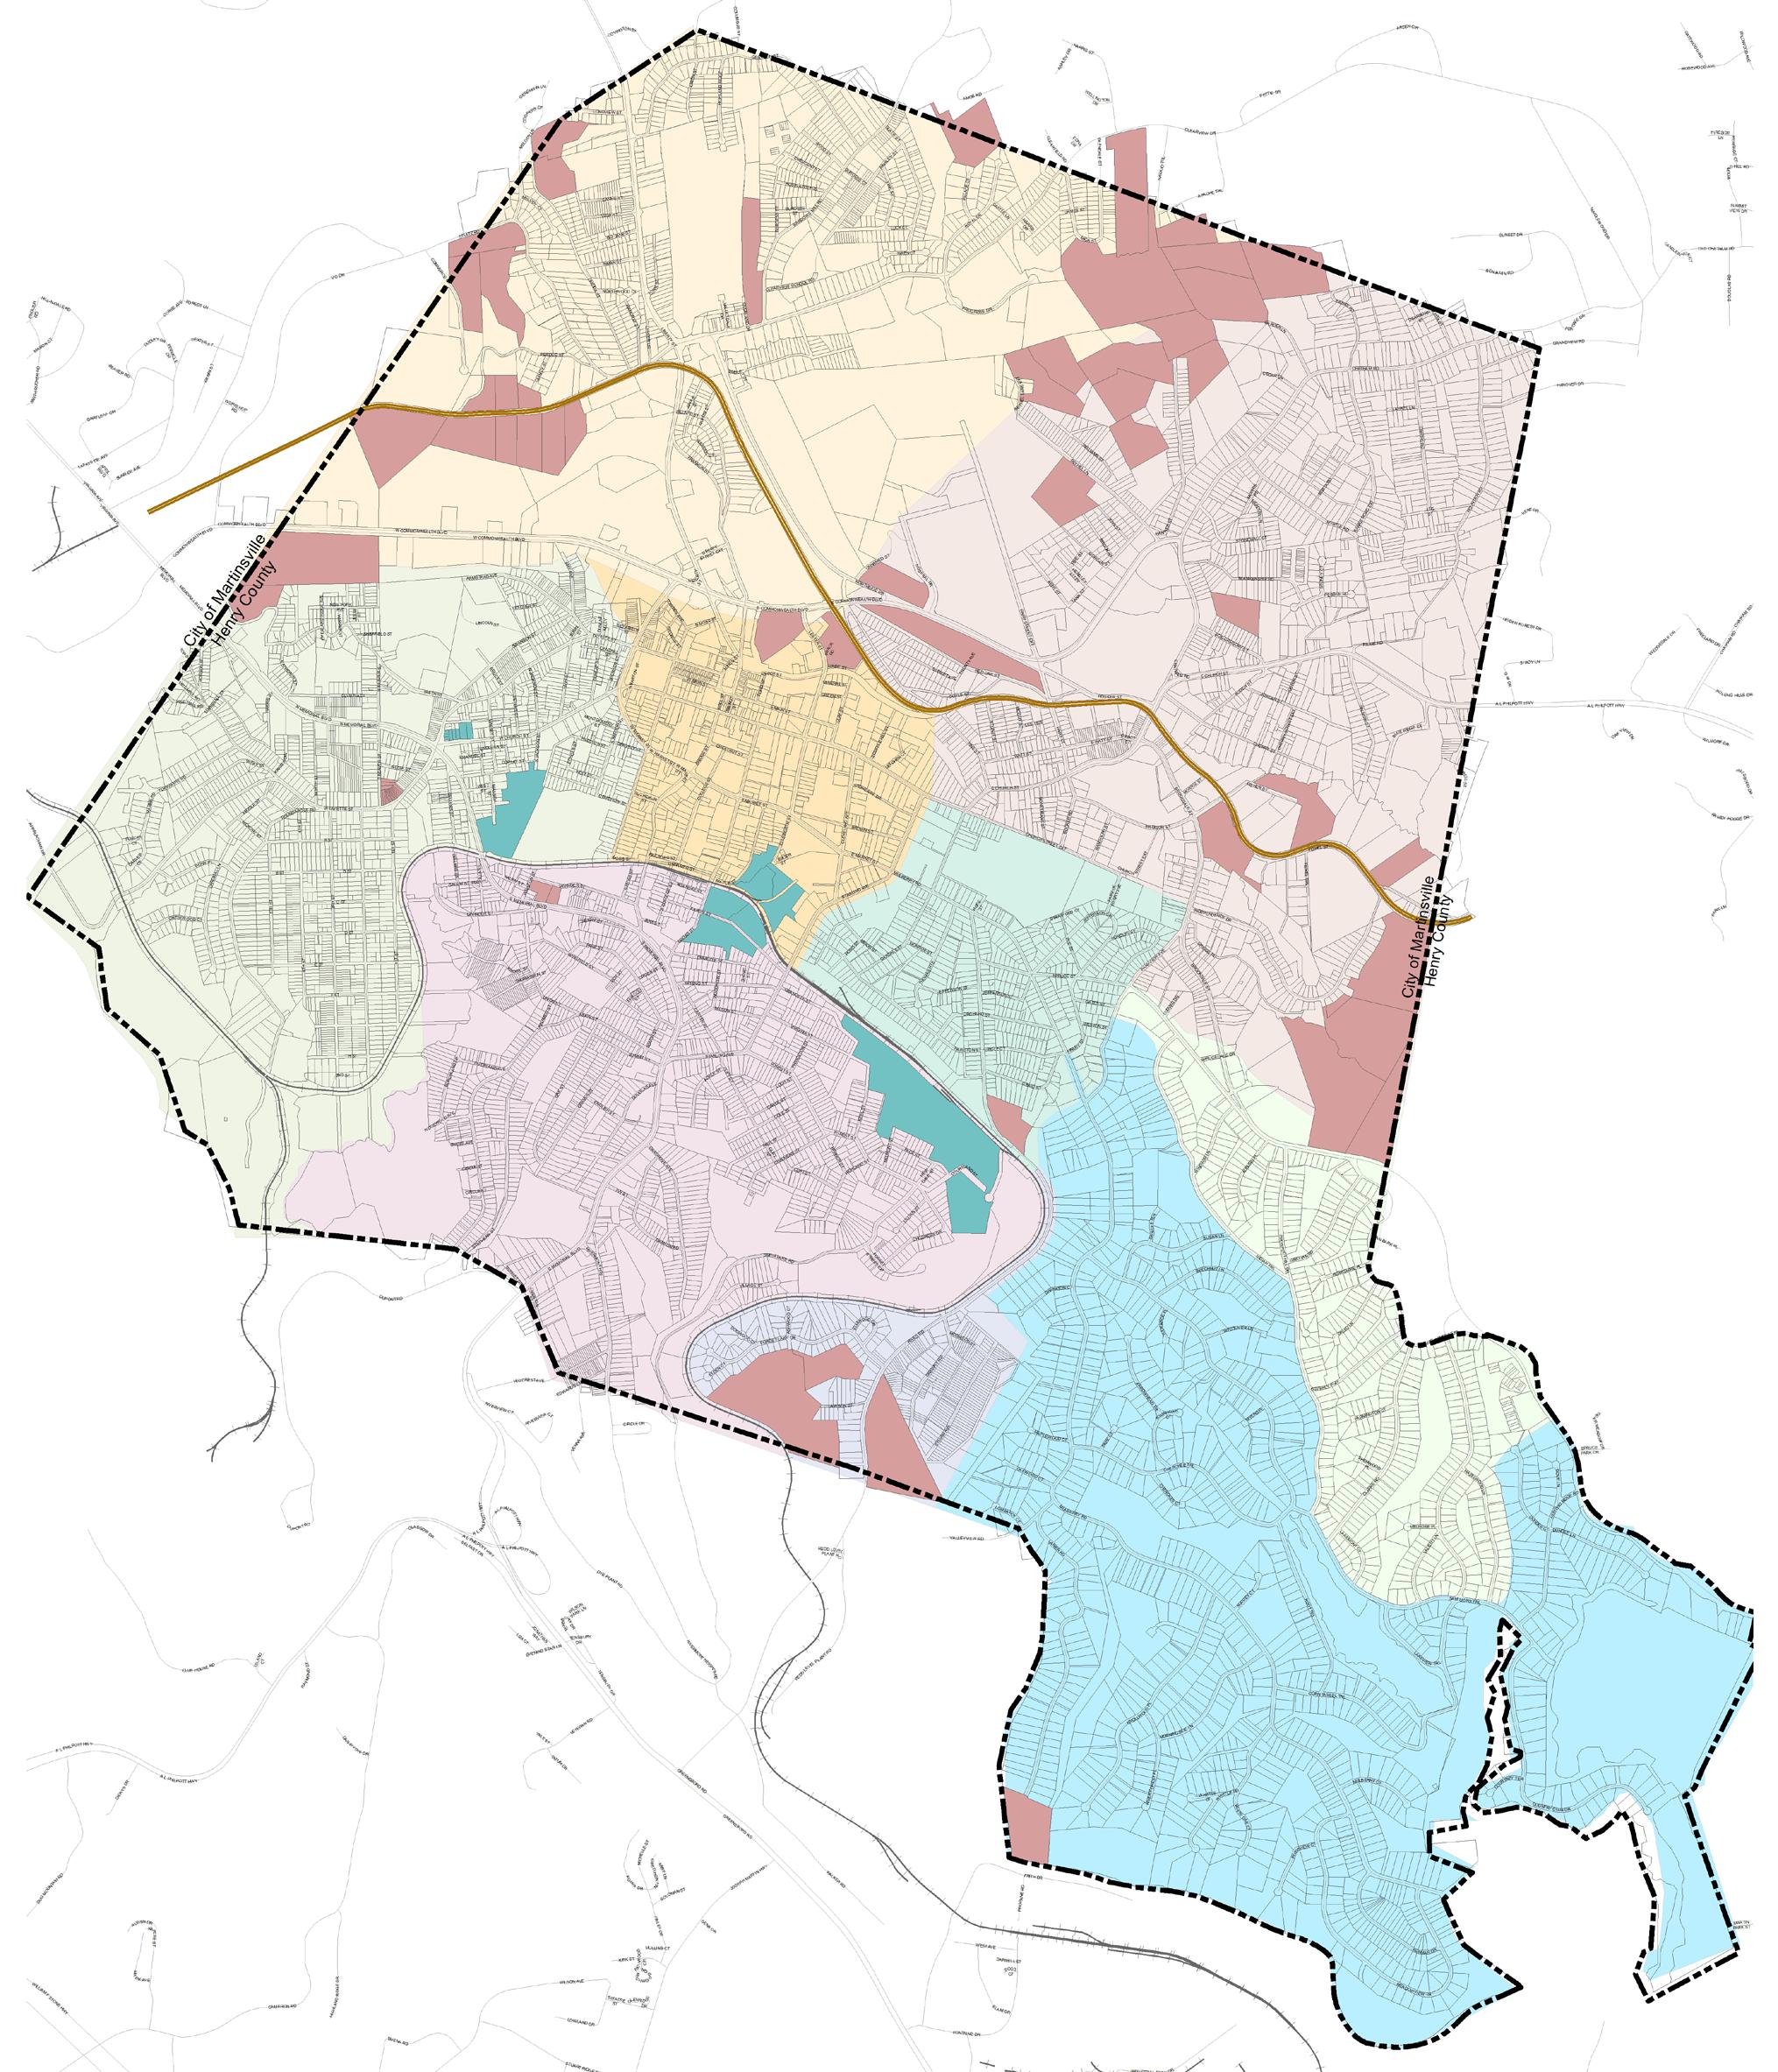
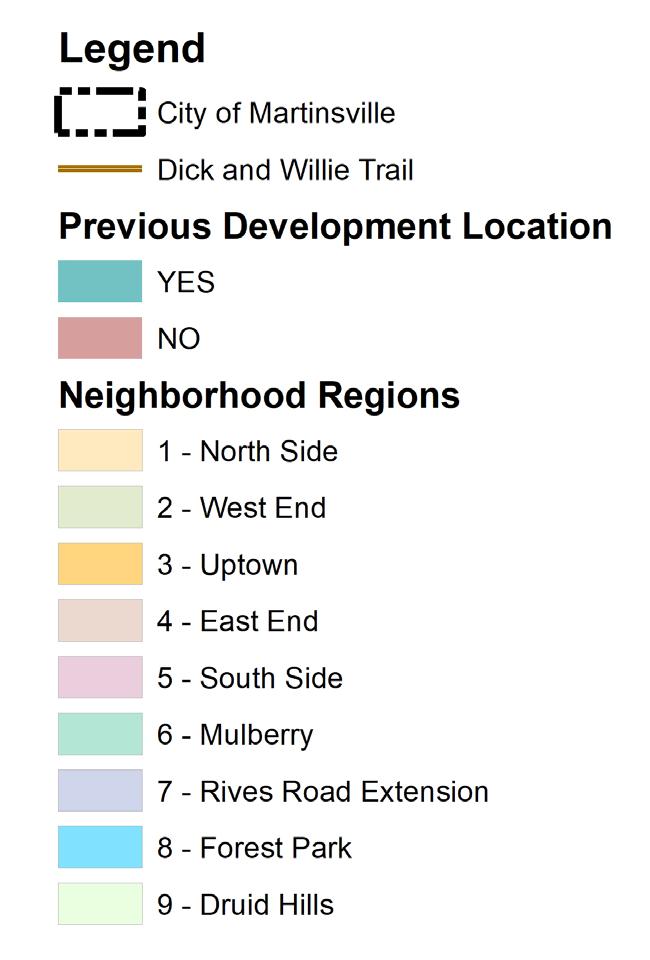
This map shows potential sites for development. Previously developed sites depicted in green are mostly parcels that were used for industrial manufacturing along the railroad. Other sizable parcels with development potential are shown in red throughout the city. These parcels are also accessible to public utilities.
Depending on the needs and interests of the City of Martinsville, a number of state and federal funding resources can be applied to improving the conditions of existing housing and the construction of new housing in the City. All of the potential grant funding and incentives require an affordability component for either all of the units improved or developed or a substantial portion of the units. The U.S. Department of Housing and Urban Development (HUD) typically defines affordable as units occupied by or available to households of low- to moderate-income (LMI). This affordability definition is based on 80% of Area Median Income (AMI), further delineated by household size, a threshold that applies to programs such as the Community Development Block Grant Program. Other funding, such as HUD’s HOME Investment Partnership Program, not only require that the program meet the 80% threshold, but also require that a portion of the units be available to households making 60%, 50%, and 30% of AMI.
All of the above being said, nothing precludes a locality in Virginia from subsidizing or incentivizing the improvement of existing housing or the development of new housing through its own resources. Most, if not all, of Virginia’s small- and medium-sized localities do not likely have a lot of cash to put toward such projects. Additionally, there could local pushback to subsidizing market-rate housing. However, an asset that small- and medium-sized localities can apply to both affordable and market-rate housing is the surplus land they often have in their inventory. Such land, acquired by various means including tax sales, can be sold at a discount or transferred for $1 in order to incentivize housing development. Typically, such land transactions take place through a locality’s redevelopment and housing authority or economic development authority, so as to avoid the extra steps it takes for a locality to sell surplus land. To ensure that the development occurs as intended, the deed of transfer or some other legally binding document is used to put in place performance standards and “claw back” provisions to regain control of the property if performance becomes an issue.
The following subsections delineate the state and federal funding resources that can be applied to efforts to improve existing housing or to develop new housing. They also define the City of Martinsville’s role in tapping into the funding and overseeing their expenditure. For some funding, the City is the sole entity applying for and responsible for the funding, though the day-to-day administration of the funding/program can be contracted out. For other funding, a non-profit or private developer is required to be the lead entity, a requirement particularly relevant to the development or redevelopment of multifamily housing. Finally, for funding provided directly to households, such as first-time homebuyer assistance, the City has mainly a communications and educational role in lining up eligible households that can take advantage of the assistance.
The City of Martinsville is very familiar with Community Improvement Grants provided through the Virginia Community Development Block Grant Program (VCDBG), having done many housing rehabilitation projects in the past utilizing this funding source. As a part of the Small Cities CDBG Program, these HUD funds are administered by the Virginia Department of Housing and Community Development (VDHCD) and are available to communities that do not receive a direct allocation of funding from HUD (referred to as Non-Entitlement communities). Applications for funding can be submitted one or two times per year and with every Small City (or County) in Virginia eligible to apply for funding, the process is very competitive. Martinsville has been very successful in obtaining VCDBG grants in the past because of the housing needs in the community, the number of LMI households, and the level of economic stress in the area, all criteria by which grant applications are scored.
VCDBG funding can be utilized in a number of different types of projects, but the most common type of project is Housing Rehabilitation of properties that benefit LMI households, a priority in Virginia and for HUD in general. Housing Rehabilitation Projects are eligible for up to $1.25 million with a cost limit of $125,000 per rehabilitated house. In some cases, where a house is in such condition that it can not be rehabilitated within the cost limit of $125,000, the home can be replaced as a “substantial reconstruction” on the same footprint. The term “substantial reconstruction” is very intentional in that CDBG funds can not be used for the construction of new housing except in specific circumstances. In most substantial reconstructions, other outside funding has to be tapped to cover the difference between the cost limit and the actual cost of construction. It is also important to note, that the VCDBG Program Design includes a strong preference for addressing homes for homeowners, but because there are often rental properties mixed in among the home-owned properties, a typical Housing Rehabilitation Project does include several landlord/investor-owned properties where the tenant household is LMI.
In the past, VDHCD required that Housing Rehabilitation Projects be implemented in a narrowly defined neighborhood or portion of a neighborhood so that the impact of the improvements would be more recognizable and create some synergy that would improve the entire project area. However, in recent years, VDHCD has allowed for scatter-site Housing Rehabilitation Projects and projects combining rehabilitations intended to address a cluster of housing needs with other nearby scatter sites where individual houses are in need of rehabilitation, but the surrounding homes are in good condition. This latter provision is helpful in the case of Martinsville, where this study has identified clusters of housing conditions needing to be addressed with other scattered poor housing conditions only one or two blocks outside of the cluster.
Virginia CDBG funds can also be used for Comprehensive Community Development (CCD) Projects where in addition to housing rehabilitation there are public improvements included in the grant request as other major activities. Activities that can be included are water and sewer utility upgrades, stormwater improvements, roadway and sidewalk improvements, and other improvements that enhance the quality of life in the project area. However, when scoring a CCD, VDHCD will be looking for the locality to also put some of its own money into these additional major activities through its capital improvement program, its VDOT funds, or other matching grant sources. VDHCD also frowns upon improvements that are simply deferred maintenance that the locality has failed to address in the past. A number of the VCDBG projects undertaken by Martinsville in the past have been CCD projects, so again, the use of VCDBG funding in these type of projects is very familiar to the City. The current maximum amounts for a CCD project are $1.25 million for a 2-activity project, defined as housing rehabilitation plus a public improvement activity costing at least 20% and no higher than 70% of the overall budget for the project, and $1.5 million for a 3-activity project, defined as housing rehabilitation plus two distinct public improvements, each costing at least 10% and no higher than 60% of the overall project budget.
As a part of any VCDBG-funded project, a portion of the grant funds (approximately 10% with other specific limitations by project type) can be used for administering the grant. This portion can be retained by a locality to compensate for staff time dedicated to the management and administration of the project or alternatively, a locality can procure the services of an outside consultant or its Planning District Commission for managing and administering the project. However, even where outside assistance is utilized, the locality has to make application for the funding upon approval of its governing body and is contractually responsible for expending and administering the funds in keeping with VDHCD and HUD requirements. Similarly, per VDHCD guidance and cost limitations, VCDBG funds can be utilized for the cost of procuring and utilizing the services of a Housing Rehabilitation Specialist, an architecture firm, and/or an engineering firm as needed for the specific project.
VDHCD also provides VCDBG funding toward Planning Grants to do the community outreach, neighborhood research, housing assessments, preliminary architecture, preliminary engineering, planning and budgeting, and project development for potentially eligible VCDBG-funded projects. Up to $50,000 in Planning Grant funds are available for a potential Housing Rehabilitation Project and $60,000 for a Comprehensive Community Development Project. As above, A portion of these funds can be retained by a locality to compensate for staff time put into the planning of a project or alternatively, a locality can procure the services of an outside consultant or its Planning District Commission for managing the Planning Grant. The funds can also be utilized for the cost of preparing housing assessments and preliminary architecture/engineering reports.
While VCDBG funds can not be used for the construction of new housing, VCDBG grants and other Virginia funding sources can be used in support of new housing construction.
VCDBG funding up to an amount of $1.0 million can be used for improvements necessary to bring newly constructed housing units online, whether single-family or multifamily. Eligible improvements include the design and development of the infrastructure (water, sewer, storm drainage, and sidewalks/roadways) needed to serve the new homes as well as initial site improvements. For a project to be eligible to utilize these funds, at least 51% of the housing units/households must be LMI. Also, the City of Martinsville would have to control (typically by ownership) the property during at the time of application and during the construction of the improvements, after which the City could transfer ownership to the non-profit or private developer of the housing. Utilizing VCDBG in this manner is ideal where the City owns a larger vacant parcel of land that is well suited for new housing development. The $1.0 million in improvements represents a significant incentive that the City can provide. If coupled with a discounted or $1 sale of the land as indicated earlier, the incentive grows even larger.
Where housing is being constructed for home ownership, the VCDBG funds can also be used for down payment assistance as long as the funding does not exceed 50% of the assistance provided. Many projects created in order to provide affordable first-time home buyer opportunities are developed by certified Community Housing Development Organizations (CHDO), housing development non-profits that receive direct subsidies from VDHCD/HUD in support of their housing efforts. These organizations have extensive knowledge of the grant programs and the effort required to make such a project successful. They also have staff that provide credit counseling, prequalification/ under-writing of households eligible for home ownership, home ownership education, and other supportive services required by the grant funding agencies.
VDHCD also oversees HOME Investment Partnership Program funding in Virginia and the Virginia Housing Trust Fund. Down payment and closing cost assistance of up to 10% of the value of the home being purchased can be provided to households that have incomes at or below the 80% AMI level and contribute 1% of the sales price to the purchase from their own funds. This assistance is subject to recapture if the home is sold within the 5- to 15-year affordability period depending on the amount of assistance provided. Similarly, a developer of housing affordable to households making less than 80% LMI can receive a direct subsidy to buy down the cost of the newly constructed affordable homes (not the market-rate homes that might be included in a project), the home being subject to a 5- to 15-year affordability and recapture period depending on the amount of assistance provided.
For a Non-Entitlement/Small City community like Martinsville, the funding referenced in the previous paragraph are most often accessed through the Vibrant Community Initiative (VCI) overseen by VDHCD that is intended for transformational projects. VCI projects can include single-family and multifamily housing, both owned and/or rented homes, and an economic development component. VCI funding can be as high as $3.0 million for Non-Entitlement communities and requires a 25% local match. However, while CDBG funds applied to a VCI project can be in the form of a grant, funding from the other sources [HOME, Virginia Housing Trust Fund, and Virginia Housing (the former Virginia Housing Development Authority)] would be in the form of loans at the development stage and/or small grants and loans to potential first-time homebuyers. Lending to a developer of affordable housing would be subject to underwriting and assistance to first time homebuyers would require a good credit score, though lower than what would be expected of the typical market-rate homebuyer. Even though much of the funding in a VCI project flows to entities other than the locality itself, the initial VCI application must be submitted by a unit of local government and the locality is responsible for administering certain portions of the funding (e.g., the VCDBG funds).
Virginia Housing, Virginia’s housing finance agency, works directly with potential homeowners to educate and prepare them for homeownership and works with them and local banks to arrange favorable loan terms, particularly for first-time home buyers. It serves as the gateway for affordable loans through its conventional lending program that requires only 3% down payments and favorable interest rates; FHA loans that require a 3.5% down payment; VA lending that requires no down payment; USDA Rural Housing Service loans that also require no down payment; and even second mortgages for first-time and repeat home buyers in federally targeted areas. Virginia Housing also provides down payment grants of 2.0% to 2.5% and closing cost assistance for income-qualified first-time home buyers. Required credit scores for these various programs run from 620 to 660, depending on the program.
While the City of Martinsville would not directly have a role in accessing Virginia Housing support for homebuyers, it does have a role in making sure the community is aware of the resources that are available through inviting Virginia Housing to provide an information booth at City-sponsored community events, building awareness among community groups of the support that is available, and communicating the availability of the resources through means such as its website, public service announcements, newsletters, utility bill inserts, etc.
Technically a locality is not involved in the development process for tax credit or Federal Housing Administration (FHA) guaranteed lending, other than the typical zoning and land use decisions that have to be rendered. However, these programs are mentioned here because the City of Martinsville can play a role in incentivizing the development of rental housing under the programs through discounted or $1 land sales. Most Low-Income Housing Tax Credit and 221 (d) (4) developments involve larger apartment buildings or complexes in order to make the finances work. Even at that, vacant parcels in the City’s inventory of three or more acres could provide a workable location for a LIHTC or 221 (d) (4) project, particularly those parcels that are level and have existing utilities onsite or nearby because of previous uses of the land.
The Low-Income Housing Tax Credit (LIHTC) program is a tool used by non-profit and private developers to undergird the rehabilitation or construction of affordable rental housing. Technically a locality is not involved in the development process, other than the typical zoning and land use decisions that have to be rendered. However, this program is mentioned here because the City of Martinsville can play a role in incentivizing the development of LIHTC housing through discounted or $1 land sales. Most LIHTC developments involve larger apartment buildings or complexes in order to make the finances work. Even at that, vacant parcels in the City’s inventory of three or more acres could provide a workable location for a LIHTC project. While it is impossible in this document to cover all of the bases of what a LIHTC project involves, some basic information is helpful.
LIHTC tax credits give investors a dollar-for-dollar reduction in their federal tax liability in exchange for providing financing to develop affordable rental housing. Investors’ equity contribution subsidizes low-income housing development, thus allowing some units to rent at below-market rates. In return, investors receive tax credits paid in annual allotments, generally over 10 years. Competitive credits of 9% tend to generate around 70% of a development’s equity over the 10-year period while less-competitive credits of 4% will generate around 30% of a development’s equity. Additionally, 4% tax credits are used for those projects seeking financing through tax-exempt lending, where projects using the 9% tax credits are not eligible for such financing. In Virginia, Virginia Housing oversees the LIHTC program. Virginia can only provide the 9% credits in any given year per an allocation of credits provided by the federal government, so the process is very competitive. The 4% credits are limited only by Virginia Housing’s volume cap on its tax-exempt lending and are therefore still competitive, but not nearly as competitive as the 9% credits.
Owners or developers of projects receiving LIHTC tax credits agree to meet an income test for tenants and a gross rent test. There are three ways to meet the income test:
1. At least 20% of the project’s units are occupied by tenants with an income of 50% or less of AMI for household size.
2. At least 40% of the units are occupied by tenants with an income of 60% or less of AMI.
3. At least 40% of the units are occupied by tenants with income averaging no more than 60% of AMI, and no units are occupied by tenants with income greater than 80% of AMI.
The gross rent test requires that rents do not exceed 30 percent of either 50% or 60% of AMI, depending upon the share of tax credit rental units in the project. All LIHTC projects must comply with the income and rent tests for 15 years or credits are recaptured. In addition, an extended compliance period (30 years in total) is generally imposed.
The FHA 221(d)(4) lending program guaranteed by the Federal Housing Administration (FHA), is the multifamily industry’s highest-leverage, lowest-cost, fixed-rate loan available for the development of multifamily housing. 221(d)(4) loans are fixed and fully amortizing for 40 years, not including an additional interest-only period of three years during construction. A 221(d)(4) loan can be used for the construction or substantial rehabilitation of detached, semi-detached, walkup, row, and elevator-type multifamily properties, including market-rate, low-to-moderate income, and subsidized multifamily, cooperative housing and affordable housing properties with at least five units. Commercial and retail space in mixed-use properties is limited to 25% of the net rentable area and 15% of underwritten effective gross income. Projects funded in this way are subject to numerous FHA requirements and fees and the Davis-Bacon prevailing wage for the locality, but the lower long-term interest rate associated with a federal guarantee more than compensates for the additional upfront costs.
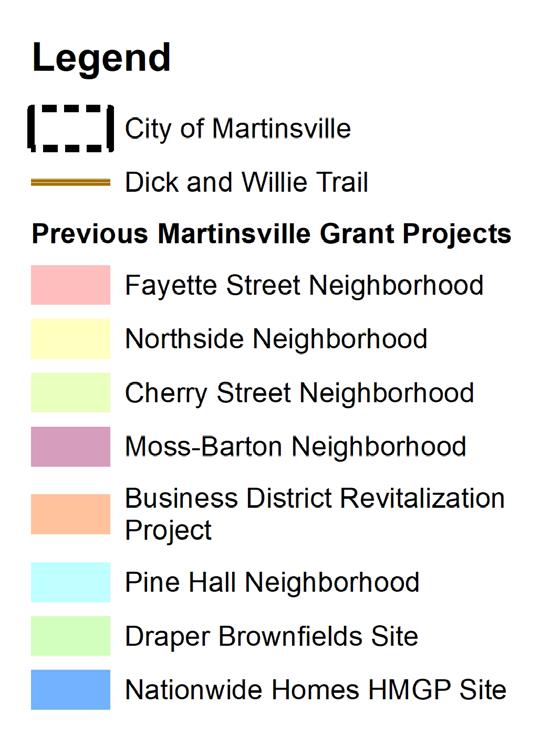
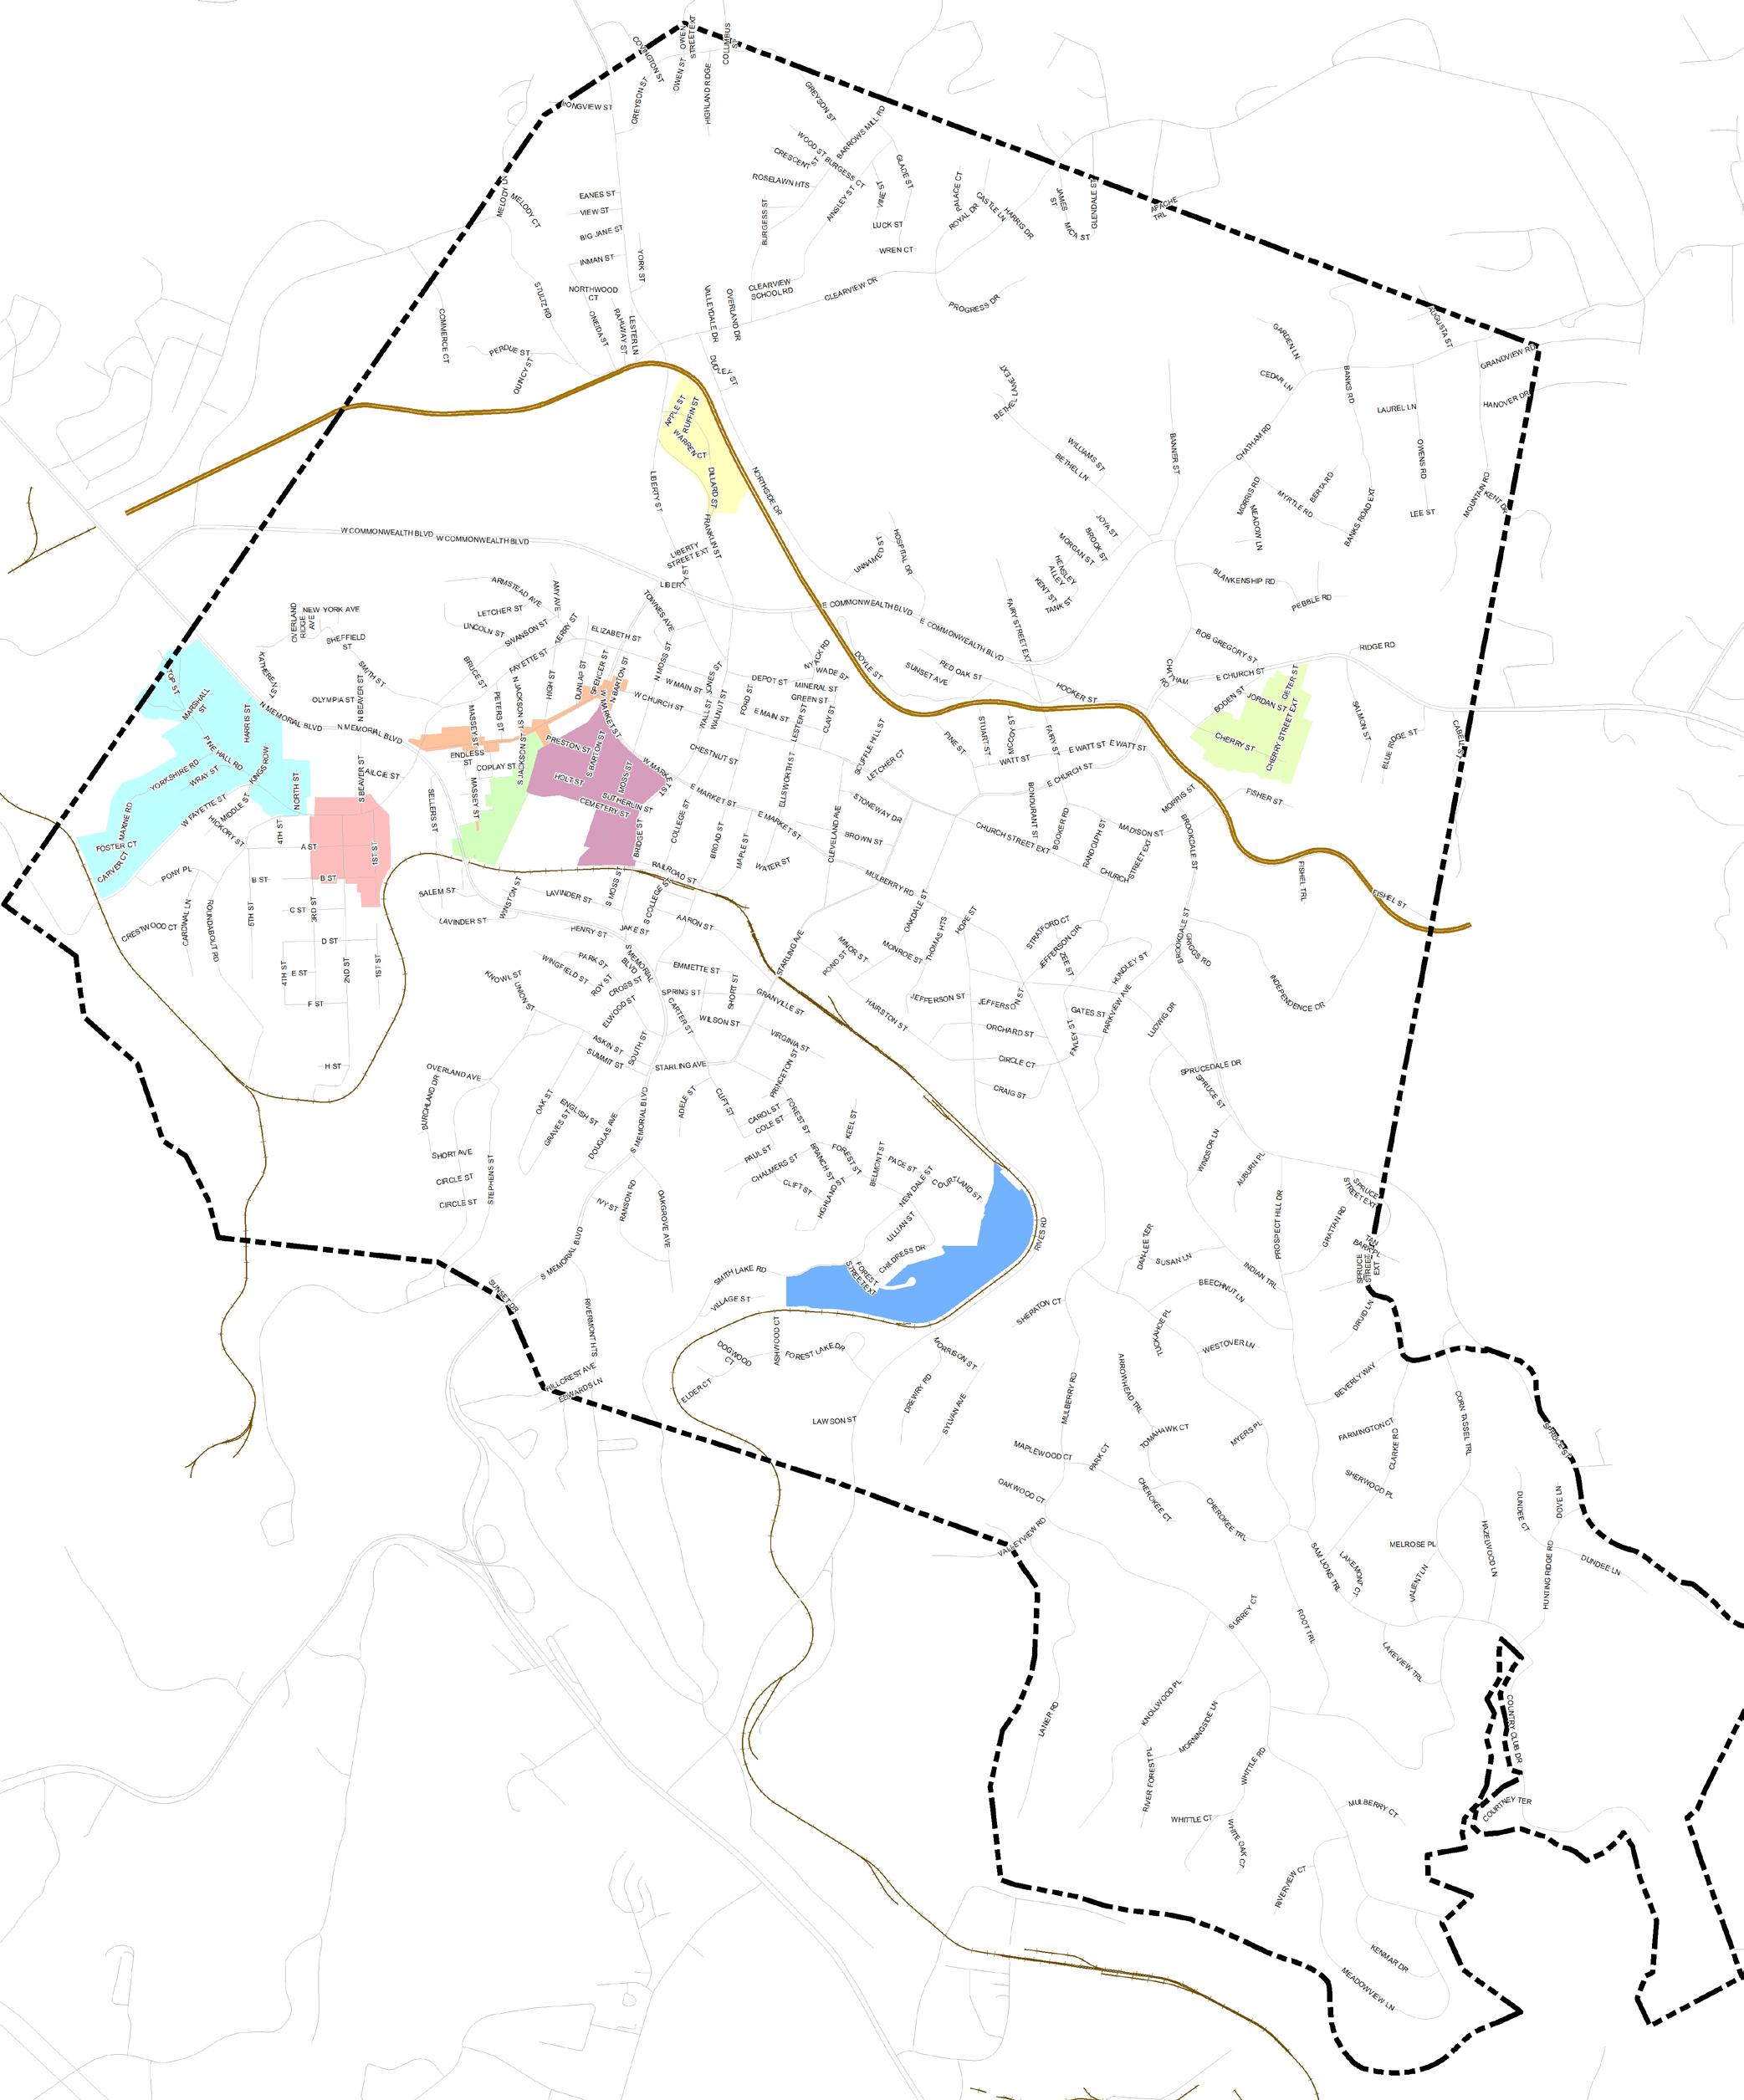
This map depicts previous grant projects within the City of Martinsville. Included in these are projects that utilized Community Development Block Grant (CDBG) funds as well as other funding sources. Most of these projects are located in the West End area.