

Published by the Deutsche Gesellschaft für Internationale Zusammenarbeit (GIZ) GmbH
Registered offices Bonn and Eschborn, Germany
B-5/2, Safdarjung Enclave
New Delhi-110029, India
T 011-49495353
F 011-49495391
E giz-indien@giz.de
As at June 2026, New Delhi
Prepared under Sustainable Urban Mobility – Air Quality, Climate Action and Accessibility (SUM-ACA)
Commissioned by Federal Ministry for Economic Cooperation and Development (BMZ), Germany
Political Partner
Ministry of Housing and Urban Affairs (MoHUA), Government of India
Implementation Partners
Department of Transport, Government of Kerala
Responsible
Manjunath Sekhar, Project Director, SUM-ACA
Project Coordinator
Shirish Mahendru, Technical Advisor, SUM-ACA
Project Team

GFA Consulting Group GmbH: Hendrik Jaschob,Project Backstopper;Zohra Mutabanna, Team Lead; Swapna Ann Wilson, Technical Expert; Ansila Mehaboob, Jr. Technical Expert
StudioPOD: Sarfaraz Momin; Rahul Dalal; S.Satish Chandran; Rafa Musadhik; Tejashree Karande
Design and Layout
StudioPOD
Photo and Map Credits
GIZ ;GFA; StudioPOD
Citation
GIZ (2026). Integrated Mobility Plan for Thiruvananthapuram. SUM-ACA. New Delhi, India.
Disclaimer
Any maps used in the document are for informational purposes only and do not constitute recognition of international boundaries or regions; GIZ makes no claims concerning the validity, accuracy or completeness of the maps nor assumes any liability resulting from the use of the information therein.
Copyright All rights reserved
On behalf of the German Federal Ministry for Economic Cooperation and Development (BMZ)
The preparation of the Integrated Mobility Plan (IMP) for Thiruvananthapuram has been a collaborative effort supported by multiple institutions and stakeholders. Deutsche Gesellschaft für Internationale Zusammenarbeit (GIZ) GmbH expresses its sincere appreciation to the Government of Kerala for their guidance, support and continued cooperation throughout the preparation of this report.
The support extended by Kerala State Road Transport Corporation (KSRTC) and other stakeholder agencies is also gratefully acknowledged for providing necessary data, technical inputs and institutional coordination. GIZ further acknowledges the contributions of key departments and agencies, including the Department of Transport, Department of Town and Country Planning and Thiruvananthapuram Smart City Mission Limited for their valuable inputs and engagement during the study.
The role of various stakeholder groups, technical experts, academic institutions, civil society organisations, resident associations, and mobility operators in facilitating consultations and supporting project prioritisation is also duly recognised. Their perspectives and recommendations have been instrumental in shaping a context responsive and people centric approach towards improving first and last-mile connectivity in Thiruvananthapuram. The participation of citizens during surveys, consultations, and stakeholder interactions is also sincerely acknowledged

Manjunath Sekhar
Project Director, SUM-ACA GIZ
Urban mobility plays a critical role in shaping economic efficiency, environmental sustainability, and overall quality of life in cities. Rapid urban growth, increasing private vehicle ownership, and fragmented transport systems have created mobility challenges across Thiruvananthapuram, requiring a coordinated and integrated planning approach.
The Integrated Mobility Plan (IMP) for Thiruvananthapuram provides a comprehensive and action-oriented roadmap for transforming the city’s transport system. It moves deliberately away from piecemeal interventions, bringing coherence to existing policies, ongoing initiatives, and future proposals alike, all anchored around the goals of inclusion, safety, and climate resilience. The IMP provides a unified roadmap that aligns infrastructure development, mobility services, policy direction, and institutional coordination to support sustainable urban mobility in the city.
Prepared under the Sustainable Urban Mobility – Air Quality, Climate Action and Accessibility (SUM-ACA) project, as part of the Indo-German Green Urban Mobility Partnership, the plan aligns with national priorities on sustainable urban transport and supports broader goals related to climate action, accessibility, and improved public health outcomes.
The preparation of the IMP has followed a structured and evidence-based approach involving mobility assessments, review of existing plans and policies, field observations, identification of system-level gaps, and extensive stakeholder consultations with relevant agencies and institutions. The plan builds upon the city’s strengths, including the Kerala State Road Transport Corporation (KSRTC) bus network, compact travel patterns, and emerging transit corridors, while addressing challenges related to pedestrian infrastructure, public transport accessibility, feeder services, multimodal integration, and institutional coordination.
The plan follows a clear result-driven approach, translating mobility challenges into prioritised interventions across immediate, short-term, and long-term horizons. As a dynamic planning tool, the IMP supports coordinated implementation and continuous improvement, providing a roadmap towards a more liveable, equitable, resilient, and people centred mobility future for Thiruvananthapuram.
“
Envisioning
as a capital city with integrated, accessible, and sustainable mobility systems that strengthen multimodal connectivity, enhance public transport, and create safer streets for all
.”
This report has been developed as part of the Sustainable Urban Mobility – Academic Collaboration (SUM-ACA) program, a knowledge initiative supported by GIZ (German Development Cooperation), in partnership with academic and technical institutions across India. In Thiruvananthapuram, the study was led by StudioPOD, with the objective of improving public transport usage through focused interventions in Multimodal Integration (MMI). The report presents a strategy to reimagine public mobility by enhancing accessibility, user experience, and last-mile connectivity—ultimately aiming to increase the share of public transport in the city.
The aim of this study is to support the Kerala State Road Transport Corporation (KSRTC) in increasing the share of public transport in Thiruvananthapuram by improving first and last mile connectivity to its bus services. The study recognizes that accessibility is a key determinant of public transport ridership and focuses on improving Non-Motorised Transport (NMT) and Intermediate Public Transport (IPT) access to KSRTC bus stops across different city zones.
The specific objectives are:
• To assess the current state of accessibility to bus stops by pedestrians and IPT across four CMP-defined zones—core, immediate, medium, and low proximity
• To identify key bus stops requiring intervention based on ridership data, pedestrian conflicts, and infrastructure conditions.
• To develop a holistic Multimodal Integration (MMI) framework covering physical, operational, fare, institutional, and information-level integration.
• To propose contextual interventions that improve safety, convenience, and equity in access to public transport.
• To demonstrate these interventions through a pilot project at Palayam bus stop, establishing a replicable model for the rest of the city.
India’s national mobility agenda emphasizes moving people over vehicles, promoting sustainable, inclusive, and equitable urban transport. Key policy directives advocate integrating public transport planning into city development, encouraging walking and cycling, deploying intelligent transport systems, and improving coordination across institutions. Despite this, limited investment in bus systems, last-mile access, and non-motorised infrastructure has resulted in a growing dependence on private vehicles—leading to increased congestion, pollution, and safety risks.
Public bus services in Indian cities face significant challenges, particularly inadequate fleet sizes. To meet national service benchmarks by 2029, over 1.5 lakh buses are required, demanding large-scale investment and fleet expansion. Without bridging these gaps, reliance on private transport will continue to grow. In 2020, only 39% of India’s urban population had convenient access to public transport, defined as living within 500 metres of a stop, highlighting the need to improve access and coverage. This is critical for enabling equitable mobility and ensuring sustainable urban development.

Thiruvananthapuram aims to transition toward a more sustainable and inclusive urban mobility system by 2030, addressing rising congestion, pollution, and mobility inequity caused by heavy private vehicle reliance. Despite having an extensive bus and rail network, limited last-mile connectivity and lack of modal integration have hindered public transport usage. The city now envisions a people-centric, environmentally responsible system with targeted goals of increasing bus-based transport to 30%, walking and cycling to 25%, and IPT to 15%, supported by strong multimodal integration and improved commuter experience.
Thiruvananthapuram, the capital of Kerala, is a rapidly growing urban centre with a population of approximately 1.68 million (urban agglomeration, Census 2011). The city has witnessed significant development over the last decade, particularly in the IT, healthcare, education, public administration, and tourism sectors. Major employment hubs such as Technopark, public sector offices, and key educational institutions are distributed across the city and its suburbs, shaping travel demand and influencing mobility patterns. The city core serves as the primary administrative and commercial district, while new growth nodes have emerged along key transport corridors like NH-66.
Administratively, the Thiruvananthapuram Urban Agglomeration is composed of the Thiruvananthapuram Municipal Corporation (TMC), three municipalities (Attingal, Nedumangad, Neyyattinkara), and 20 adjoining panchayats. While the Comprehensive Mobility Plan (CMP) focuses on a selected boundary, this study considers the entire urban agglomeration area to reflect the operational extent of the KSRTC bus network.
The city’s key growth areas include Central Business Districts (CBDs) like Palayam and East Fort, secondary centres such as Karamana and Kesavadasapuram, and emerging peripheral districts like Kazhakkoottam and Vizhinjam. Major healthcare institutions and education hubs generate significant daily commuter traffic, especially on weekdays. The CMP identifies these areas as suitable for transit-oriented development (TOD), recommending mass transit corridors with Multimodal Interchange (MMI) facilities to better connect various transport modes.
To assess access to public transport, the study divides the city into four zones, core, immediate, medium, and low proximity, based on existing bus network coverage. This zone-based approach enables targeted recommendations for improving connectivity, especially to underserved areas.
1. Imbalanced bus service frequency: While core city areas have high-frequency services (e.g., City Circular), peripheral zones face long headways, making public transport unreliable.
2. Underperforming IPT system: Auto-rickshaws and shared vans are expensive and largely unregulated, especially in outer areas, leading to inconsistent service quality and limited affordability.
3. Lack of integration between bus and IPT: Absence of structured interchanges and coordination between modes leads to disjointed journeys, particularly for first- and last-mile connectivity.
4. Overreliance on KSRTC: Minimal private sector participation and limited innovation reduce flexibility and responsiveness of the bus system to commuter needs.
1. Rapid growth in vehicle ownership: Over 10 lakh registered vehicles with a 6.4% annual growth rate, placing immense pressure on the city’s road infrastructure.
2. Dominance of two-wheelers: Motorised two-wheelers form most of the private transport, worsening congestion and pollution while contributing to road safety concerns.
3. Pedestrian-vehicle conflict: Poor pedestrian infrastructure results in unsafe walking conditions and frequent conflicts between motorised vehicles and vulnerable road users.
1. Low share of sustainable modes: Despite a compact urban form, only 21% of trips are made by bus, 8% by IPT, and 16% by walking and cycling.
2. Poor pedestrian infrastructure: Only 14.2% of roads have footpaths; of those, just 5% meet the minimum width requirement, forcing pedestrians onto carriageways.
3. Inadequate footpath design: Most sidewalks are below 1.5m width, and only 4.2% of streets meet the MoHUA-recommended width of 2.5m for walkability.
4. Weak last-mile connectivity: Lack of seamless transitions between modes discourages use of public transport, especially in non-core areas.
1. Multiple agencies with overlapping roles: Transport, planning, enforcement, and infrastructure responsibilities are split across KSRTC, TMC, PWD, RTO, Smart City Ltd., Traffic Police, and others.
2. Lack of unified governance: Absence of an integrated institutional framework delays decision-making and hinders coordination of multimodal planning and investment.
3. Limited data-sharing and joint planning: Agencies often work in silos without real-time coordination or shared mobility strategies.
Thiruvananthapuram has a strong foundation for transitioning toward a more sustainable and integrated urban mobility system. With an extensive KSRTC bus network, suburban rail connectivity, and travel patterns that favour short, regular trips, the city is well-suited to encourage a shift away from private vehicle use. National mobility policies and ongoing local pilots, such as the City Circular Service, further reinforce the potential for scalable, people-centric transport Thiruvananthapuram has a strong foundation for transitioning toward a more sustainable and integrated urban mobility system. With an extensive KSRTC bus network, suburban rail connectivity, and travel patterns that favour short, regular trips, the city is well-suited to encourage a shift away from private vehicle use. National mobility policies and ongoing local pilots, such as the City Circular Service, further reinforce the potential for scalable, people-centric transport solutions. Rather than expanding fleet size, the emphasis must be on improving service quality, connectivity, and commuter experience to increase public transport usage.
• Successful City Circular Service: The KSRTC-run circular bus system with 13 routes and 1,000+ stops have achieved ridership growth from 3,000 to over 34,000 daily commuters, showing potential for scale as a feeder and primary service model.
• Favourable Trip Patterns: Most trips within the city are short and routine—ideal for sustainable modes such as buses, walking, cycling, and IPT, making a modal shift more achievable with the right infrastructure and service model.
• Higher Bus Availability per Capita: With one bus per 1,617 people, Thiruvananthapuram has more buses per capita than Kochi and Coimbatore, suggesting that the current challenge is not fleet size but mode share and service effectiveness.
• Growing Digital and Service Innovations: Integration of route colour-coding, real-time tracking, interchange points, and digital ticketing with services like the City Circular can be replicated across the network to enhance user experience.
• Potential to Optimise Existing Infrastructure: Given the underutilisation of existing buses, improvements in service frequency, coverage in peripheral areas, and route rationalisation can maximise current assets without major capital expenditure.
Despite having a stronger bus fleet per capita than cities like Kochi and Coimbatore, Thiruvananthapuram continues to witness a low public transport mode share (less than 21%). This indicates that the challenge lies not in infrastructure availability, but in its utilisation and integration. To address this, two critical gaps and a set of strategic interventions have been identified:
Primary Gaps Identified:
• Underutilised Bus Fleet: Though the city has expanded its KSRTC bus network, poor route planning and mismatched service frequencies—especially in peripheral areas—have resulted in inefficient operations.
• Lack of Mode Integration: Informal shared services like autos and jeeps play a key role in low-density zones but remain disconnected from the formal bus and rail systems. Bridging this gap is essential for seamless travel.
The present report seeks to address multimodal Integration in detail in subsequent chapters, outlining strategies to harmonize services and enhance connectivity across modes.
Multimodal Integration (MMI) is key to making public transport in Thiruvananthapuram more efficient, accessible, and user-friendly. By ensuring smooth transitions between buses, autos, walking, and other modes, MMI encourages more people to shift away from private vehicles. Commuters tend to choose transport options based on convenience, affordability, reliability, and safety. To meet these expectations, MMI focuses on three main areas:
1. Physical Integration: This includes upgrading bus stops with better seating, lighting, and real-time information, ensuring safe pedestrian access, and creating designated spaces for autos and e-rickshaws near major transit hubs for seamless last-mile connectivity.
2. Operational and Fare Integration: It proposes restructuring services into trunk, feeder, and circular routes to avoid overlaps, and introducing a single smart ticket system that works across all modes, reducing travel time and cost.
3. Institutional and Information Integration: Collaboration between transport agencies is essential to align services. Licensing and integrating IPT services like autos, along with providing real-time travel information through apps and signage, can significantly improve user experience.
• Optimized Resource Utilization: Collaboration between transport agencies, municipal bodies, and traffic authorities can help make better use of existing infrastructure. This ensures services work in synergy, avoids duplication, and improves overall network efficiency.
• Improved Service Coordination: Bringing together public transport, Intermediate Public Transport (IPT), and Non-Motorised Transport (NMT) through coordinated routes, schedules, and interchanges will reduce commuter delays and create smoother, more reliable journeys.
• Enhanced Financial Sustainability: Integrating operations across public and intermediate modes can streamline services, lower operating costs, and boost revenue by increasing ridership. Shared planning and governance will also reduce administrative burdens.
• Environmental Benefits: A well-connected, multimodal network encourages people to shift away from private vehicles. This reduces congestion, lowers emissions, and contributes to a cleaner, more liveable urban environment.
• Formalizing Intermediate Public Transport (IPT): IPT as structured feeder services through the Contract Carriage Model will ensure organized last-mile connectivity, minimize service overlaps with KSRTC, and create a seamless multimodal journey experience for commuters.
These recommendations offer pathway for Thiruvananthapuram to meet mobility goals without infrastructure expansion.
To identify high-impact nodes for Multimodal Integration (MMI), a 4-day recce of 61 bus stops across all four CMP-defined proximity zones was conducted. This assessment combined quantitative data (like ridership, demographic patterns, and modal overlap) with qualitative field observations (such as infrastructure gaps and transfer conditions). Special focus was given to areas with missing modal interchanges or where informal IPT services overlapped with formal bus routes, signaling potential for network optimization.
From this list, 7 final stops were selected based on:
• Zonal balance: Each selected stop represents a different CMP-defined zone to ensure city-wide coverage and context-sensitive solutions.
• High ridership and critical location: Stops with consistently high footfall were prioritized to maximize the reach and impact of proposed interventions.
• Opportunities for intermodal transfer (IPT, rail, intercity): Stops located near rail stations, intercity terminals, or key IPT nodes were chosen for their potential to enable seamless multimodal journeys.
• Institutional or employment density: Locations near hospitals, colleges, and office hubs were targeted due to their high and diverse commuter demand. Safety and infrastructure deficits: Stops with high passenger and pedestrian volumes, as well as significant pedestrian-vehicle conflict, but lacking shelters, signage, lighting, or safe access were flagged as urgent priorities for MMI upgrades.
Based on this, seven high-impact nodes were selected using criteria such as zonal balance, ridership, intermodal linkages, and infrastructure needs:
• Thampanoor: A critical city node adjoining the main railway station, with high footfall but fragmented modal transfers and inadequate pedestrian infrastructure.
• East Fort: The city’s central bus terminal, heavily congested yet lacking seamless integration across modes and pedestrian safety features.
• Palayam: A key civic and institutional junction with high pedestrian-vehicle conflict, requiring structured crossings and improved signage.
• Kochuveli: Located near the railway station and Lulu Mall, this stop has high latent potential but suffers from poor visibility, signage, and last-mile access.
• Medical College: Serving a dense institutional and residential catchment, this stops experiences intense daily ridership and overlapping IPT services, demanding integration and infrastructure. Connectivity across the safety upgrades.
• Kazhakkoottam: Near Technopark anda suburban railway station, this fast-growing IT hub has strong ridership but lacks structured IPT coordination and pedestrian infrastructure.
• Neyyattinkara: A regional transit hub in the metropolitan fringe with intercity and IPT linkages, currently under-equipped for safe and efficient multimodal transfers.
Each selected stop reflects a distinct urban context, ensuring that proposed MMI strategies are both scalable and responsive to local mobility needs.
Key Observations:
Thampanoor, a major multimodal node with both railway and bus connectivity, faces unsafe pedestrian movement and lacks shaded waiting areas and signage. Unregulated IPT operations add to congestion and hinder smooth transfers.
East Fort is a high-footfall terminal lacking safe pedestrian access, with an underused foot overbridge and no clear IPT zones. The area also lacks basic amenities such as shelters, seating, and lighting.
Key Observations: Located in a busy institutional and commercial area, Palayam suffers from broken footpaths, missing crossings, and no designated IPT stands. This leads to frequent pedestrian-vehicular conflict and commuter confusion.
Key Interventions: Continuous walkways, formal pedestrian crossings, and redesigned bus bays will improve safety. Introducing dedicated IPT zones will ease congestion and support efficient transfers.
Key Observations: Despite proximity to Kochuveli Railway Station and Lulu Mall, this stop lacks shelters, signage, and safe access from the highway. There’s no defined IPT or last-mile connection, limiting its transit potential.
Key Interventions: A formal bus stop with shelters, lighting, and seating will be created. Safe pedestrian connections and dedicated IPT zones will integrate the station, mall, and bus stop into a seamless hub.
Key Observations: This dense institutional area is served by both public and IPT services operating in silos, with poor walkability and no shelters or seating. Unregulated operations cause confusion and discomfort for diverse commuter groups.
Key Interventions: Improved pedestrian crossings and accessible footpaths will be introduced. Bus bays will be reorganised with shelters, and formal IPT stands will enhance last-mile connectivity.
Key Observations: Near Technopark and a major railway station, Kazhakkoottam lacks formal IPT stands, bus bays, and safe pedestrian safety upgrades.
Key Observations: Neyyatinkara functions as a regional transit node but lacks organised infrastructure, clear pedestrian routes, or IPT stands. Poor access and visibility contribute to inefficient transfers.
Key Interventions: The bus precinct will be restructured with safe crossings and walkways, along with shelters and seating. IPT and intercity bus integration will be strengthened to support growing commuter demand.
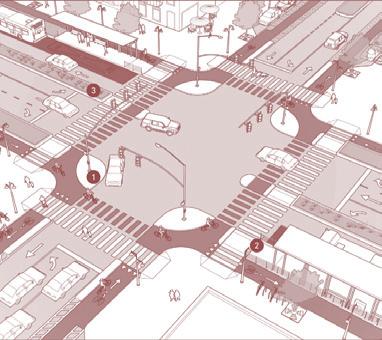
Intersection Design:
Implement intersections featuring safer pedestrian crossings and wider, more accessible footpaths to enhance pedestrian safety and movement.
Dedicated Transit Lanes:
Designate slow lanes specifically for buses and establish dedicated Intermediate Public Transport (IPT) stops close to bus stops to facilitate smoother transfers and better connectivity.
Bus Shelter Provisions:
Ensure that bus shelters are adequately sized to accommodate the volume of passengers, including sufficient seating and clear, informative signage to improve overall user experience.
KSRTC Trunk Route Implementation Strategy
Charging strategy for city circular routes
E-bus schedule optimization tool and depot management tool
GTFS Digitization for KSRTC routes
Gender Sensitisation and Behavioural Training for KSRTC crew
Non Fare Box Revenue Strategy
9.2 2.3
50,000
2745
55
BUS ROUTES KM potential GHG reduction from 2022 to 2030 reduction in energy consumption for E-bus charging increased daily digitized of operating-km increased daily
80 + + government officials trained on e-bus operations and decision-making
3000 % %
drivers and conductors trained

Abbreviation
Definition
CMP Comprehensive Mobility Plan
PT Public Transport
IPT Intermediate Public Transport
NMT Non-Motorised Transport
NATPAC National Transportation Planning and Research Centre
LOS Level of Service
KSRTC Kerala State Road Transport Corporation
TMC Thiruvananthapuram Municipal Corporation
MMI Multi – Modal Interchanges
MVD Motor Vehicle Department
Ministry of Urban Development, Government of India (MoUD) issued the National Urban Transport Policy (NUTP) in 2006, to bring about comprehensive improvements in urban transport services and infrastructure. The policy focus is on moving people rather than vehicles.
The objective of this policy is to plan for people rather than vehicles by providing sustainable, affordable, and accessible mobility options that connect citizens to employment, education, social services, and recreation within reasonable travel times. The policy outlines a range of strategic focus areas and interventions to achieve this vision. Within this framework, the Integrated Mobility Plan (IMP) primarily contributes to the policy’s objective through a focus on multimodal integration, improving connectivity between different transport modes, enhancing first- and last-mile access, and enabling seamless, efficient, and user-centric travel across the transport network. This will involve:
• Incorporating urban transportation as an important parameter at the urban planning stage rather than being a consequential requirement.
• Bringing about a more equitable allocation of road space with people, rather than vehicles, as its main focus.
• PT should be citywide, safe, seamless, user friendly, reliable and should provide good ambience with well-behaved drivers and conductors.
• Walk and cycle should become safe modes of UT.
• Introducing Intelligent Transport Systems for traffic management.
• Addressing concerns of road safety and trauma response.
The objective of this policy is to plan for the people rather than vehicles by providing sustainable mobility and accessibility to all citizens to jobs, education, social services and recreation at affordable cost and within reasonable time. This will involve:
• Incorporating urban transportation as an important parameter at the urban planning stage rather than being a consequential requirement.
• Bringing about a more equitable allocation of road space with people, rather than vehicles, as its main focus.
• PT should be citywide, safe, seamless, user friendly, reliable and should provide good ambience with well-behaved drivers and conductors.
• Walk and cycle should become safe modes of UT.
• Introducing Intelligent Transport Systems for traffic management.
• Addressing concerns of road safety and trauma response.
• Raising finances, through innovative mechanisms.
• Establishing institutional mechanisms for enhanced coordination in the planning and management of transport systems.
• Building capacity (institutional and manpower) to plan for sustainable urban transport and establishing knowledge management system that would service the needs of all urban transport professionals, such as planners, researchers, teachers, students, etc.
The lack of adequate investment in public transport (PT) infrastructure, last-mile connectivity, and non-motorized transport (NMT) systems has led to a significant rise in the reliance on private vehicles. This trend has not only exacerbated urban congestion but has also contributed to increased pollution levels and considerable socio-economic losses.
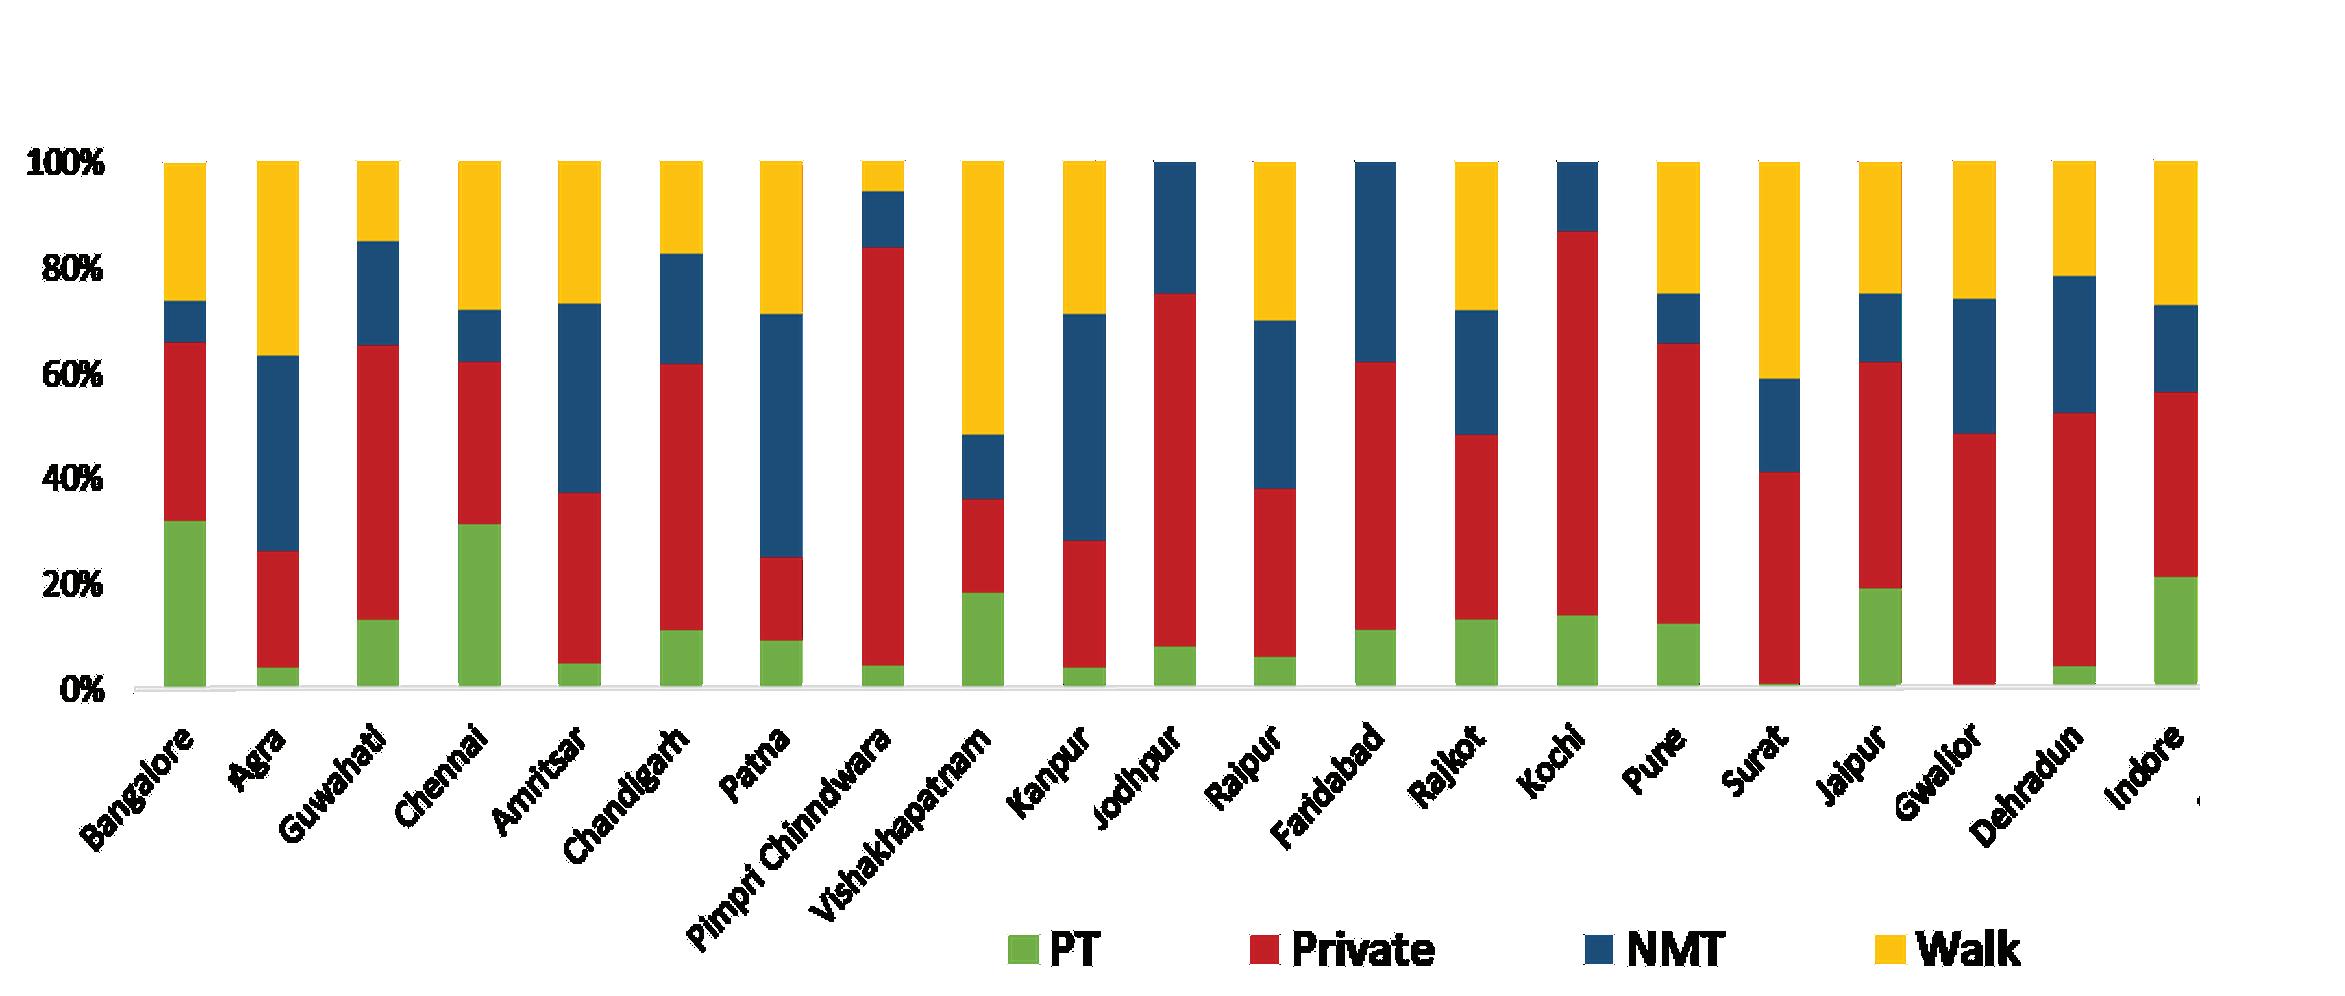
Classification of City by Population
Existing Buses (Orgamised City Bus Service)
Deficit of Buses (estimated)
Fig. 3. Current gaps in bus system Data
Source: Gap Estimated as per SLB, MoHUA, 2013
According to the State Transport Undertakings (STUs) Profile and Performance study for the years 2019-2020, there is a pressing need to enhance the bus fleet across cities with populations exceeding 3 lakhs to meet the Service Level Benchmark (SLB) standards, particularly Level of Service 1 (LOS-1). By 2029, the estimated requirement is approximately 1,54,850 buses to adequately serve these urban areas.
To achieve this target, it is projected that around 1,23,800 new buses need to be inducted into the fleet. This figure includes both the introduction of new buses and the replacement of outdated and inefficient ones. The financial implications of this expansion are significant. To operate and maintain a fleet of 1,54,850 buses by 2029, an estimated annual investment of ₹79,500 Crore will be required.
This substantial investment underscores the critical financial gaps that need to be addressed to ensure that public transport systems are not only expanded but also maintained at a level that meets the growing demands of urban populations. Failure to secure this funding could result in continued reliance on private vehicles, exacerbating issues such as traffic congestion, pollution, and economic inefficiencies.
Fig. 4. Percentage of urban population with accessible public transport
Source: United Nations; Clean Bus Report, 2022, European Commission
In 2020, only 39% of India’s urban population had what is commonly defined as “convenient access” to public transport, highlighting a significant gap in the reach and inclusivity of urban mobility systems. International frameworks, including those used by the United Nations and the World Bank, typically assess access to public transport based on the proportion of the population living within a reasonable walking distance of a transit stop, often benchmarked at 500 metres for urban areas. This indicator reflects not only the availability of public transport services but also their accessibility, which is a key determinant of sustainable and equitable urban mobility.
Thiruvananthapuram is at a crucial juncture in shaping a more sustainable and inclusive urban future. Rising urbanisation and private vehicle ownership have placed significant stress on the city’s transport network, resulting in congestion, pollution, safety concerns, and unequal access. Although the city benefits from an extensive bus and rail network, the lack of seamless integration between transport modes has contributed to a decline in public transport usage.
Most city routes are well-connected and ideal for sustainable travel modes such as buses, shared autos, walking, and cycling. However, weak last-mile connectivity, poor pedestrian infrastructure, and the absence of efficient interchanges often make private vehicles the more convenient option. This has led to inefficiencies, increased emissions, and mobility inequity, especially for those without access to personal transport.
To address this, Thiruvananthapuram envisions a people-centric and environmentally responsible public transport system that emphasises accessibility, affordability, and equity. The city aims to shift from its current 55% private vehicle usage to a more balanced modal share by 2030—targeting 30% bus-based transport, 25% walking and cycling, and 15% IPT. Achieving this will require strong multimodal integration, improved last-mile connectivity, and a reliable, commuter-friendly system that encourages residents to choose public transport over private modes.
Thiruvananthapuram, often referred to as Thiruvananthapuram, is the capital city of the Indian state of Kerala and is situated on the southwest coast of India. Thiruvananthapuram is one of the most densely populated cities in Kerala, with a diverse population of 957,730 and the larger urban agglomeration population of around 1.68 million as per the 2011 census. Since 2011, the city has witnessed significant urban development driven by the growth in several sectors of its economy including:
1. Information Technology (IT) and Software Services: Thiruvananthapuram has emerged as a significant IT hub in India, with the Technopark and Info Park being the primary IT parks in the city. These parks host numerous IT companies, ranging from startups to multinational corporations, providing employment opportunities in software development, IT services, and related fields.
2. Healthcare Services: Thiruvananthapuram is a hub for healthcare services in Kerala, with numerous hospitals, clinics, and medical research institutions providing employment opportunities for healthcare professionals.
3. Tourism and Hospitality: Thiruvananthapuram’s rich cultural heritage, along with its proximity to popular tourist destinations in Kerala, makes tourism a vital industry. The city attracts domestic and international tourists, creating employment opportunities in hotels, resorts, travel agencies, and related services.
4. Public Sector: Being the capital city of Kerala, Thiruvananthapuram, houses many of the state government’s administrative offices which provide large number of employment opportunities.
5. Education and Research Institutions: The city is home to several prestigious educational and research institutions, including the University of Kerala, Indian Institute of Space Science and Technology (IIST), Indian Institute of Science Education and Research (IISER), and various colleges and universities. These institutions contribute significantly to job creation in the education and research sectors.
6. Manufacturing: While not as dominant as in some other cities, Thiruvananthapuram has a presence in manufacturing, including industries such as rubber, textiles, handicrafts, and food processing.
As per the Thiruvananthapuram Master Plan, 47 % of the city’s land use is residential followed by public & semi-public land uses and educational which constitutes 8.5% of land area. Commercial and mixed-use area covers an area of 3.7% which is primarily located in the city centre. Over the last few decades, the urban development has taken place predominantly along major transport corridors to the east and south of the city centre.
The Comprehensive Mobility Plan (CMP) for its planning has considered an area that comprises of the entire TMC area, Neyyattinkara municipality and few panchayats. As the KSRTC bus network extends beyond the CMP study boundary, this study has considered the entire urban agglomeration area as the study area.
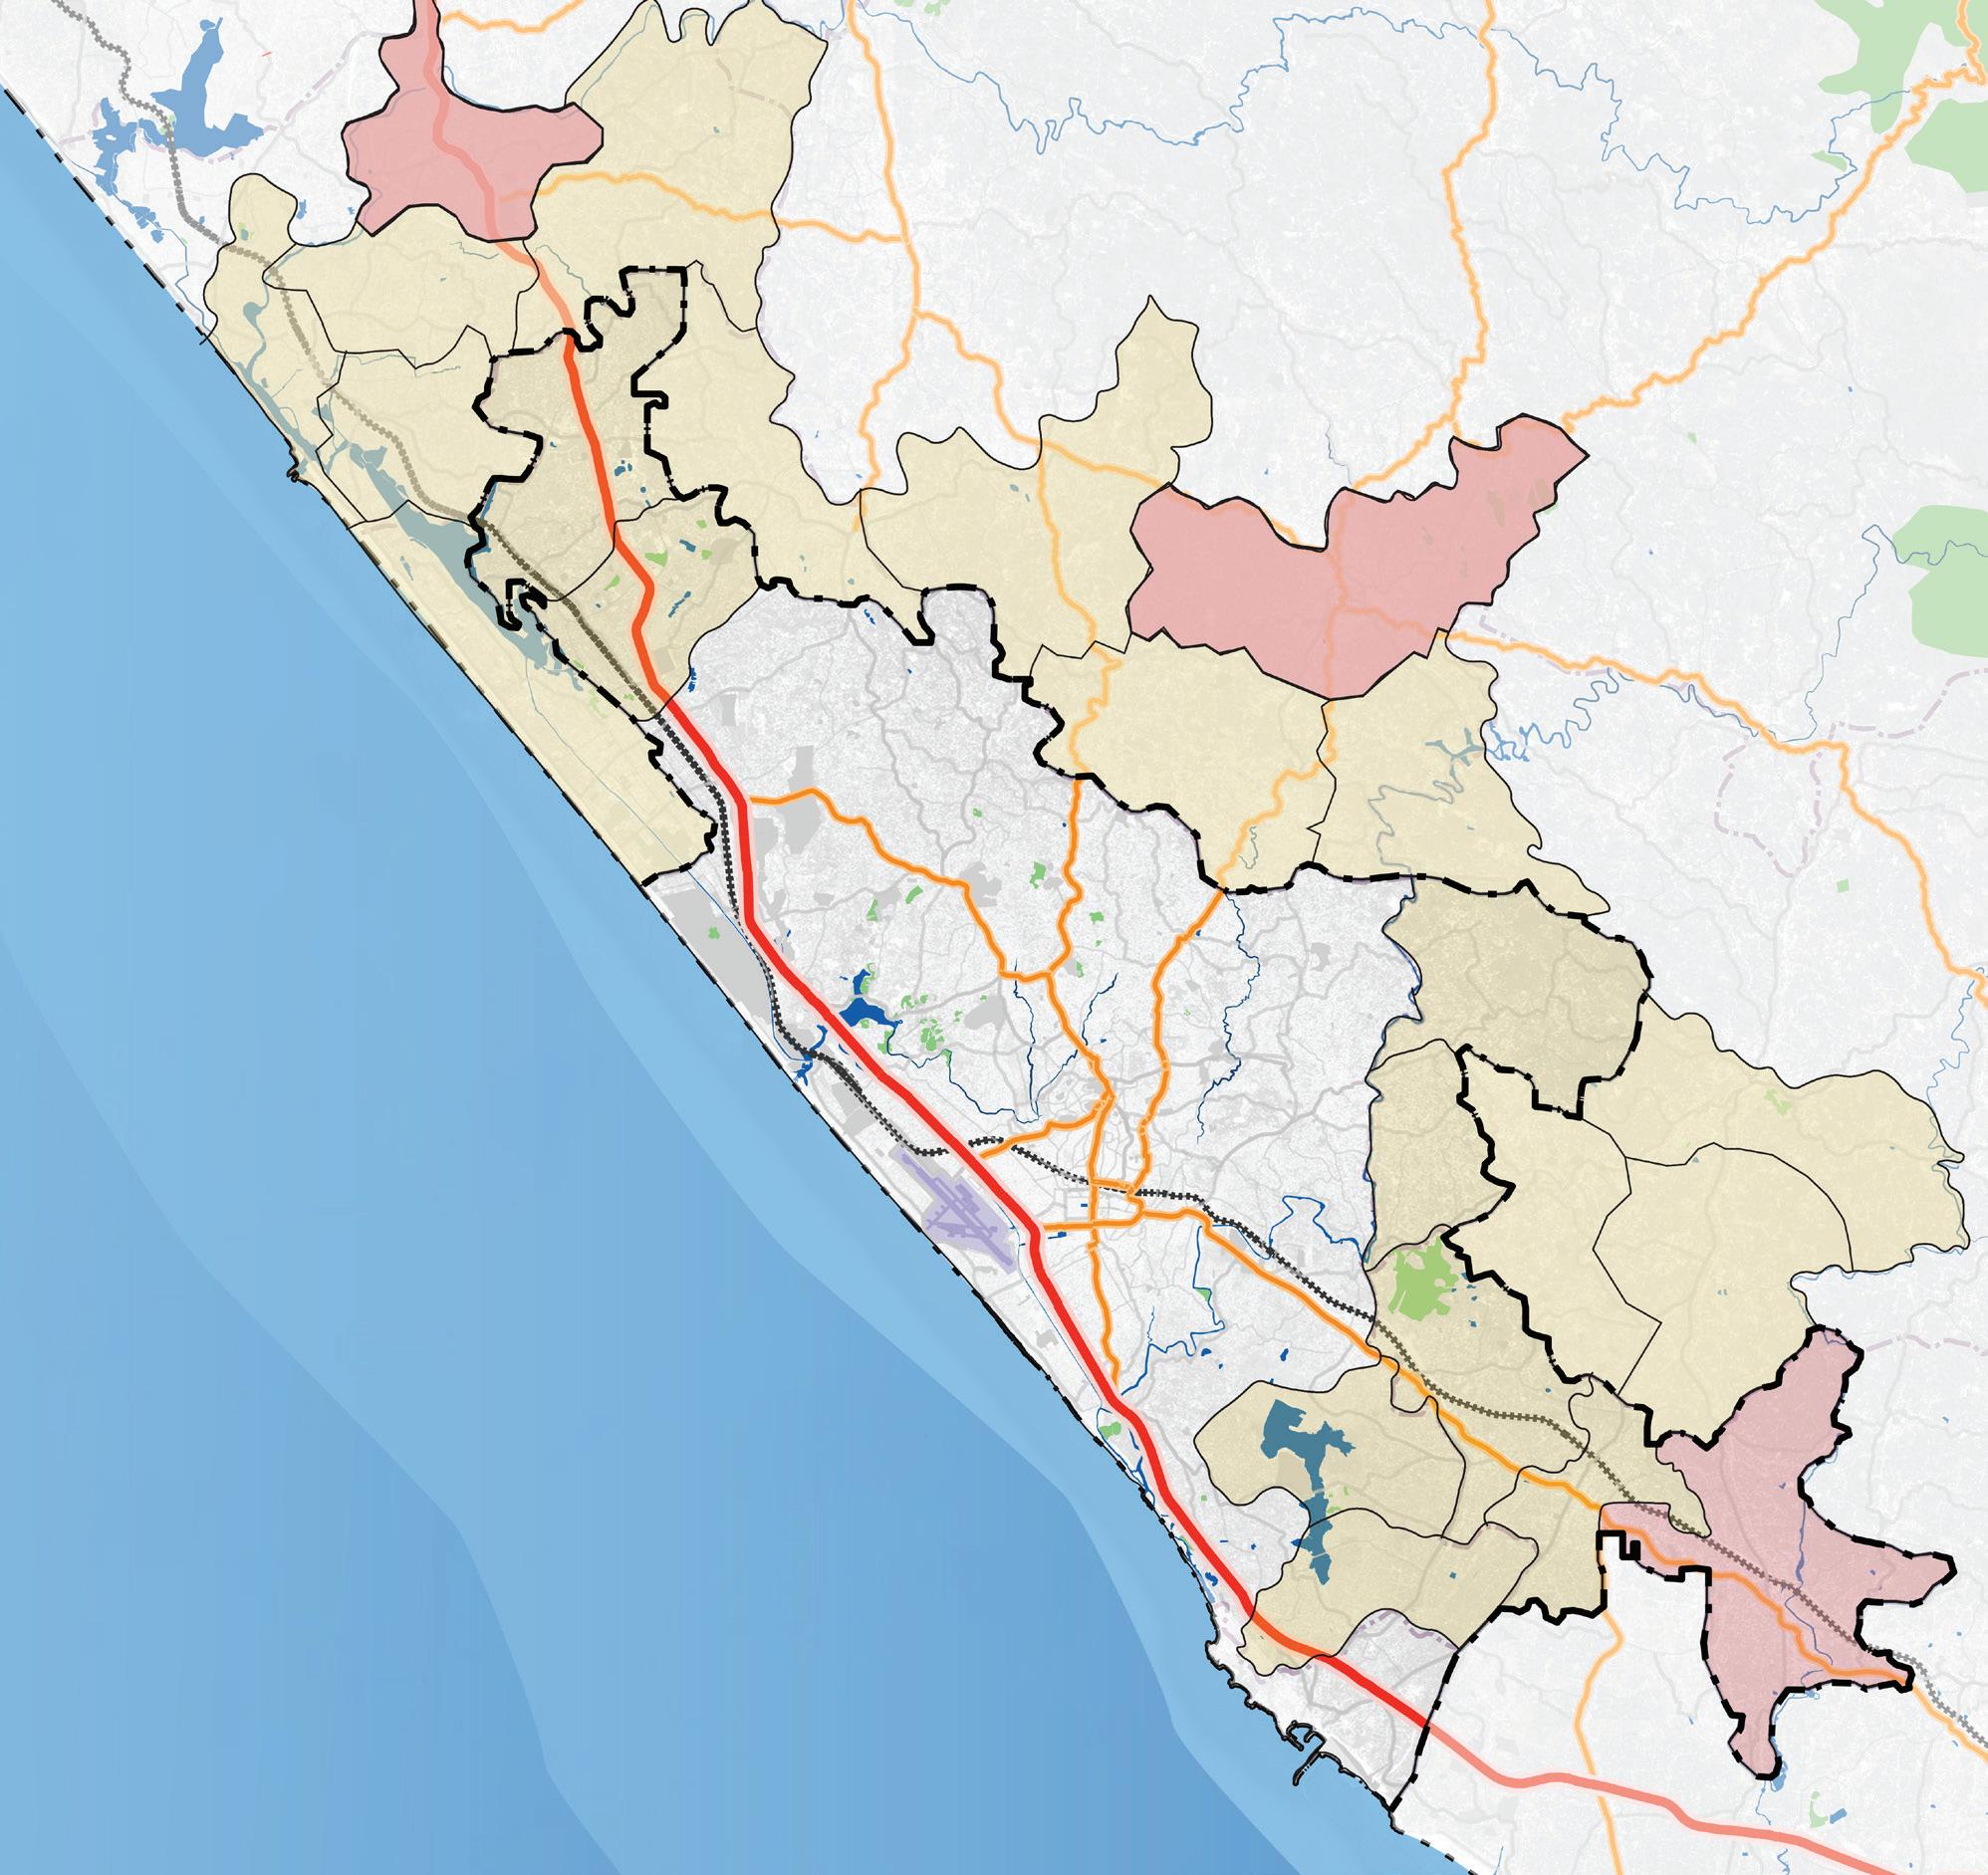
TVM Corporation

Local Municipality Panchayats
CMP Study Area
Table. 1. Administrative zones (CMP draft Report 2023 and draft Master plan 2024) Thiruvananthapuram Municipal Corporation Panchayats
Mangalapuram Andoorkonam Vilavoorkal Balaramapuram Kalliyoor
Pallichal Venganoor Pothencode Mudakkal Mangalapuram
Vembayam Karakulam Aruvikkara Kizhuvilam Chirayinkeezhu
Malayinkeezhu Kattakada Maranalloor Kadinamkulam Vilappil Municipality
Attingal Nedumangad Neyyattinkara
The Thiruvananthapuram urban agglomeration is divided under three distinct administrative zones:
• Thiruvananthapuram Municipal Corporation (TMC): Covers the primary city area including the city core and major commercial areas.
• Local Municipalities: The satellite towns of Attingal, Nedumangad and Neyyattinkara have their own municipal corporations.
• Panchayats: Beyond the TMC limits there are 20 panchayats that fall within the Thiruvananthapuram urban agglomeration
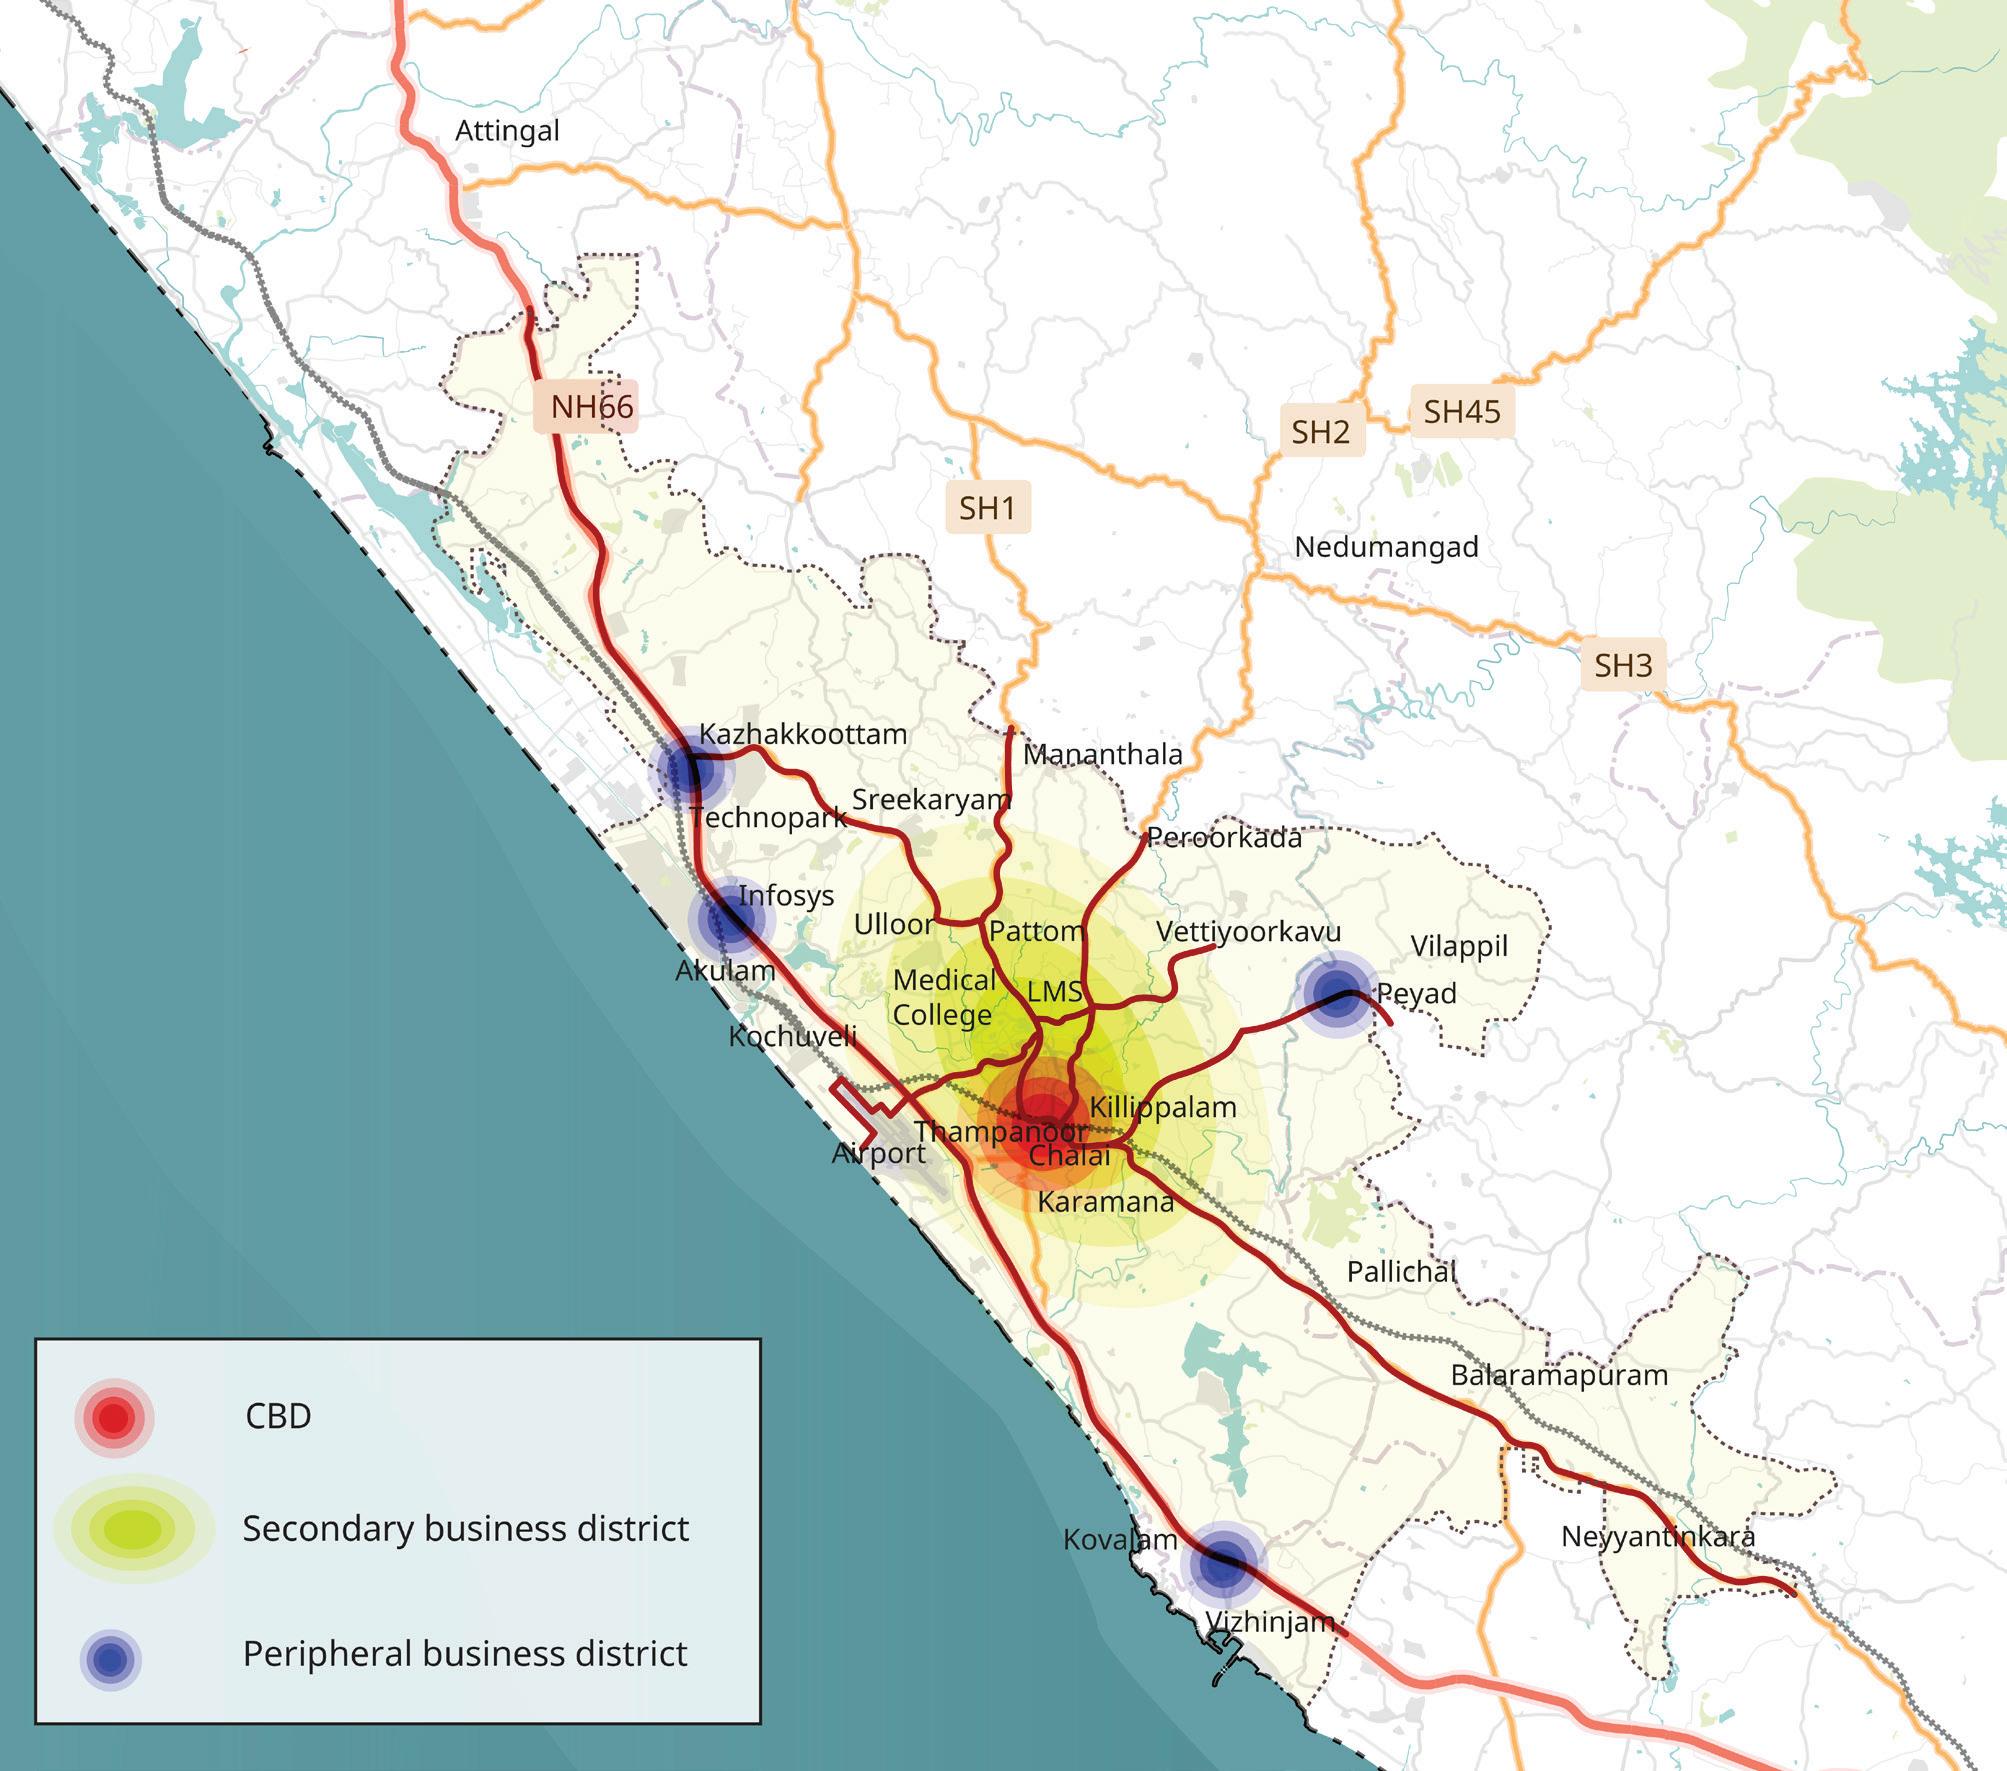
The city core which houses majority of the state administrative buildings is the commercial centre of the city and is the primary destination for work and recreational trips. The Technopark which is where several of the IT campuses are located is situated to the north-west of the city centre abutting the NH-66 corridor that passes through the city.
The University of Kerala is located at Palayam in the city centre area and the many professional colleges including 15 engineering colleges, 3 medical colleges, 3 Ayurveda colleges, 2 Homeopathy colleges, 6 para medical colleges, and 2 law colleges are distributed across the city and its suburbs. These institutions a significant number of public and intermediate para transit trips especially on weekdays.
Thiruvananthapuram Medical College Hospital, General Hospital and Eye Hospital are the major public medical institutions. The Medical College hospital bus stop located to the north-west of the city centre is an extremely busy and important bus
and IPT stop that serves many people from across Thiruvananthapuram and the state. The city also region accommodates several well reputed private hospitals like SUT Hospital, Ananthapuri Hospital, KIMS Hospital, Al Arif Hospital, Chaithanya Eye Hospital, and many medical research institutions.
Major mobility corridors are identified based on high density and land use, to provide effective integration between transport and land use in the entire region. These growth corridors and nodes are recommended to provide high quality highway access suitable for industry, logistic infrastructure, educational and skill development institutions, business facilities, residential and other support social infrastructure.
Major Economic Activity Generation Zones are identified in the study area, Central Business Districts, Secondary Business Districts and Peripheral Business Districts.
The central business district houses the Palayam, East Fort, Chalai, Thycaud and so. The secondary business centres house areas such as Kesavadasapuram, Kara-
mana, MC area, etc. and the peripheral business centres which are recent and upcoming business centres include Kazhakoottam, Peyad, Pappanamcode, Aakulam, Vizhinjam and so on.
Mass transit system with Multi – Modal Interchange (MMI) facilities are recommended by CMP report for easing out the transfers across various transit modes.
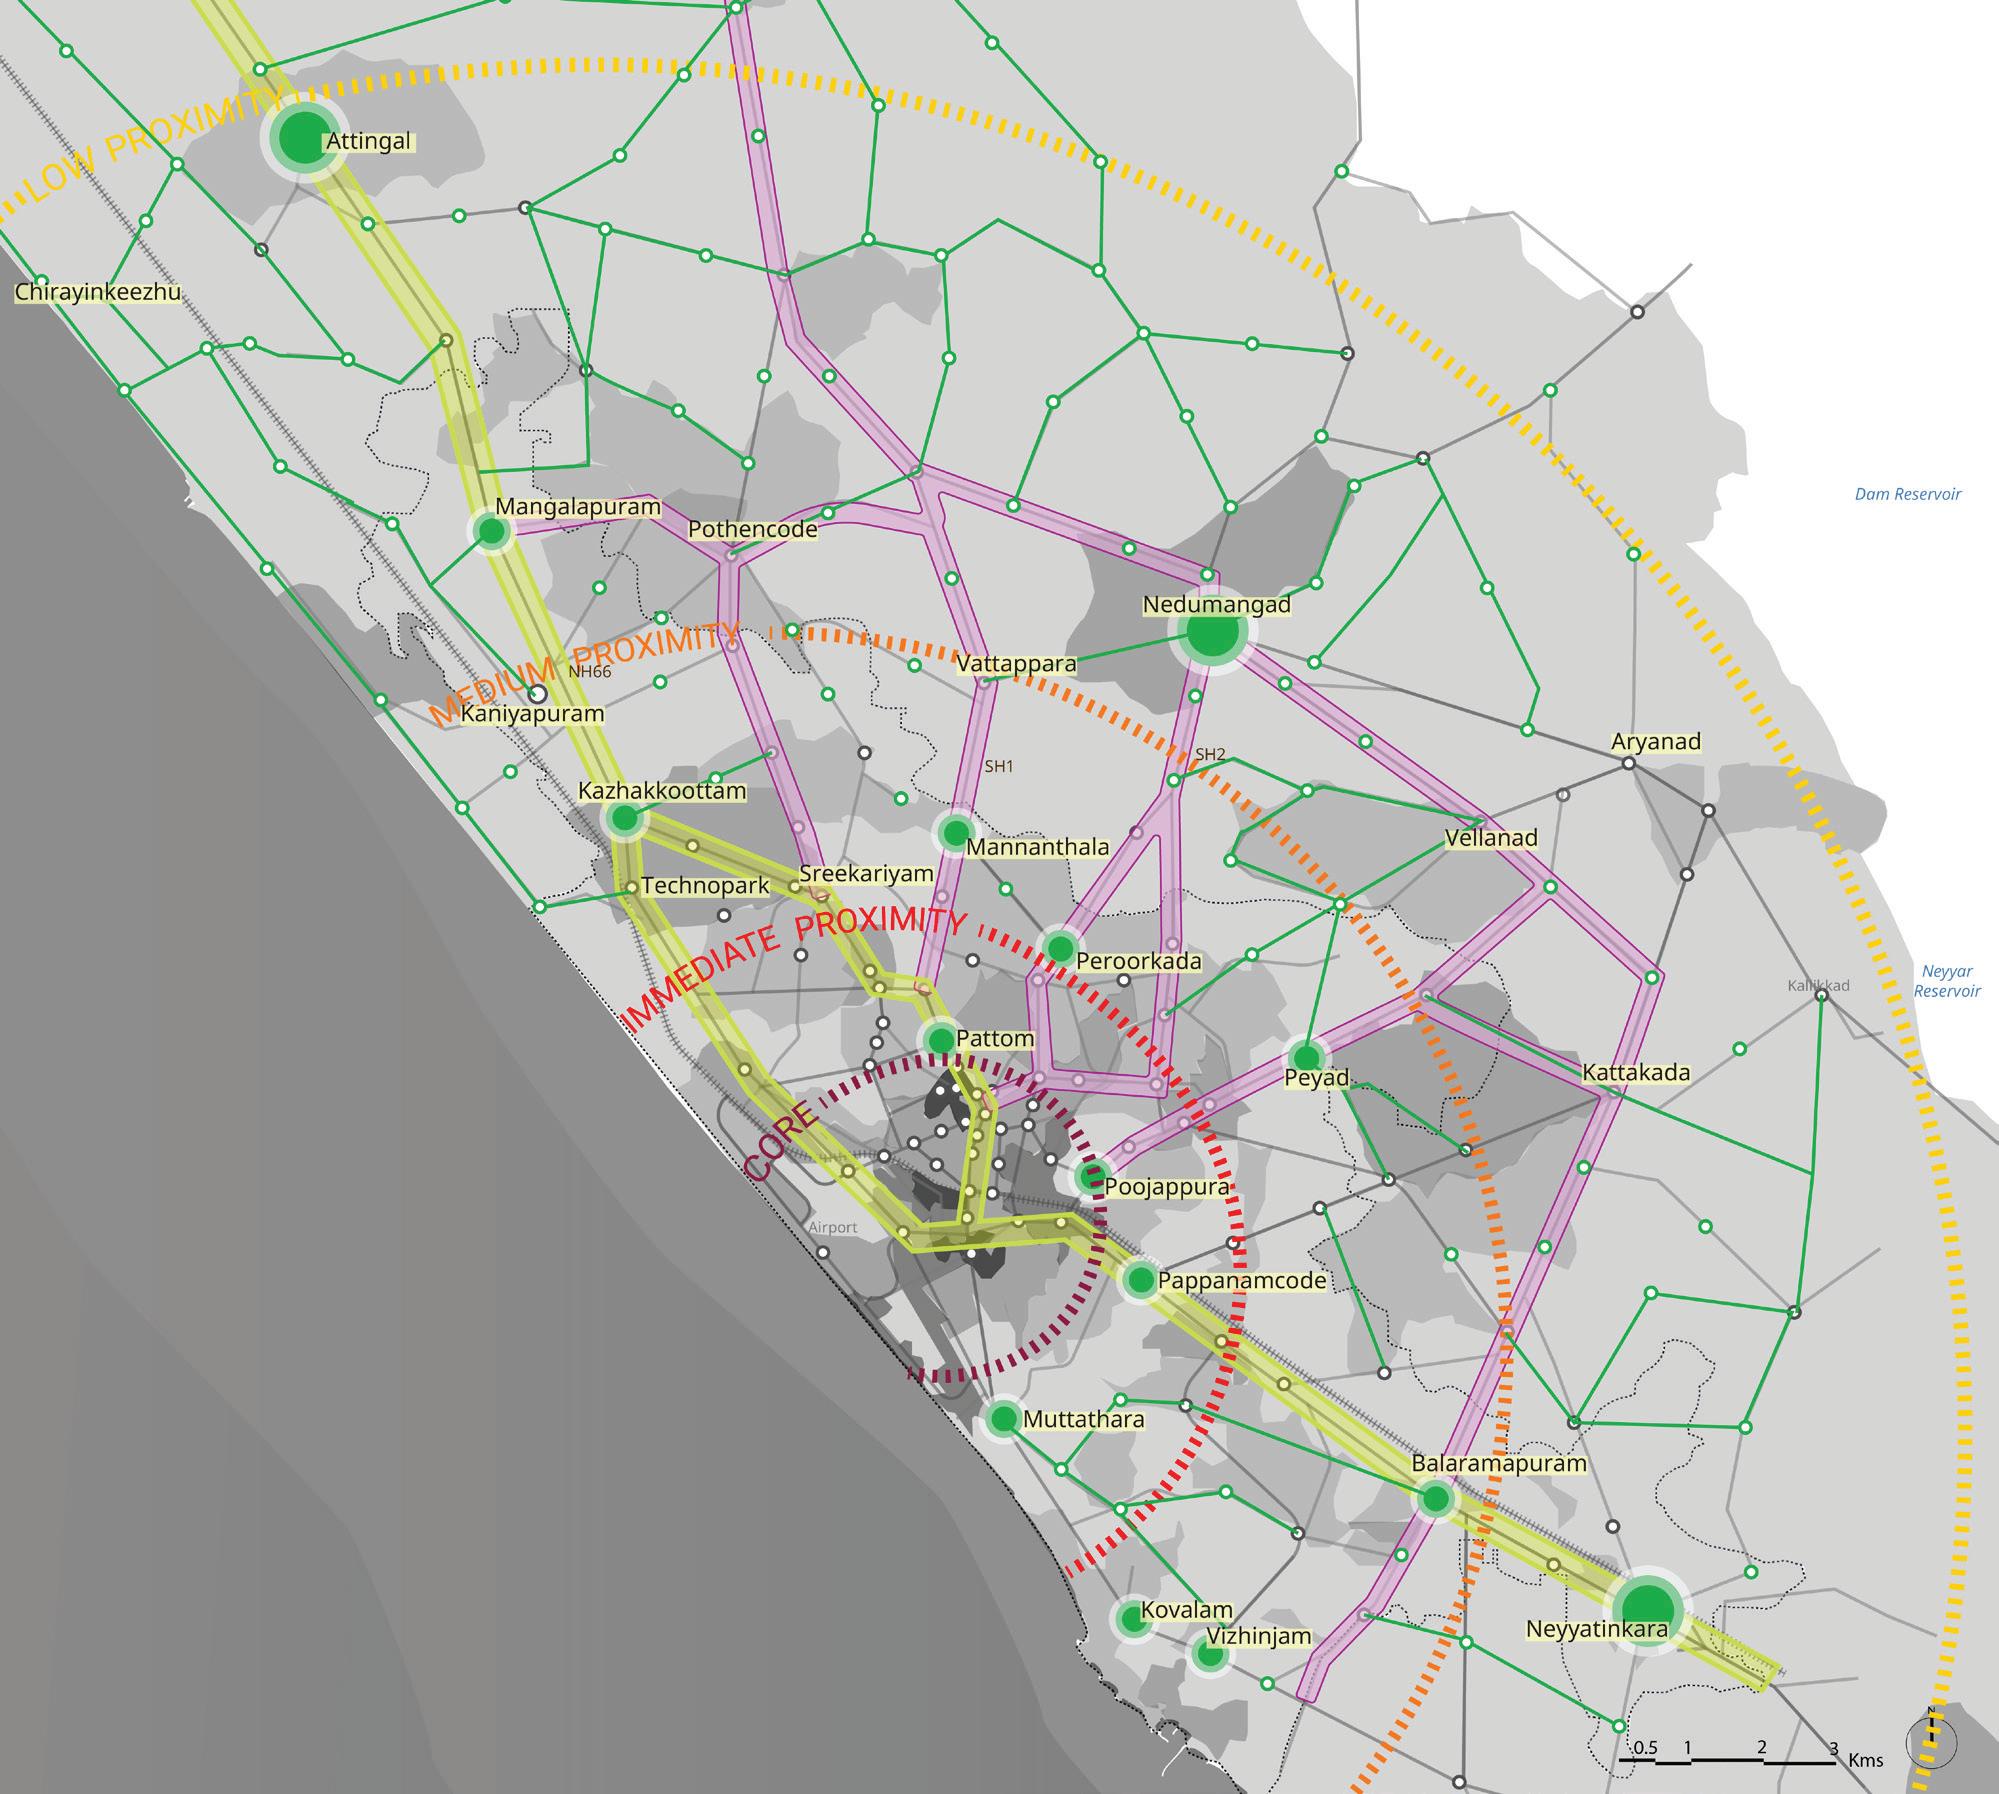
CMP 2023 proposals
TOD corridor
Growth Corridor
Proposed sub-centers
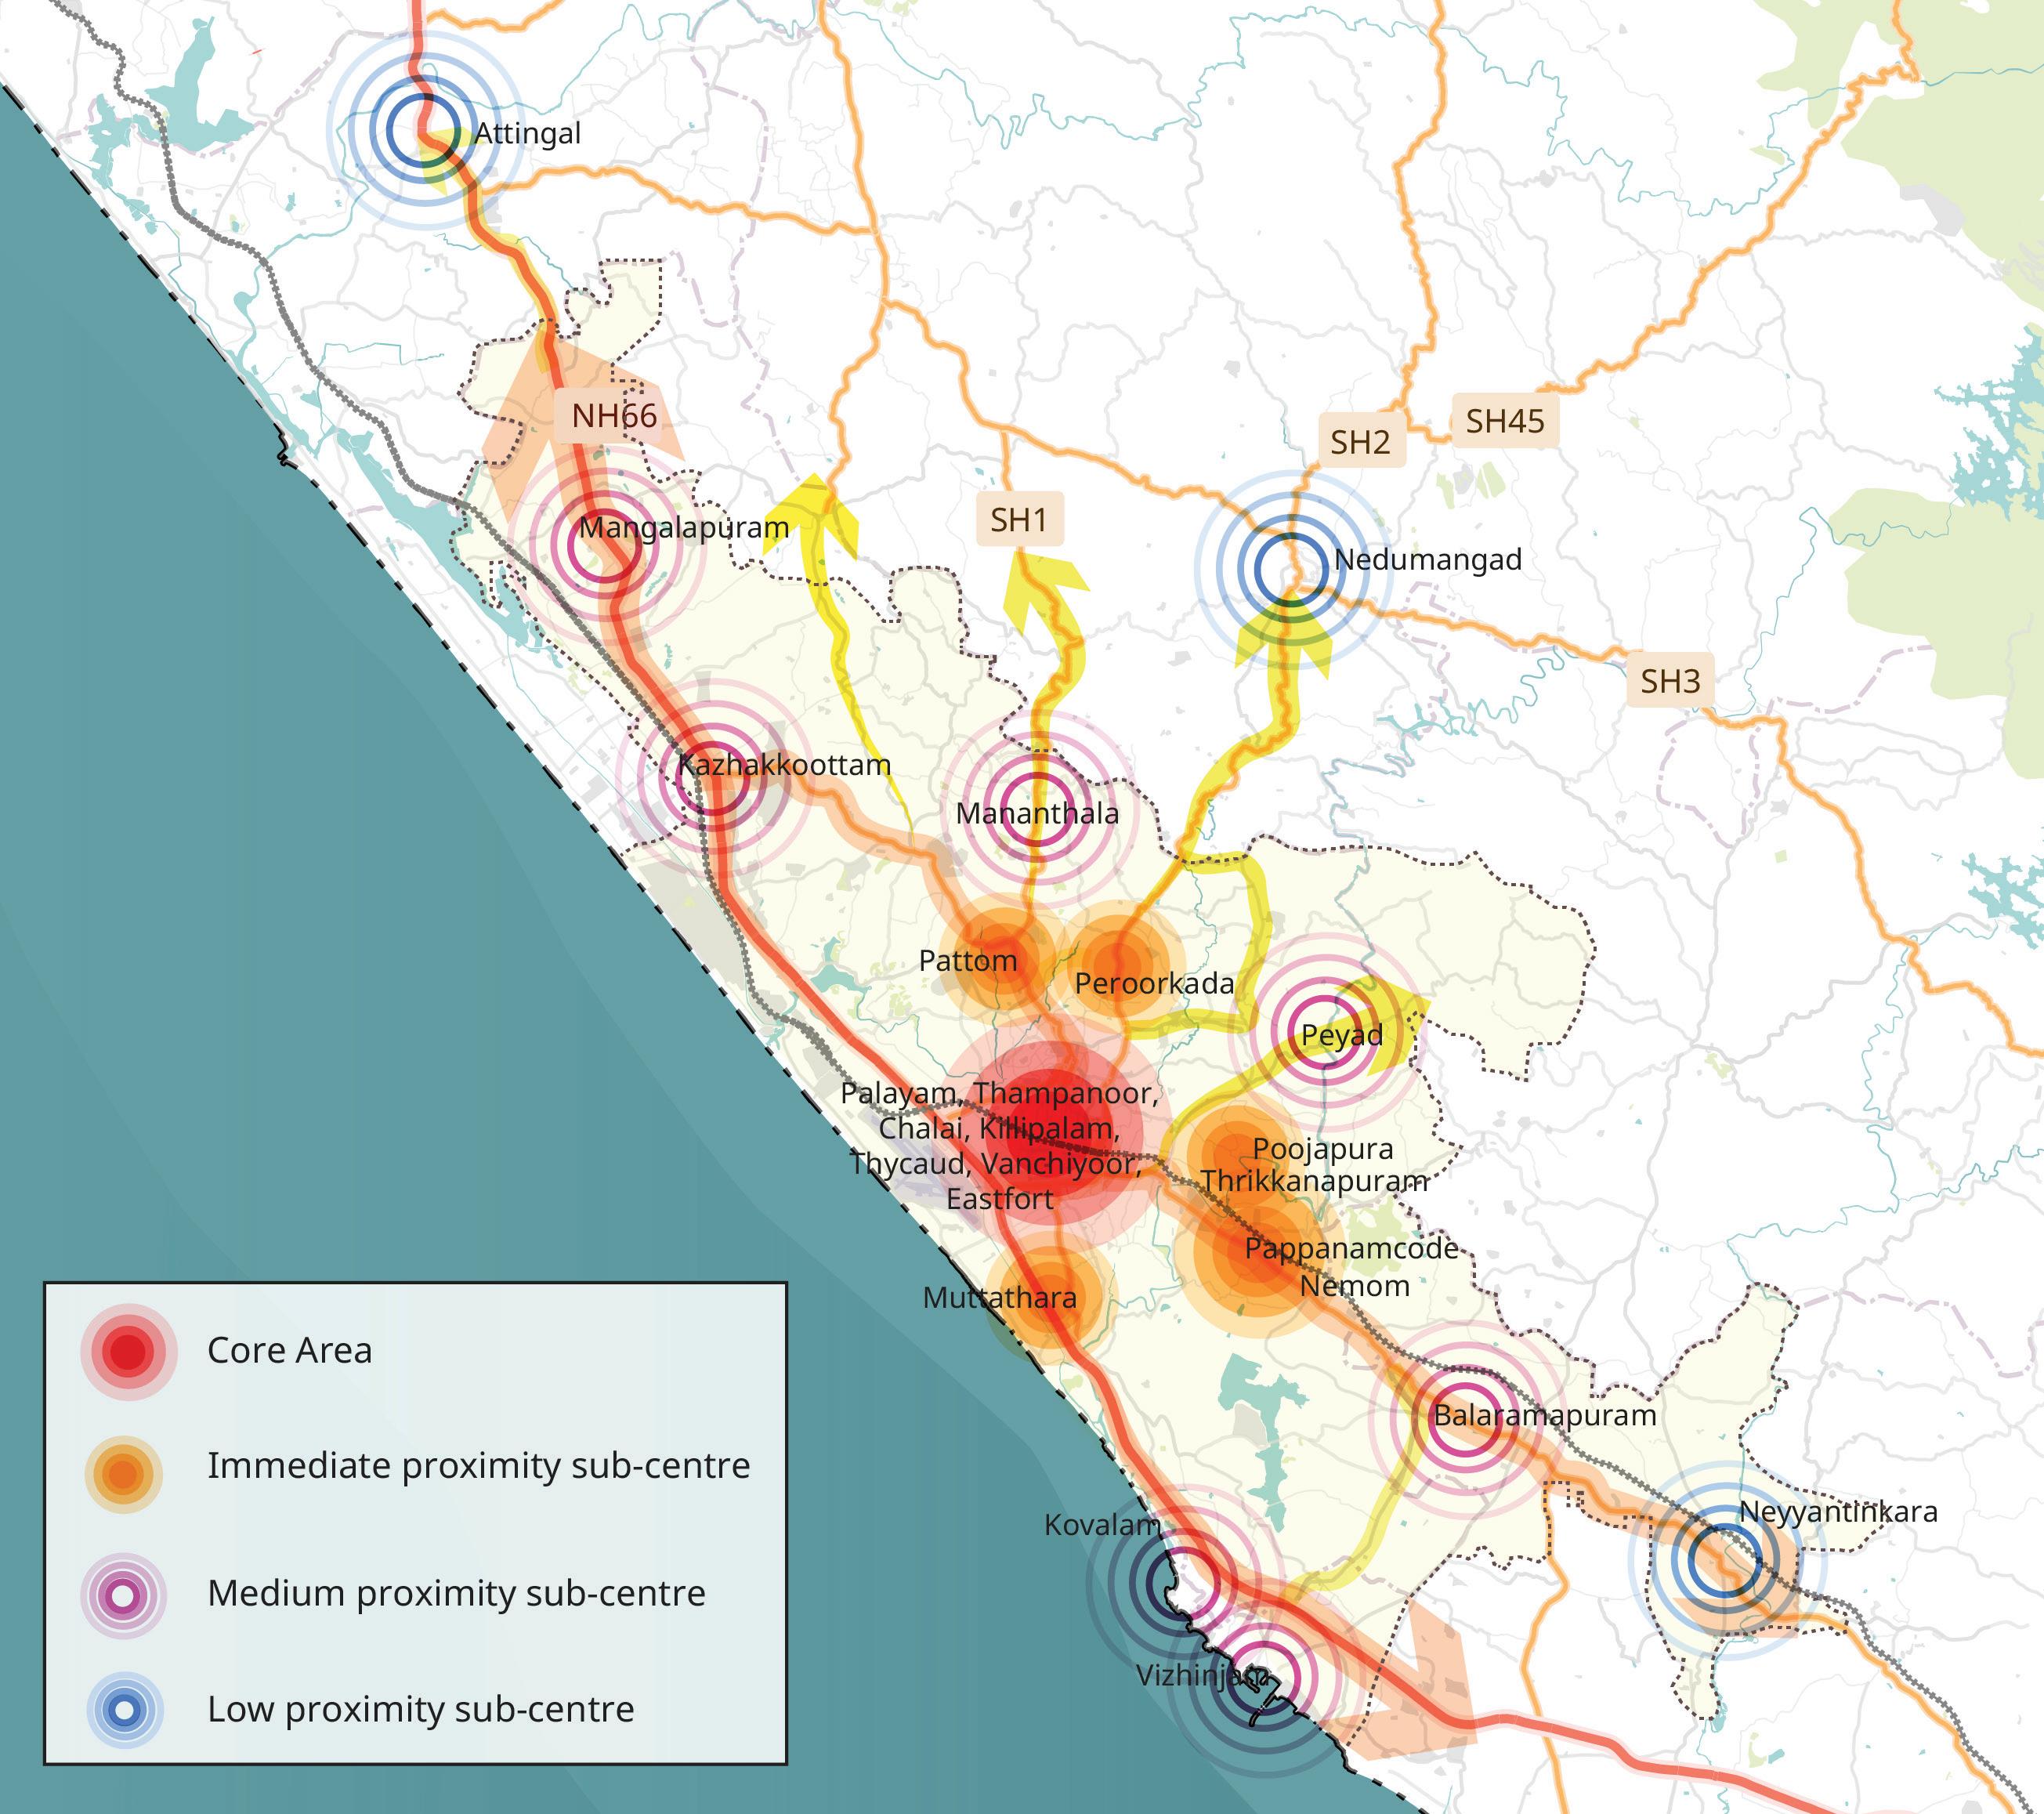
For the analysis purpose, study area can be further categorised into zones as per CMP as core area, immediate proximity zones, medium proximity and low proximity zones.
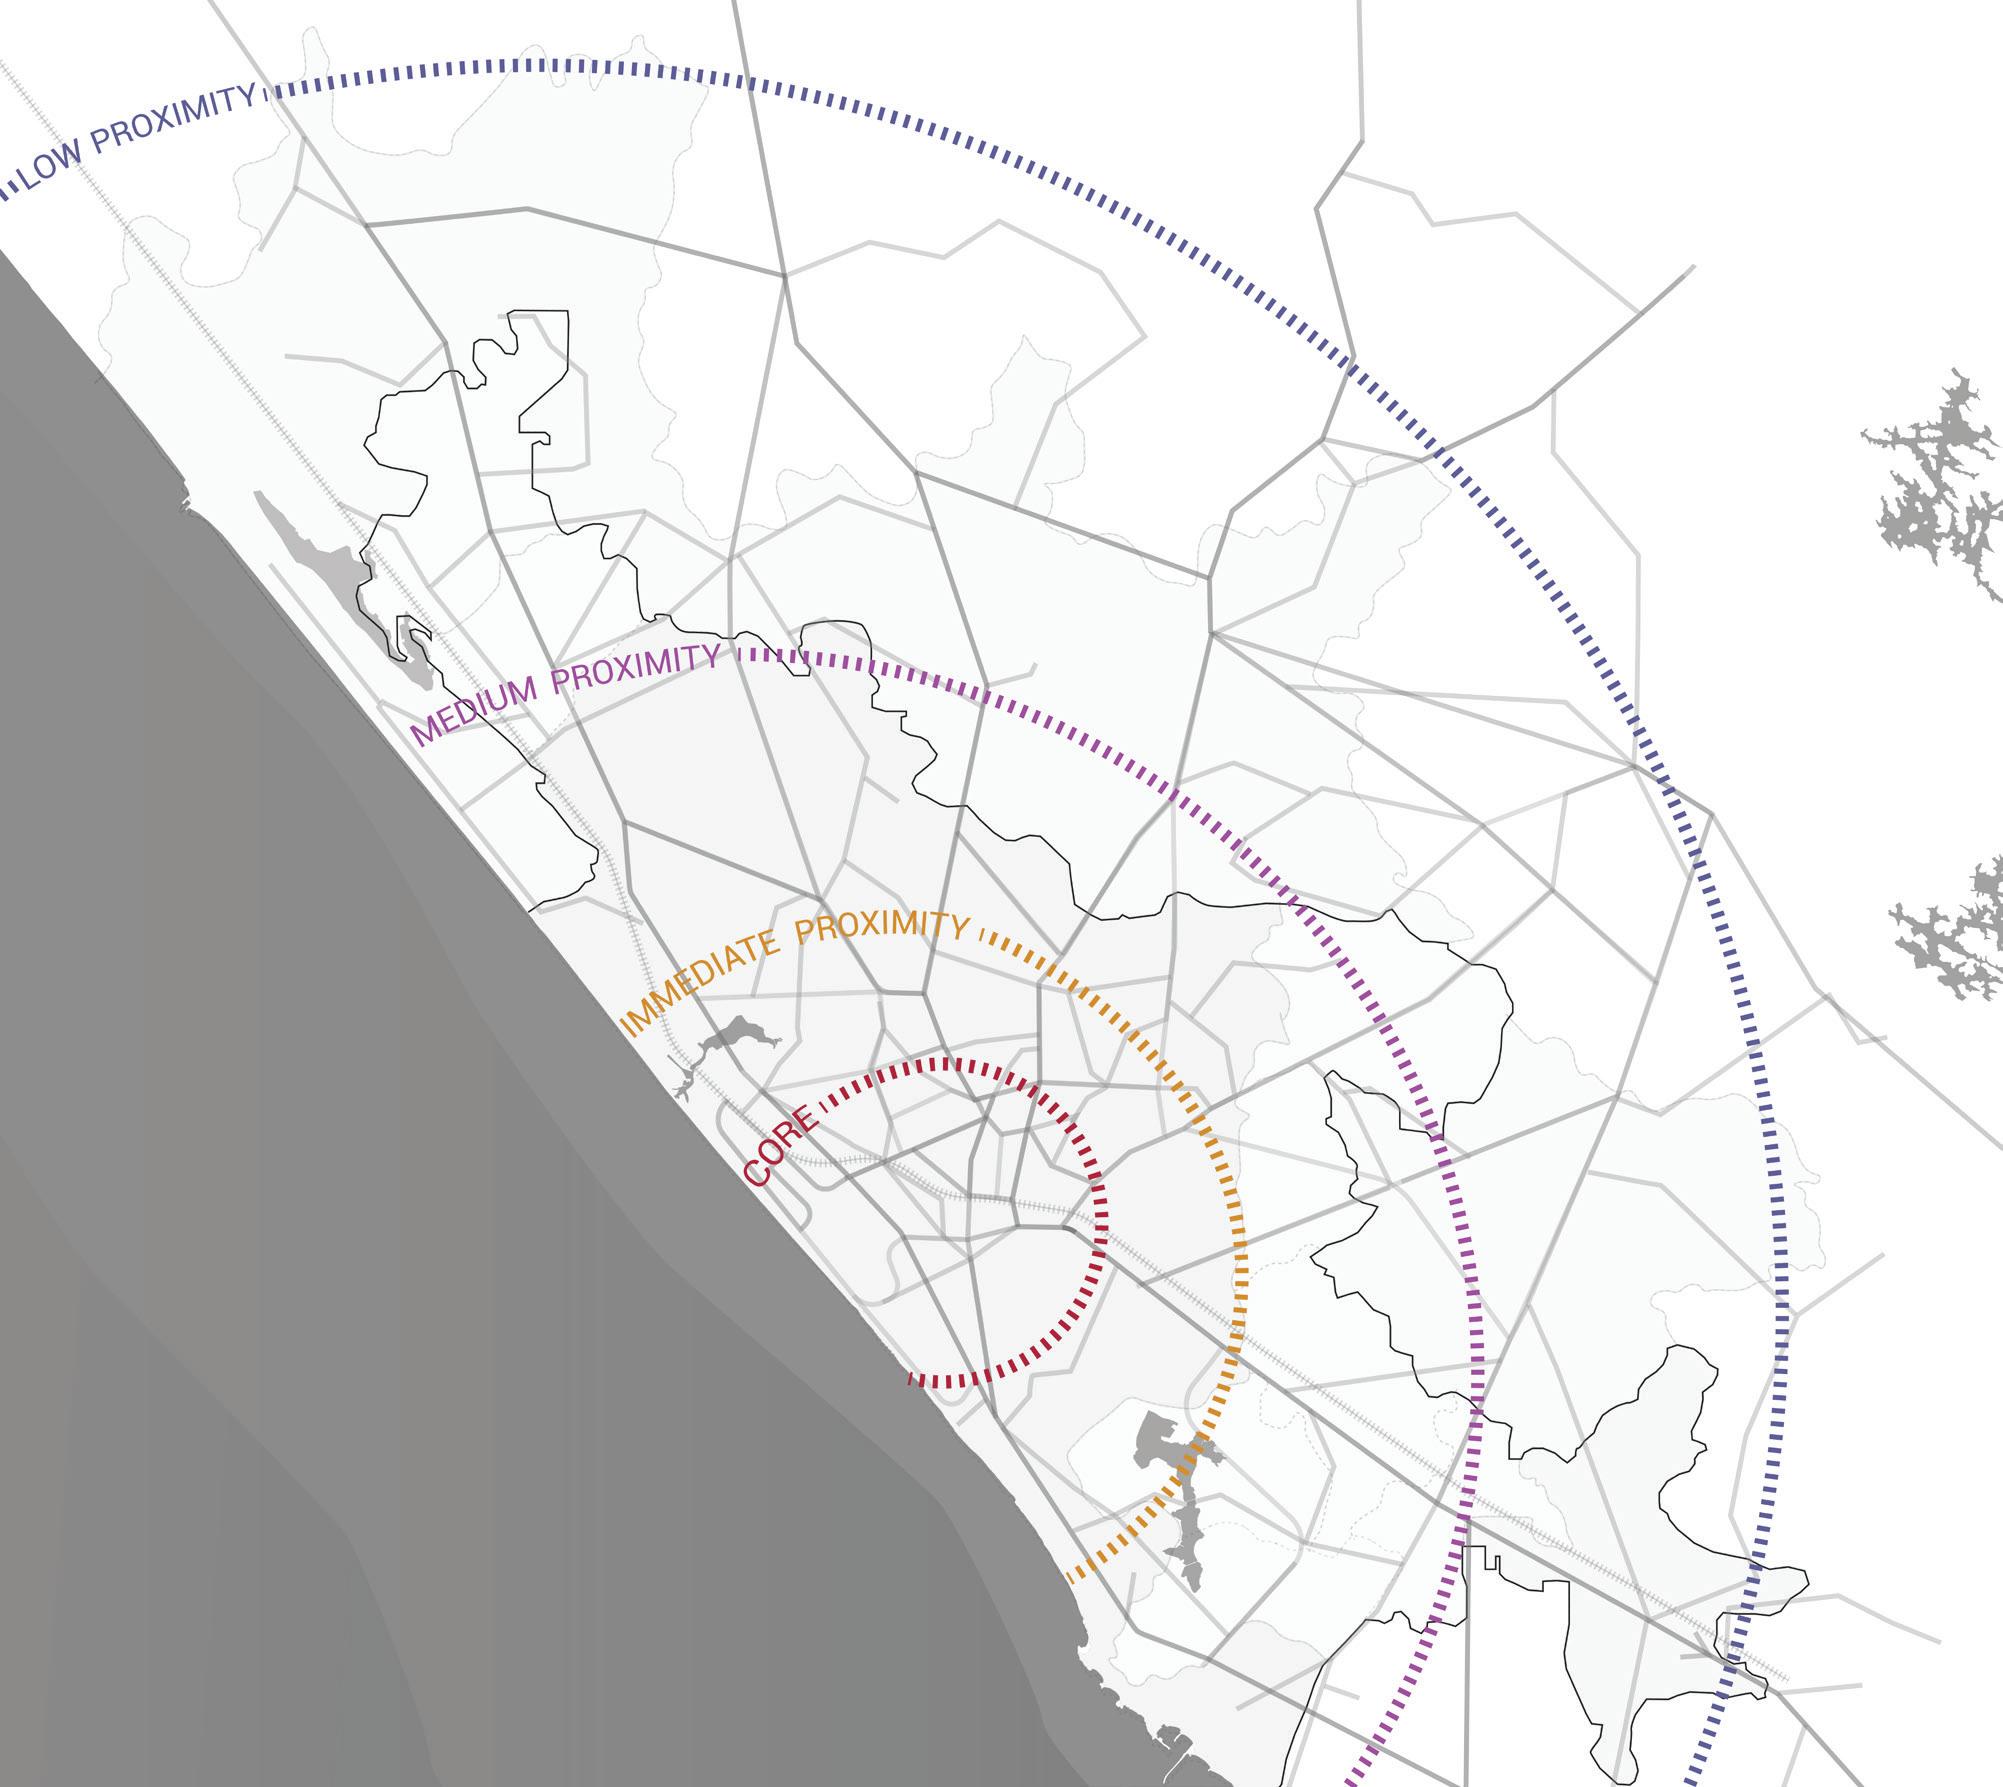
Core Area (3.5km)
Immediate Proximity Area (6.5km area)
Medium proximity area (12.2km radius)
Low proximity area (29.5km radius)
10. Zones identified based on the existing Public Transport Network
The primary mode of transport in Thiruvananthapuram is private vehicles, particularly two-wheelers and cars. Public transport is provided through bus services operated by the Kerala State Road Transport Corporation (KSRTC) and private bus operators. Non-Motorised Transport (NMT), including walking and cycling, also forms an important component of the city’s mobility network. Intermediate Public Transport (IPT) services are predominantly provided through auto-rickshaws and shared vans operating across the city. In recent years, app-based mobility services such as Ola have expanded their presence, offering on-demand taxi and auto-rickshaw services and providing additional transport options for commuters.
Thiruvananthapuram’s transport landscape is characterized by a mix of public buses, Intermediate Public Transport (IPT) services like auto-rickshaws and app-based taxis, a growing private vehicle base, and limited but important rail infrastructure. While the city has a legacy of good urban design and reliance on public transport, in recent years, this system has been strained due to rapid urban growth, fragmented planning, and infrastructural gaps across modes.
The bus services in Thiruvananthapuram are operated by both KSRTC and private bus operators with KSRTC operating about 90% of the total routes.1 The buses operate within the Thiruvananthapuram municipal boundary as well as the larger urban agglomeration within the district. Currently the government has issued 108 private bus permits which operate primarily on National Highway 66, Medical College Road, and Shencottah Road.
KSRTC operates six categories of services based on the extent of operations and service type, namely:
i. ‘City Ordinary’, where the operational area is within 10 km of Thiruvananthapuram Corporation and operates as regular service with stoppage at all the bus stops.
ii. ‘City Fast Passenger’ also has operational area within the 10 km of Thiruvananthapuram Corporation limits. However, such buses will only stop at major bus stops and operate as express services.
iii. ‘Ordinary buses’ which operate much beyond the Thiruvananthapuram Corporation as town-to-town services and halt at all bus stops.
iv. ‘City Circular Service’ is an innovative transportation network with a hop on hop off model, with a total of 13 circular routes connecting all the major points in the city.
v. JnNURM non-AC are semi low floor buses procured under the JnNURM Mission which predominantly operate as inter-city services and halt at all stops.
1 From Report “City Bus Improvement Study for Thiruvananthapuram”, prepared by Deutsche Gesellschaft für Internationale Zusammenarbeit (GIZ) GmbH
vi. Regional Fast passenger services are long distance regional services including both inter and intra district areas and stop only at major bus stops in the city.
KSRTC buses operate on nearly 77% of Thiruvananthapuram’s primary and secondary roads, offering connectivity from the city core to outer sub-centres. However, there is a stark imbalance in service frequency. In the city core, especially through the City Circular Service, a hop-on-hop-off model with 13 routes, the frequency is high, and ridership exceeds 25,000 daily. In contrast, in the medium and low proximity zones, the frequency significantly drops, with headways of more than 30 minutes. This makes public transport less attractive and reliable for commuters in these peripheral areas, contributing to a higher dependence on private modes. Thiruvanan-
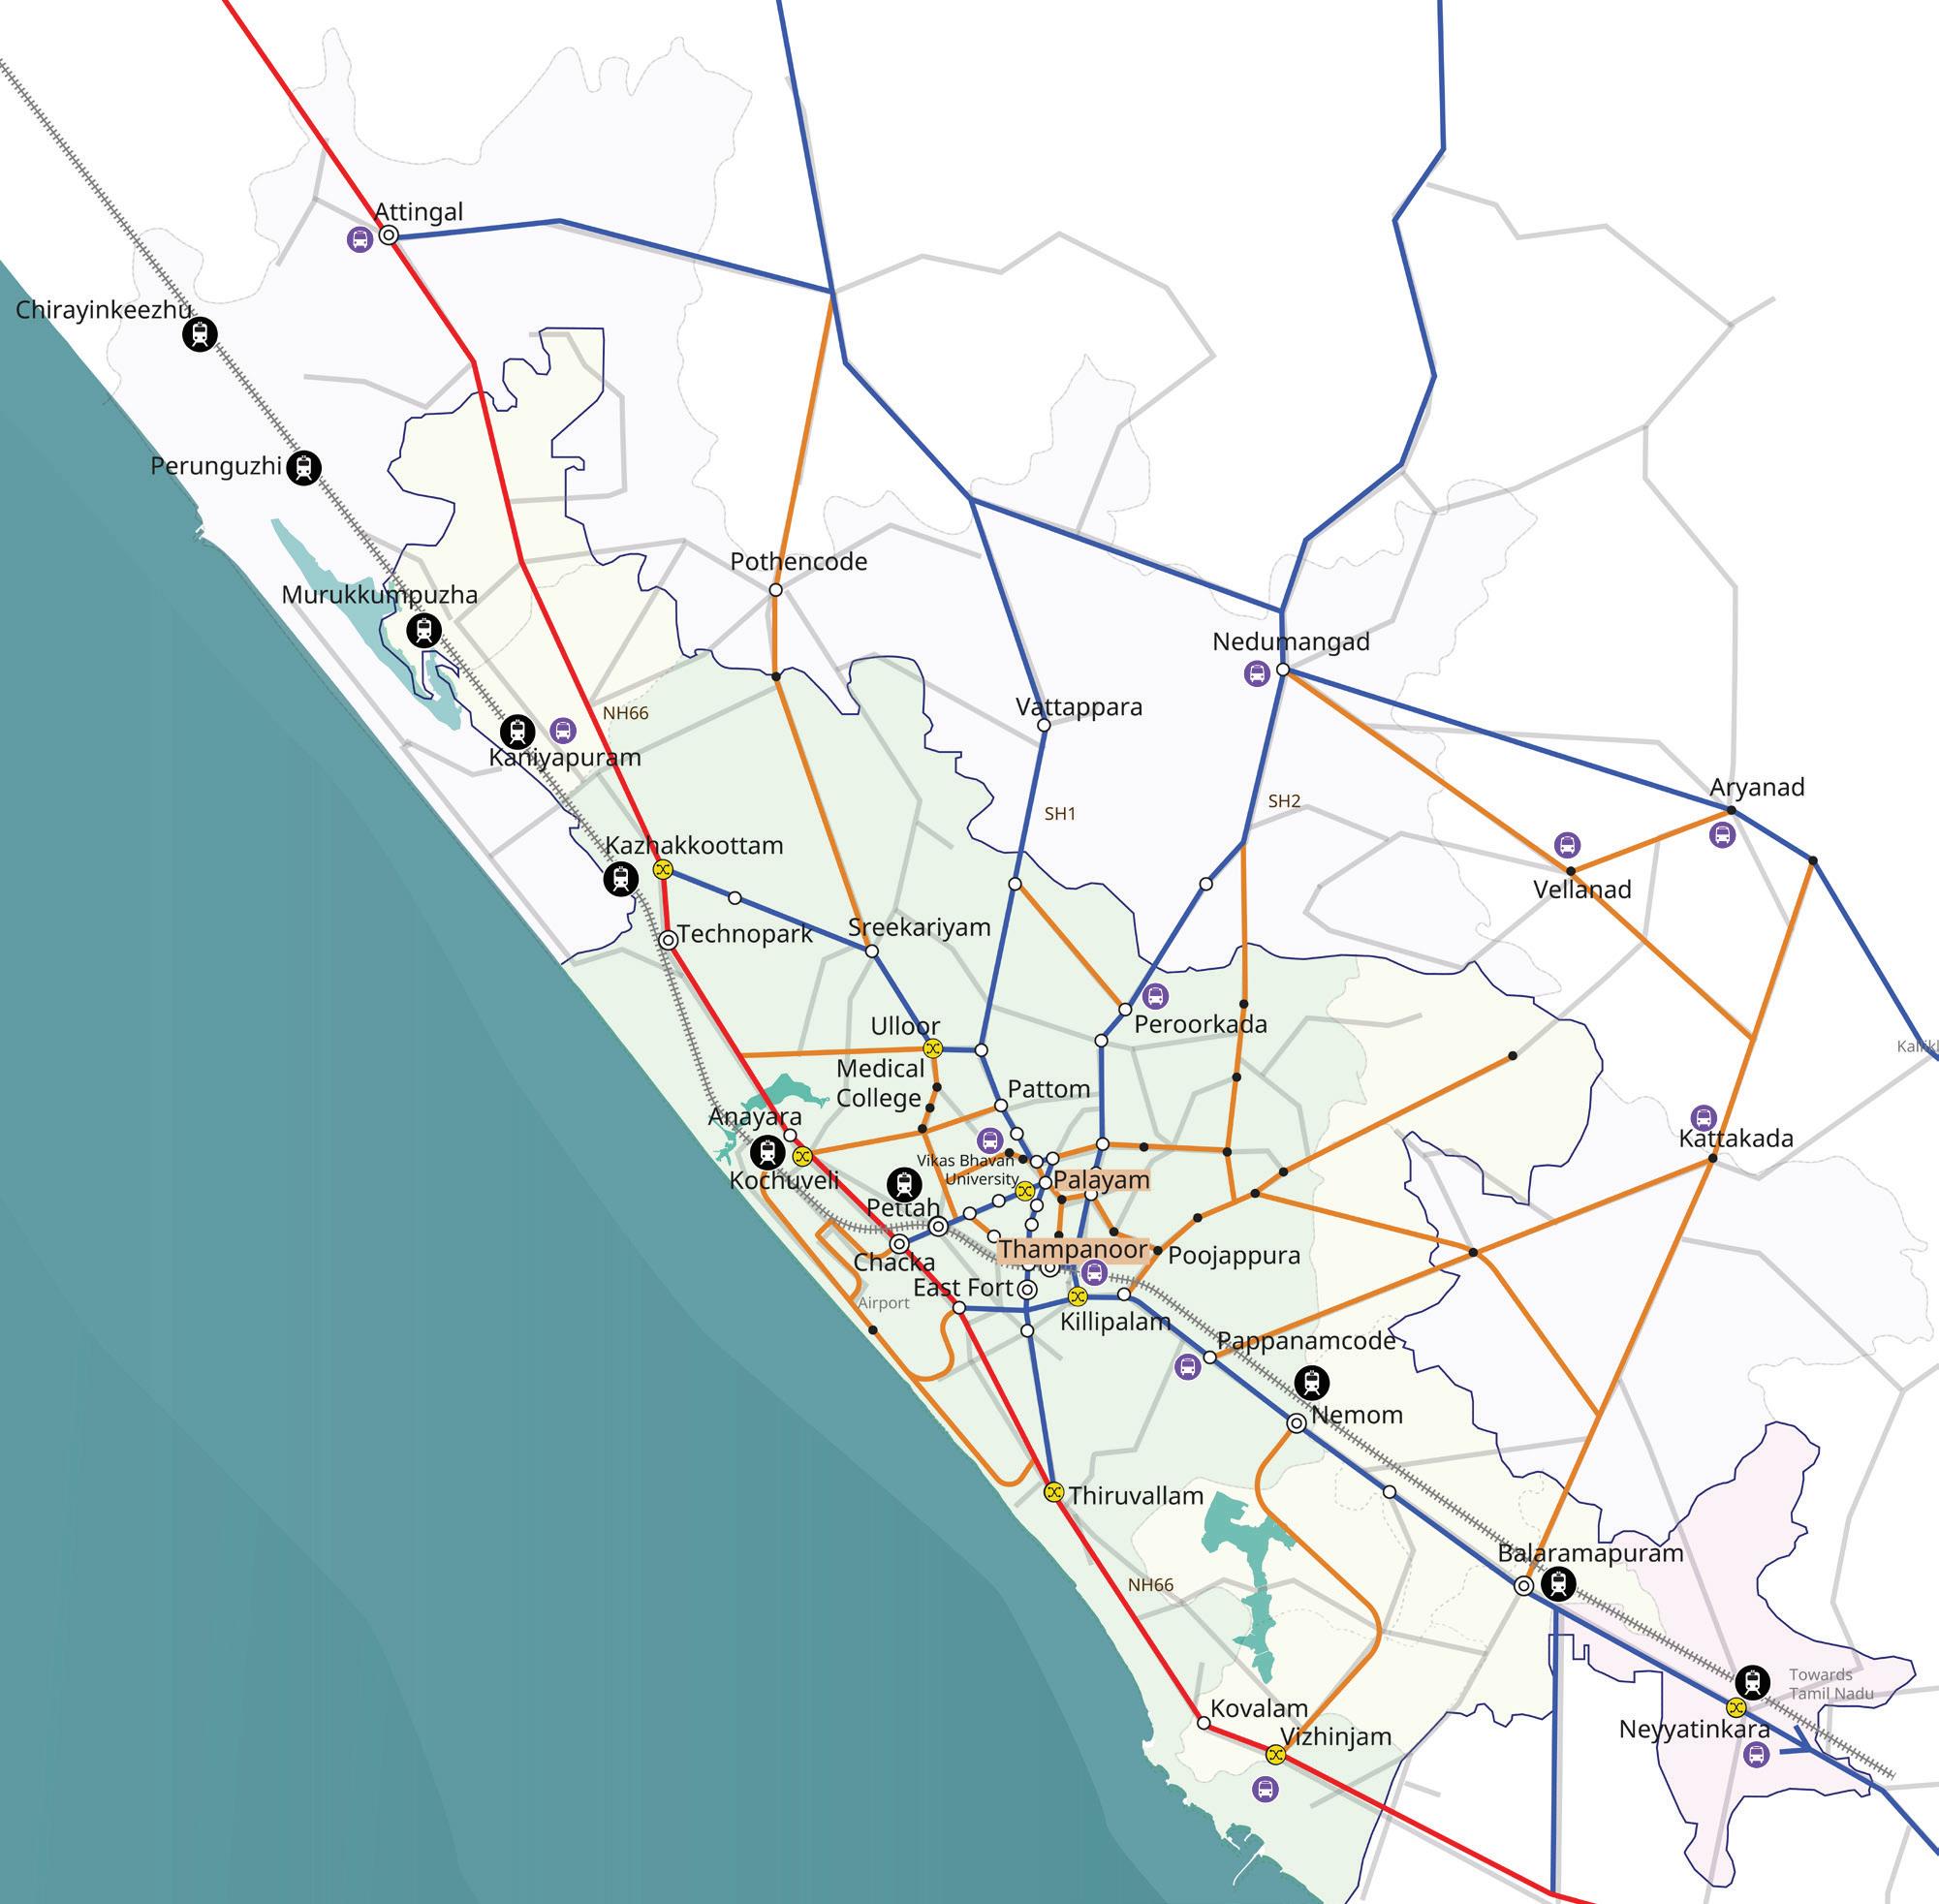
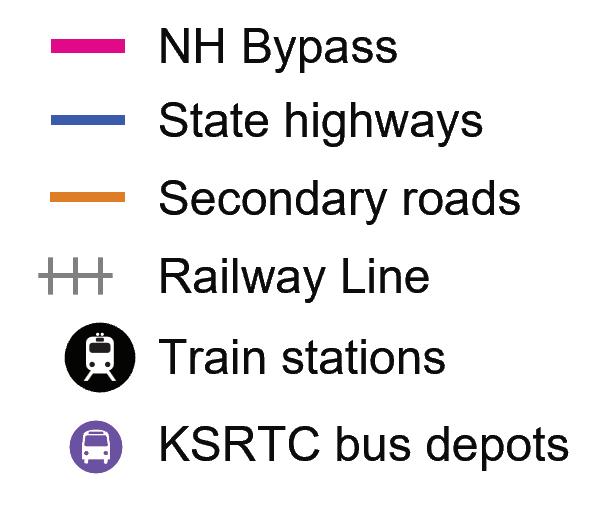
thapuram’s bus transport system, while extensive in reach, suffers from a range of structural and operational issues. The overreliance on KSRTC, limited private sector participation, unequal service distribution and lack of multimodal integration together contribute to a system that is difficult to navigate and unreliable in many parts of the city.
The Intermediate Public Transport (IPT) system, comprising auto-rickshaws, shared vans, and app-based taxi services, plays a critical role in providing first- and last-mile connectivity across the city. However, high fares, particularly for auto-rickshaws, limit their affordability for regular commuters. IPT services also operate with limited regulation, especially in peripheral areas where informal jeep and shared van services often ply along the same corridors as formal bus routes. This creates direct competition with KSRTC services and can adversely affect public transport ridership. In addition, the absence of structured integration between IPT services and the formal bus and rail networks results in fragmented travel experiences, reducing the overall efficiency and attractiveness of the public transport system.
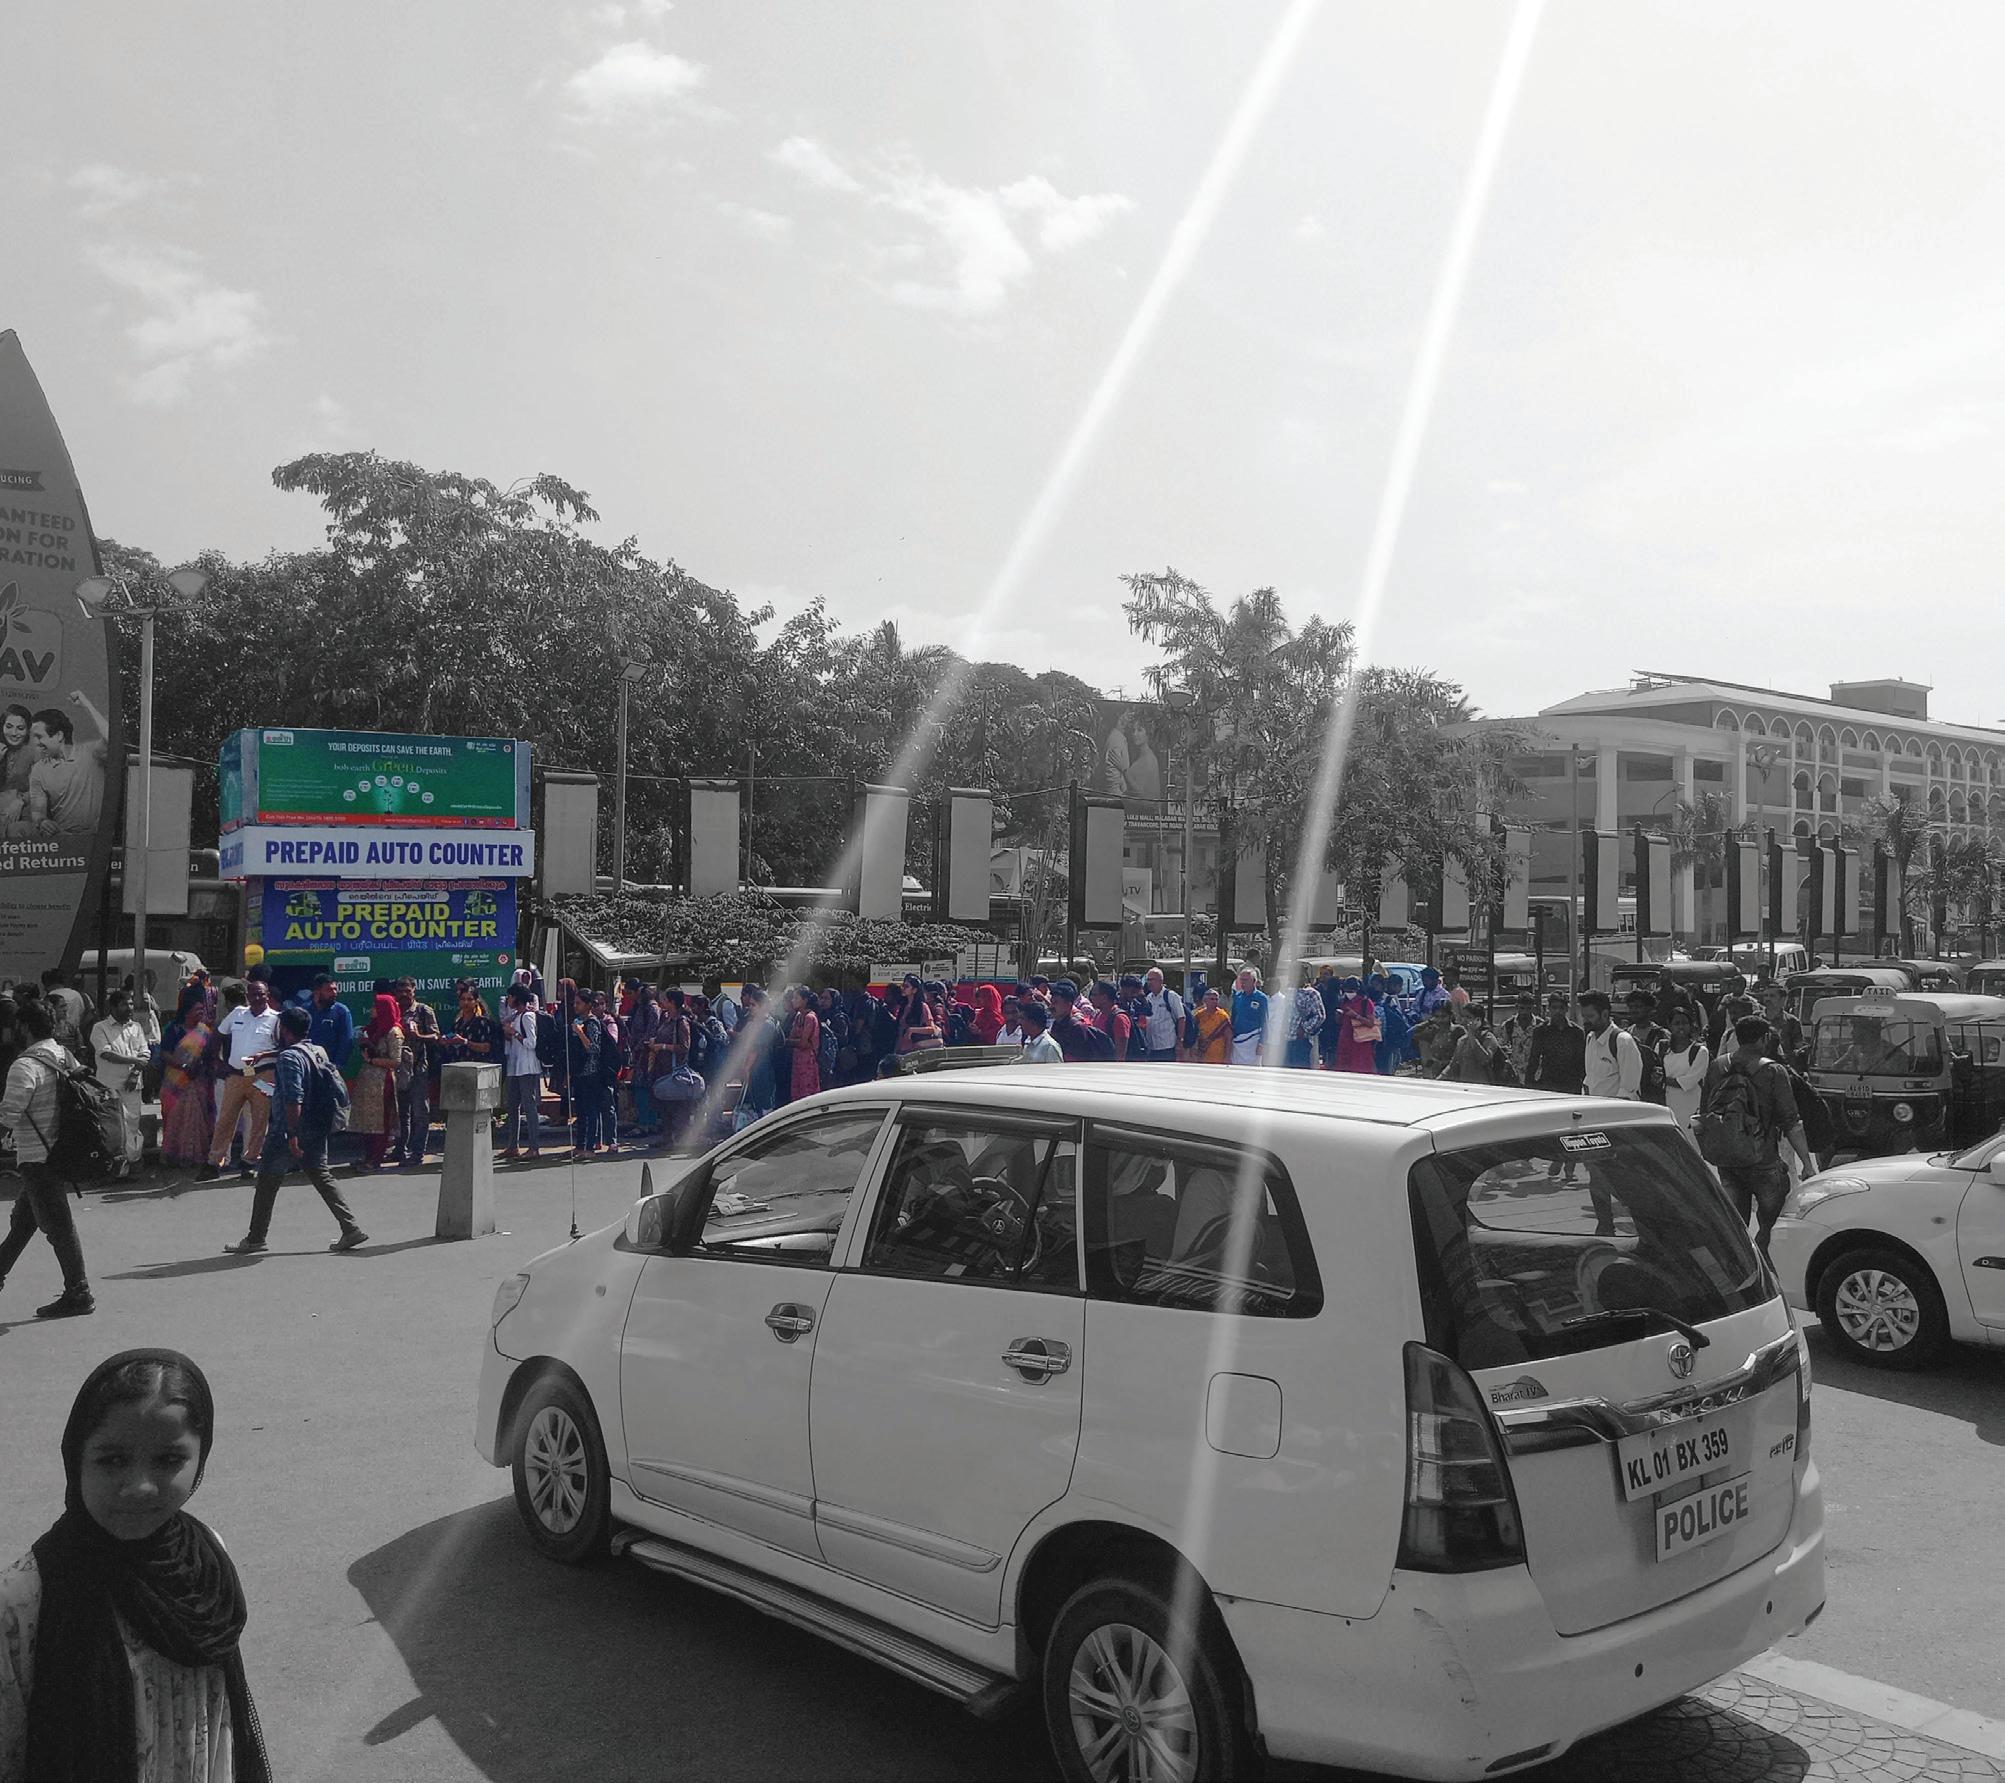
The private vehicle comprising of 4 wheelers and 2 wheelers in Kerala and Thiruvananthapuram is rapidly increasing. Private modes of transport especially the two wheelers are the dominant mode of transport in the city. This is resulting in increased traffic congestion on the streets and road safety related issues especially due to conflicts between pedestrian and vehicular movement.
Fig. 11. The
Private vehicle mode share has been increasing over the last few years. Thiruvananthapuram has the highest vehicle registrations with over 10lakhs in the state. The annual growth rate of registered vehicles is 6.4%.2
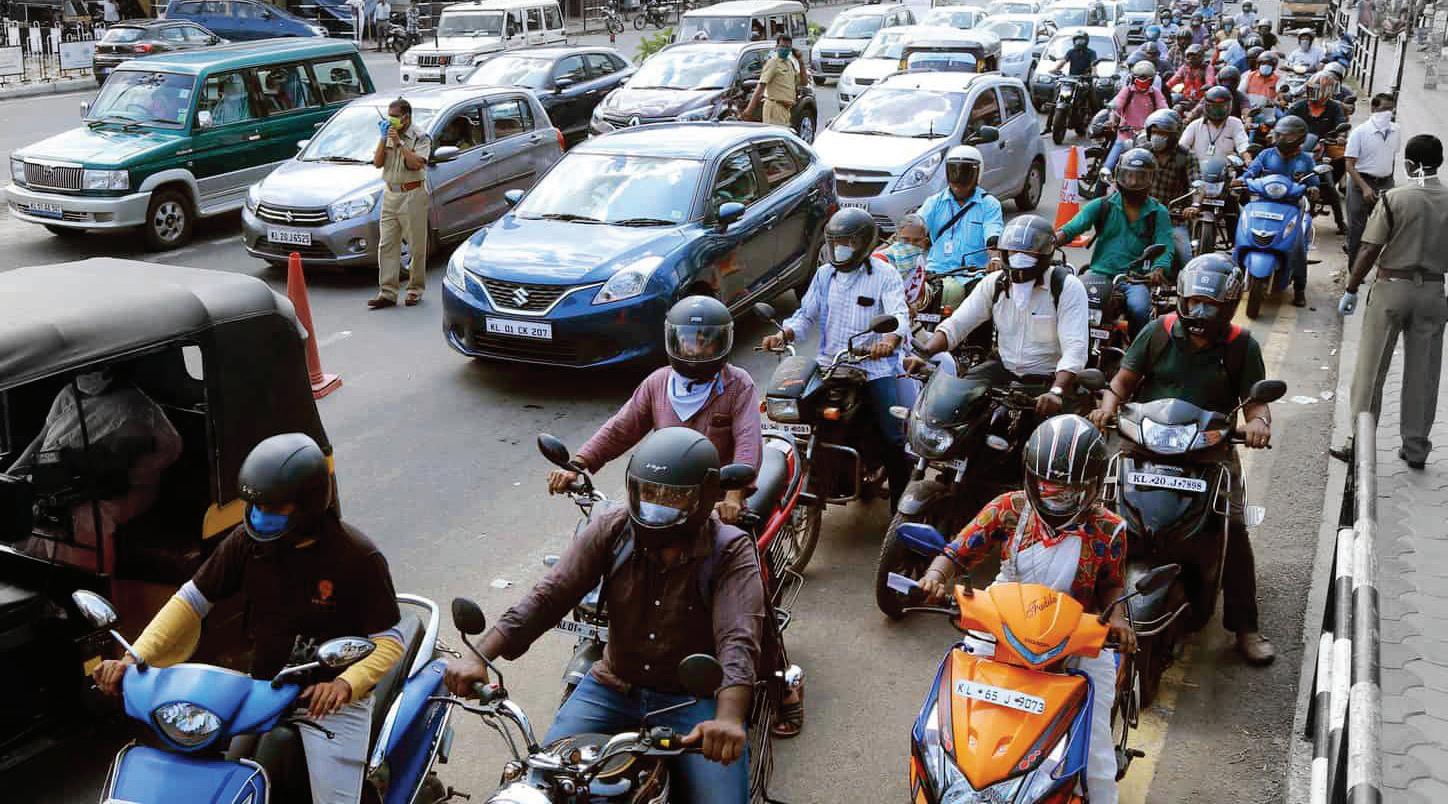
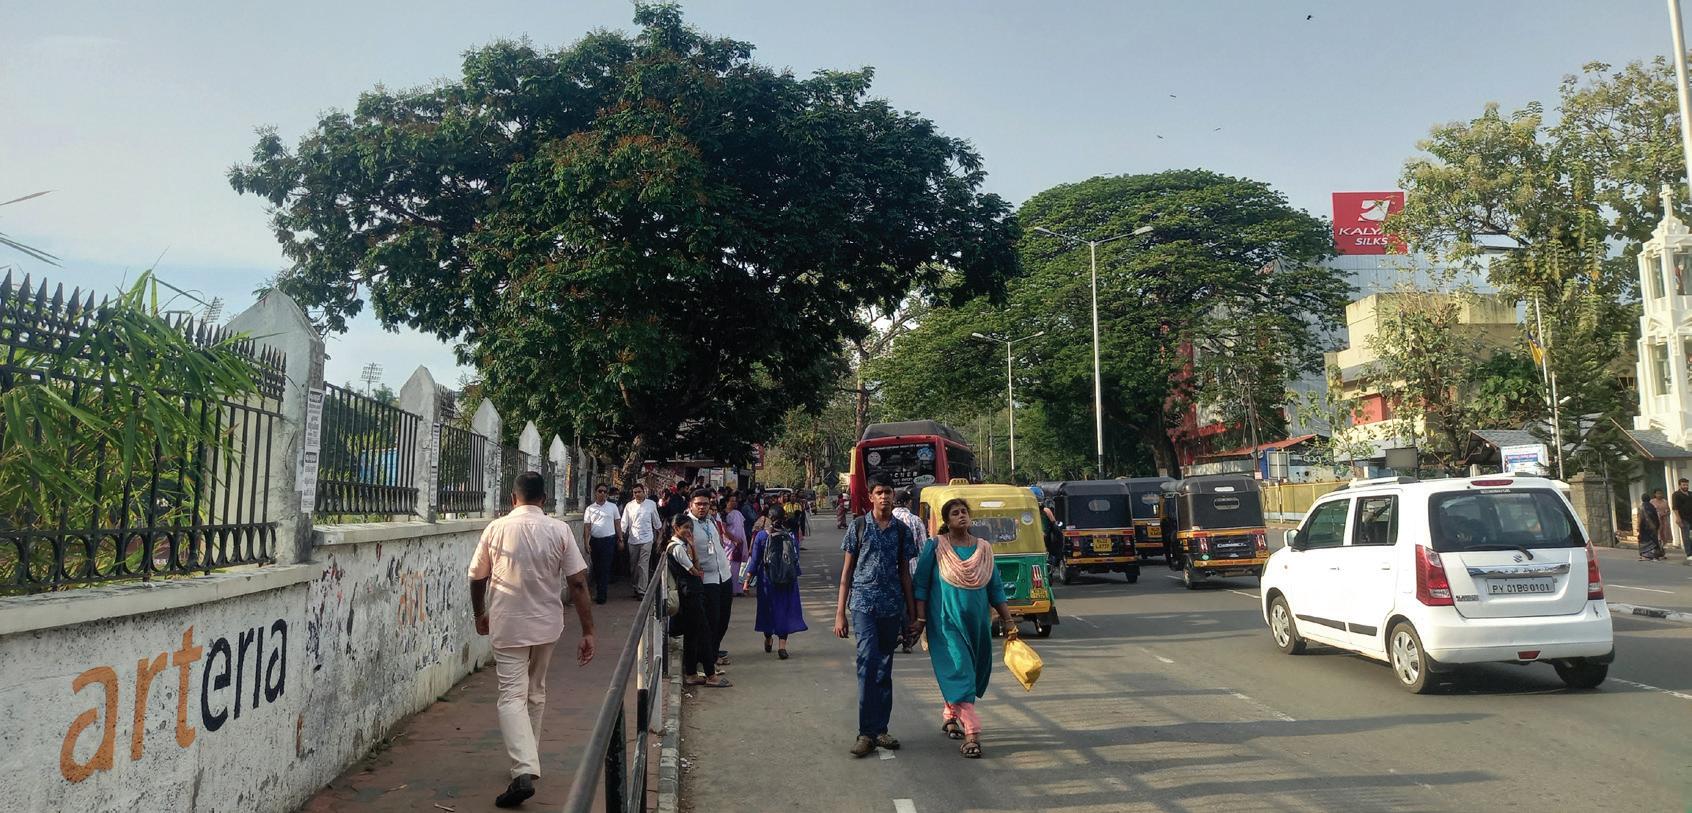
Thiruvananthapuram ranks second in road accident statistics within the state, accounting for 12.6% of the total incidents, following Ernakulam. Despite being one of the major urban centres, the city’s infrastructure reveals significant gaps in pedestrian safety. Only 14.2% of the major road network in Thiruvananthapuram is equipped with footpaths, and of that limited availability, merely 5% of the footpaths meet the recommended width of over 2 meters.3 This inadequacy in pedestrian infrastructure underscores the need for enhanced urban planning and safety measures for pedestrians in the city.
The walking mode share is 15% and, as mentioned above, 85% of public transport users access bus stops by walking.
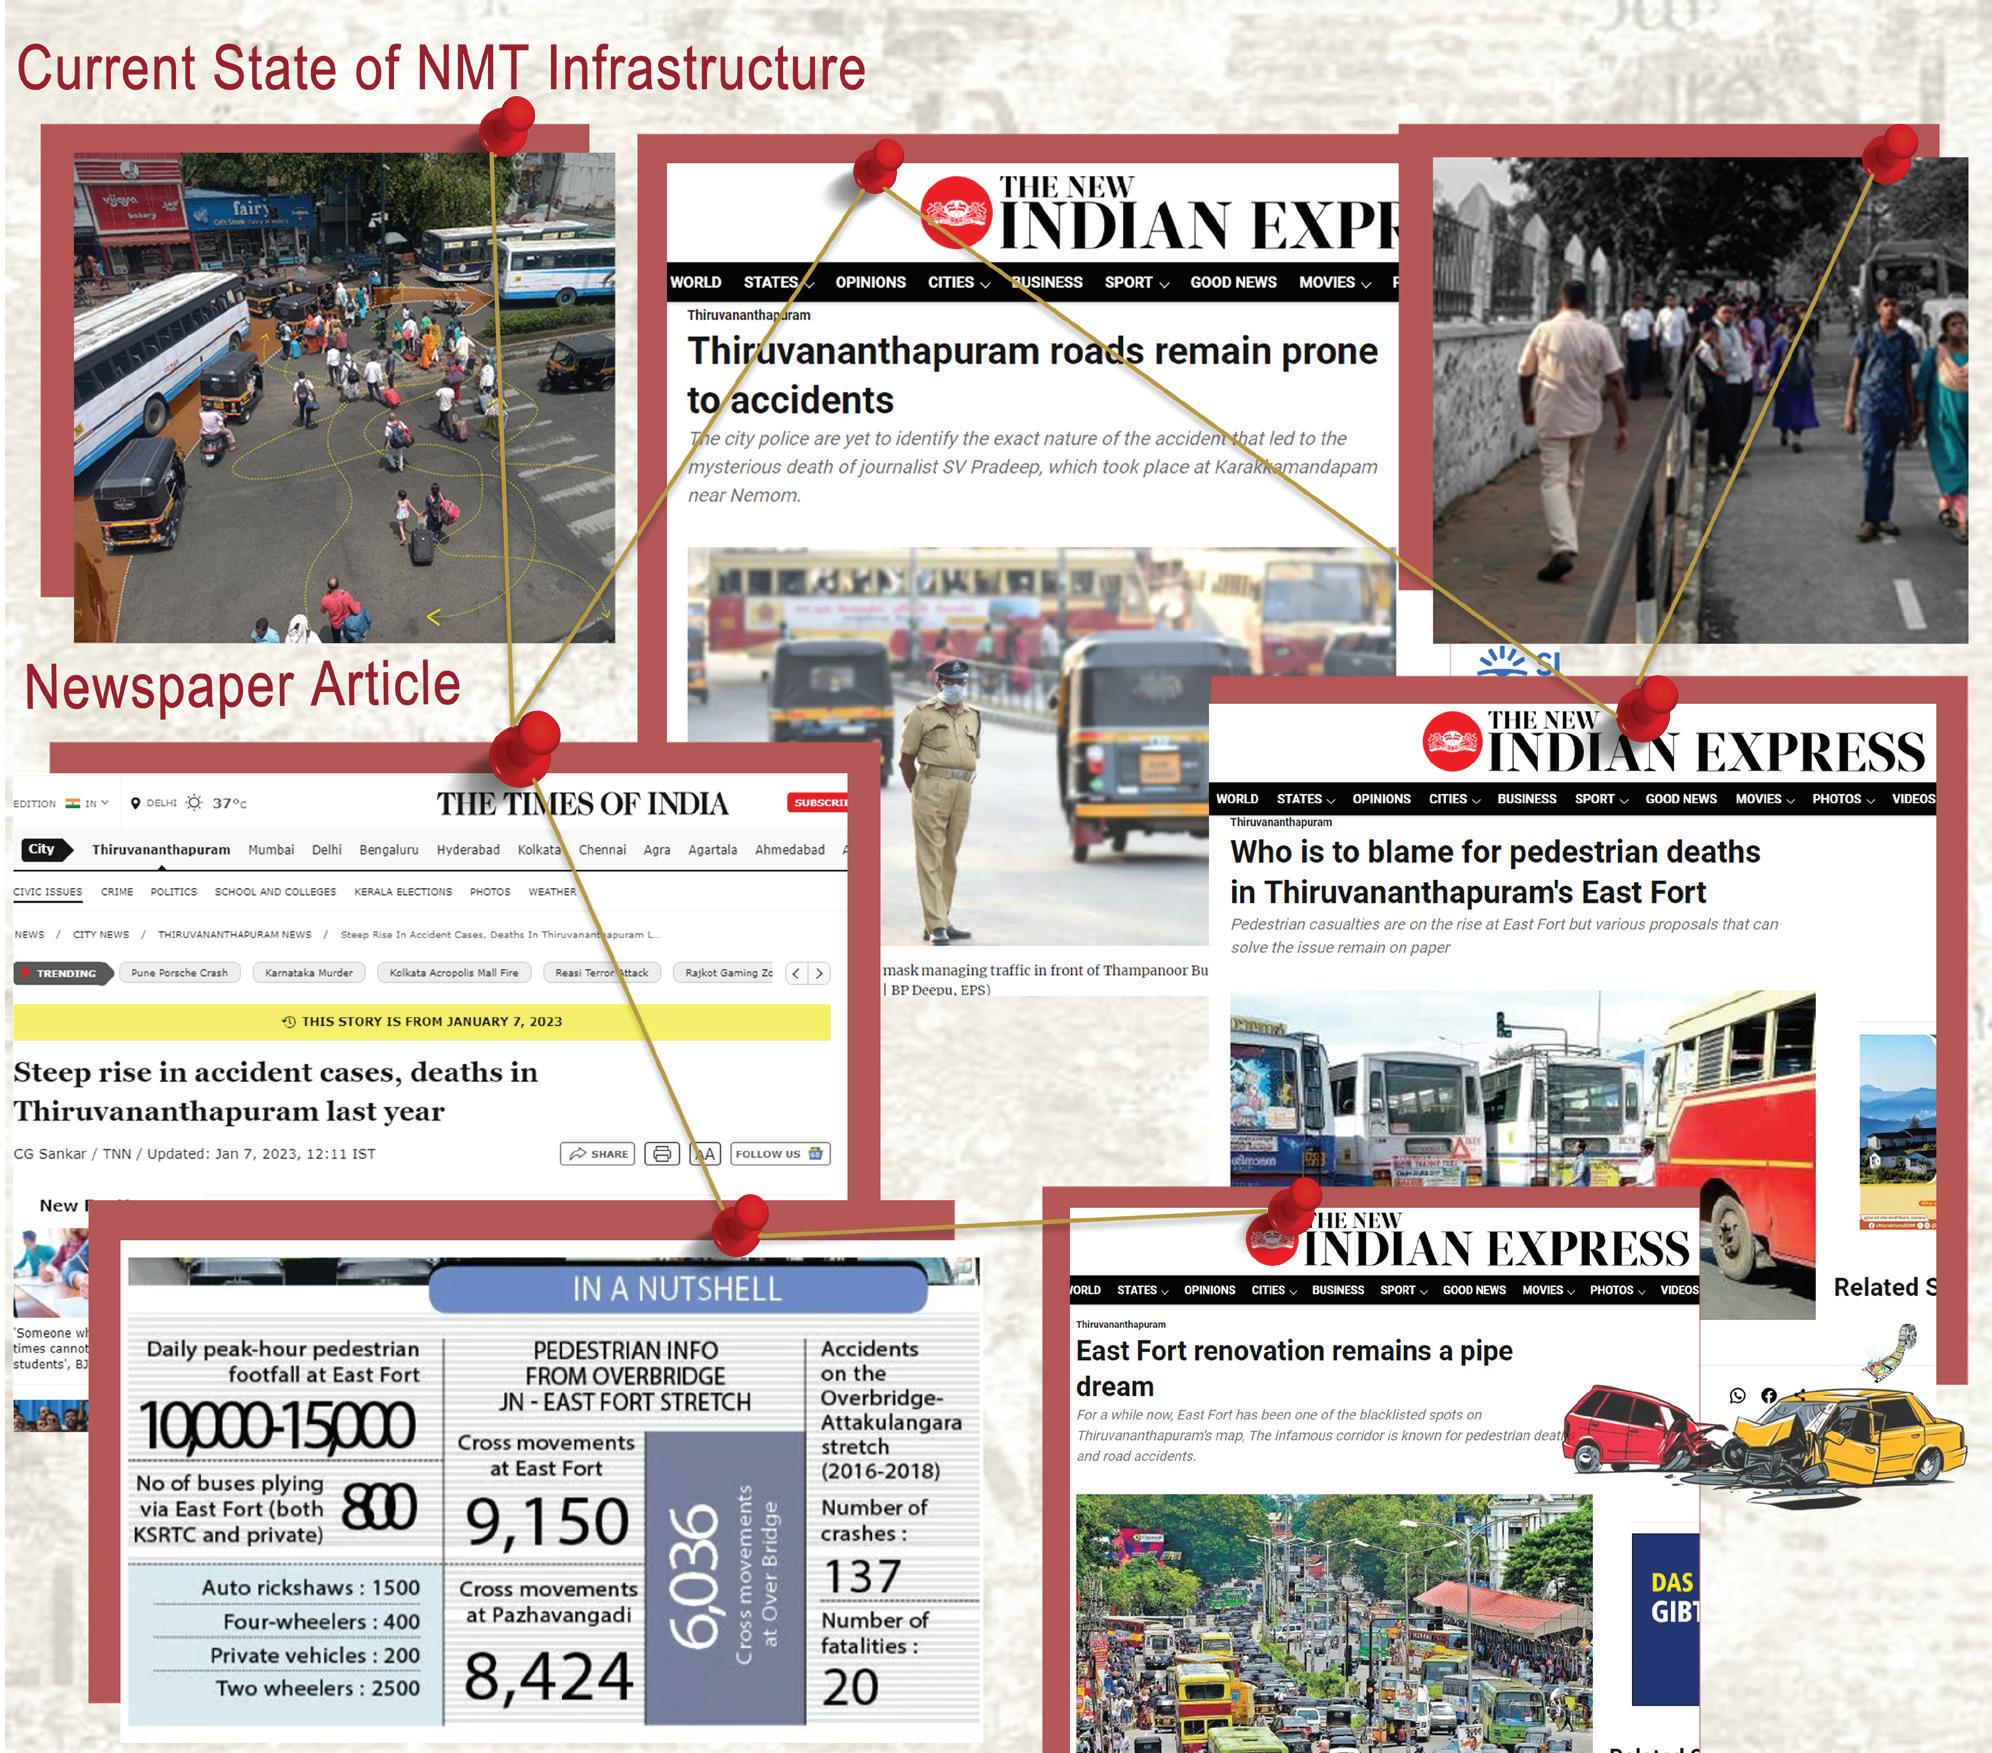
Fig. 16. Articles on Pedestrian and Vehicular Conflicts
3 NATPAC report on pedestrian-friendly-urban-transport-for-thiruvananthapuram-national-transportation
The current mode share in Thiruvananthapuram highlights a strong dependence on private modes, with two-wheelers accounting for 40% of all trips and private cars accounting for a further 15%. Together, private vehicles constitute 55% of total trips, reflecting the city’s significant reliance on personal motorised transport.
Public transport, primarily buses, accounts for 21% of trips, while walking contributes 15% and cycling only 1%, indicating limited use of non-motorised modes. Intermediate Public Transport (IPT), including auto-rickshaws and shared services, accounts for 8% of trips, suggesting a relatively low dependence on IPT compared to other Indian cities.
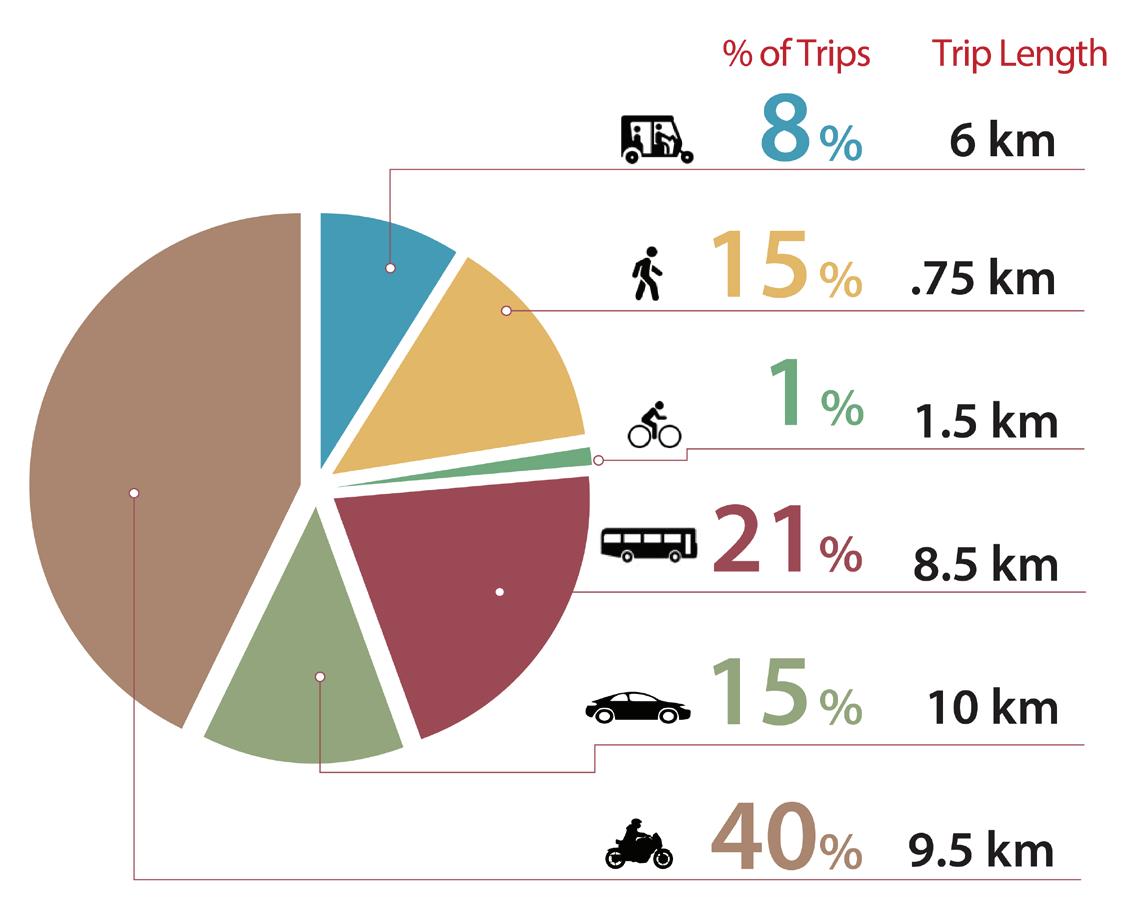
Fig. 12. Mode Share in Thiruvananthapuram
The average trip lengths further indicate that motorised modes are preferred even for relatively short urban journeys. Two-wheelers and cars record average trip lengths of 9.5 km and 10 km respectively, while bus trips average 8.5 km. Walking trips are generally limited to short distances, with an average trip length of 0.75 km, reflecting the constraints imposed by inadequate pedestrian infrastructure.
This travel pattern is closely linked to the quality of the city’s walking environment. As per the Draft CMP Report, only 4.2% of streets have footpaths with a width of 2.5 m or greater, while nearly 57% of footpaths are less than 1.5 m wide. The inadequate width and continuity of pedestrian facilities often force pedestrians to walk on the carriageway alongside vehicular traffic, compromising both safety and comfort. According to the NATPAC Primary Survey (2014), Thiruvananthapuram recorded a Walkability Index of 48%, based on the Ministry of Housing and Urban Affairs (MoHUA) methodology, placing it in the “very bad” category. Poor pedestrian infrastructure not only discourages walking but also weakens first- and last-mile connectivity to public transport, reinforcing the city’s dependence on private vehicles.
Urban mobility in Thiruvananthapuram is governed by multiple agencies with overlapping responsibilities, ranging from road maintenance and public transport operations to traffic regulation and environmental oversight. Each entity plays a critical role, whether in infrastructure provision, service regulation, enforcement, or data-driven planning. Strategic alignment of these agencies through a unified governance framework is essential to streamline decision-making, ensure operational coherence, and deliver a seamless multimodal commuting experience across the city.
Table. 2. Institutional Setup in Thiruvananthapuram Name


Thiruvananthapuram Municipal Corporation
Thiruvananthapuram Development Authority
Kerala State Road Transport Corporation
Kerala Urban Road Transport Corporation




Pollution Control Board
Monitors roads, drainage, and streetlights. It also supports urban mobility projects and Non-Motorized Transport (NMT) initiatives.
Prepares Land-use plans; facilitate large scale infrastructure projects and oversees urban renewal efforts.
Provides the city’s primary public bus service, operating both intra-city and inter-city routes. It is managing terminals, scheduling, and fleet operations.
Operate and manage bus services in urban and suburban areas, by focusing on reducing congestion and promoting public transport.
Operate and manage bus services in urban and suburban areas, by focusing on reducing congestion and promoting public transport.
Southern Railways
Public Works Department / National Highways Authority of India
Regional Transport Office
Enforces laws, issues permit and promotes sustainable practices to Protect public health and the environment.
Planning, executing, and managing civil engineering projects like roads, bridges, and government buildings.
Oversees vehicle registration, issuance of driving licenses, and enforcement of transport regulations.
City Traffic Police
National Transportation Planning and Research Centre
Smart City Thiruvananthapuram Ltd.
Oversee real-time traffic regulation, enforcement of road rules and coordination during large scale disruptions.
Technical expertise and policy research support to ing multiple government agencies.
Traffic systems, e-mobility pilots, and public space enhancements
An IMP assessment framework has been developed under the SUM-ACA project to develop a comprehensive understanding of a cities its existing mobility conditions, identifying both strengths and gaps across all mobility pillars. This structured assessment supports evidence based decision making by helping the city prioritise interventions that can generate the greatest benefits in terms of accessibility, safety, sustainability, multimodal integration, active mobility improvements, public transport enhancement and climate responsive infrastructure. Refer Annexure 1 on details related to the IMP assessment framework carried out for Thiruvananthapuram city.
The framework promotes stronger coordination among agencies involved in urban mobility, including transport operators, urban planning authorities, municipal departments and infrastructure agencies; in this case being Thiruvananthapuram Municipal Corporation, KSRTC, PWD and other relevant stakeholders. The assessment enables more coordinated planning and implementation by linking mobility, land use, climate resilience, governance and financing within a common performance framework. The use of measurable indicators further allows the city to monitor progress, strengthen funding proposals, guide phased investments and improve accountability in urban mobility planning and decision making. Overall, the framework enables Thiruvananthapuram to transition from corridor based infrastructure improvements toward an integrated, sustainable and people-centric mobility system.
The chart below presents an assessment of Thiruvananthapuram’s urban mobility system based on the Integrated Mobility Plan (IMP) framework. The assessment provides a structured overview of the city’s current mobility performance across the nine thematic pillars of the IMP.
Each axis of the radar chart represents one pillar of the IMP framework and the plotted values (ranging from 0 to 1) indicate the status or maturity level of Thiruvananthapuram’s mobility performance under that pillar. Higher values represent stronger institutional readiness, infrastructure provision and policy integration, while lower values indicate areas requiring further improvement, targeted interventions or policy support is required.
From the assessment, Thiruvananthapuram demonstrates relatively stronger performance in the following pillars
• Climate Resilient and Compact Urban Growth
• Public and Shared Transport Systems,
• Equity, Inclusion and Informal Sector
The city has also incorporated climate resilience considerations within planning ini-
Fig. 18. IMP Framework assessment of Thiruvananthapuram’s urban mobility system
tiatives, particularly in relation to coastal vulnerability, flood management and sustainable urban development.
The city performs relatively well in public and shared transport due to its extensive bus-based transport network operated by KSRTC, which provides broad coverage across urban and peri-urban areas. Public transport services remain affordable and continue to serve as the primary mode of travel for a significant share of the population. Although multimodal integration and real-time information systems require further enhancement, the overall accessibility, affordability and coverage of public transport contribute to the city’s stronger performance under this pillar
The presence of alternative mobility options, including auto-rickshaws and appbased services, provides additional travel choices and enhances last-mile connectivity ensuring mobility access for diverse user groups. While accessibility for persons with disabilities and formal integration of informal-sector activities require further improvement, the overall level of mobility inclusion and affordability contributes to the city’s relatively strong performance in this pillar.
Moderate performance is observed in:
• Active Mobility
• Climate and Environment Sustainability
• Governance, Financing & Monitoring
• Digital Integration
Thiruvananthapuram has undertaken several pedestrian improvement initiatives, particularly under the Smart City Mission, which have enhanced walking conditions along selected corridors and public spaces. However, the continuity and connectivity of pedestrian infrastructure remain inconsistent across the city.
The city has initiated measures to promote sustainable mobility, including the gradual introduction of electric buses and efforts to improve public transport usage. Renewable energy integration within transport infrastructure is still limited and there is significant potential to expand the use of solar and other renewable energy sources.
Thiruvananthapuram benefits from an established institutional framework involving multiple agencies. Coordination among agencies can be further strengthened to support integrated planning and project implementation.
The city has made progress in digital governance and smart city initiatives, creating a foundation for digital mobility management. Data infrastructure and information-sharing mechanisms are improving but require greater standardisation and interoperability. Integration of transport information systems, real-time passenger information and unified mobility platforms would significantly enhance the city’s digital mobility ecosystem.
Relatively lower performance is observed in the following pillars:
• Parking and Travel Demand Management
• Road Safety
These areas require more focused interventions to support the city’s long-term sustainability, safety and mobility objectives.
Parking and Travel Demand Management highlights a critical area for policy and institutional intervention. Although parking regulations and off-street parking facilities exist in selected locations, Thiruvananthapuram currently lacks a comprehensive citywide parking management framework that integrates parking supply, pricing, enforcement and demand management objectives.
Road Safety emerges as a priority area requiring attention. Despite efforts to improve transport infrastructure and traffic management, road crashes continue to pose significant challenges particularly for vulnerable road users such as pedestrians, cyclists and two-wheelers. Need to systematic identification of black spot and its effective management strategies for safer design reducing fatalities and serious injuries through improved enforcement, speed management and planning. Enhancing school zone safety through safer crossings, traffic calming measures and pedestrian infrastructure for safer environment.
To translate the 9 pillars into a measurable and actionable planning framework, Thiruvananthapuram’s mobility system was assessed through a structured indicator-based assessment under the IMP framework. Each pillar was further detailed through a set of indicators that capture different dimensions of the mobility ecosystem, including transport infrastructure, quality and integration of public transport services, active mobility facilities, road safety conditions, climate resilience, environmental sustainability, institutional capacity, financial mechanisms, and the application of digital technologies in mobility planning and management. These indicators were interpreted in the context of Thiruvananthapuram’s urban characteristics, such as population growth, expansion of residential and IT-enabled services, rising vehicle ownership, and the city’s increasing focus on climate resilience and sustainable development.
The assessment considered operational data from KSRTC, Thiruvananthapuram Corporation, field assessments of streets and mobility corridors, stakeholder consultations, and reviews of existing mobility plans and policies. The evaluation was further informed by major planning documents, including the Comprehensive Mobility Plan for Thiruvananthapuram, as well as service benchmarks, implementation progress of ongoing initiatives, and compliance with relevant policy guidelines where applicable.
This structured assessment provides an evidence-based understanding of the city’s mobility ecosystem, identifying infrastructure, service delivery, and institutional gaps while highlighting areas where systems are performing effectively. It establishes a baseline for prioritizing interventions, developing targeted strategies, and formulating phased implementation plans under the Integrated Mobility Plan to support Thiruvananthapuram’s transition towards a more integrated, inclusive, resilient, and environmentally sustainable urban mobility system.
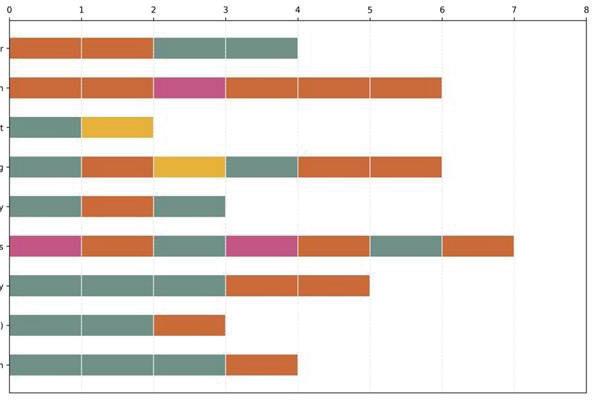
Fig. 19. Pillar wise no of indicators against scores in IMP framework assessment
The above chart presents a detailed interpretation of the number of indicators for each score category under each of the nine thematic pillars. This shows Parking and Travel Demand Management to have the maximum low scores followed by Road Safety.

Thiruvananthapuram possesses a strong foundation to transition toward a more sustainable and integrated urban mobility system. The presence of a wide-reaching KSRTC bus network, suburban railway connectivity, and emerging digital and service innovations provide a strategic starting point for enhancing public transport usage. Existing travel patterns, with most trips being short and regular in nature, indicate high potential for mode shift toward more sustainable options such as buses, IPT, walking, and cycling. As national policies increasingly prioritise low-carbon, inclusive mobility, Thiruvananthapuram is well-positioned to leverage ongoing pilots and infrastructure assets to scale integrated, people-centric solutions that improve access, reduce congestion, and strengthen long-term resilience.
The KSRTC City Circular Service in Thiruvananthapuram represents one of Kerala’s first large-scale intra-city bus initiatives, delivering robust performance and scalability potential as part of broader Multi Modal Integration (MMI) efforts.
Operated by Kerala State Road Transport Corporation, the City Circular service began in November 2021 with 64 buses and seven distinct circular routes. Today, it comprises 13 colour-coded circular routes, over 1,000 bus stops, and 24 designated interchange points, serviced by a fleet of 132 buses including electric vehicles.
The system operates at 15-minute frequency during peak hours and 30-minute headways off-peak, with affordable fares ranging from ₹10 to ₹30. A “Good Day Ticket” priced at ₹50 allows unlimited travel on circular routes for 24 hours.
Early ridership and financial data indicate strong trajectory: daily ridership escalated from around 3,000 passengers to approximately 34,000 per day within months, with projections targeting 50,000 daily users. Revenue increased by nearly 150% in the first 11 months, reaching ₹7.3 crore by November 2022. Monthly collections rose from around ₹32 lakh to ₹82 lakh within a year.
The introduction of e-buses has enhanced operational sustainability. It reduced operating costs to ₹23 per kilometre, while revenue per kilometre stood at ₹35, enabling significant fuel savings estimated at ₹32 lakh in a single month.
• The City Circular model demonstrates that well-planned, intra-city services can generate stable ridership quickly, especially among women, daily commuters, and students.
• The system incorporates best practices aligned with MMI, such as hop-onhop-off fare products, colour-coded route maps, digital trip-planning tools, and interchange nodes, all of which support a user-friendly, integrated mobility experience.
• Its operational success underscores the viability of expanding circular and radial public transport services across the city as feeder services, reinforcing the full public transport network.
Table. 3. Comparative Study of Kochi, Coimbatore, Thiruvananthapuram.
CMP Area: 732 sq.km
Population: 20L (2011 Census)
Mode share:
Public Transport: 27%
Private Transport: 51%
IPT: 7%
NMT: 15%
Fleet:
1027 buses
(1 bus per 1,947 people)
Daily ridership: 1 lakh
(KSRTC) + Private buses
CMP Area: 372 sq.km
Population: 9.7L (2011 Census)
Mode share:
Public Transport: 21%
Private Transport: 55%
IPT: 8%
NMT: 16%
Fleet:
600 buses
(1 bus per 1,617 people)
Daily ridership: 4.2 lakhs
CMC Area: 257 sq.km
Population: 16L (2011 Census)
Mode share:
Public Transport: 43%
Private Transport: 34%
IPT: 9%
NMT: 15%
Fleet:
700 buses
(1 bus per 2,286 people)
Daily ridership: 9 lakhs
Source-Comprehensive Mobility Plan, Kochi draft report 2023, Comprehensive Mobility Plan draft report 2023 & A non-motorised transport network plan for Coimbatore; prepared by GIZ (January 2020)
The comparison above shows that although Thiruvananthapuram has a higher buses-per-capita ratio than cities such as Kochi and Coimbatore, this is not reflected in its public transport mode share, which remains below 21%. This indicates that the challenge is not the availability of buses alone, but the effectiveness with which the overall public transport system is planned, operated, and integrated. An assessment of Thiruvananthapuram’s mobility landscape, including existing plans, infrastructure, and services, indicates that the city possesses the foundational elements required for a robust and reliable public transport system. Within the core urban area, the high-frequency circular bus service has already demonstrated success, resulting in a noticeable shift in travel mode preferences. However, in the outer and peripheral zones, dispersed development patterns have led to inefficient utilisation of the bus network.

Despite having approximately 62 buses per lakh population, Thiruvananthapuram records a bus mode share of less than 21%. In contrast, cities such as Coimbatore achieve a significantly higher modal share with a comparable bus fleet size, suggesting that fleet quantity alone is not a sufficient indicator of system performance. Based on this analysis, two primary gaps in Thiruvananthapuram’s urban transport ecosystem have been identified:
While the state government has made commendable progress in expanding, modernizing, and electrifying the bus fleet over the last decade, these investments have not yielded their full potential due to sub-optimal operational planning. There is an urgent need to rationalize bus routes by increasing service frequencies on high-demand corridors and replacing underutilized routes with lower-capacity alternatives. A detailed route rationalization study, conducted with GIZ support in 2019, offers specific recommendations for immediate implementation (see Project Reports). Additionally, GIZ is supporting KSRTC in enhancing e-bus efficiency through optimized charging infrastructure. Together, these interventions aim to improve overall service efficiency and better align public transport supply with demand in Thiruvananthapuram.
In areas with low population density, a range of informal shared transport services, such as jeep and auto-rickshaw operators, already play a crucial role in meeting mobility needs. However, these services are not integrated with the city’s formal transport systems, including the bus and rail networks. Bridging this gap will require the development of a comprehensive Integrated Mobility Plan, with a focus on improving multimodal integration.
The proposed interventions in the IMP focus on addressing the core issue of multimodal integration in detail in subsequent chapters, outlining strategies to harmonize services and enhance connectivity across modes.

Multimodal integration aims to create seamless connections between different modes of transport, enabling users to complete their journeys efficiently using a combination of walking, cycling, public transport, and intermediate public transport services. By reducing transfer times, improving accessibility, simplifying information and ticketing systems, and enhancing first- and last-mile connectivity, multimodal integration makes public transport a more attractive and competitive mode choice compared to private vehicles.
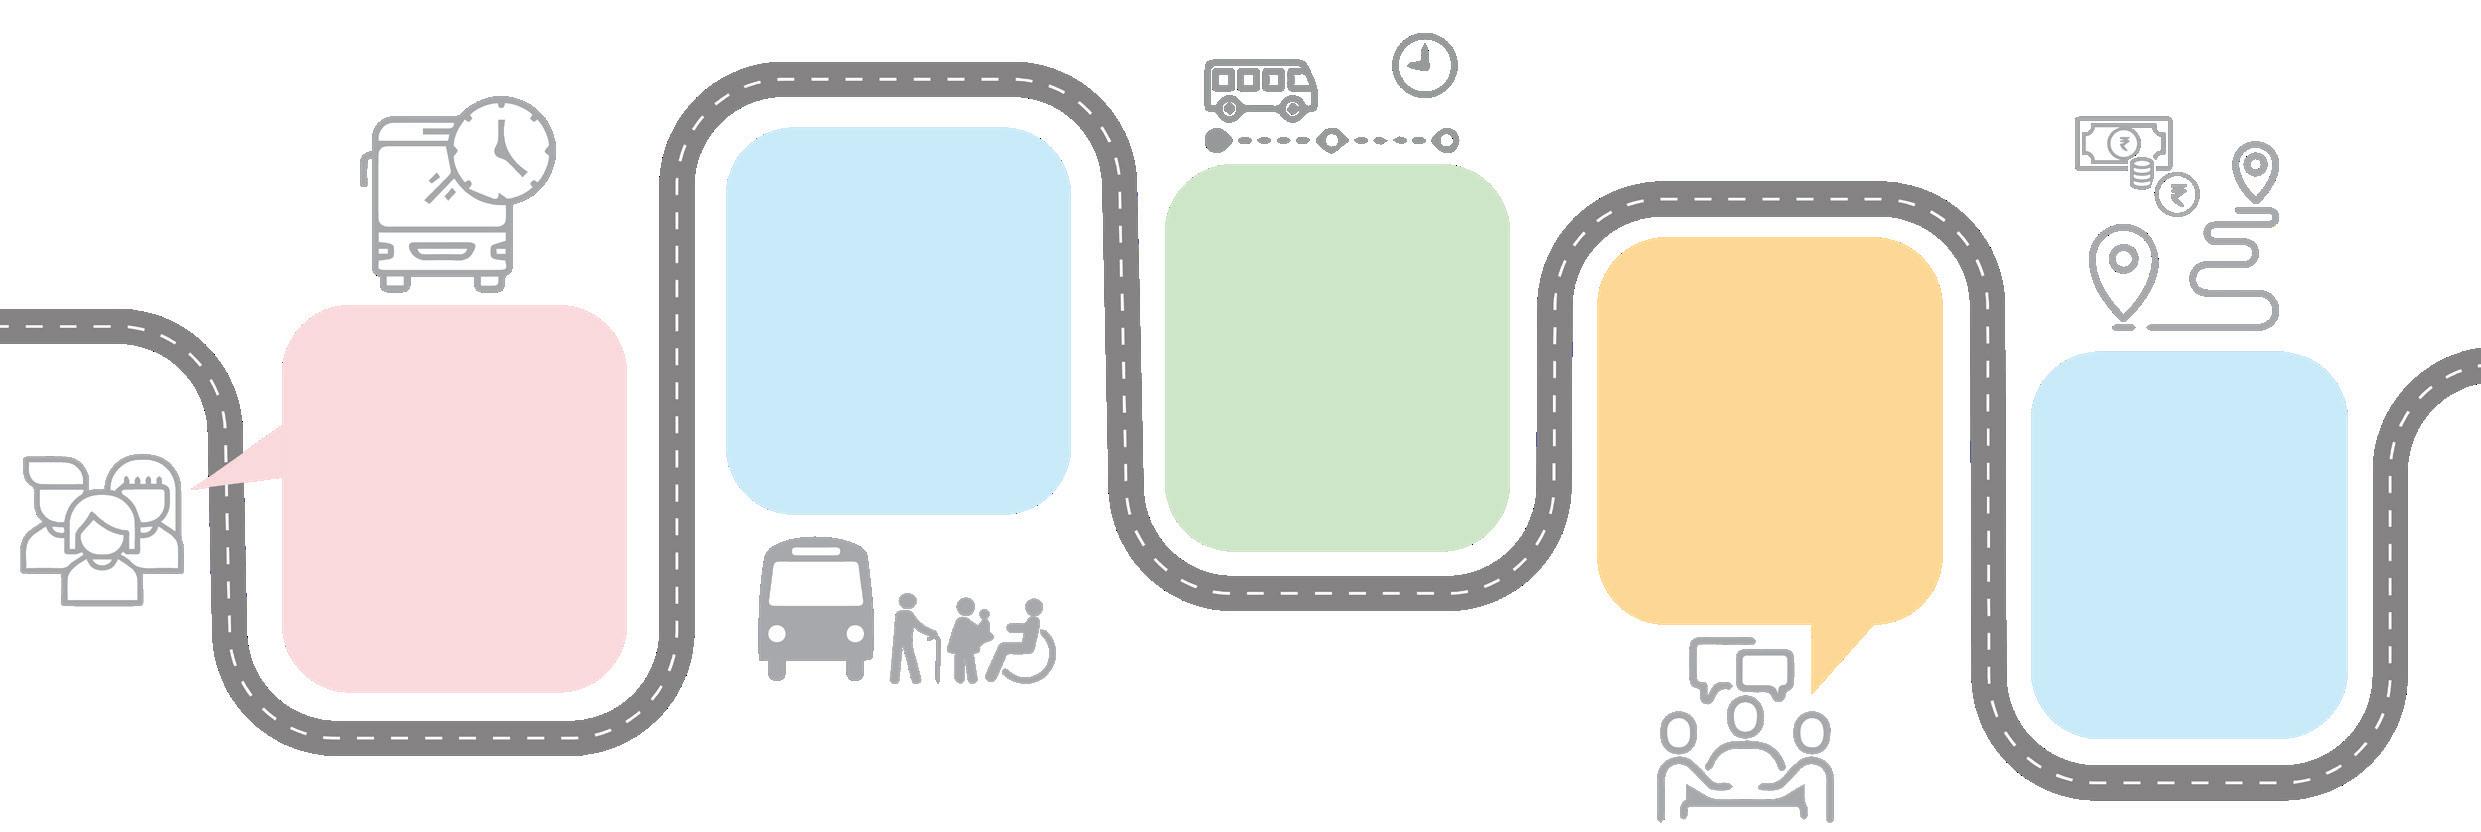
Reliability
Reliable public transportation is crucial for getting people to work, school, and appointments on time.
Inclusivity
Public transport should strive to be inclusive, catering to diverse needs and abilities, to foster a more equitable society
On-time public transportation is vital for reducing wait times, increasing productivity, and enhancing overall travel experiences
Safety
Public transportation should ensure passenger security, regardless of time of day or route.
Affordability
Affordable fares are critical for making public transportation a realistic alternative to private vehicles
Understanding what drives commuter decisions is essential to developing an effective multimodal transport strategy. The success of an integrated mobility system ultimately depends on whether it addresses the factors that influence mode choice. Commuters select travel modes based on a variety of practical, emotional, and contextual considerations.
First among these is the seamlessness of the travel experience. Commuters are more likely to use public transport if transitions between modes are smooth and do not involve excessive walking, waiting, or confusion. Quick and convenient transfers increase the perceived efficiency of the system and reduce travel fatigue.
Ease of access also plays a substantial role in determining mode choice. If transit stops are not easily reachable, particularly from residential and commercial areas, users are more likely to rely on personal vehicles. Prioritizing pedestrian-friendly design and universal accessibility ensures that all users can comfortably reach the nearest transit point. Supporting sustainable modes around these stops, such as walking and cycling, can further encourage a shift towards public transport. Another key factor is the reliability and attractiveness of the system. People need to trust that services will arrive on time, be safe, and offer a reasonably comfortable experience. This includes vehicle cleanliness, personal security, real-time information, and respectful conduct. Public perception of safety, particularly among women and senior citizens, often determines whether public transport is used regularly. Commuters are
also sensitive to cost. If a journey is expensive or requires multiple tickets across different modes, public transport becomes less viable for daily use. Affordability, reliability, efficiency, and seamless integration are therefore essential factors in shaping commuter behaviour and encouraging greater use of public transport.
The successful implementation of Multimodal Integration in Thiruvananthapuram must be guided by a set of core principles that reflect the needs and expectations of everyday commuters. At the heart of MMI is the idea of seamless integration. A commuter should be able to travel across multiple modes—whether by bus, auto-rickshaw, or cycle—without facing disconnects, inefficiencies, or confusion. This seamlessness must extend to both physical infrastructure and the travel experience itself.

Seamless Quick Ease of Mode Reliability & Integration Transfer Access Priority attractivness
Enable seamless journey experience for commuters through integrated ticketing and information.
Enable quick and easy transfer between multiple modes facilitated by limited conflict
Provide ease of access to the transit stop facilitated through universal accessibility in the catchment area.
Prioritize facilities for sustainable modes of transport over private modes in the transit stop vicinity. Ensure reliability of services and infrastructure quality.
Transfers between modes should be quick and easy, with minimal conflict and reduced waiting time. Stops and interchange points must be located conveniently, with well-planned layouts that eliminate unnecessary walking or delays. Ease of access is also crucial. This means designing transit infrastructure that is universally accessible, especially for children, the elderly, and people with disabilities. Within the vicinity of transit stops, sustainable modes such as walking and cycling should be prioritized over private vehicles to promote a healthier and more environmentally friendly commuting culture.
The system must also guarantee reliability—both in terms of service frequency and infrastructure quality—so that users can plan their day with confidence. Safety is paramount, not just in vehicles but across the entire commuting environment, including bus stops, footpaths, and transfer points. Public transport must be on time, consistent, and predictable to reduce uncertainty and travel stress. It must also be inclusive, catering to all sections of society and addressing diverse mobility needs. Lastly, affordability remains a foundational pillar; if public transport is not economically accessible to all, it cannot succeed as a democratic or widely adopted mode of mobility. These principles collectively ensure that the integrated system is not just functional, but truly user oriented.
To translate the vision of an integrated public transport system into reality, a series of practical recommendations have been formulated under the framework of Multimodal Integration. These include targeted interventions across five core domains: physical integration, operational coordination, fare alignment, institutional reform, and information systems. Each domain plays a crucial role in transforming fragmented transport services into a unified, user-centric network.
These recommendations collectively aim to reduce the friction in travel experience, particularly at modal transition points, while improving service quality and governance. The goal is to create a mobility system where the journey from door to destination is not broken up by inconvenience, cost barriers, or unsafe conditions. When implemented in synergy, these recommendations lay the foundation for a well-connected, accessible, and inclusive city.
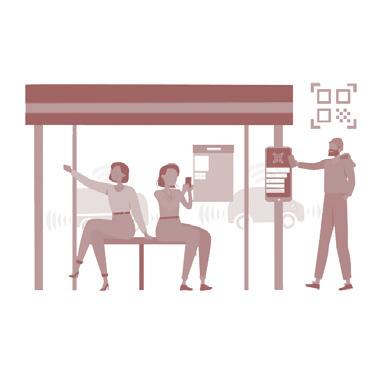
Bus Stop Infrastructure
• Provision of bus shelter with adequate conditions that meet the passenger demand.
• Provision of signages or maps at the bus stops.

Non Motorised Transport Intermediate PublicTransport Parking and Drop-off zones
• Provision of Pedestrian crossings close to the bus stop and the adequate footpaths supporting pedestrian movement
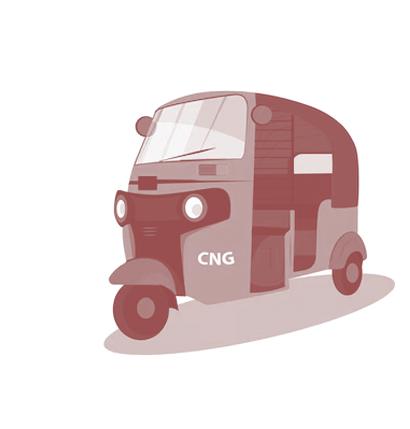
• Dedicated IPT stops supporting first mile and last mile connectivity.
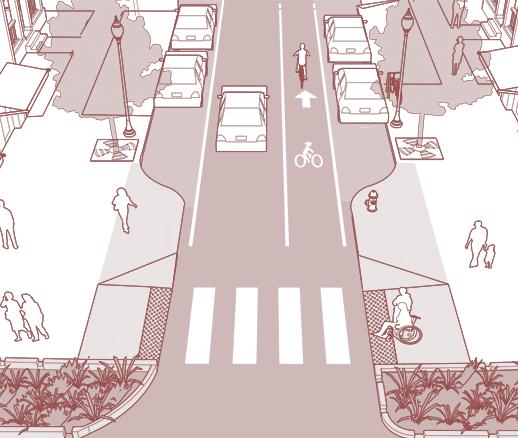
• Designated Parking and Drop off zones.
Physical integration begins at the most visible level of the transport ecosystem: the infrastructure that supports and connects various modes. In Thiruvananthapuram, many bus stops lack basic amenities or are not designed to accommodate the volume and diversity of users. A high priority must be given to upgrading bus shelters with adequate seating, shelter from weather, proper lighting, and real-time information displays. These improvements make waiting areas safer and more comfortable for all passengers.
Equally important is the provision of clear signages and route maps at every bus stop. When commuters can quickly understand which bus to take and where it goes, the perceived complexity of public transport is significantly reduced. Pedestrian safety must also be addressed. Well-designed pedestrian crossings, continuous footpaths,
and universal accessibility features like ramps and tactile paving are critical to enabling safe and independent access to transit points.
The integration of IPT services into this ecosystem is essential. Dedicated stops for autos and e-rickshaws located near bus terminals create smoother first- and last-mile connectivity. Designated parking and drop-off zones further reduce traffic conflicts and help organize movement at busy nodes. Together, these interventions create a cohesive public realm that supports a seamless mobility experience.
• Integration of IPT infrastructure and Bus Routes for better connectivity.
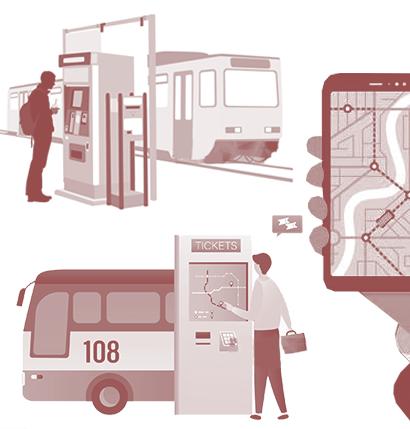
• Reorganization of PT and IPT route system to avoid overlap and eliminate competition.
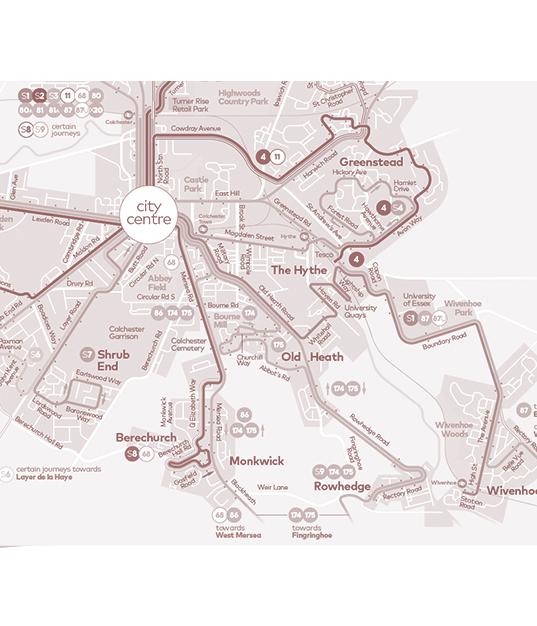
• Dedicated IPT stops supporting first mile and last mile connectivity.
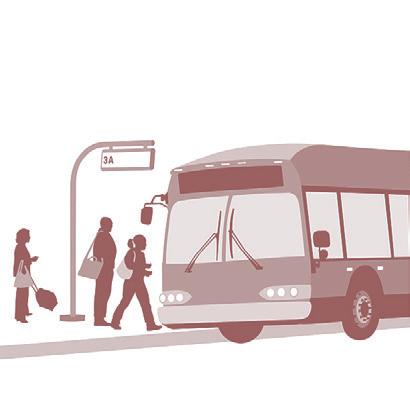
• Altered Bus colours and route numbers for ease in identification. Various typologies like feeder lines, Circular bus, Trunk line.
Operational efficiency is one of the most critical aspects of an integrated system. In its current state, Thiruvananthapuram’s public transport network suffers from overlapping routes, uncoordinated services, and unhealthy competition between modes. To address this, a thorough reorganization of both public and intermediate routes is necessary. Services should be structured around a clear hierarchy: trunk lines that connect major corridors, feeder lines that provide access to neighbourhoods, and circular routes that serve intra-zone movement.
This structure enables better resource allocation and more predictable schedules. Color-coded buses and route numbering systems will help commuters easily distinguish between different types of services. Intermediate public transport services such as autos should not compete with buses on the same routes but instead provide complementary last-mile connectivity.
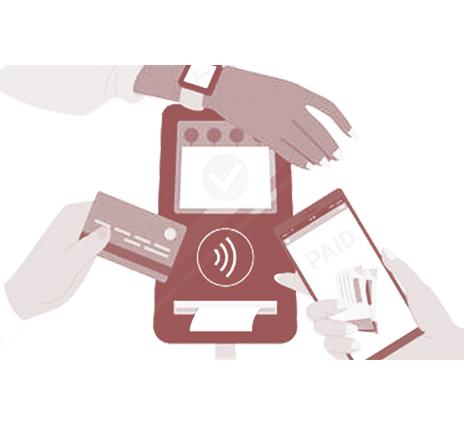
Equally important is the simplification of fare systems. Introducing a single-journey ticket that covers multiple modes can greatly enhance the travel experience. Manual ticketing should be phased out in favour of smart cards, digital QR codes, and mobile payment options. This not only reduces boarding time but also allows for more accurate data collection and financial transparency. Fare integration enables users to move fluidly across modes without worrying about multiple payments or inconsistent pricing.
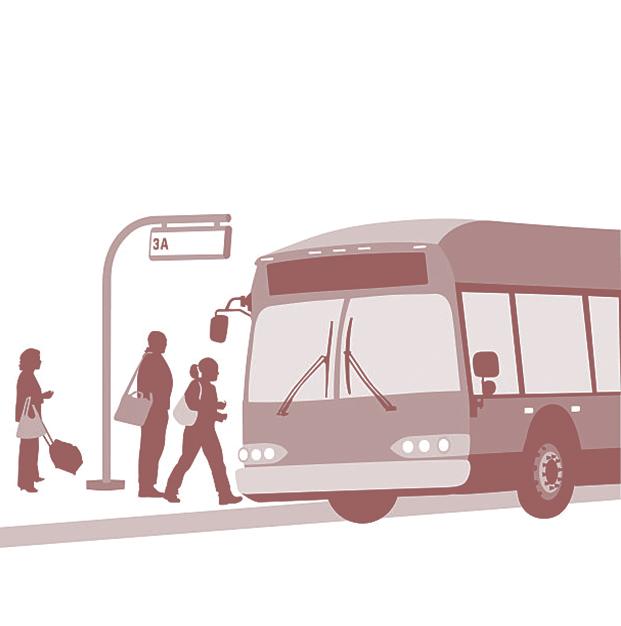
• Reorganization of PT and IPT route system to avoid overlap and eliminate competition.
• Dedicated IPT stops supporting first mile and last mile connectivity.
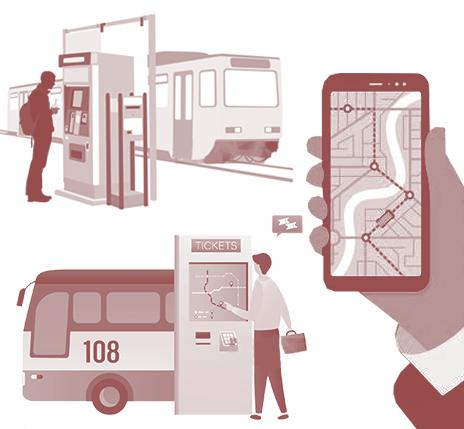
• Altered Bus colours and route numbers for ease in identification. Various typologies like feeder lines, Circular bus, Trunk line.
The fragmentation of responsibilities among multiple transport authorities and operators has long been a barrier to systemic reform in Indian cities, and Thiruvananthapuram is no exception. Institutional integration involves bringing all relevant stakeholders—public, private, and informal—under a shared governance framework. This enables better alignment of goals, reduced duplication of services, and more coordinated policy implementation.
The formalization of various public transport sectors is an essential step in this process. Intermediate public transport providers, such as auto-rickshaws, must be recognized as part of the official network and integrated through licensing, shared platforms, and route coordination. Institutional synergy not only enhances commuter experience but also ensures financial sustainability by optimizing resource use and reducing administrative overheads.
Simultaneously, a strong information integration strategy must be implemented. Real-time updates on transport modes, schedules, and delays should be made available through mobile applications, display boards, and physical maps at transit stops. Encouraging the use of smart ticketing systems further simplifies travel and reduces cash dependency. Together, institutional and information integration build a transit system that is transparent, efficient, and responsive to user needs.
This section details the daily commute of a person from Nemom to Palayam, with an interchange at Thampanoor. The report covers the time and cost associated with each segment of the trip, as well as the available conveyance options. The journey primarily involves a bus ride with first and last mile to reach the bus stop and destination.
A typical journey using public transport in Thiruvananthapuram involves multiple uncoordinated steps, often requiring a combination of walking, auto-rickshaws, and buses. Commuters must frequently depend on personal judgement or enquiry for bus timings, face long waiting periods, and make one or more interchanges before reaching their destination. First- and last-mile connectivity is often inadequate, leading to reliance on auto-rickshaws, which increases the overall cost of travel. In the example journey illustrated, a commuter spends approximately ₹80 per trip, comprising ₹30 for first-mile auto-rickshaw access, ₹20 for the bus journey, and ₹30 for last-mile connectivity. For regular commuters making two trips per day, this translates to approximately ₹160 per day, highlighting the significant contribution of first- and last-mile travel costs to the overall journey expense.
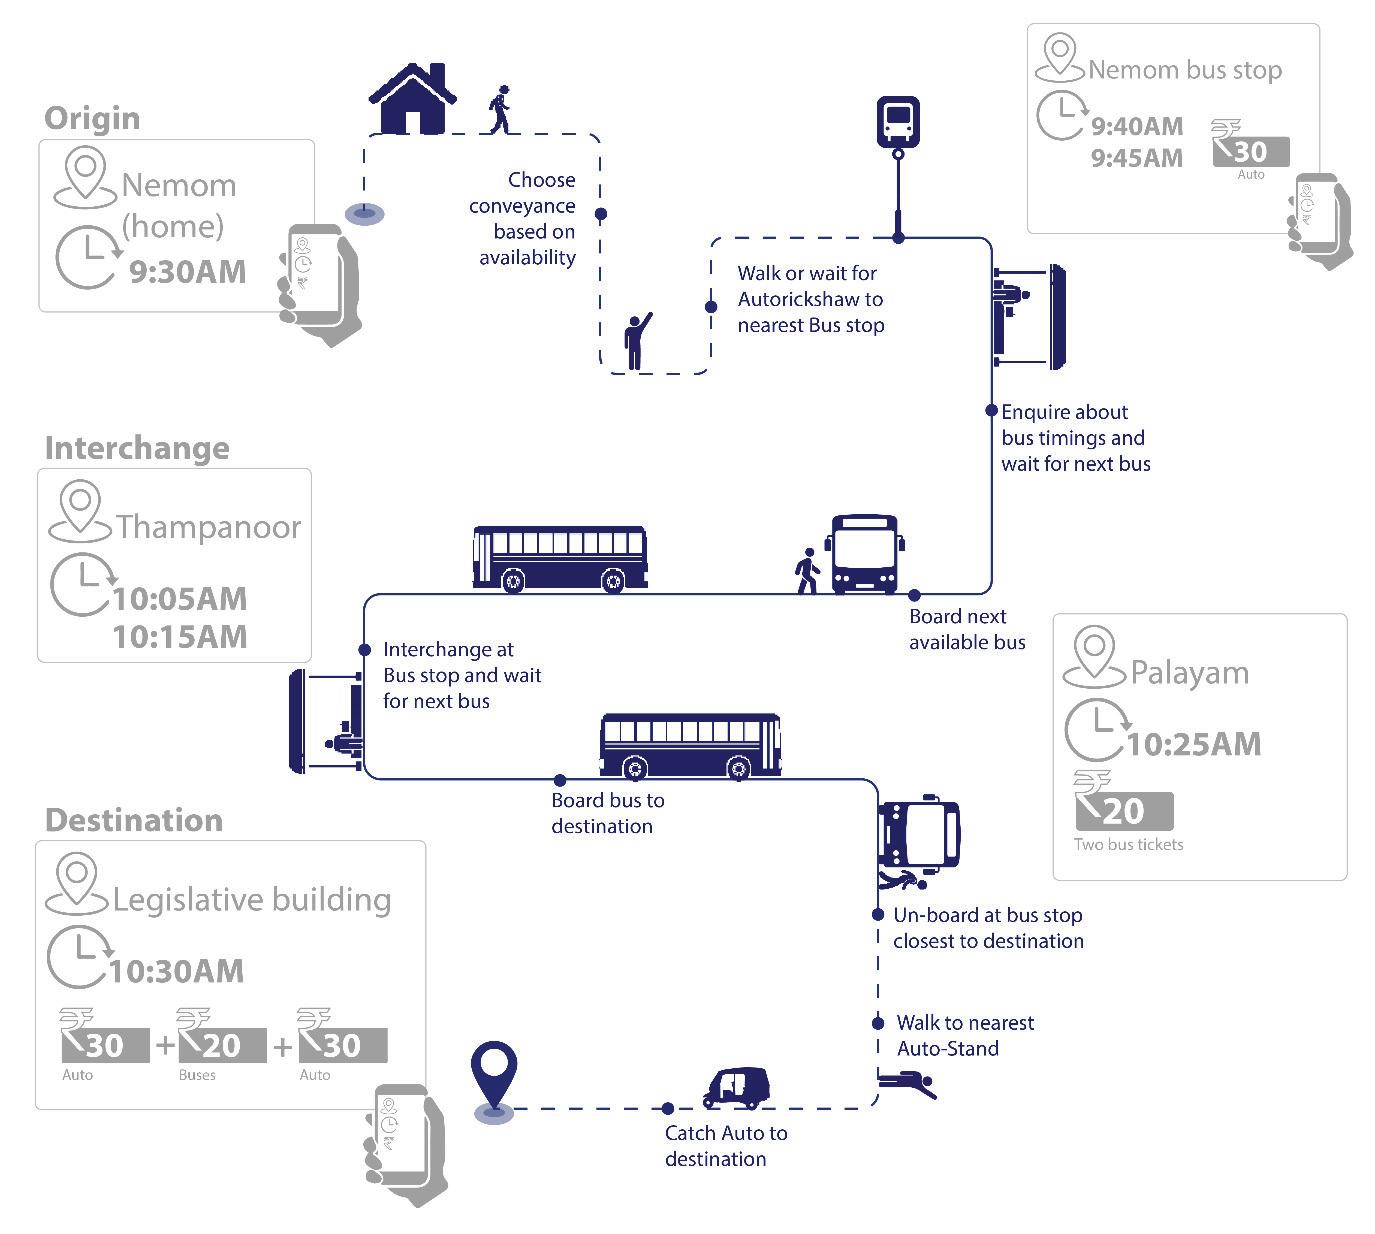
The lack of real-time information, seamless ticketing, and coordinated transfers makes the journey time-consuming and inconvenient, discouraging regular use of public transport.
An integrated mobility system that improves first- and last-mile connectivity and enables integrated fare structures across modes has the potential to reduce both the financial and time burden on commuters, making public transport a more attractive alternative to private vehicles.
To enhance the commuter experience and encourage greater use of public transport, several innovative strategies can be implemented:
Personalized Journey Recommendations: Mobile applications can play a pivotal role in providing tailored journey advice for passengers. By leveraging real-time data and advanced algorithms, these apps can offer personalized travel recommendations, including the most efficient routes, real-time updates on delays, and alternative options in case of disruptions. This functionality ensures a seamless and user-friendly travel experience, reducing the stress and uncertainty often associated with commuting.
First mile
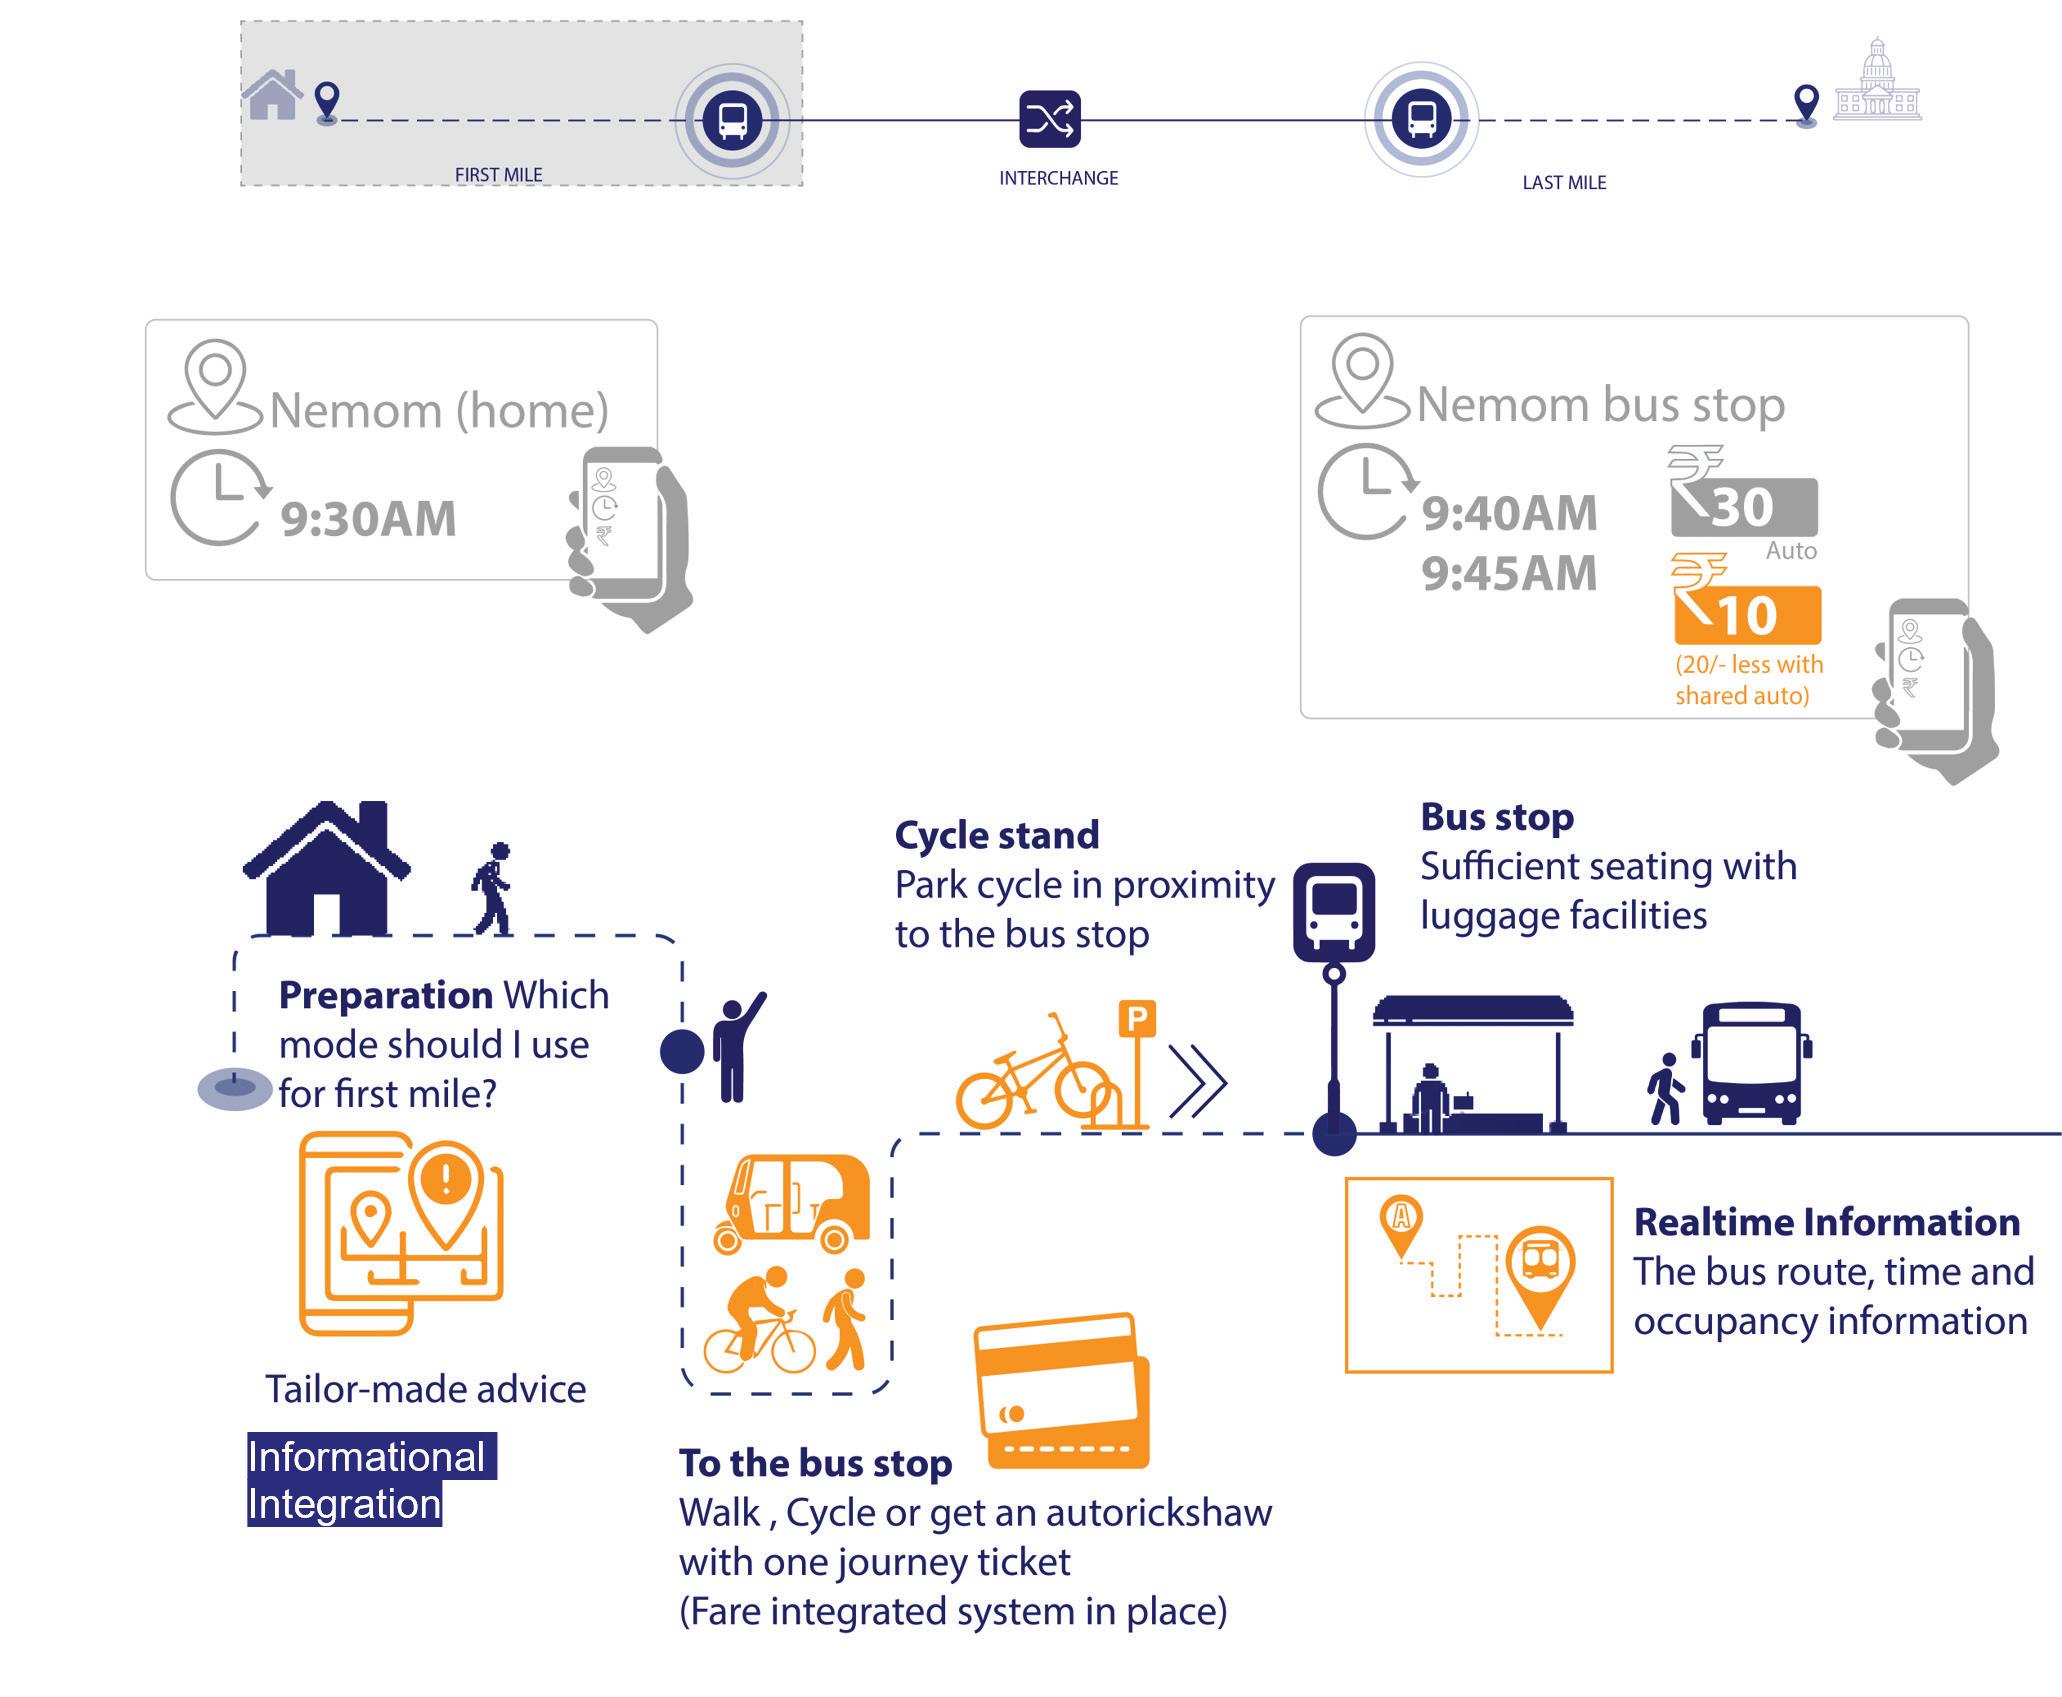
Introducing a unified ticketing system that encompasses various modes of public transportation can significantly benefit passengers. By offering a single ticket that covers multiple transit options, including buses, trains, and shared mobility services, passengers can enjoy a streamlined payment process and benefit from integrated fare structures. For example, the illustrative journey described earlier, which currently costs approximately ₹80 per trip, could potentially be reduced to around ₹35 through a combination of integrated fares, greater use of shared mobility options, and discounted transfers between modes. This could include a ₹15 bus fare and a ₹10 shared auto-rickshaw fare for each first- and last-mile segment. Such an integrated approach simplifies the travel experience, lowers commuting costs, and makes public transport a more attractive and competitive alternative to private vehicle use.
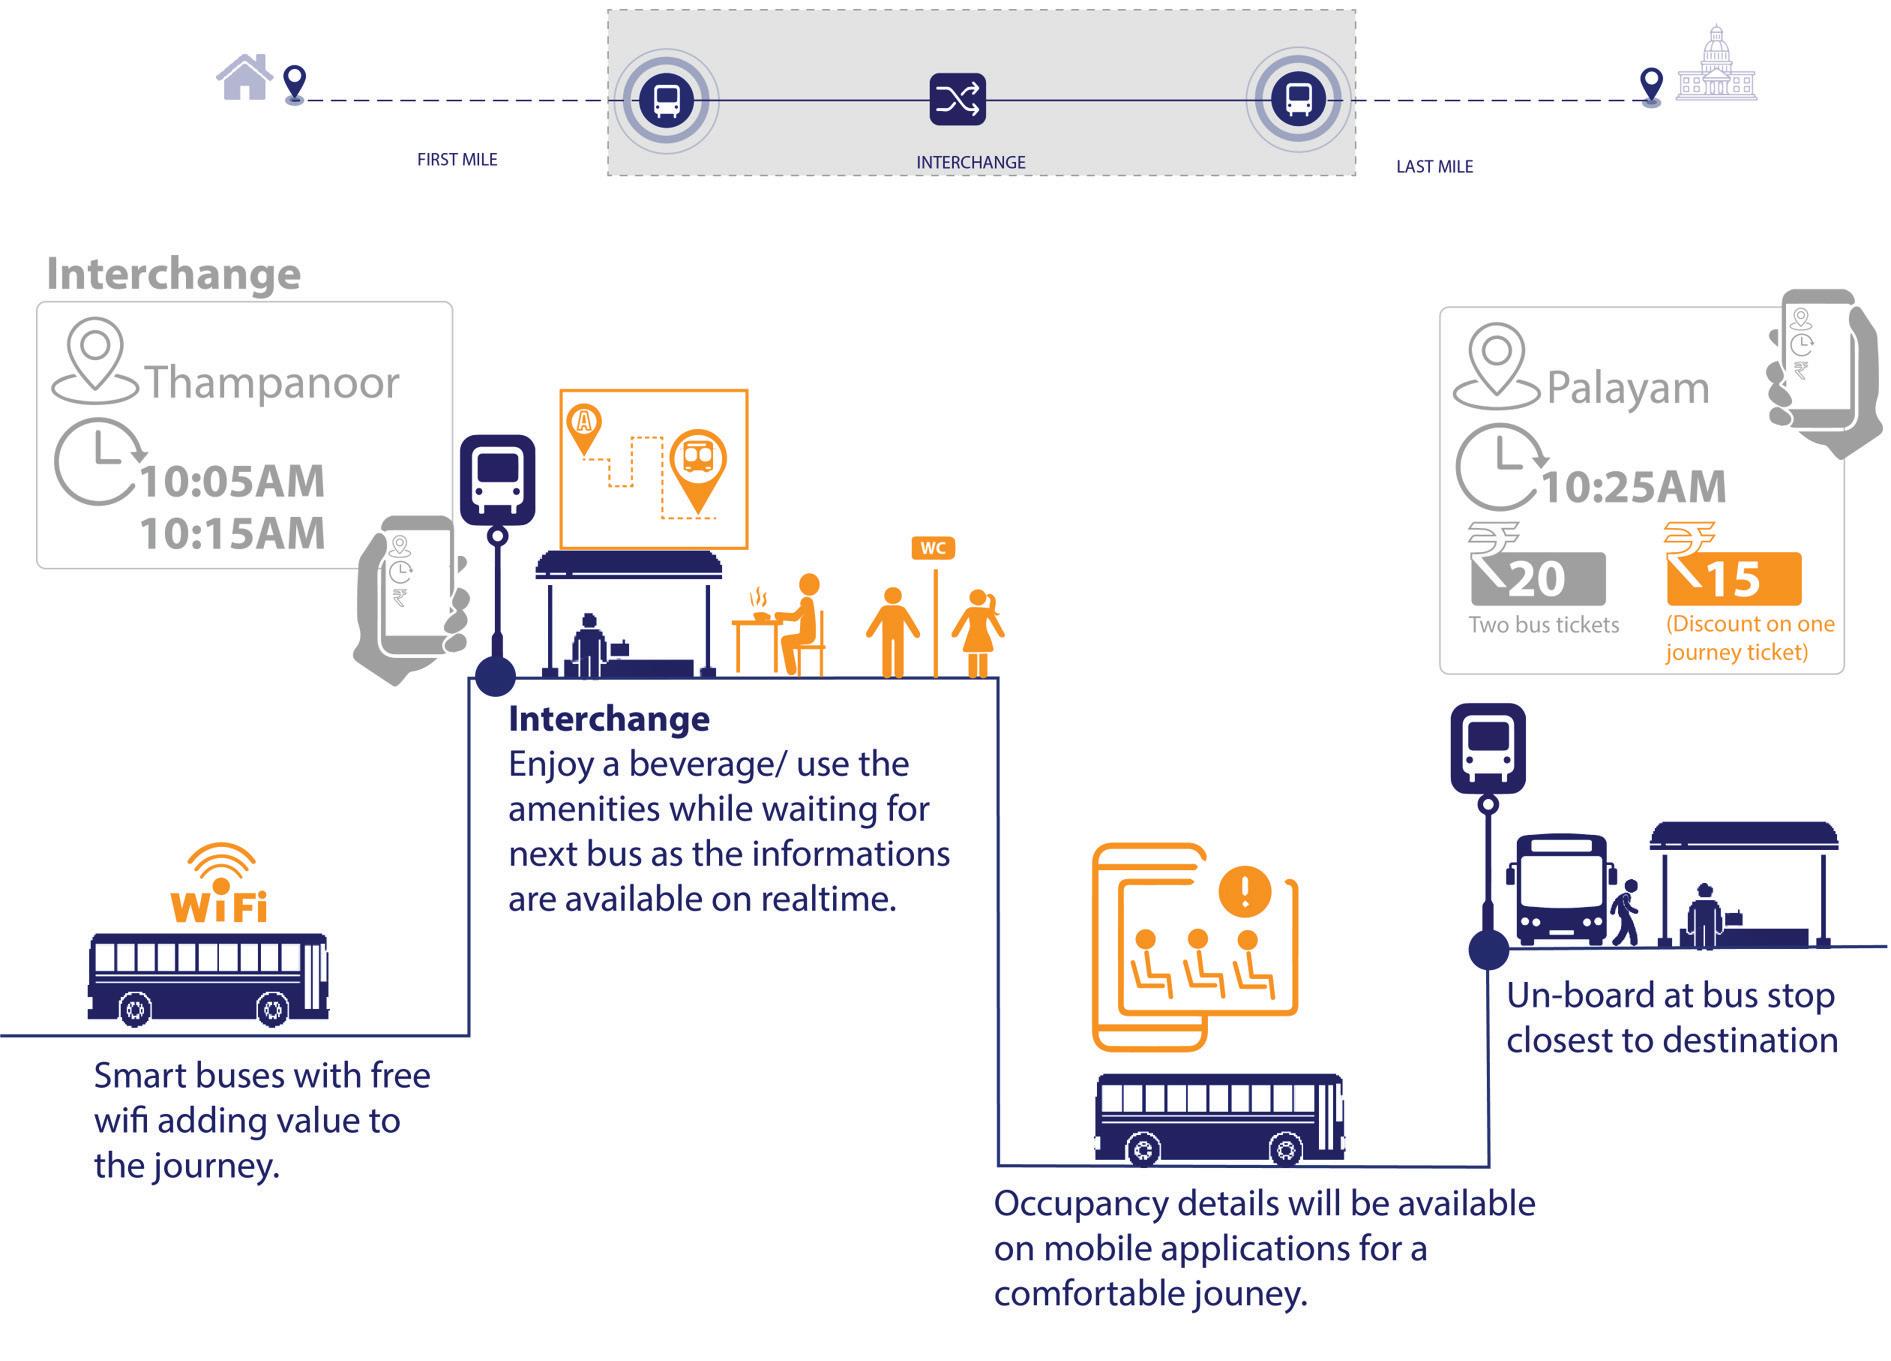
Last Mile
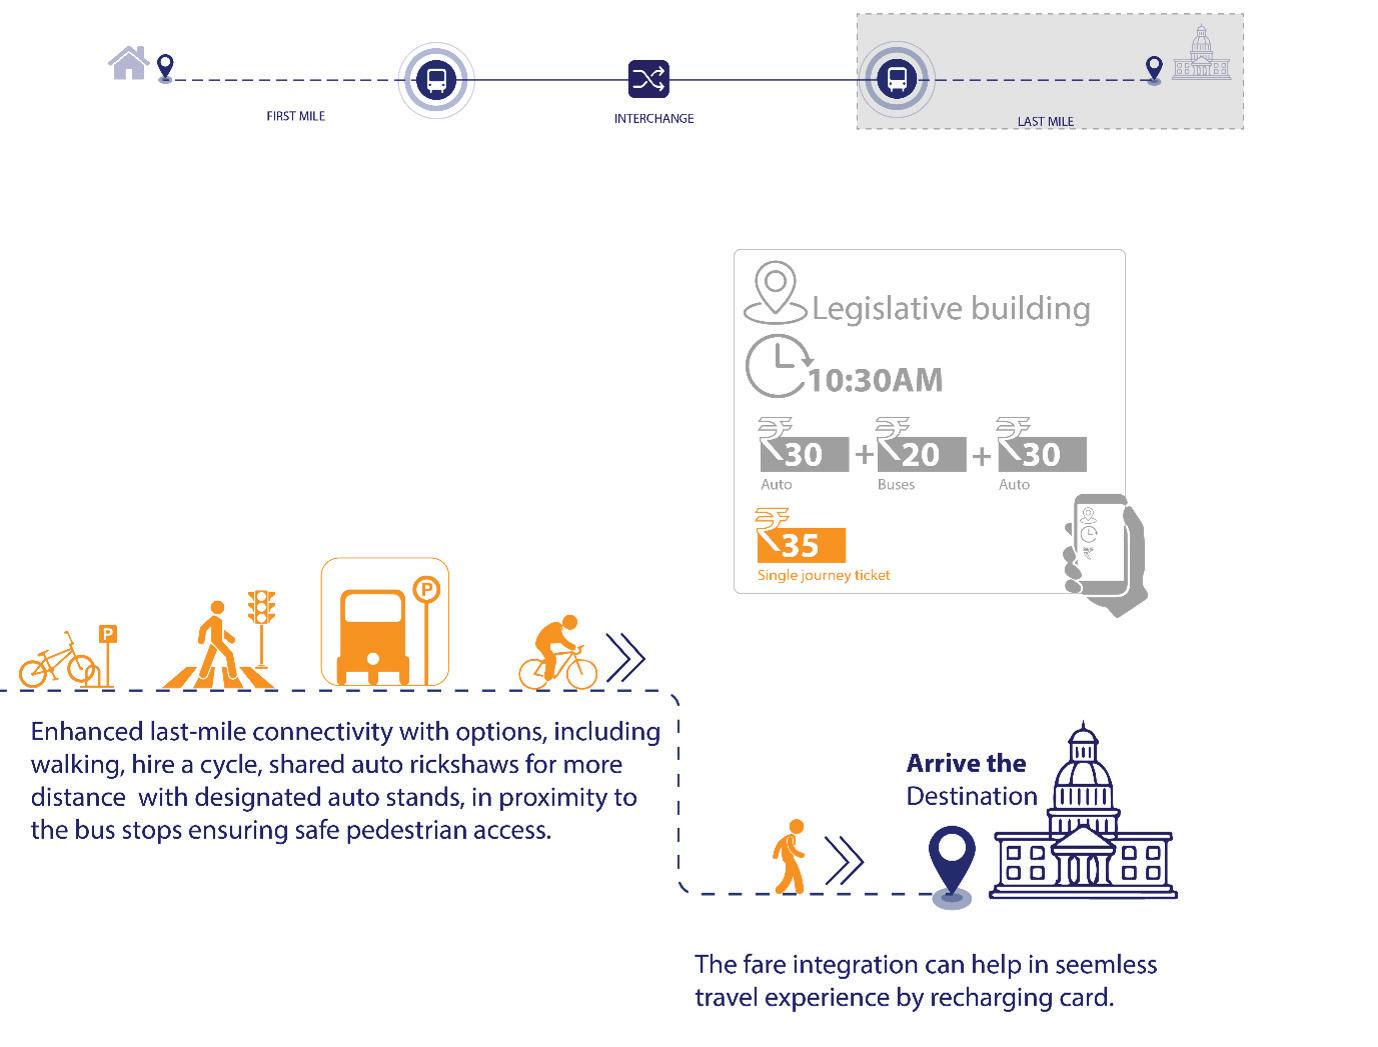
An assessment of Thiruvananthapuram’s public transport network indicates that the city’s primary mobility challenge is not the absence of public transport coverage, but the uneven distribution of service levels and weak integration between transport modes. While the city core is supported by a dense network of bus routes, walkable access, and high passenger demand, peripheral areas experience lower service frequencies and greater dependence on informal transport services for first- and last-mile connectivity.
Thiruvananthapuram’s bus network is largely radial in structure, with approximately 75% of routes originating from either East Fort or Thiruvananthapuram Central. As
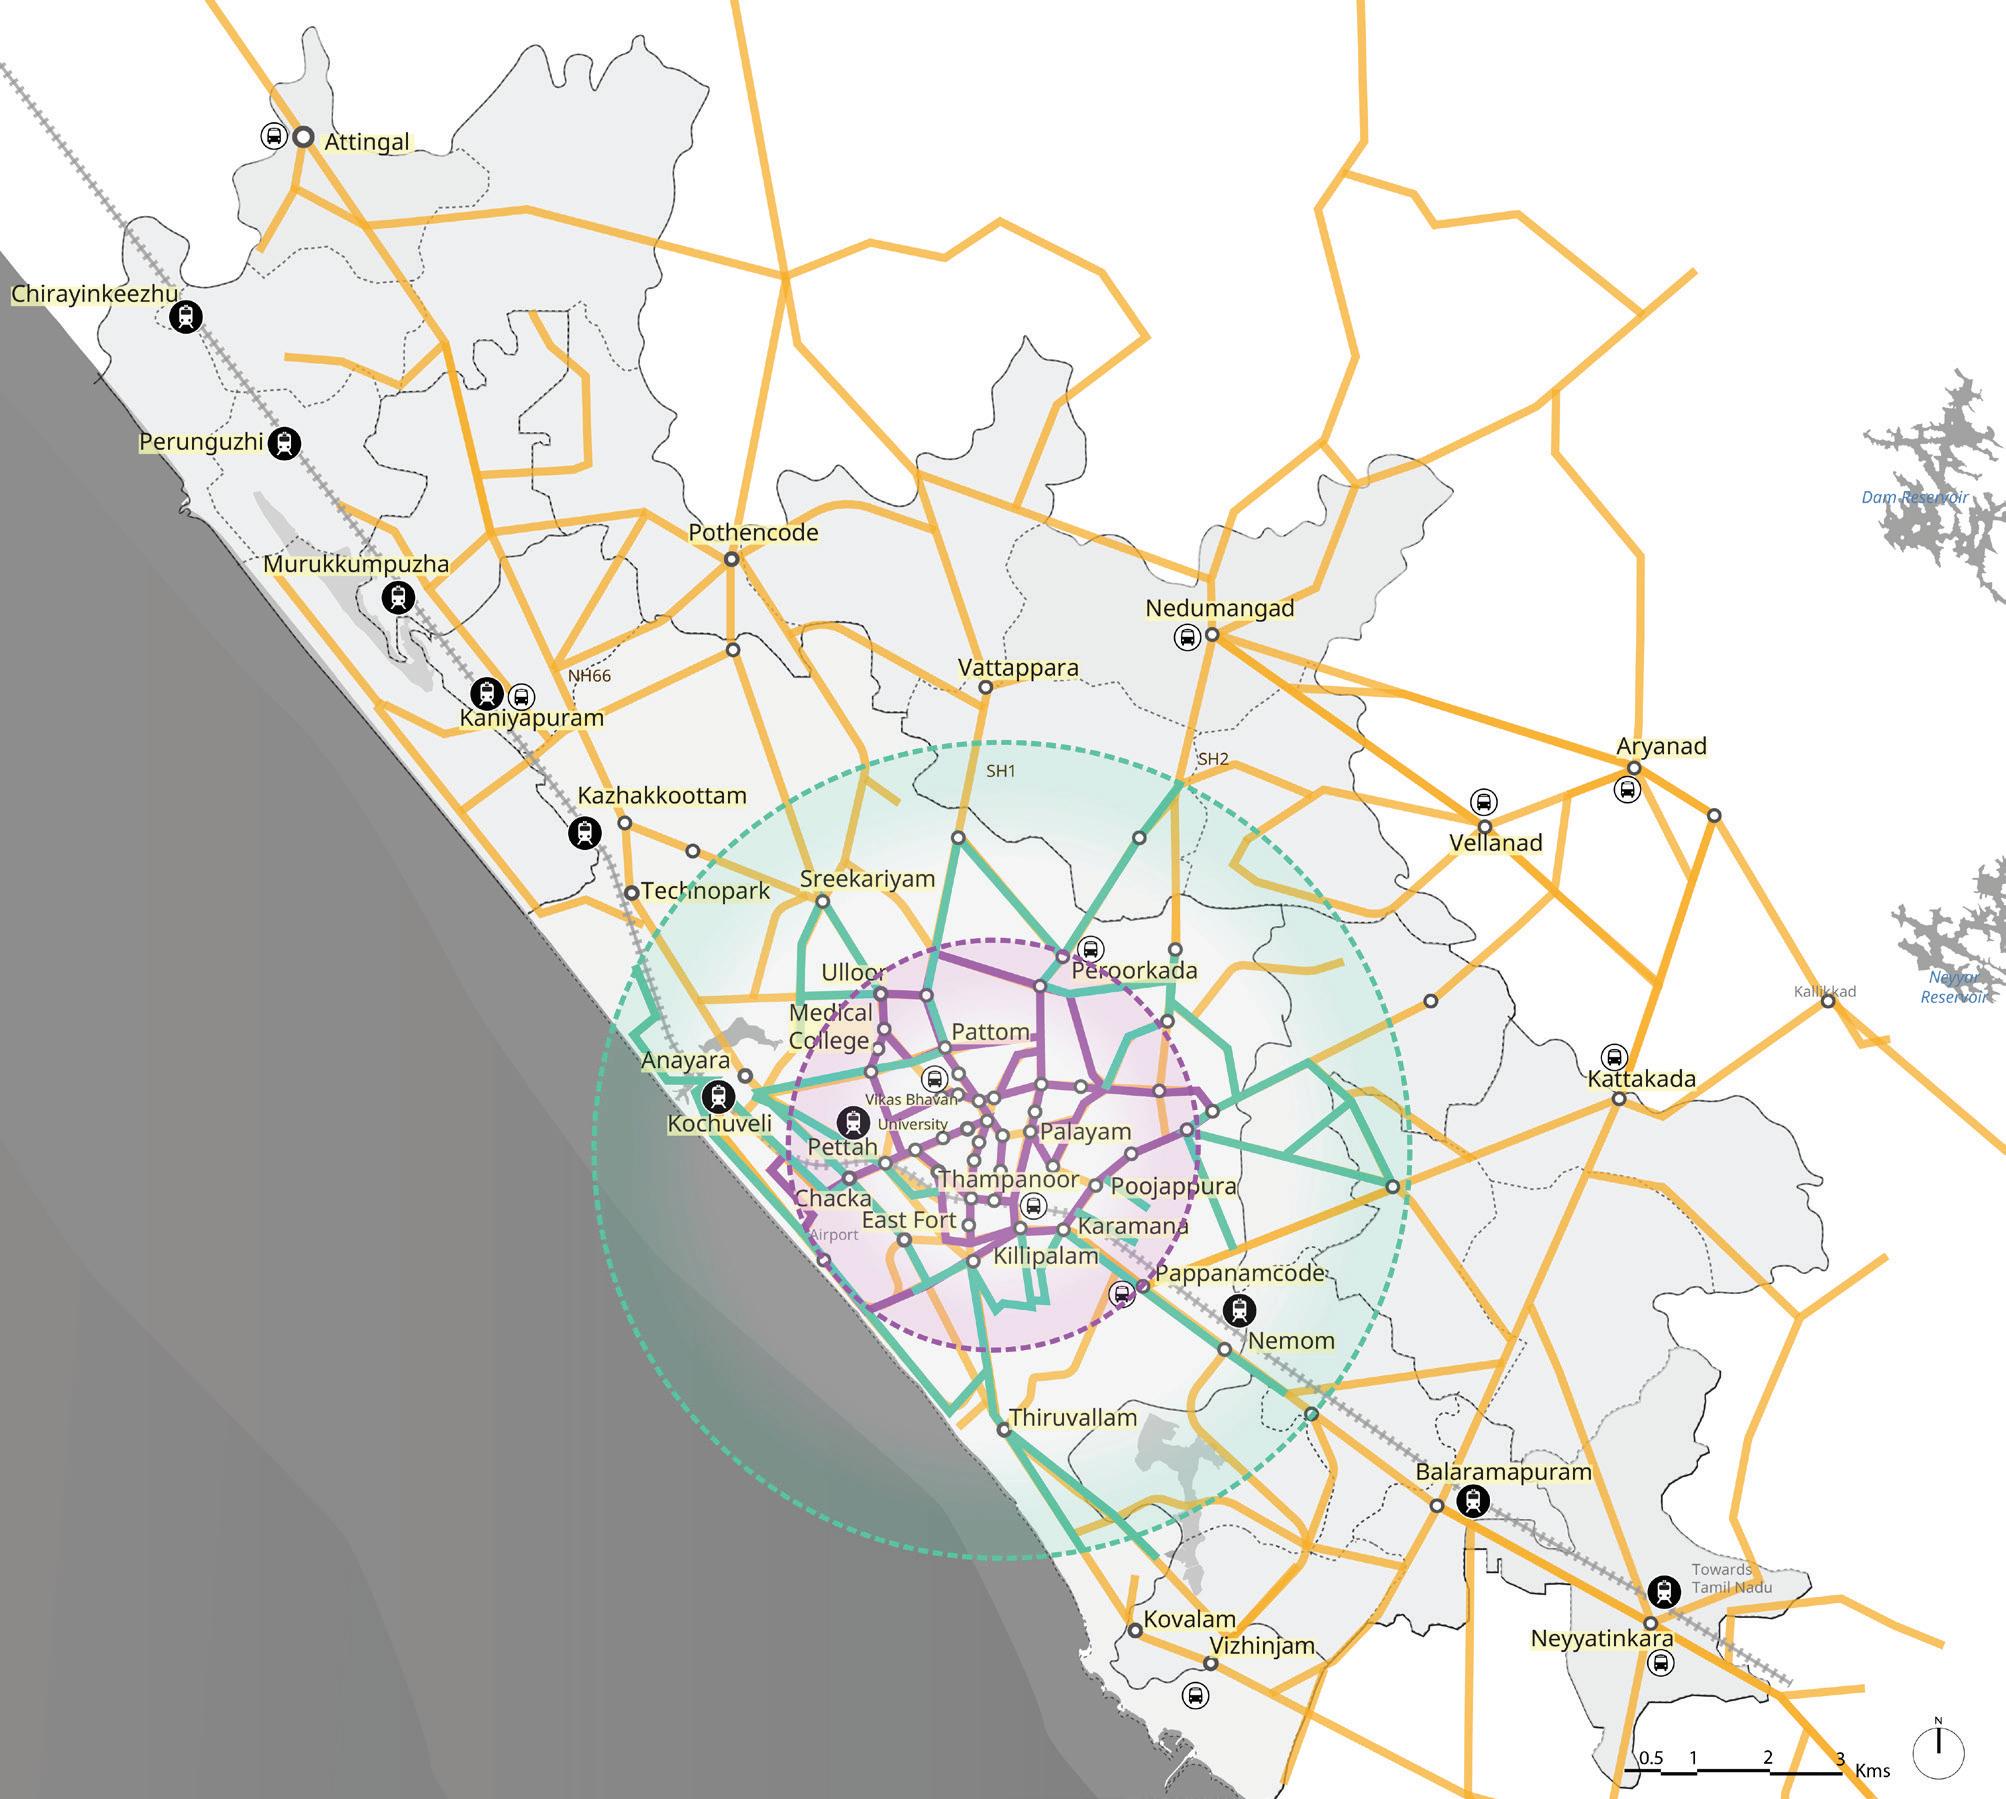
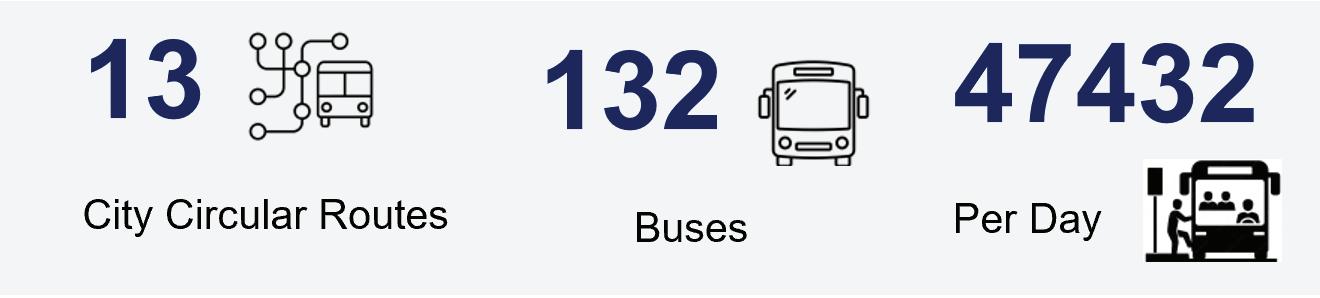
a result, route density and service availability are concentrated within the city core, creating a highly centralized public transport system.
The average peak-hour headway across the network is approximately 10 minutes. However, service levels vary considerably across the city. Areas served by the City Circular Service benefit from relatively frequent operations, while medium- and low-proximity zones experience significantly lower service frequencies. Analysis indicates that more than 319.7 km of the network within the CMP area operates with headways greater than 30 minutes, reducing the attractiveness and reliability of public transport for many residents in peripheral areas.
The concentration of public transport services closely mirrors the distribution of population density and street network connectivity. The city core is characterized by a dense street network, higher population densities, closely spaced bus stops, and a
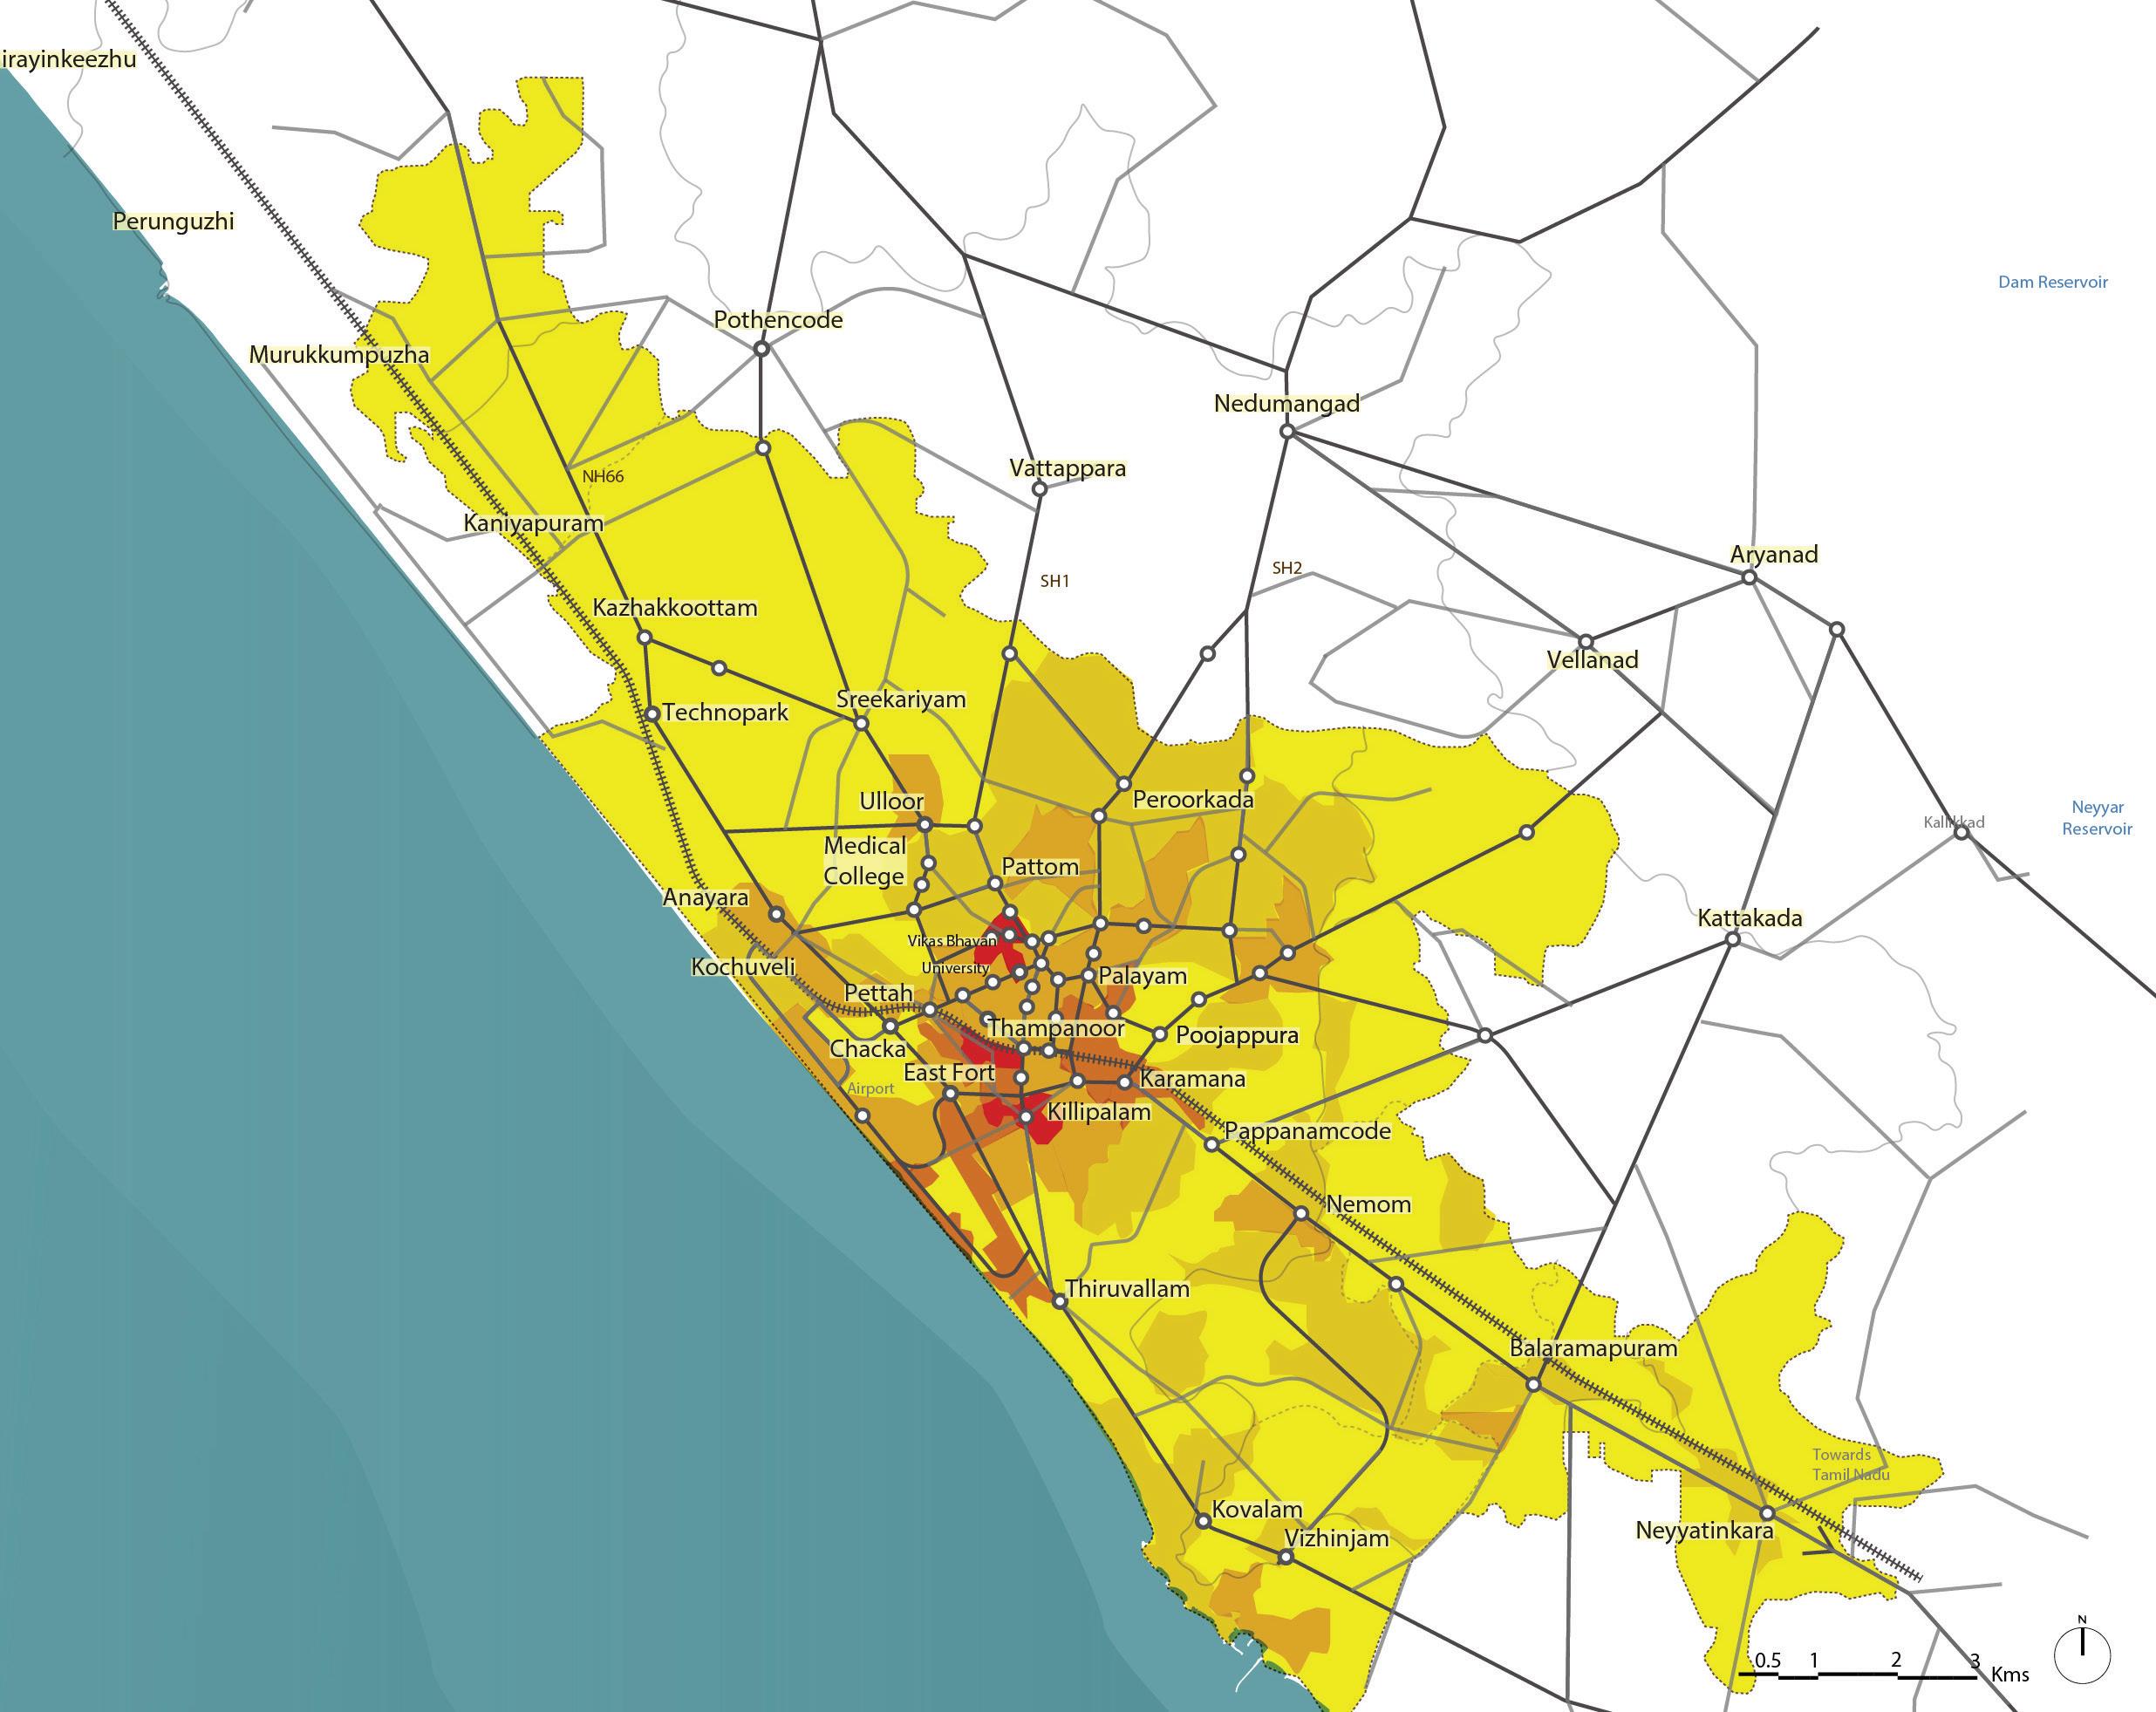
concentration of major employment, education, and commercial destinations. These conditions make walking a viable and convenient first- and last-mile mode for most public transport users.
Passenger intensity data further reinforces this pattern, with the highest ridership observed within central areas where service frequencies are greatest. This suggests that maintaining high-frequency bus services in the city core remains operationally and financially rational for KSRTC.
In contrast, the medium- and low-proximity zones have lower population densities, fewer bus stops, and wider spacing between transit services. As distance from the city centre increases, walking becomes a less practical option for accessing public transport, creating a greater need for feeder services and multimodal connectivity solutions.
The analysis highlights the important role played by Intermediate Public Transport (IPT) services in addressing gaps in public transport accessibility, particularly outside the city core. Auto-rickshaws, shared vans, private jeeps, and app-based mobil-
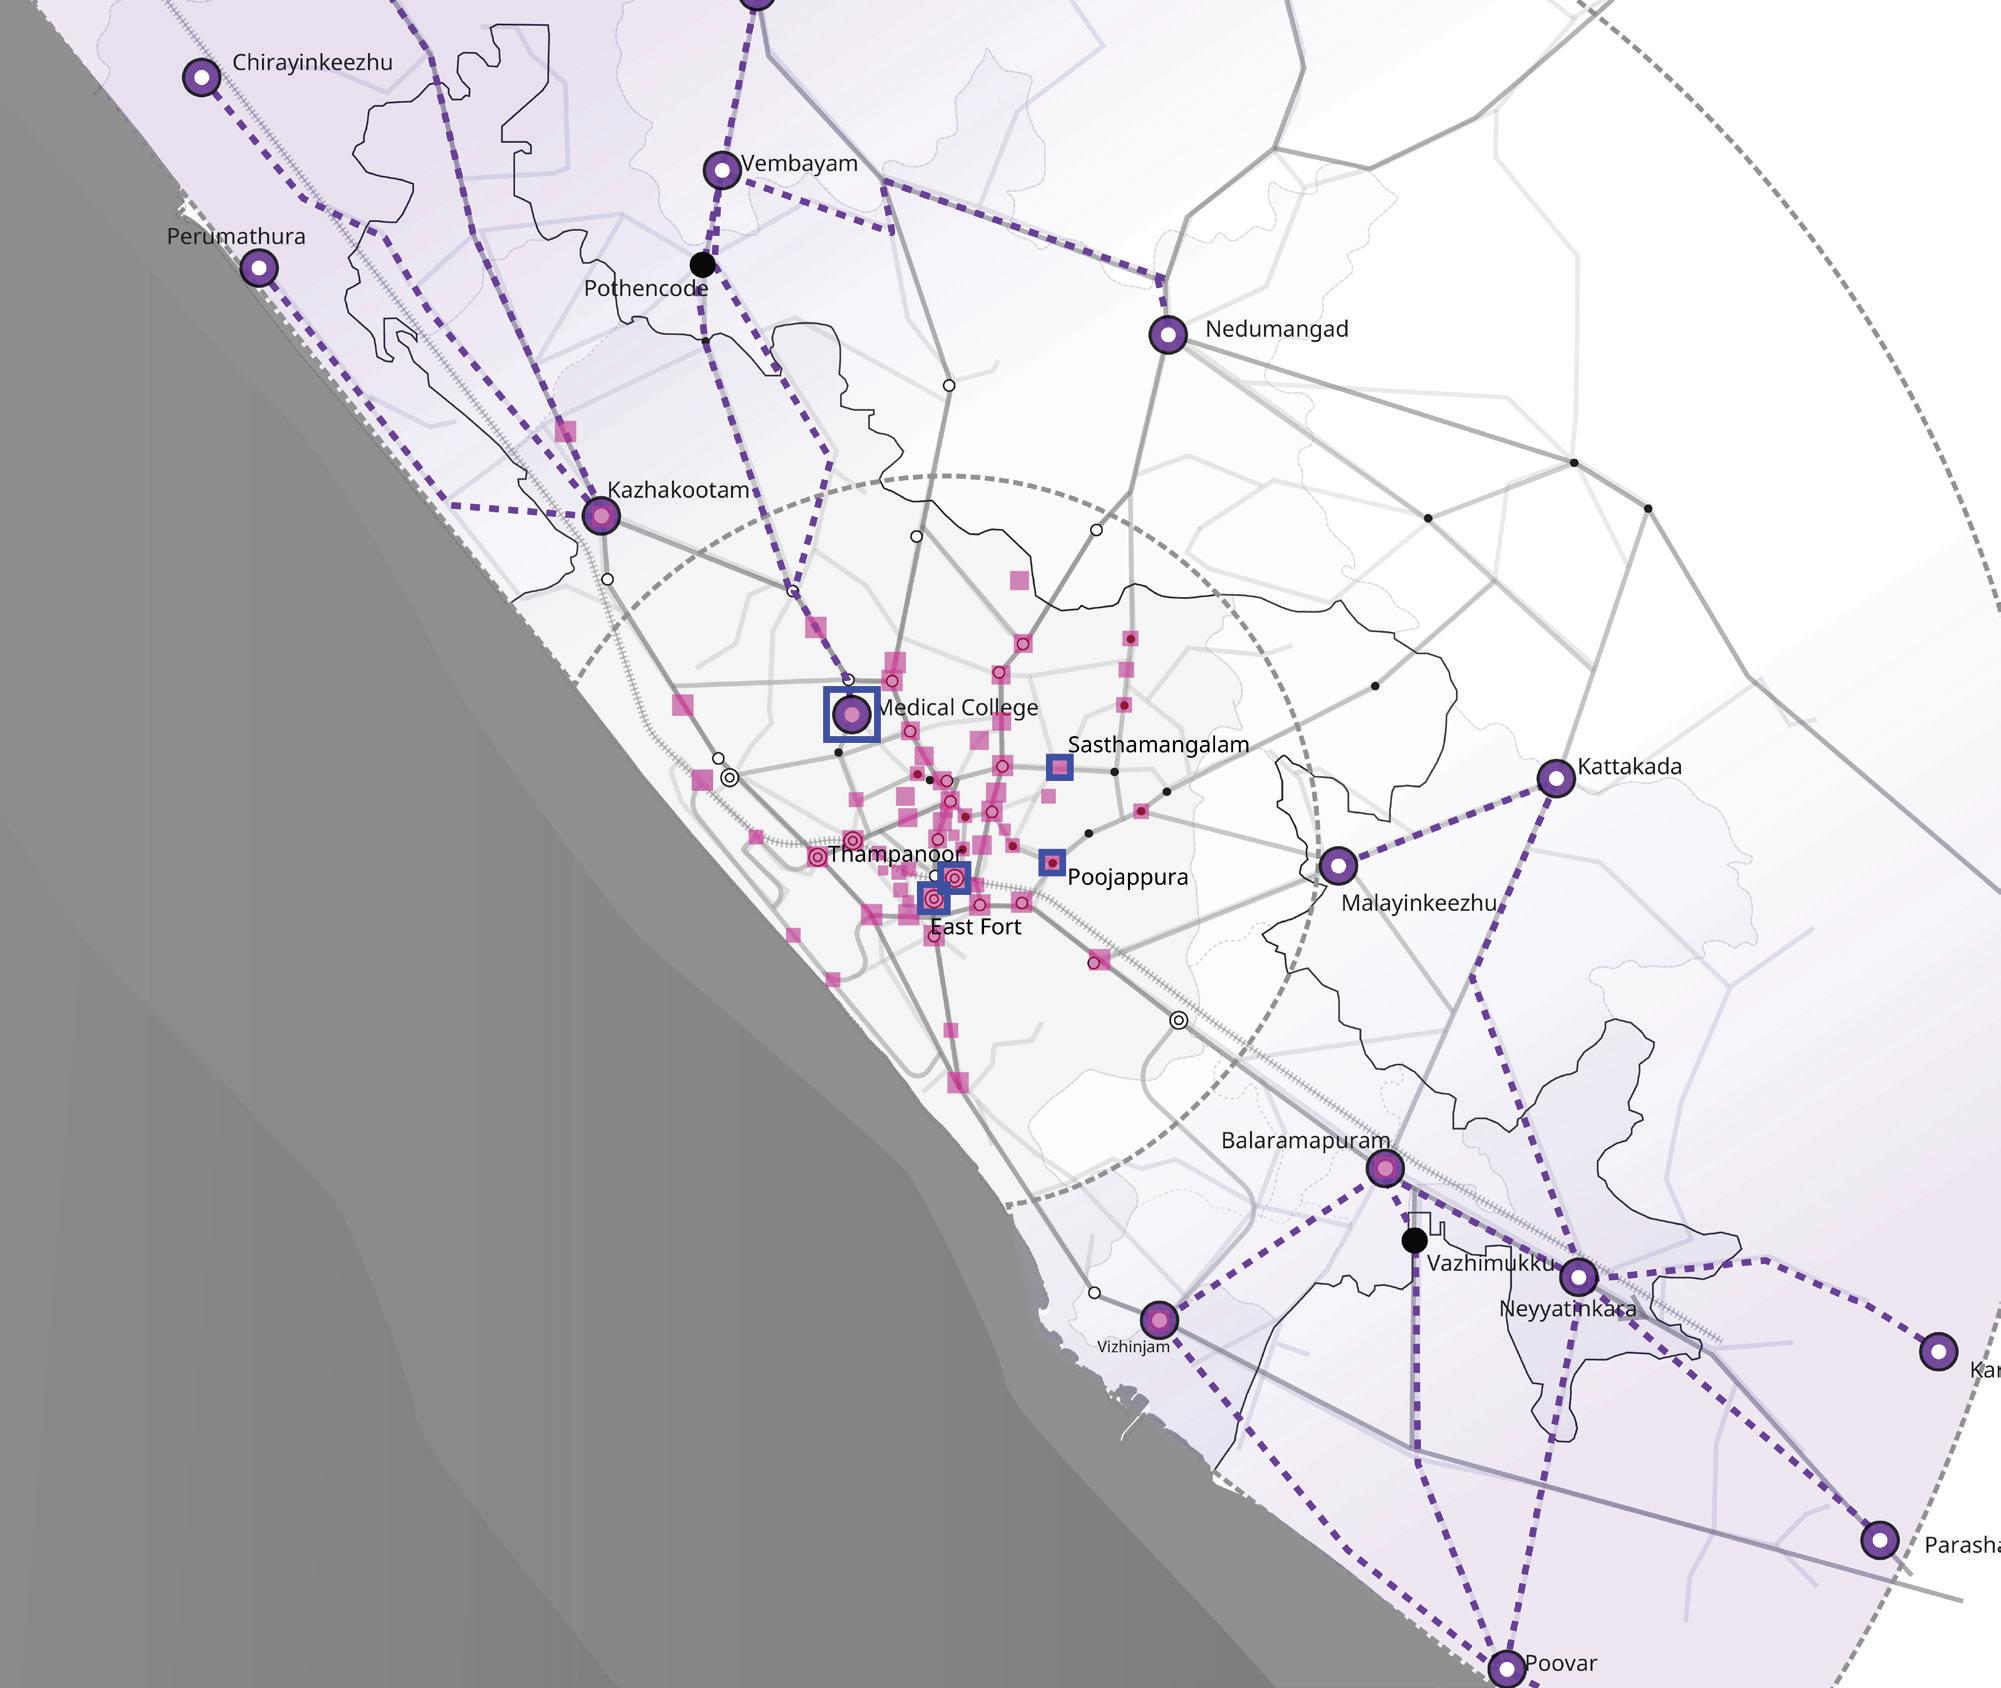
ity services provide door-to-door connectivity and often function as informal feeder services where bus frequencies are low.
However, many jeep and van services currently operate along the same corridors as KSRTC routes, particularly in the city outskirts. This creates direct competition with formal public transport services rather than complementing them. At the same time, the relatively high cost of individual IPT services limits their suitability for daily commuting.
These findings suggest that IPT should be repositioned as a structured feeder service integrated with the formal public transport network, rather than operating as a parallel transport system.
Passenger and pedestrian volume assessments identify several locations that function as critical interchange points within the city’s transport network. Thampanoor records the highest passenger volumes due to its proximity to major transit hubs, followed by Medical College and Neyyattinkara. Medical College and Thampanoor also experience the highest pedestrian activity, while Palayam and East Fort serve as important transfer locations within the city core.
Surveys recorded a daily footfall of nearly 36,000 across key bus stops, with Thampanoor registering the highest passenger volume due to its proximity to major transit hubs, followed by Medical College and Neyyattinkara. Medical College also sees the highest pedestrian movement, with Thampanoor next, owing to nearby institutions and commercial areas. Palayam and East Fort cater to around 4,000 passengers daily. The degree of space usage by both vehicles and pedestrians was found to be highest at Palayam, Thampanoor, and Medical College, highlighting the need for improved spatial management in these zones.
The concentration of passenger and pedestrian activity at these locations highlights the importance of improving interchange infrastructure, pedestrian circulation, wayfinding, and space management to support seamless multimodal transfers.
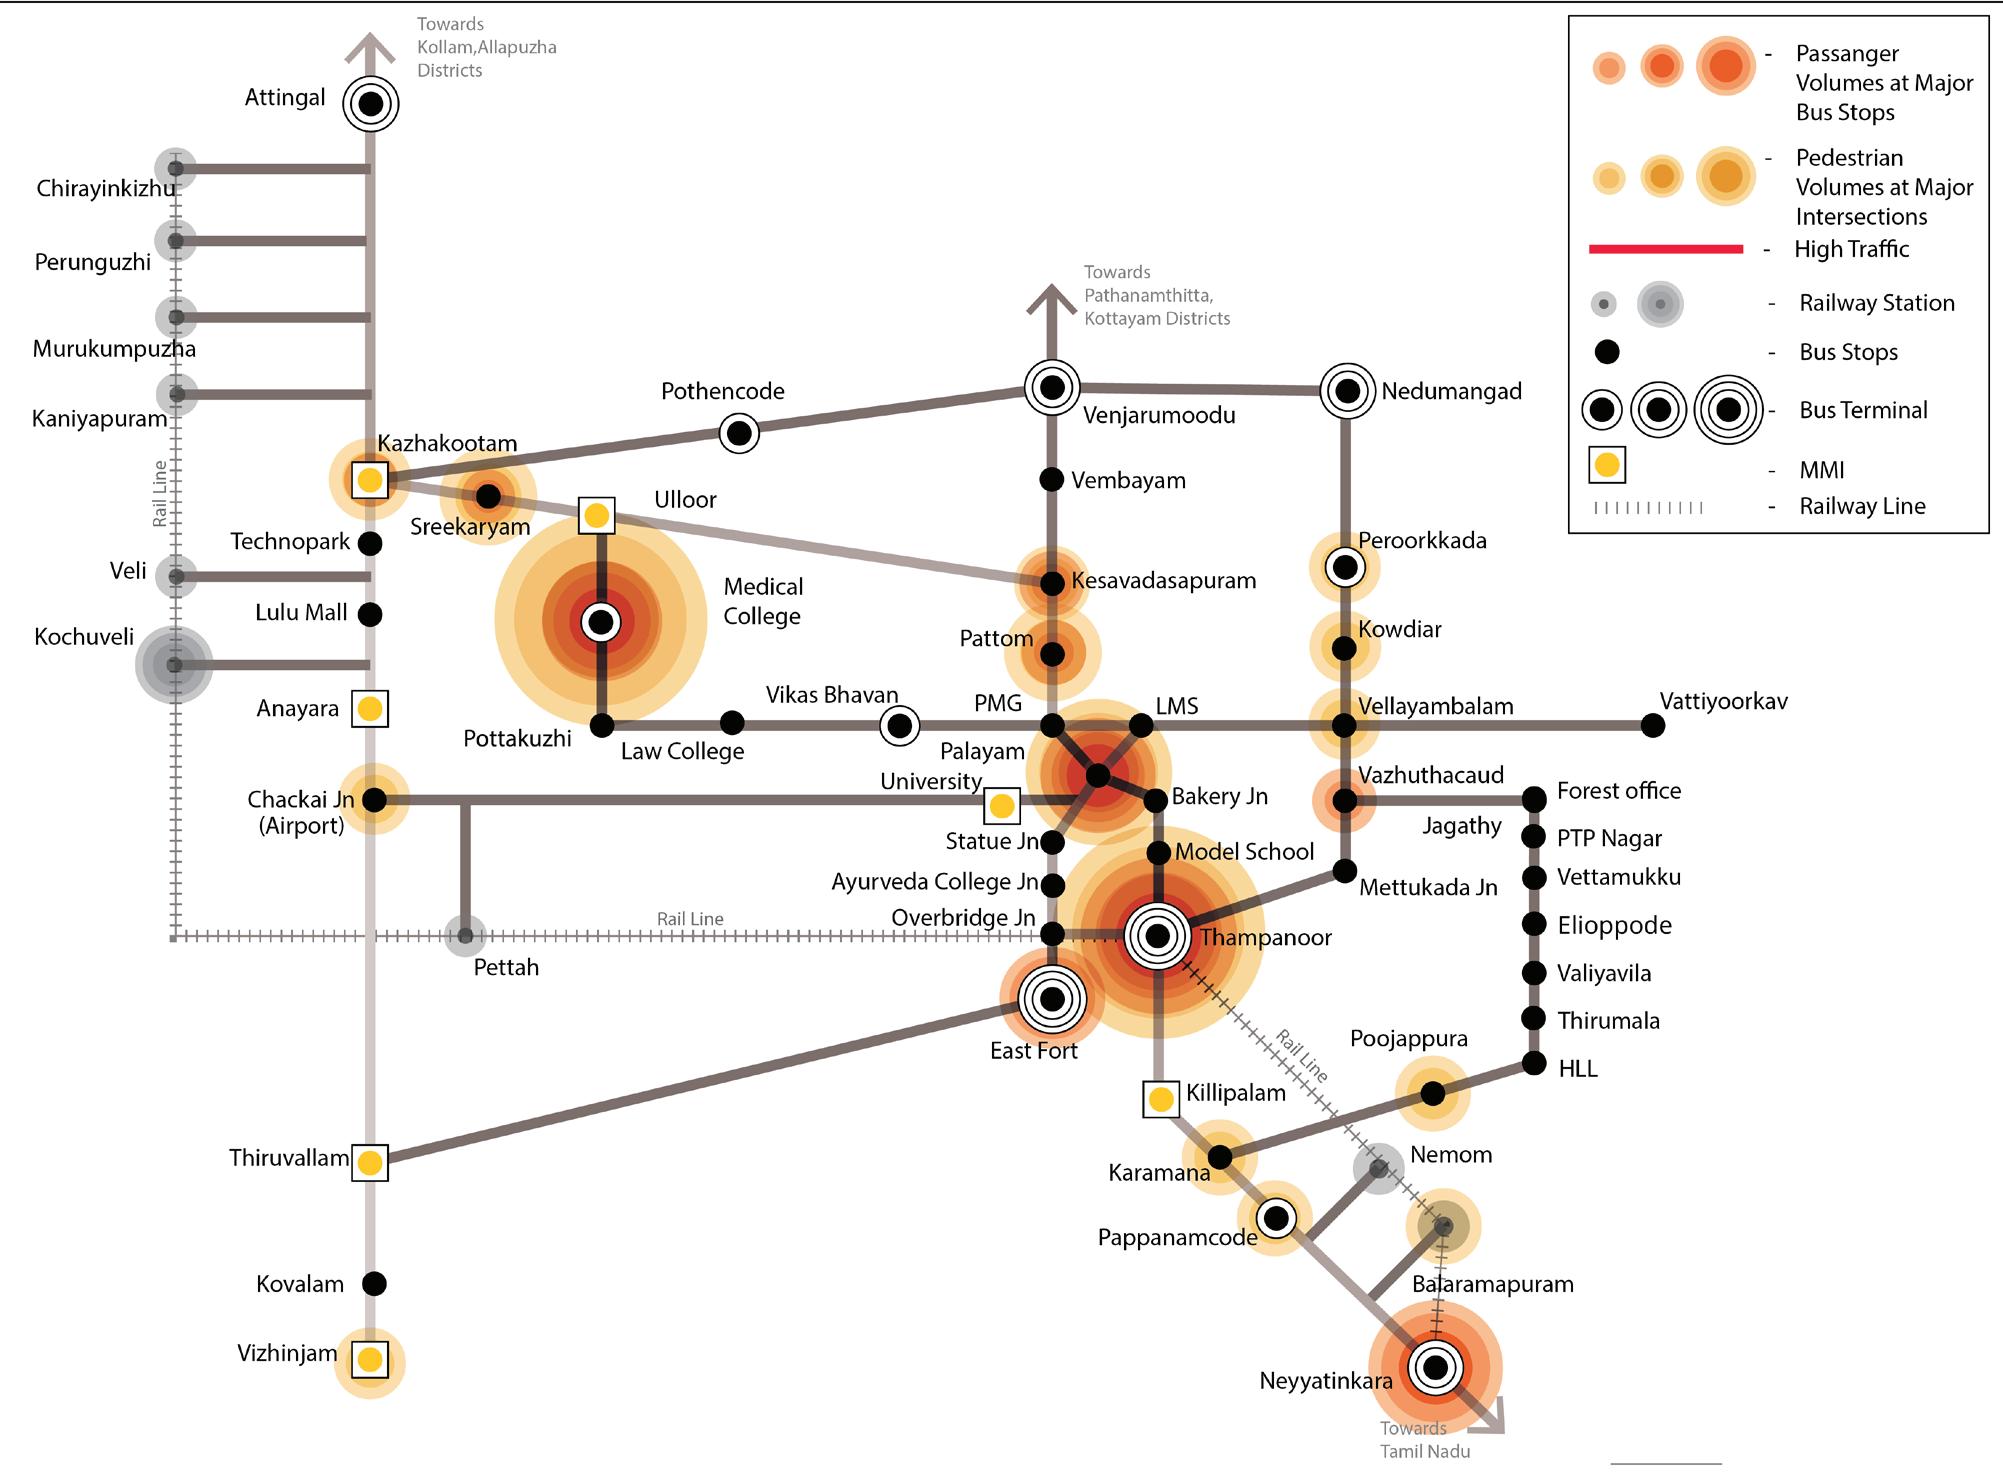
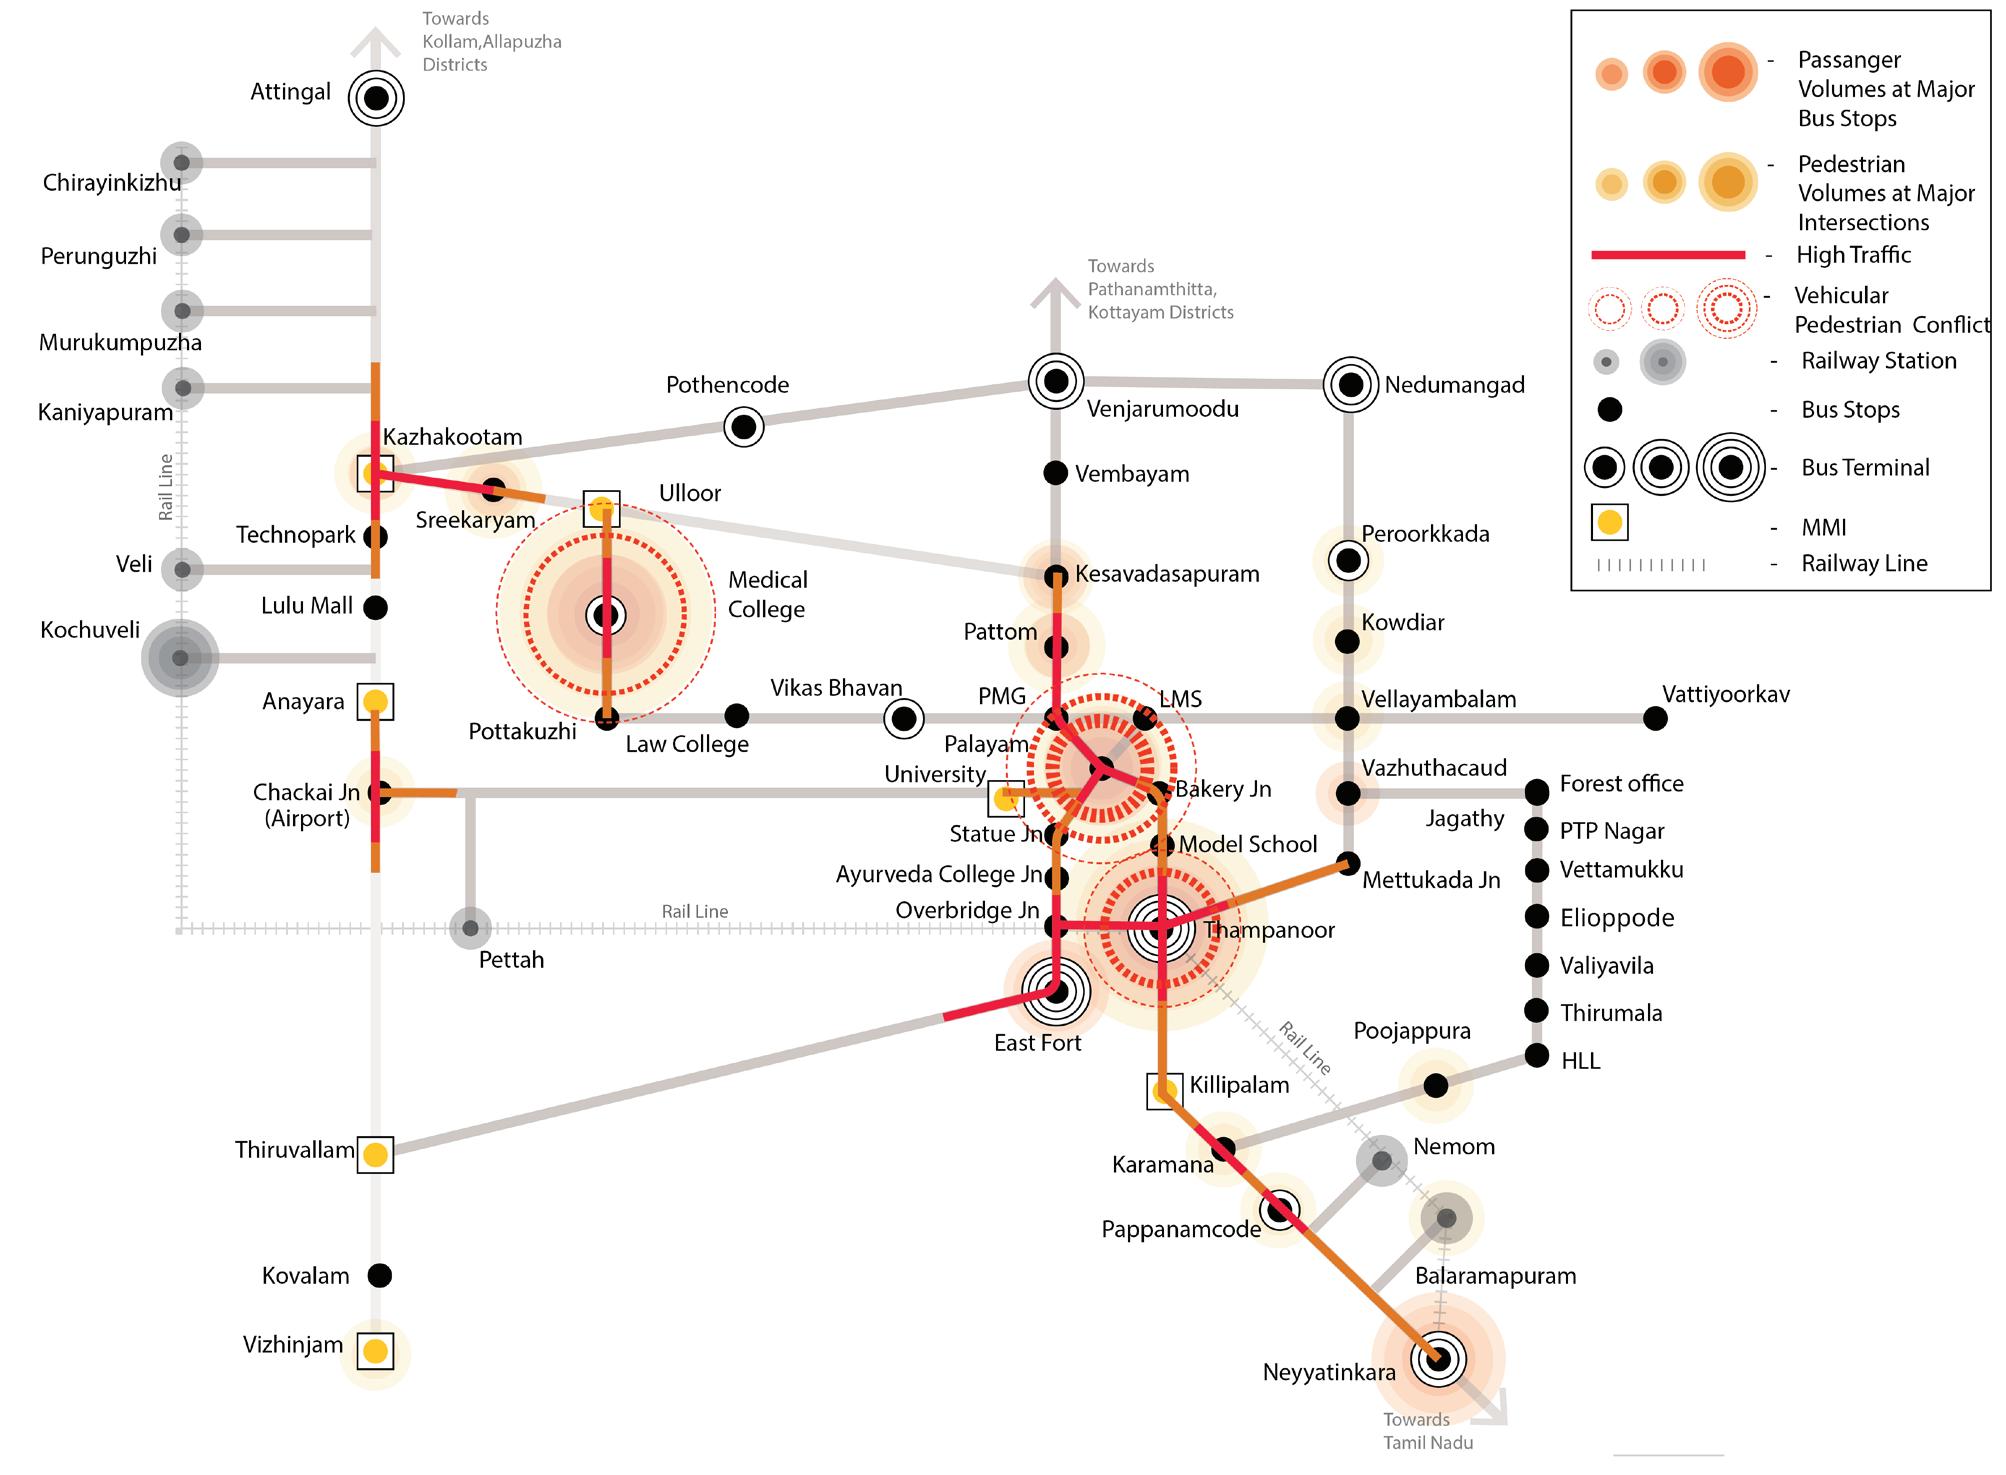
The network assessment demonstrates that Thiruvananthapuram’s mobility challenges are primarily linked to service accessibility, first- and last-mile connectivity, and modal integration rather than a lack of overall transport supply. While the city core benefits from frequent bus services and walkable access, peripheral areas depend increasingly on IPT services to bridge connectivity gaps.
Accordingly, the most effective strategy for improving public transport attractiveness and reducing private vehicle dependence is not solely the expansion of bus services, but the development of a well-integrated multimodal transport system. Strengthening coordination between public transport, IPT, and NMT; improving transfer facilities at key nodes; and formalizing feeder services can significantly enhance network coverage, accessibility, and commuter experience while maximizing the value of existing transport infrastructure.
To achieve the broader goals laid out in the NUTP and match the performance of peer cities such as Coimbatore, Thiruvananthapuram must act decisively. The city has two broad options. The first is to significantly expand the public transport fleet, particularly buses, to increase coverage and reduce waiting times. While necessary to some extent, this requires substantial capital investment and is often constrained by the narrow inner roads that characterize much of the city.
A more feasible and impactful approach is to prioritize integration and optimization over expansion. By investing in the MMI strategies described in this chapter, the city can improve network efficiency, coverage, and commuter experience without requiring major new infrastructure. The emphasis should be on maximizing existing assets and removing barriers to seamless travel. The most sustainable and scalable path forward for Thiruvananthapuram lies in building a coordinated and well-integrated public transport system.
1. Promote a Shift from Private to Public Transport: A decisive shift in mode preference is needed to address rising private vehicle use and its associated impacts—congestion, pollution, and road safety concerns. This shift will occur only when public transport becomes more convenient and competitive with private modes. Interventions should focus on reducing waiting and transfer times, improving reliability, and enhancing the overall commuter experience.
2. Integrate Intermediate Public Transport (IPT) with the Public Transit: Strengthening integration between public transport and IPT is one of the most effective ways to improve ridership. Many commuters rely on autos, jeeps, or other IPT services for first- and last-mile connectivity, particularly in low-density areas. However, the lack of coordination between these services results in fragmented journeys that encourage private vehicle use. Well-designed MMI nodes, designated IPT bays, coordinated operations, and integrated fare systems can significantly improve connectivity and convenience.
3. Improve Transfer Experience at Key Nodes: Poorly designed transfer points discourage public transport use. Inadequate wayfinding, lack of basic amenities, and unsafe pedestrian environments make transfers inconvenient. Transfer points should be treated as integral parts of the journey, with improvements focused on safety, comfort, accessibility, and ease of navigation.
4. Focus on User-Centric Design of Infrastructure: Public transport infrastructure—including bus stops, interchanges, and pedestrian access routes—must be designed around user needs. Safe crossings, shaded walkways, adequate lighting, and universal accessibility are essential for improving usability and increasing ridership, particularly among women, elderly persons, and persons with disabilities.
5. Integrate with IPT and NMT around existing corridors: To create a more efficient and financially sustainable transport system, IPT and Non-Motorised Transport (NMT) should be integrated with existing public transport corridors. Institutional coordination between transport agencies, municipal bodies, and traffic authorities is equally important to ensure seamless multimodal mobility.
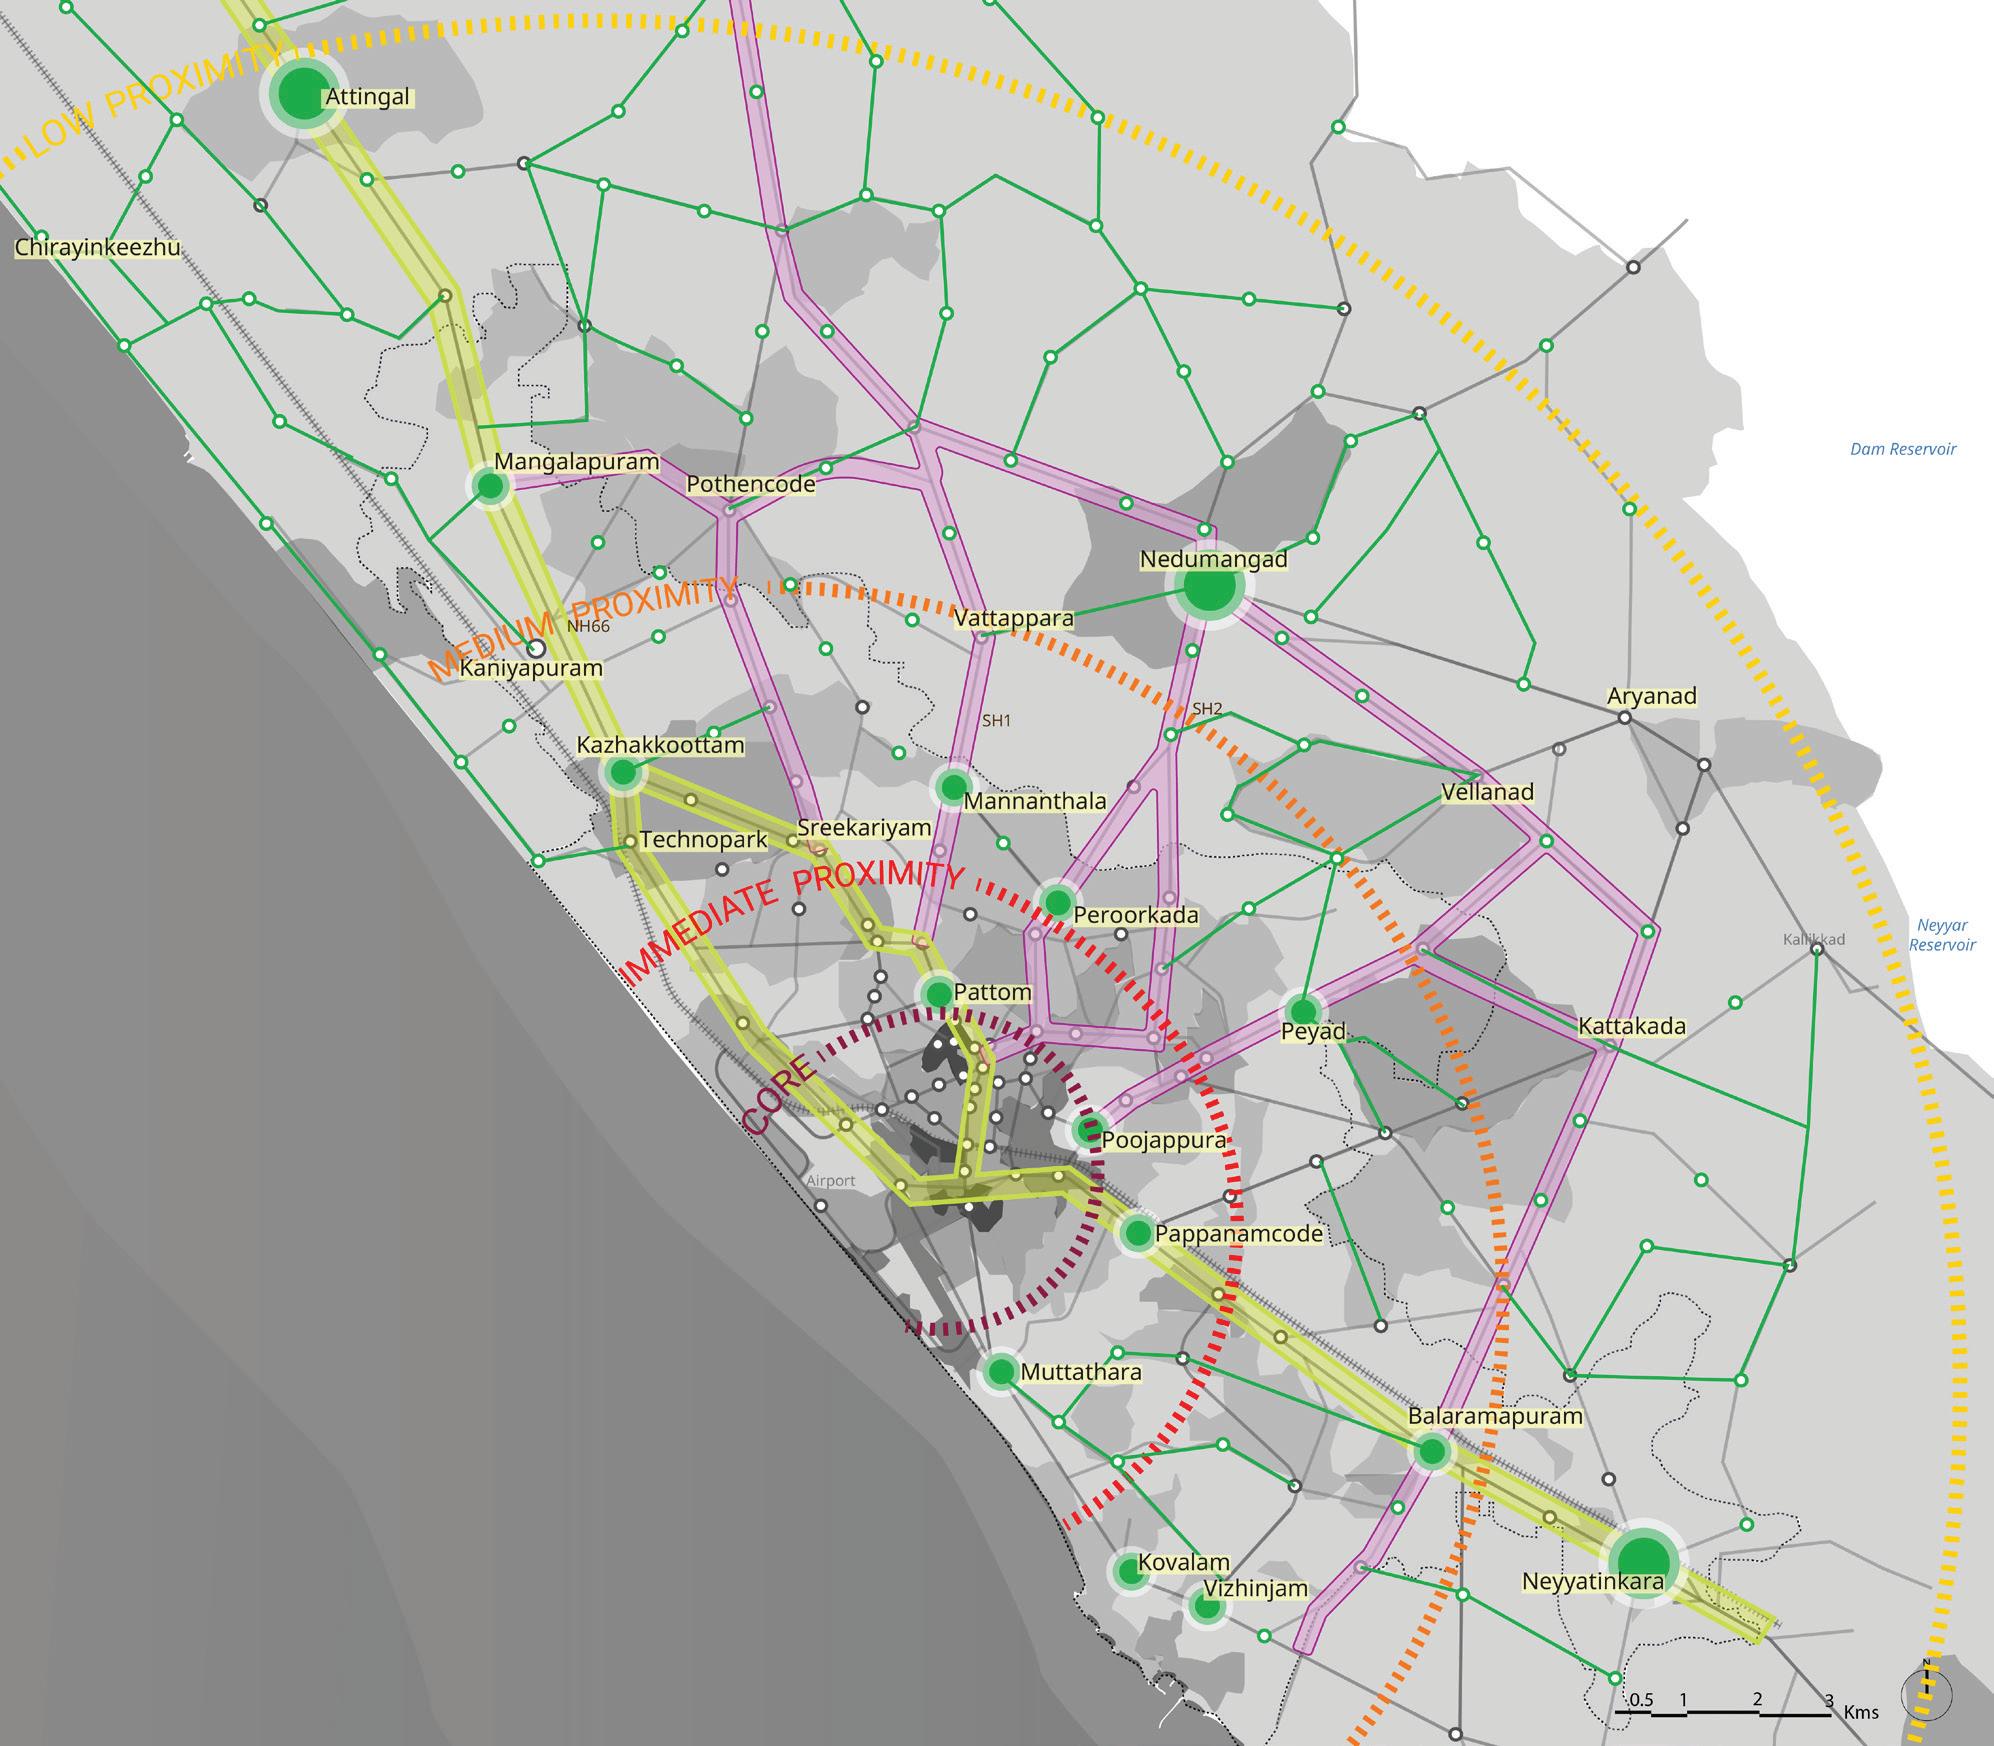
IPT/Feeder network
MMI
Fig. 29. Integrate with IPT and NMT around existing corridors
A well-integrated system offers several advantages:
1. Optimized Resource Utilization: Coordinated efforts between various agencies—such as urban transport authorities, municipal bodies, and traffic police— help maximize existing infrastructure and services. This avoids duplication and ensures that different modes work in tandem rather than in isolation.
2. Improved Service Coordination: Aligning IPT, NMT, and public transport services in terms of routes, schedules, and interchanges reduces commuter inconvenience. Seamless transfers and reduced wait times contribute to a smoother, more reliable transit experience.
3. Enhanced Financial Sustainability: Institutional integration helps avoid inefficiencies caused by fragmented operations. Shared responsibilities, joint planning, and streamlined operations can significantly reduce administrative costs, lower maintenance burdens, and improve revenue potential through increased ridership.
4. Environmental Benefits: A shift toward integrated, multimodal mobility reduces dependency on private vehicles. This leads to lower emissions, reduced road congestion, and an overall smaller carbon footprint—contributing to a healthier urban environment.
By integrating IPT and NMT around existing corridors and strengthening institutional collaboration, Thiruvananthapuram can build a more accessible, resilient, and cost-effective transportation ecosystem.
To support this transition, a phased implementation approach is proposed to transform informal feeder services into organized and regulated mobility services that complement KSRTC operations and strengthen first- and last-mile connectivity..
At present, IPT services such as auto-rickshaws and e-rickshaws often operate informally, resulting in route overlaps with KSRTC services, unregulated stopping patterns, and traffic conflicts. Formalizing these services as structured feeders will help improve last-mile connectivity while ensuring they complement rather than compete with public transport.
1. Contract Carriage Model to Regulate IPT Operations: The Contract Carriage Permit Model can be adopted to regulate IPT services through pre-defined feeder routes linked to KSRTC corridors. Autos, e-rickshaws, and shared shuttles would operate as organized feeder services with designated routes, schedules, and pick-up/drop-off locations. This approach would reduce overlapping services and support more efficient integration with KSRTC.
2. Designated IPT Bays for Organized Transfers: Dedicated IPT bays and structured pick-up/drop-off zones should be developed at MMI hubs and major transit nodes. These facilities would streamline vehicle movements, reduce congestion, and improve transfer convenience.
3. Unified Digital Fare System for Seamless Travel: A common digital fare platform using Common Mobility Cards or QR-based payments should integrate fare collection across KSRTC and IPT services. This would enable seamless travel, improve fare transparency, and support operational accountability.
4. Operator Onboarding and Service Compliance: IPT operators should undergo onboarding and training programs covering route adherence, digital fare systems, and customer service standards. This would help professionalize operations and ensure consistent service quality.
5. Overall Impact: Reduced Congestion and Enhanced KSRTC Reach: A structured feeder system can extend KSRTC’s effective service area, improve first- and last-mile connectivity, reduce dependence on private vehicles, and strengthen the overall public transport network.
To identify strategic nodes for Multi-Modal Integration (MMI) interventions, an extensive exercise was undertaken to review and assess bus stops across Thiruvananthapuram. Within a span of 4 days, a comprehensive recce of 61 bus stops was conducted, covering the city’s Core, Immediate Proximity, Medium Proximity, and Low Proximity zones, as defined by the Comprehensive Mobility Plan (CMP).
The 61 shortlisted bus stops were selected based on a combination of quantitative data analysis and qualitative field observations. The process involved evaluating demographic and mobility patterns, including population density, existing ridership data, and network overlap with other modes of transport such as Intermediate Public Transport (IPT), intercity buses, and rail systems.
Particular attention was given to identifying missing links in the existing network— specifically, areas where public transport infrastructure lacked effective interchanges or where IPT services (such as shared jeeps and vans) were competing with city bus services along longer corridors. These overlapping service zones were seen as crucial opportunities for rationalising operations and enhancing the reach of formal public transport. All field notes, maps, tables, and raw data from this stage of the analysis are presented in the Annexure for transparency and future reference.
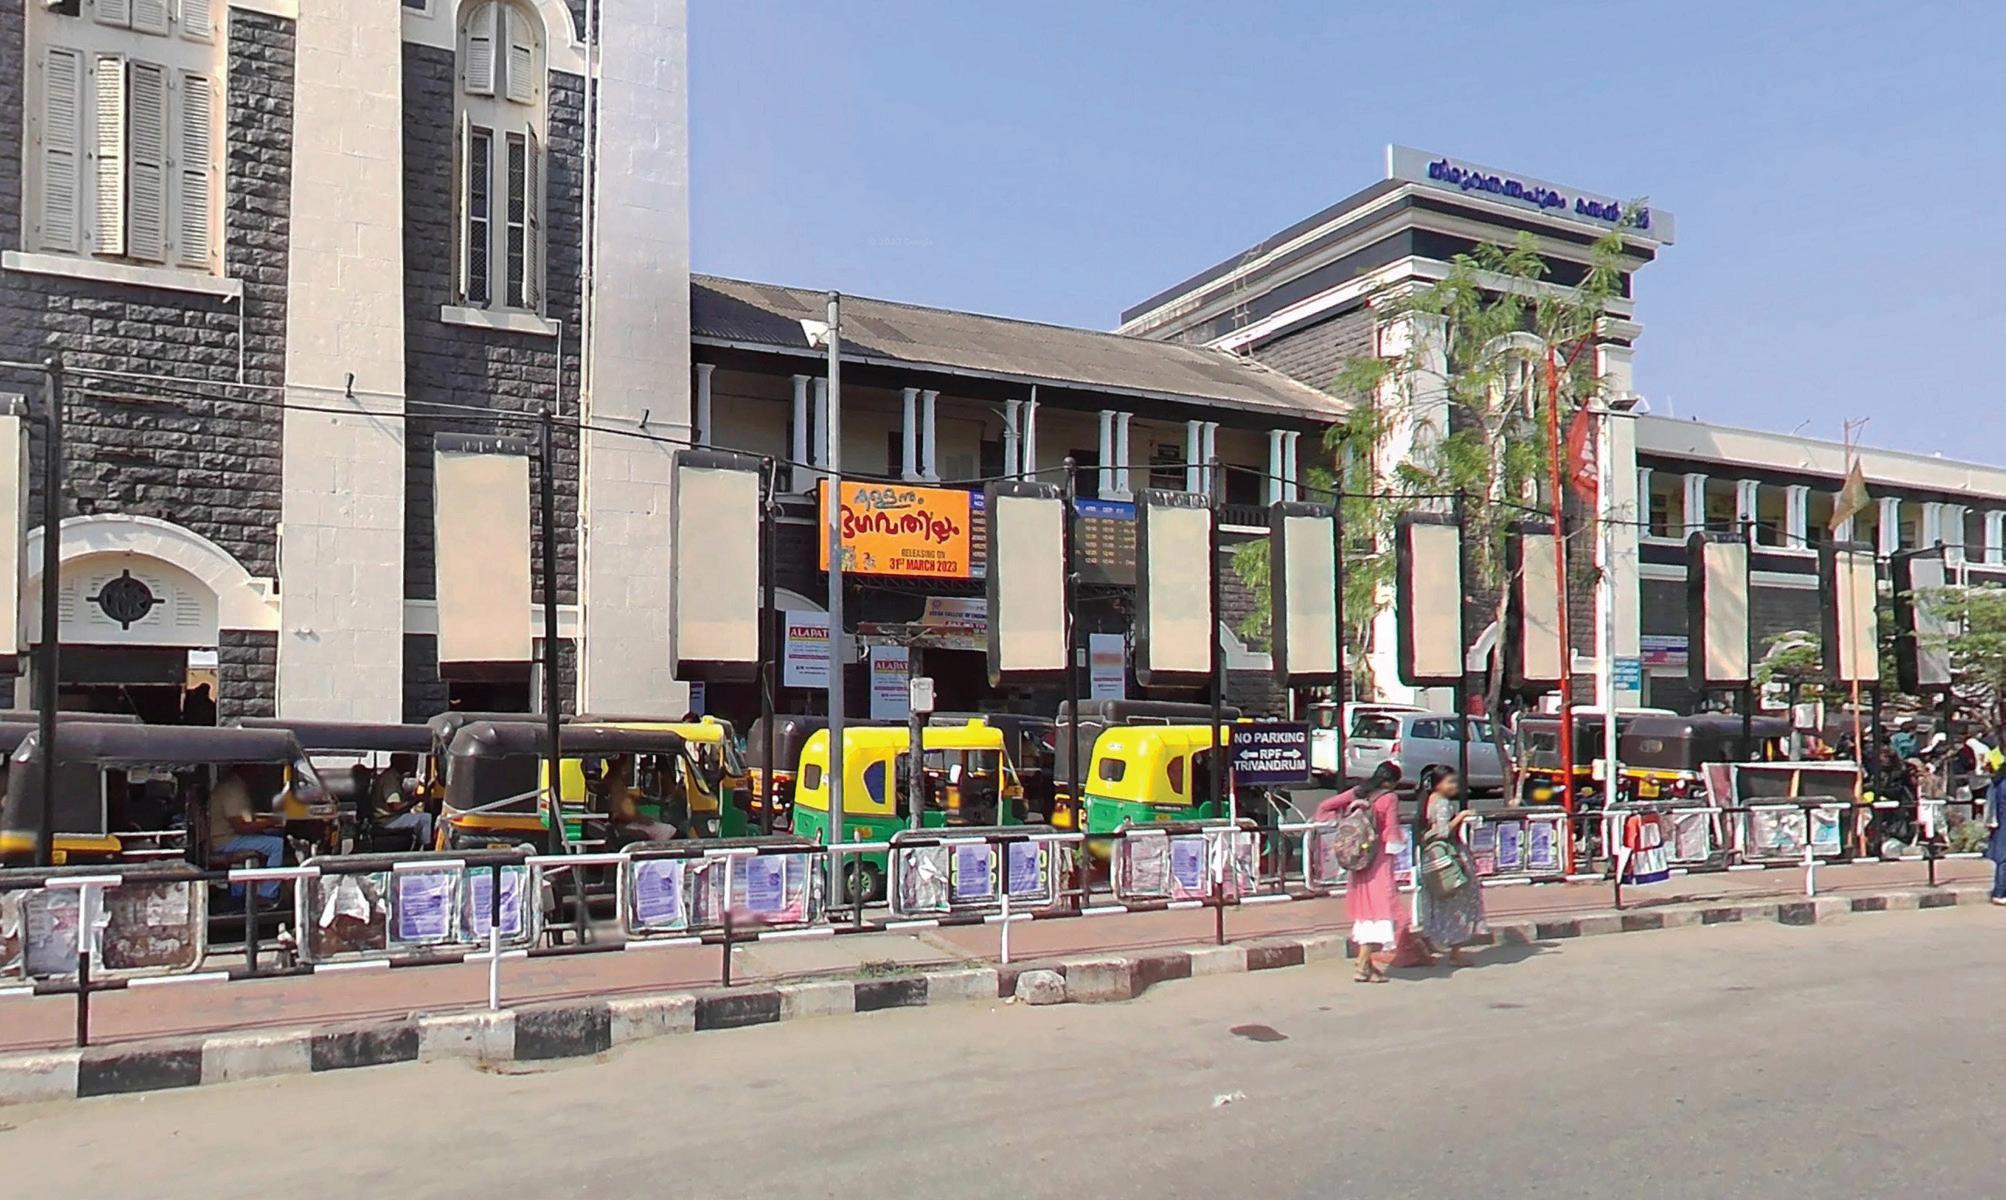
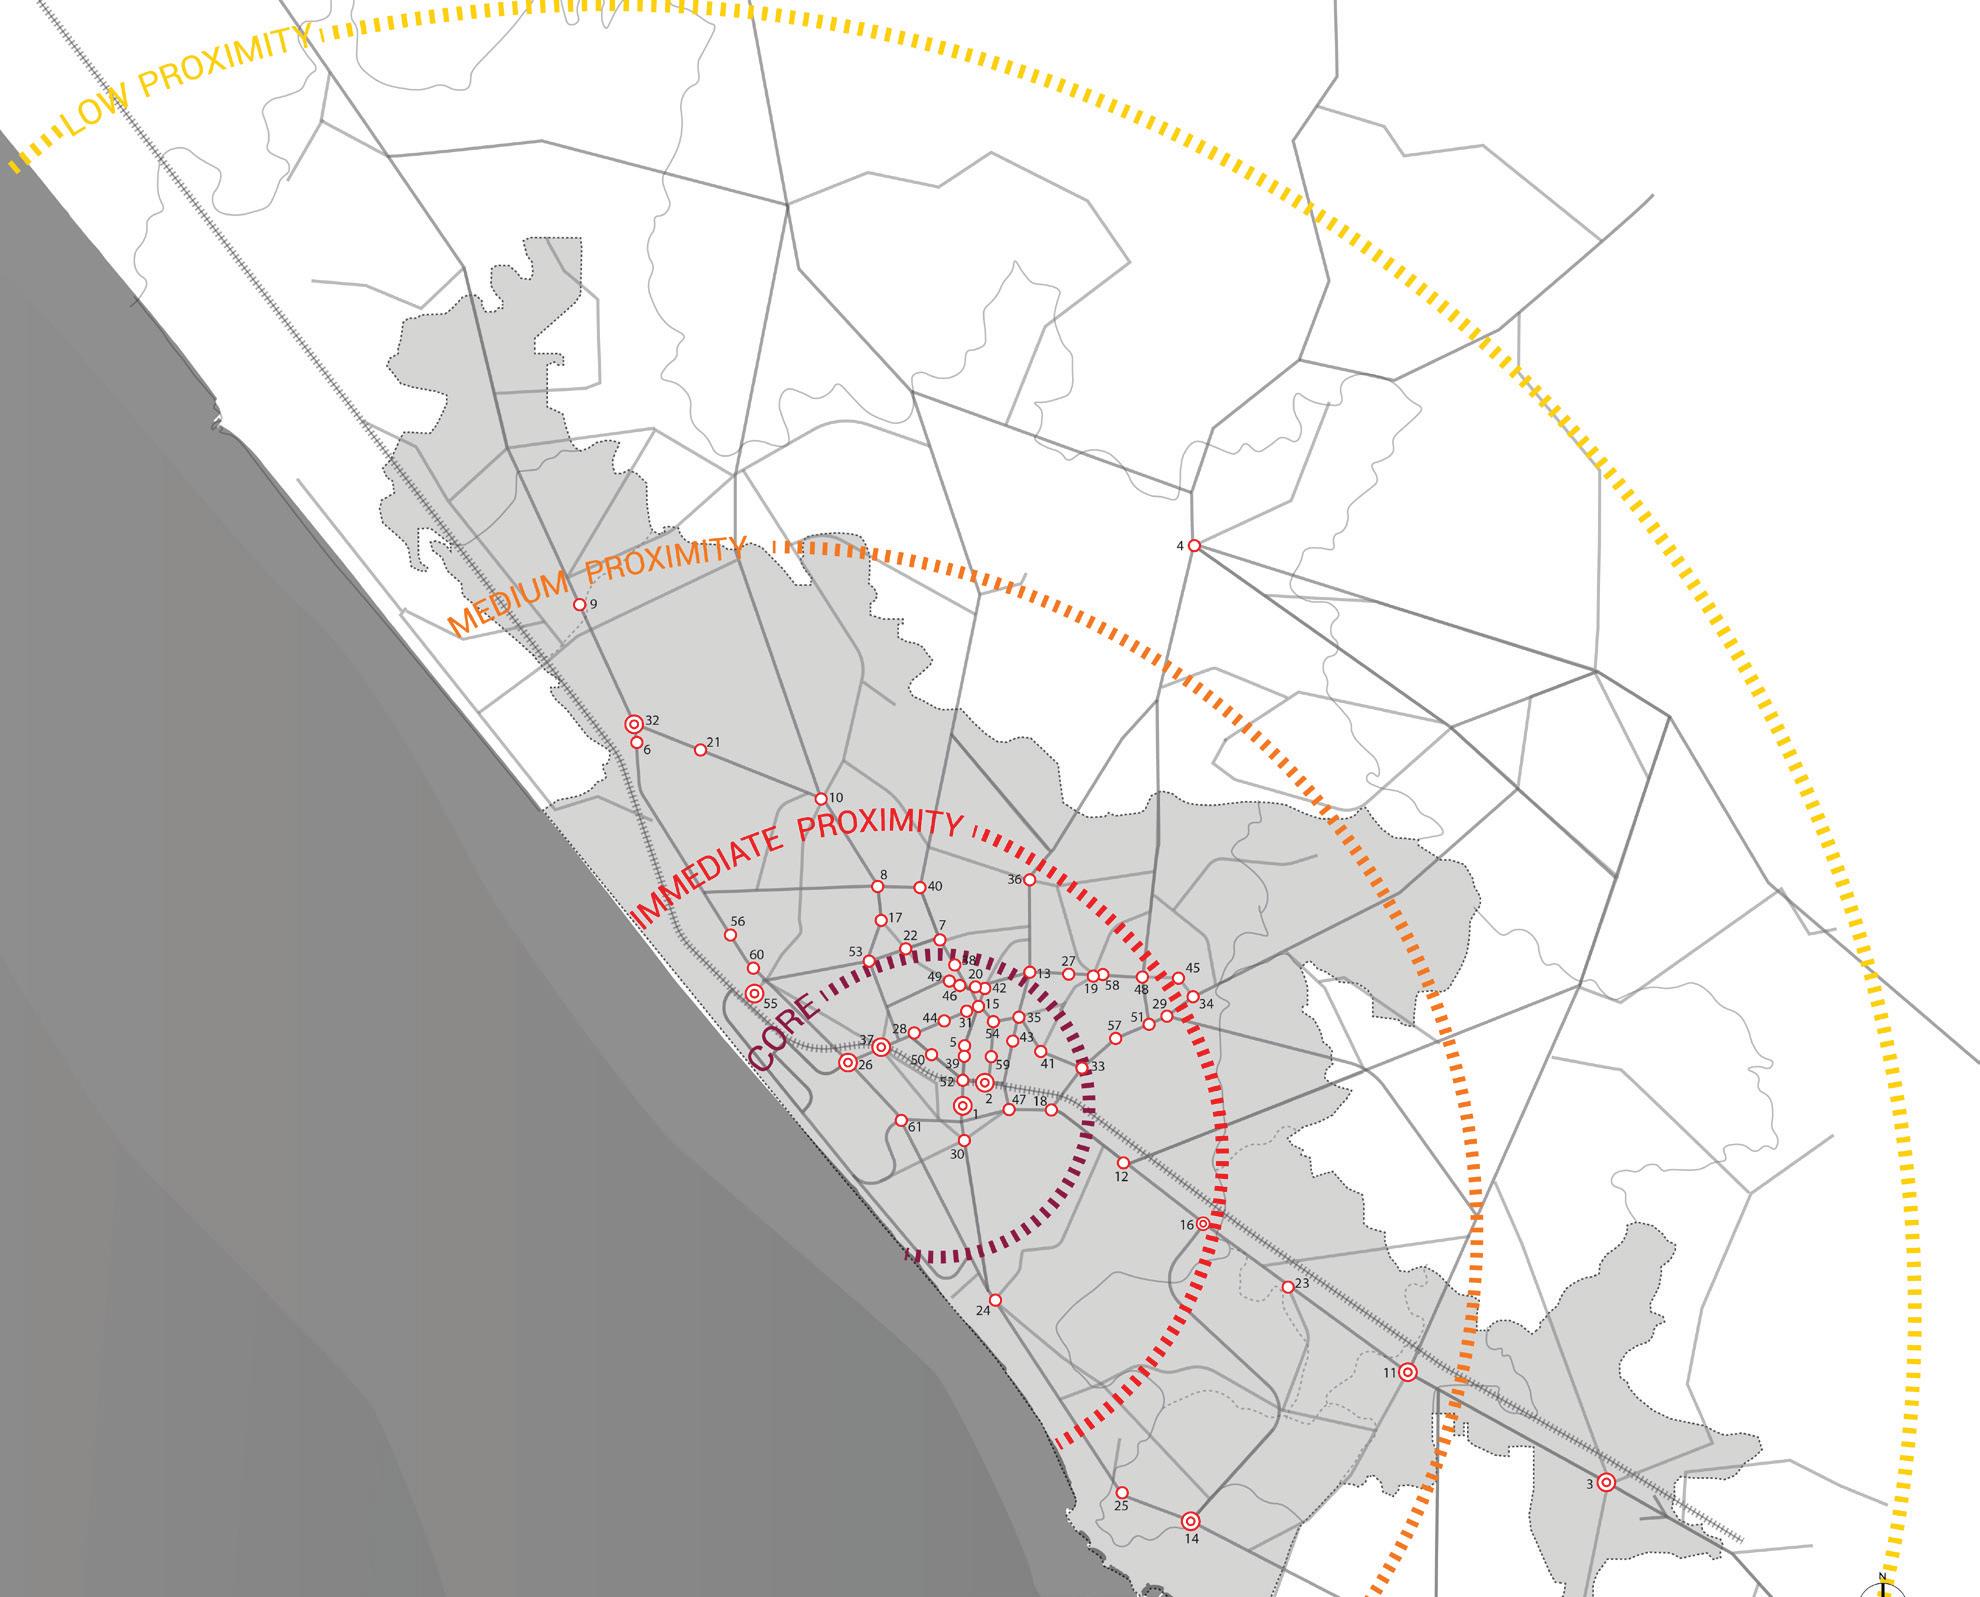
From the 61 shortlisted locations, a refined set of seven key bus stops was selected for targeted MMI interventions. The final selection was made using the following criteria:
1. Zonal Representation: At least one stop was chosen from each CMP-defined proximity zone, Core, Immediate Proximity, Medium Proximity, and Low Proximity, to ensure context-sensitive and geographically balanced interventions.
2. High Impact through Ridership: Bus stops with consistently high ridership were prioritised to maximise the reach and effectiveness of the proposed interventions.
3. Intermodal Linkages: Priority was given to locations where improved IPT or feeder bus connections could enhance access to existing railway stations, bus terminals, or major destinations, creating seamless multi-modal transfer opportunities.
4. Critical Interchange Nodes: Stops functioning as significant interchanges, especially those connecting intra-city and regional transit systems, were considered vital for citywide connectivity.
5. Institutional and Employment Precincts: Stops serving educational campuses, hospitals, government offices, and job centres were identified as high-demand areas that would benefit significantly from improved infrastructure and last-mile options.
6. Safety and Infrastructure Gaps: Bus stops lacking basic public amenities such as shelters, lighting, signage, and safe pedestrian access were flagged as urgent intervention points due to their direct impact on commuter safety and comfort. In addition, stops with high pedestrian footfall, passenger volumes, and pedestrian–vehicular conflict were prioritized to address critical safety and spatial challenges.
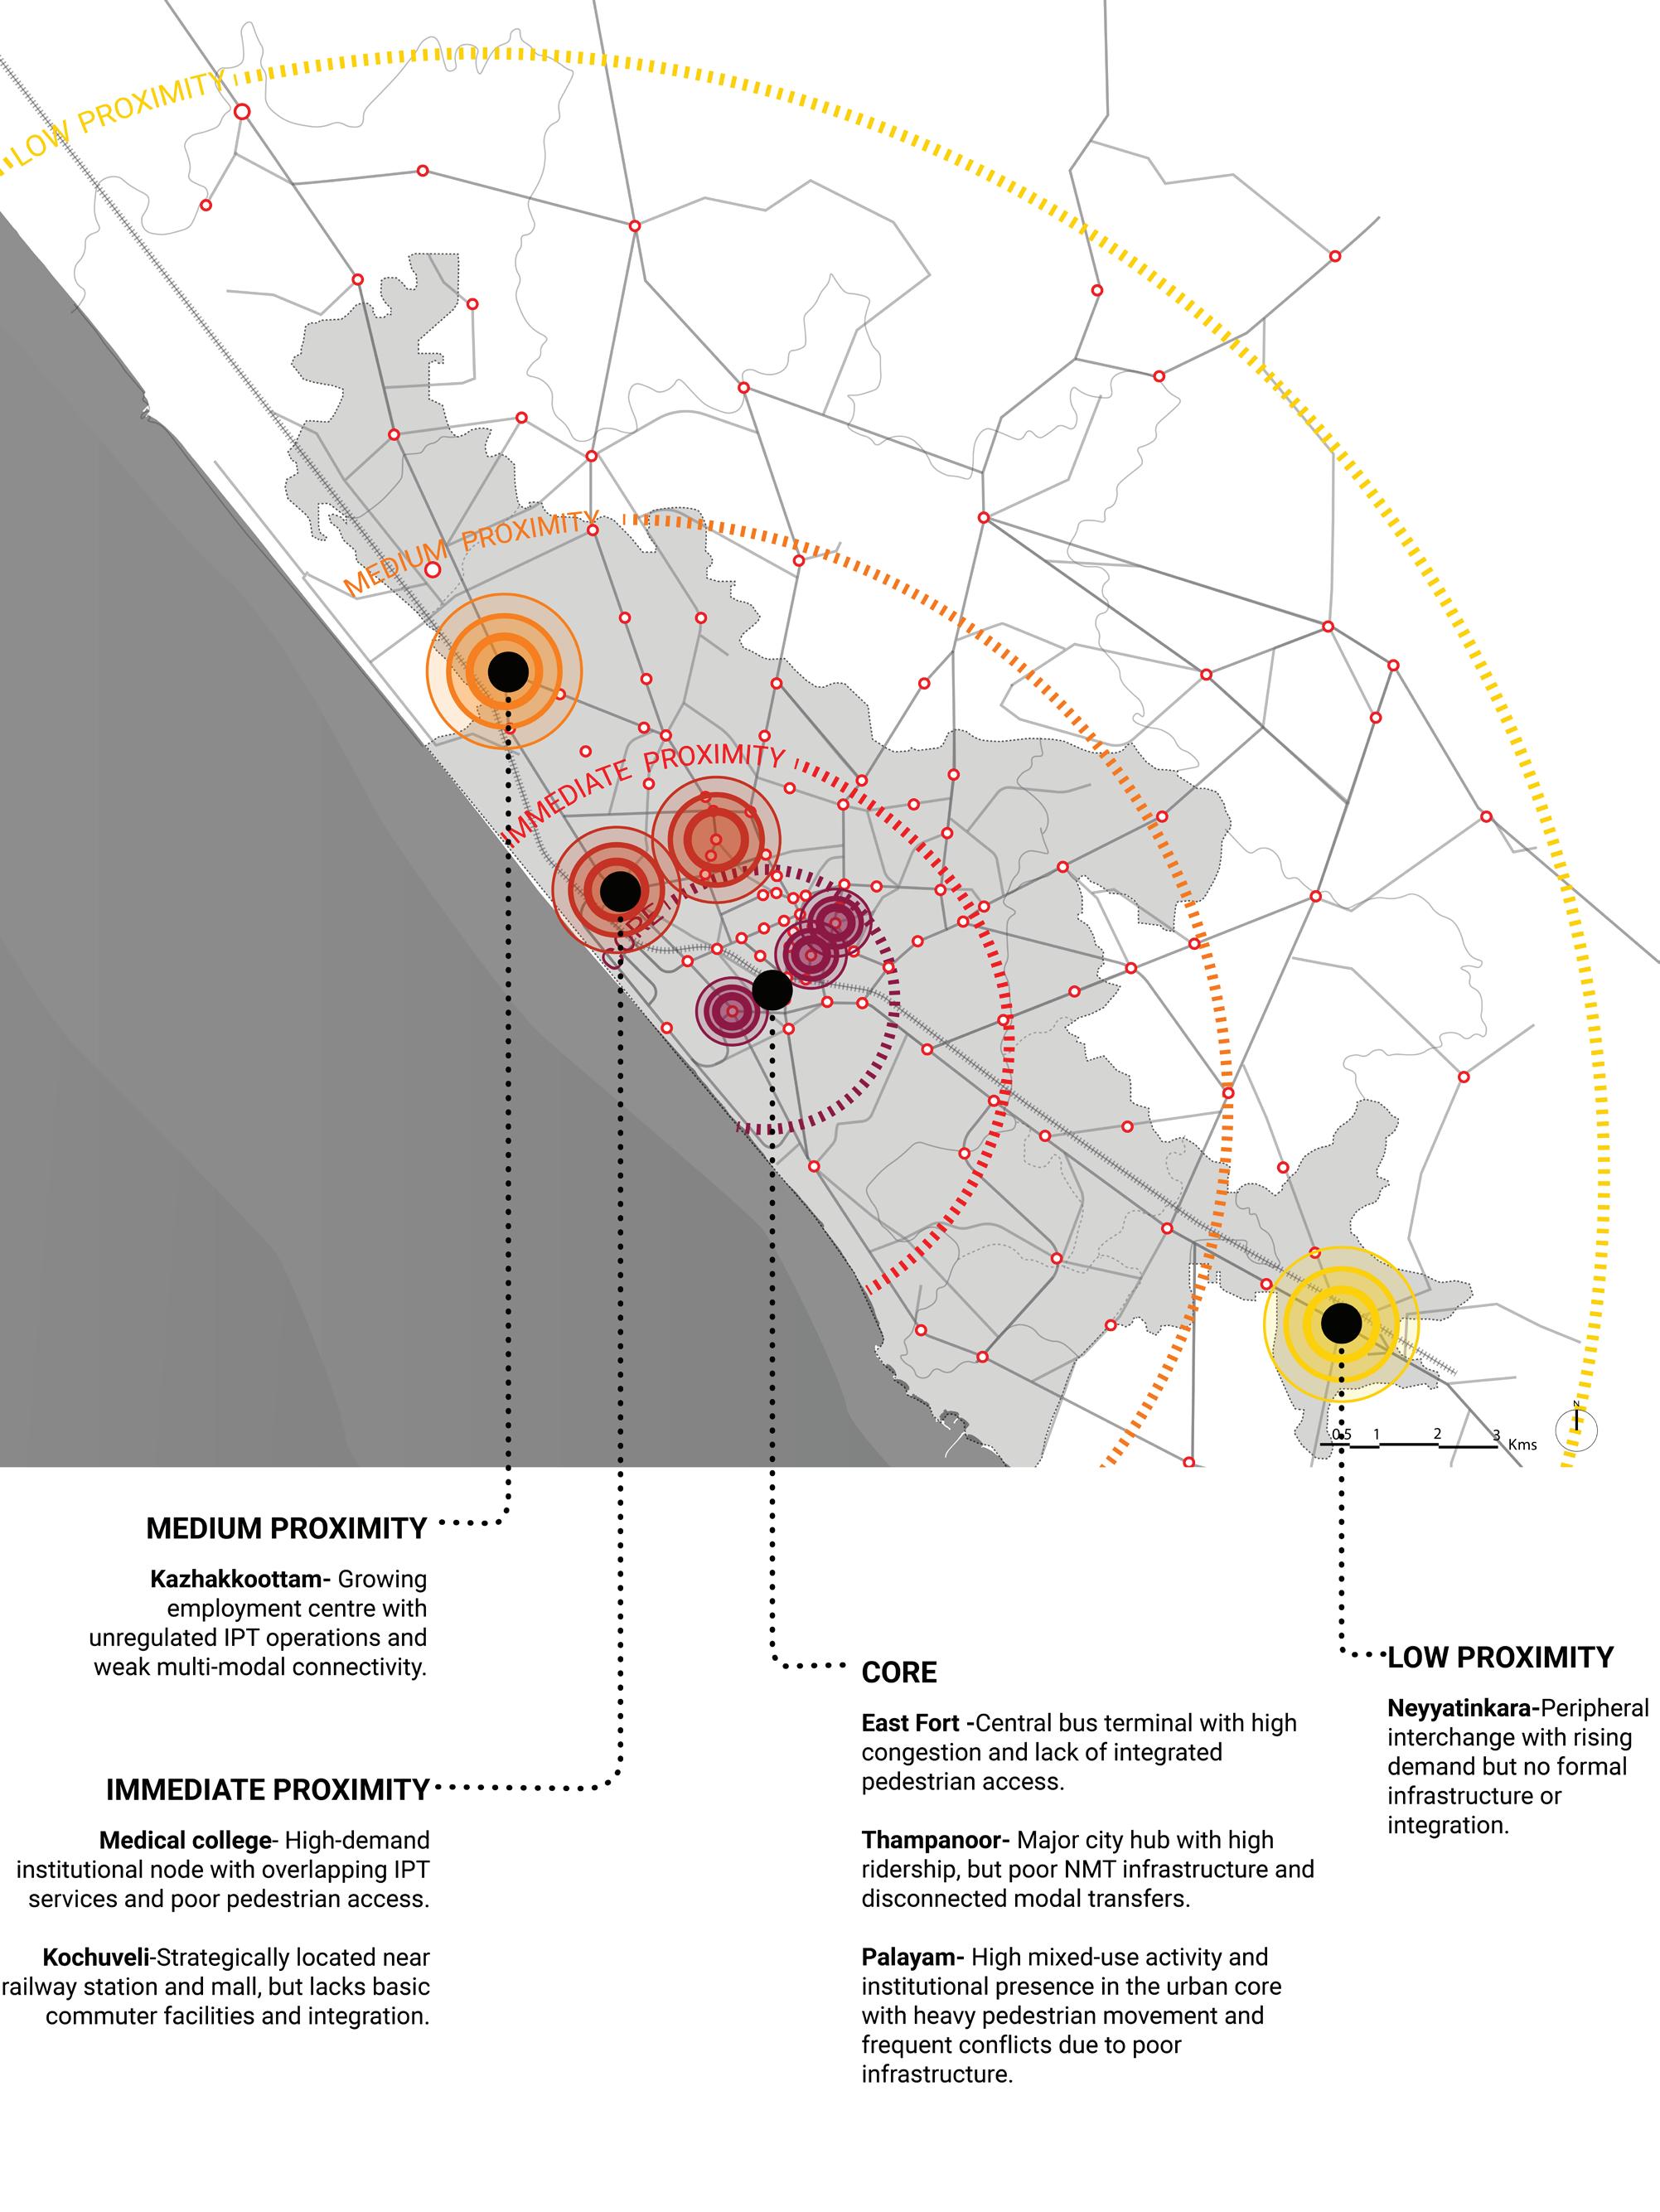
Thampanoor is one of the busiest public transit nodes in the city, serving as the primary railway station and a convergence point for intra-city and intercity travel. Despite its centrality and ridership volume, the area suffers from poor NMT infrastructure and disconnected modal transfers. Positioned just 800 metres from East Fort, Thampanoor presents a significant opportunity for integrated pedestrian and transit infrastructure that can transform the user experience and encourage modal shift.
East Fort functions as the city’s major bus terminal and is in the heart of Thiruvananthapuram’s commercial and cultural core. It experiences extremely high footfall and congestion but lacks structured modal integration and safe pedestrian zones. Given its proximity to Thampanoor and role in the city’s radial transit network, East Fort is a critical intervention point for improving last-mile connectivity and streamlining public transport operations in the urban core.
Palayam acts as a major junction within the city, connecting various arterial roads and routes. It is surrounded by key institutions, markets, and civic spaces, resulting in high ridership and pedestrian volumes. However, the area witnesses frequent pedestrian-vehicle conflicts due to poor infrastructure and lack of defined crossings. Upgrading this node with better signage, pedestrian safety measures, and MMI design can significantly improve overall transit accessibility in the core.
Kochuveli
This stop sits opposite Lulu Mall, one of the largest commercial destinations in the city, and near Kochuveli Railway Station. Despite its strategic location, the stop lacks essential infrastructure such as shelters, lighting, signage, and safe access. With better integration and visibility, this node can capture untapped ridership, facilitate smoother transfers between rail, bus, and IPT, and anchor future transit-oriented development in the area.
The Medical College bus stop lies within a dense institutional precinct, surrounded by hospitals, colleges, and residential areas. It caters to a wide cross-section of daily users, including students, staff, patients, and visitors. Additionally, it serves as a parallel hub for long-distance IPT services. Intervening here can support better integration of these services with formal public transport, while improving safety and comfort for a large commuter base.
Kazhakkoottam
Kazhakkoottam is located along a major regional corridor and is adjacent to Technopark, one of India’s largest IT campuses. Although the area is served by a nearby railway station and has high demand, IPT operators dominate the last-mile network, often competing with city buses. This stop offers a strong case for MMI by structuring IPT integration and enhancing accessibility for a growing commuter population in this tech and employment hub.
Neyyatinkara
Situated at the southern edge of the metropolitan area, Neyyatinkara is an emerging regional centre with growing transit demand. It functions as a key interchange for intercity buses, IPT routes, and is close to a railway station. Currently lacking formal infrastructure and integration, this node presents an opportunity to demonstrate how public transport can be strengthened in suburban and peri-urban settings through multimodal solutions.
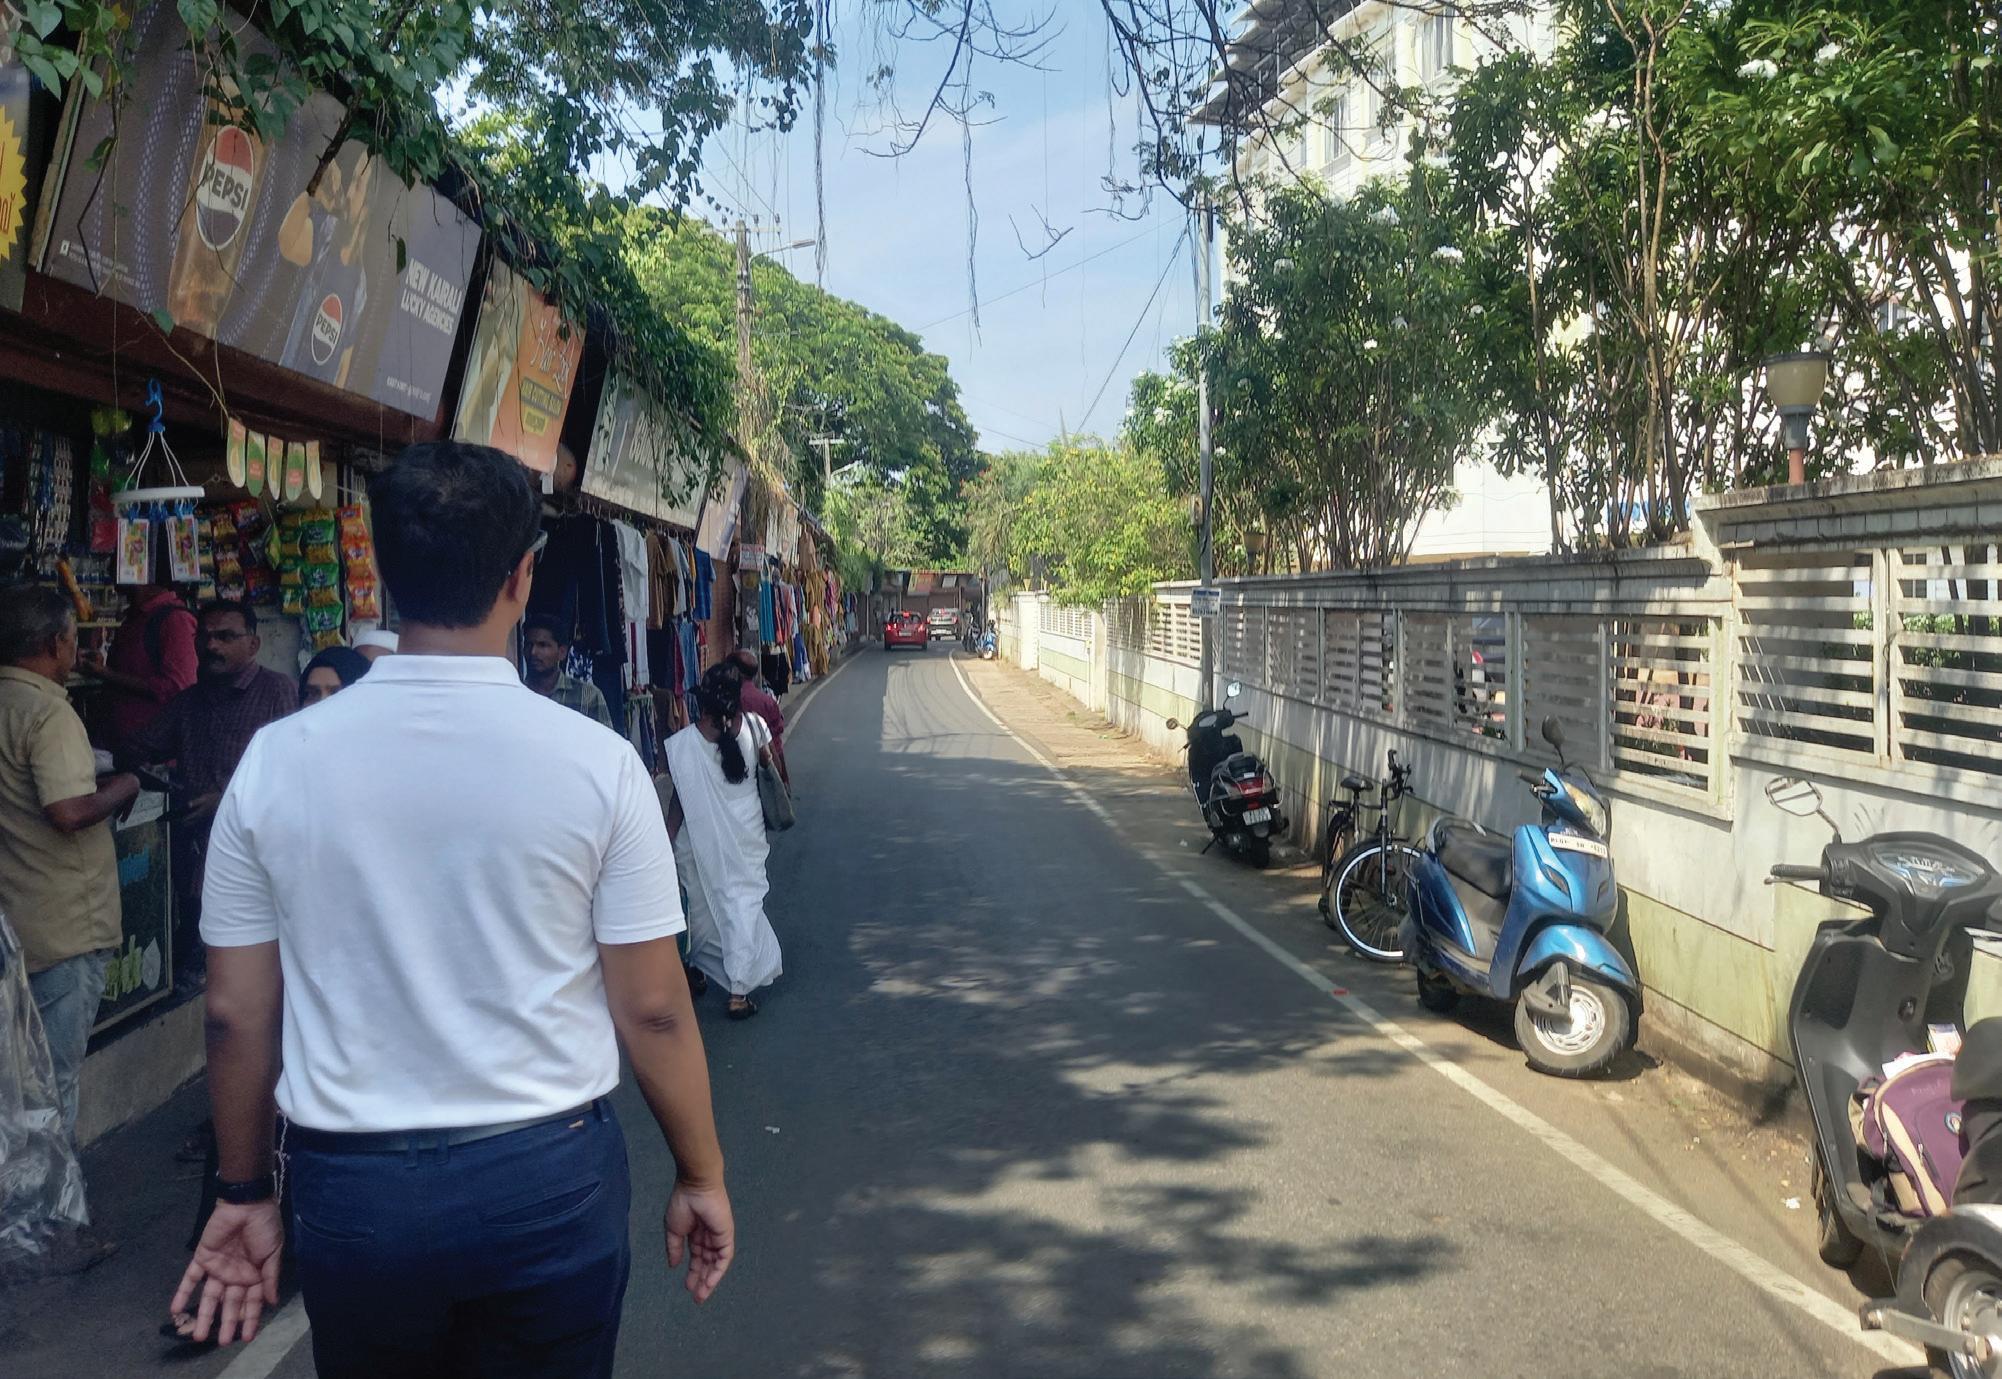
1. Develop safe and comfortable pedestrian walkways
2. Developing safe pedestrian crossings
1. Optimized transition between different modes of transport (to reduce transition and waiting time between different modes of transport)
2. Schedule optimization (to avoid bus bunching and overcrowding, real time updates and optimization is required)
1. Clear and consistent signage.
3. Table-top crossings for traffic calming
2. Real-time tracking and information Display.
1. Fare integration between different modes of transport for a lean fare system.
4. Universal accessibility
3. Route rationalization (to cater to all routes in the city optimally, w.r.t demand and usage though the day)
4. Network expansion through PT or IPT (to serve and connect all parts of the city efficiently)
5. Sufficient shade and green cover
6. Well-lit edges for safety
7. Last-mile connectivity
8. Integration of several modes of transit and the transit hub with the neighborhood via robust last mile connectivity
Table. 5. : Categories of Intervention
3. Multilingual support for the ease of commuters.
2. Institutional integration between different stakeholders with specific responsibilities to ensure the smooth functioning and maintenance of the interventions.
3. Setting up an action team to strengthen on-ground support and carry through the interventions.
Thampanoor and East Fort Corridor
Existing transit node and its features
Thampanoor, despite being a key multimodal hub with both a major railway station and central bus terminal, faces several infrastructural and operational challenges. Pedestrian movement is unsafe due to the lack of proper crossings and obstructed walkways. The area is congested, with unregulated IPT operations adding to the chaos. Footpaths are narrow, uneven, or inaccessible, and basic commuter amenities such as shaded waiting areas and clear signage are missing, making transfers between modes inefficient and uncomfortable.
East Fort, one of the city’s most active bus terminals, suffers from inadequate pedestrian infrastructure and poor modal integration. The existing foot overbridge is located nearly 180 metres away, making it inconvenient, while at-grade crossings are unsafe or missing. There is no dedicated IPT zone, and the bus bays are disorganised, leading to confusion and unsafe conditions for commuters. The area also lacks basic passenger facilities such as shelters, seating, and lighting.
Key Observations:
• Pedestrian movement between the railway station and bus stand is unsafe and unorganised.
• Bus stop lacks shaded waiting areas and clear signages.
• IPT operates in an unregulated manner near the station.
• Unsafe pedestrian crossings: existing foot overbridge is distant and underused.
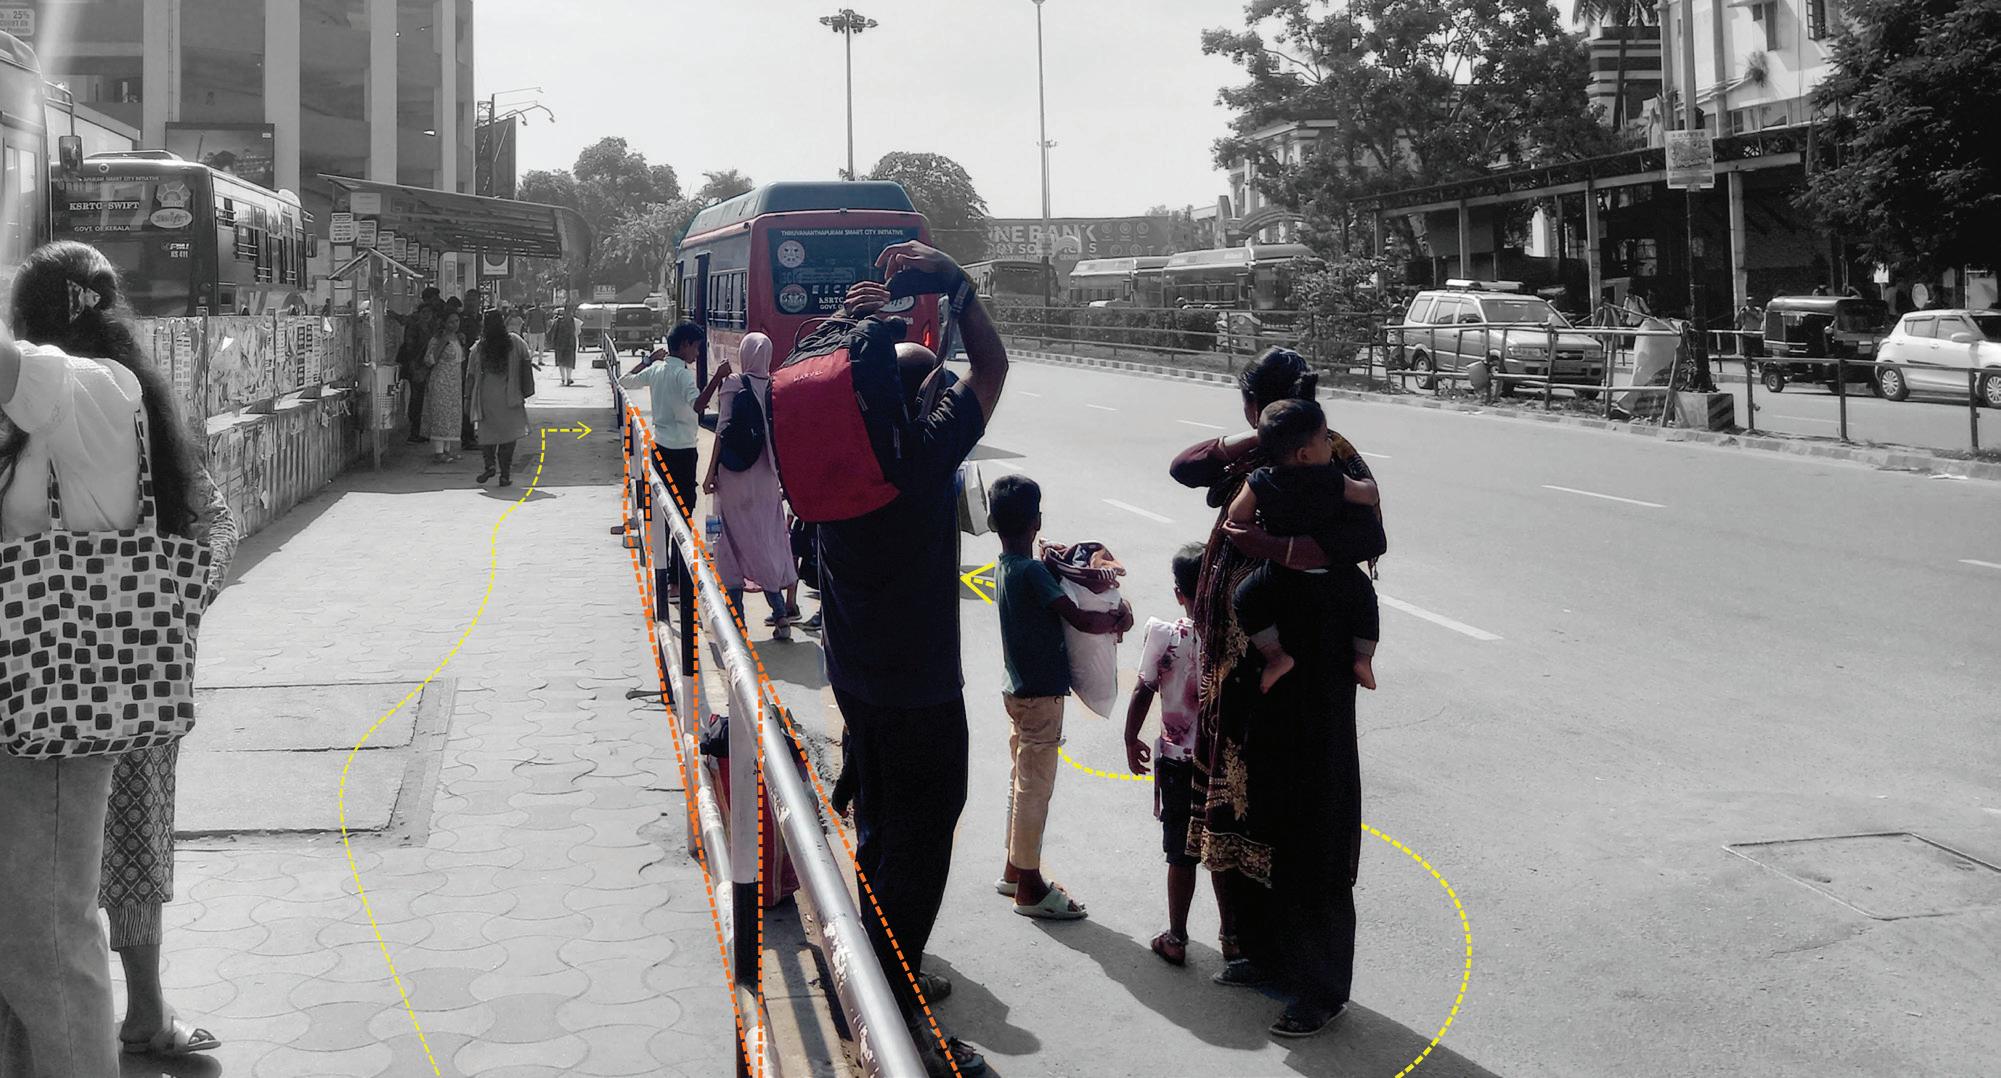
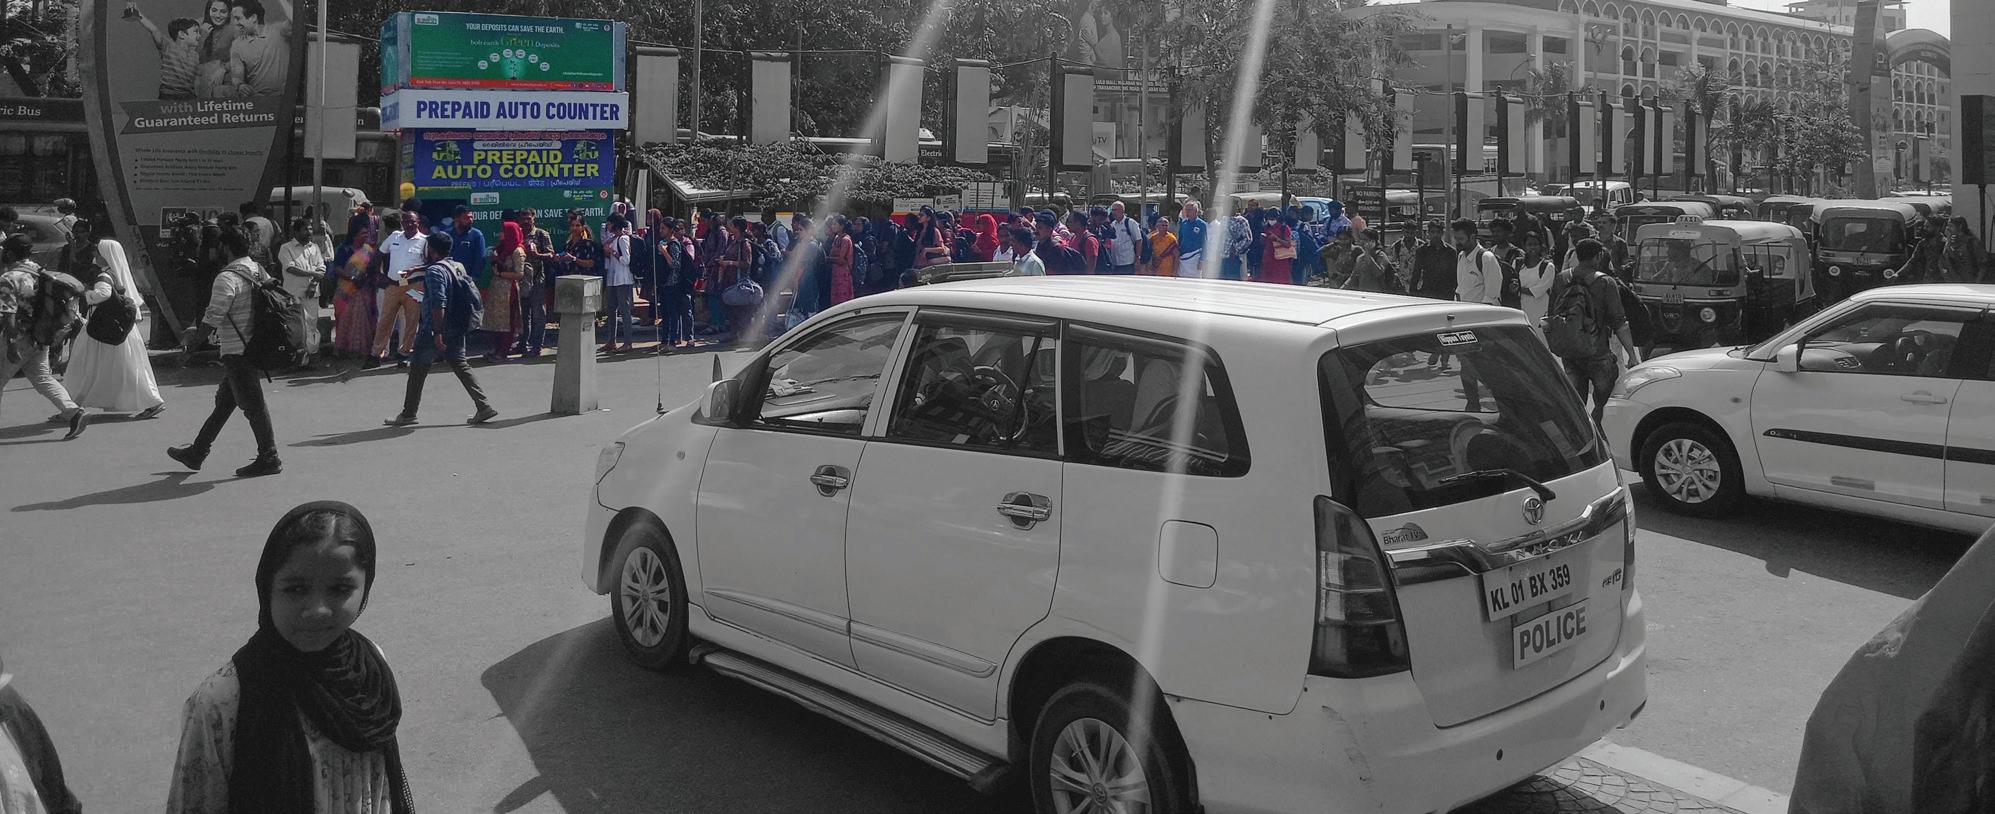
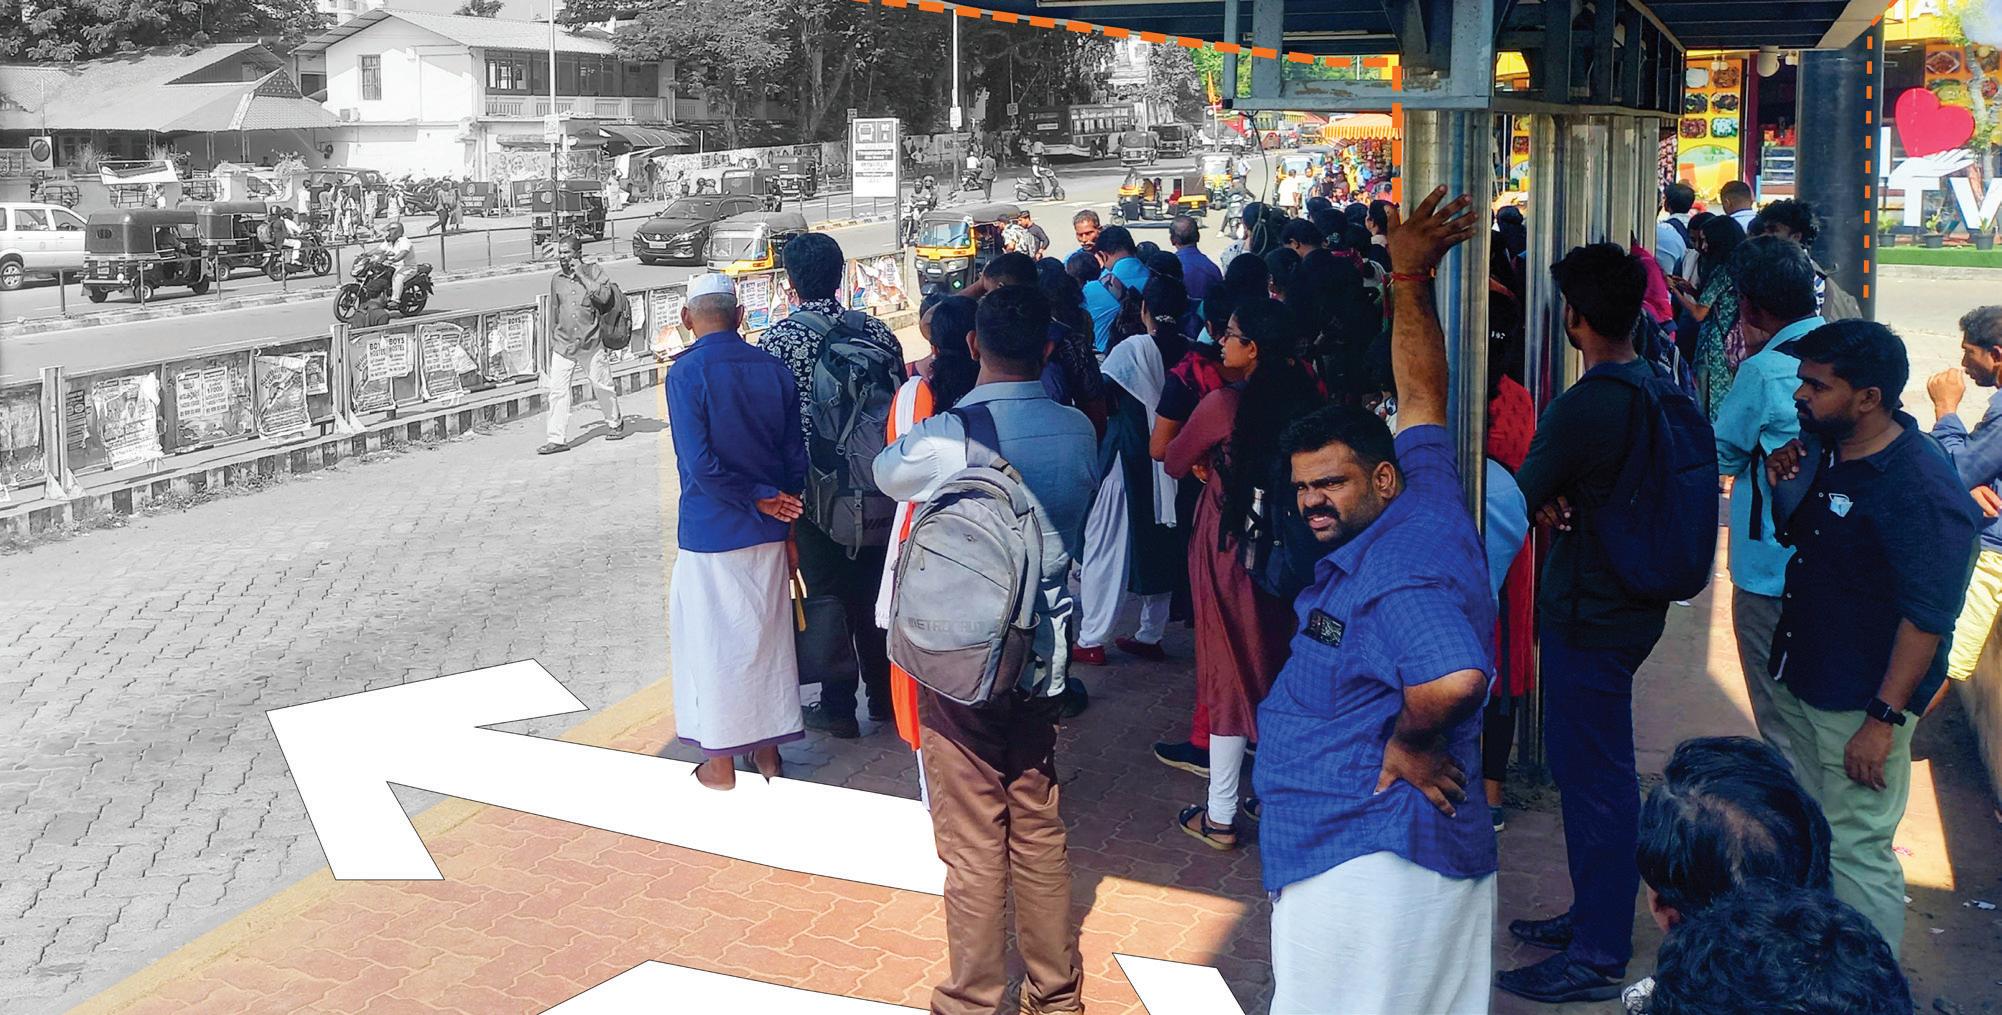
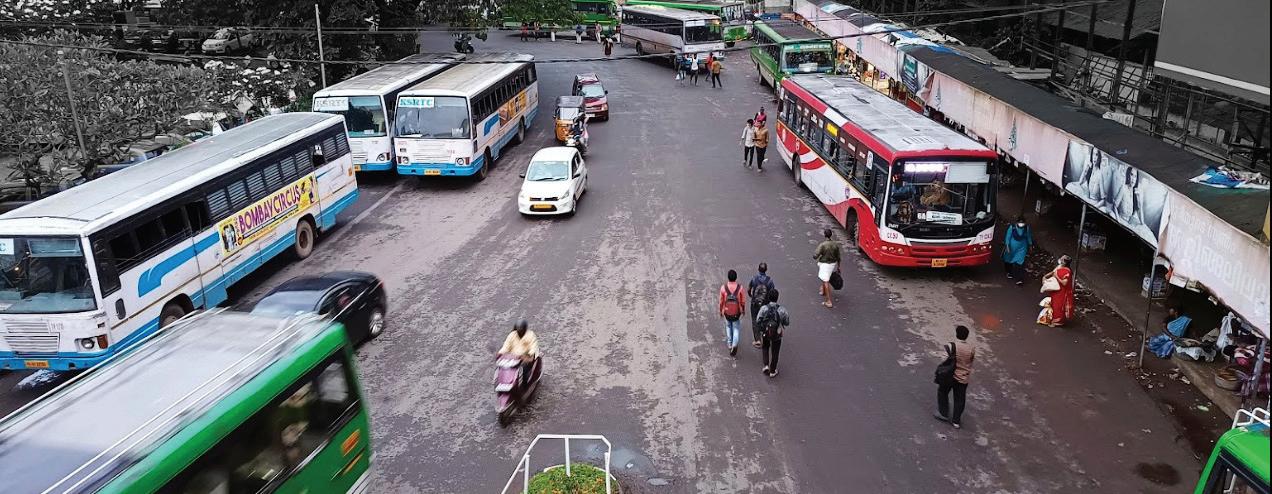
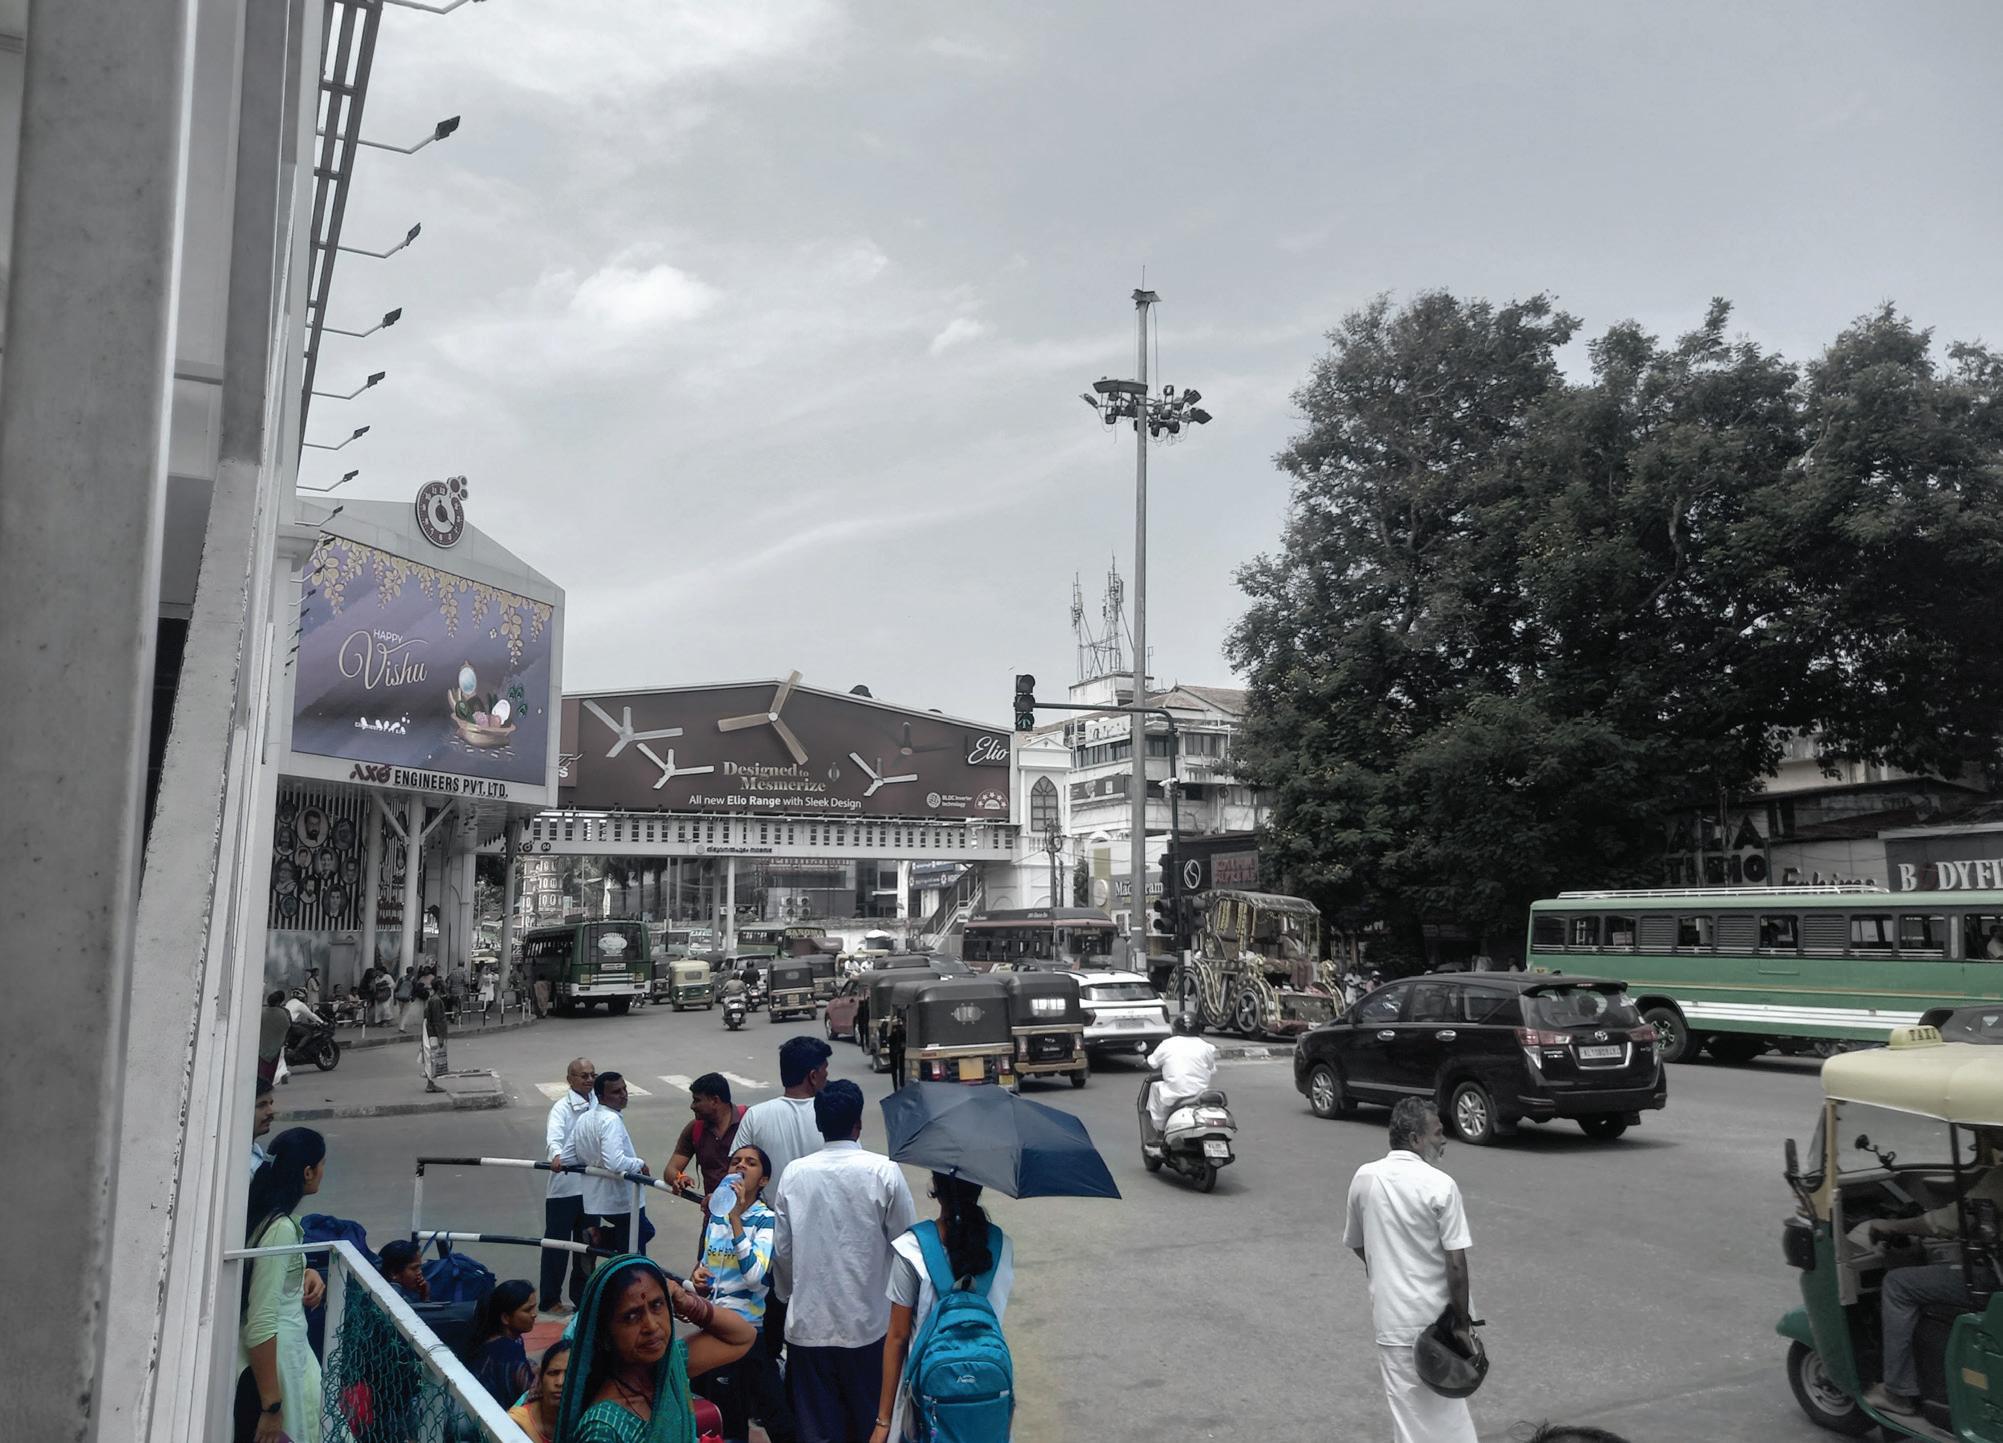
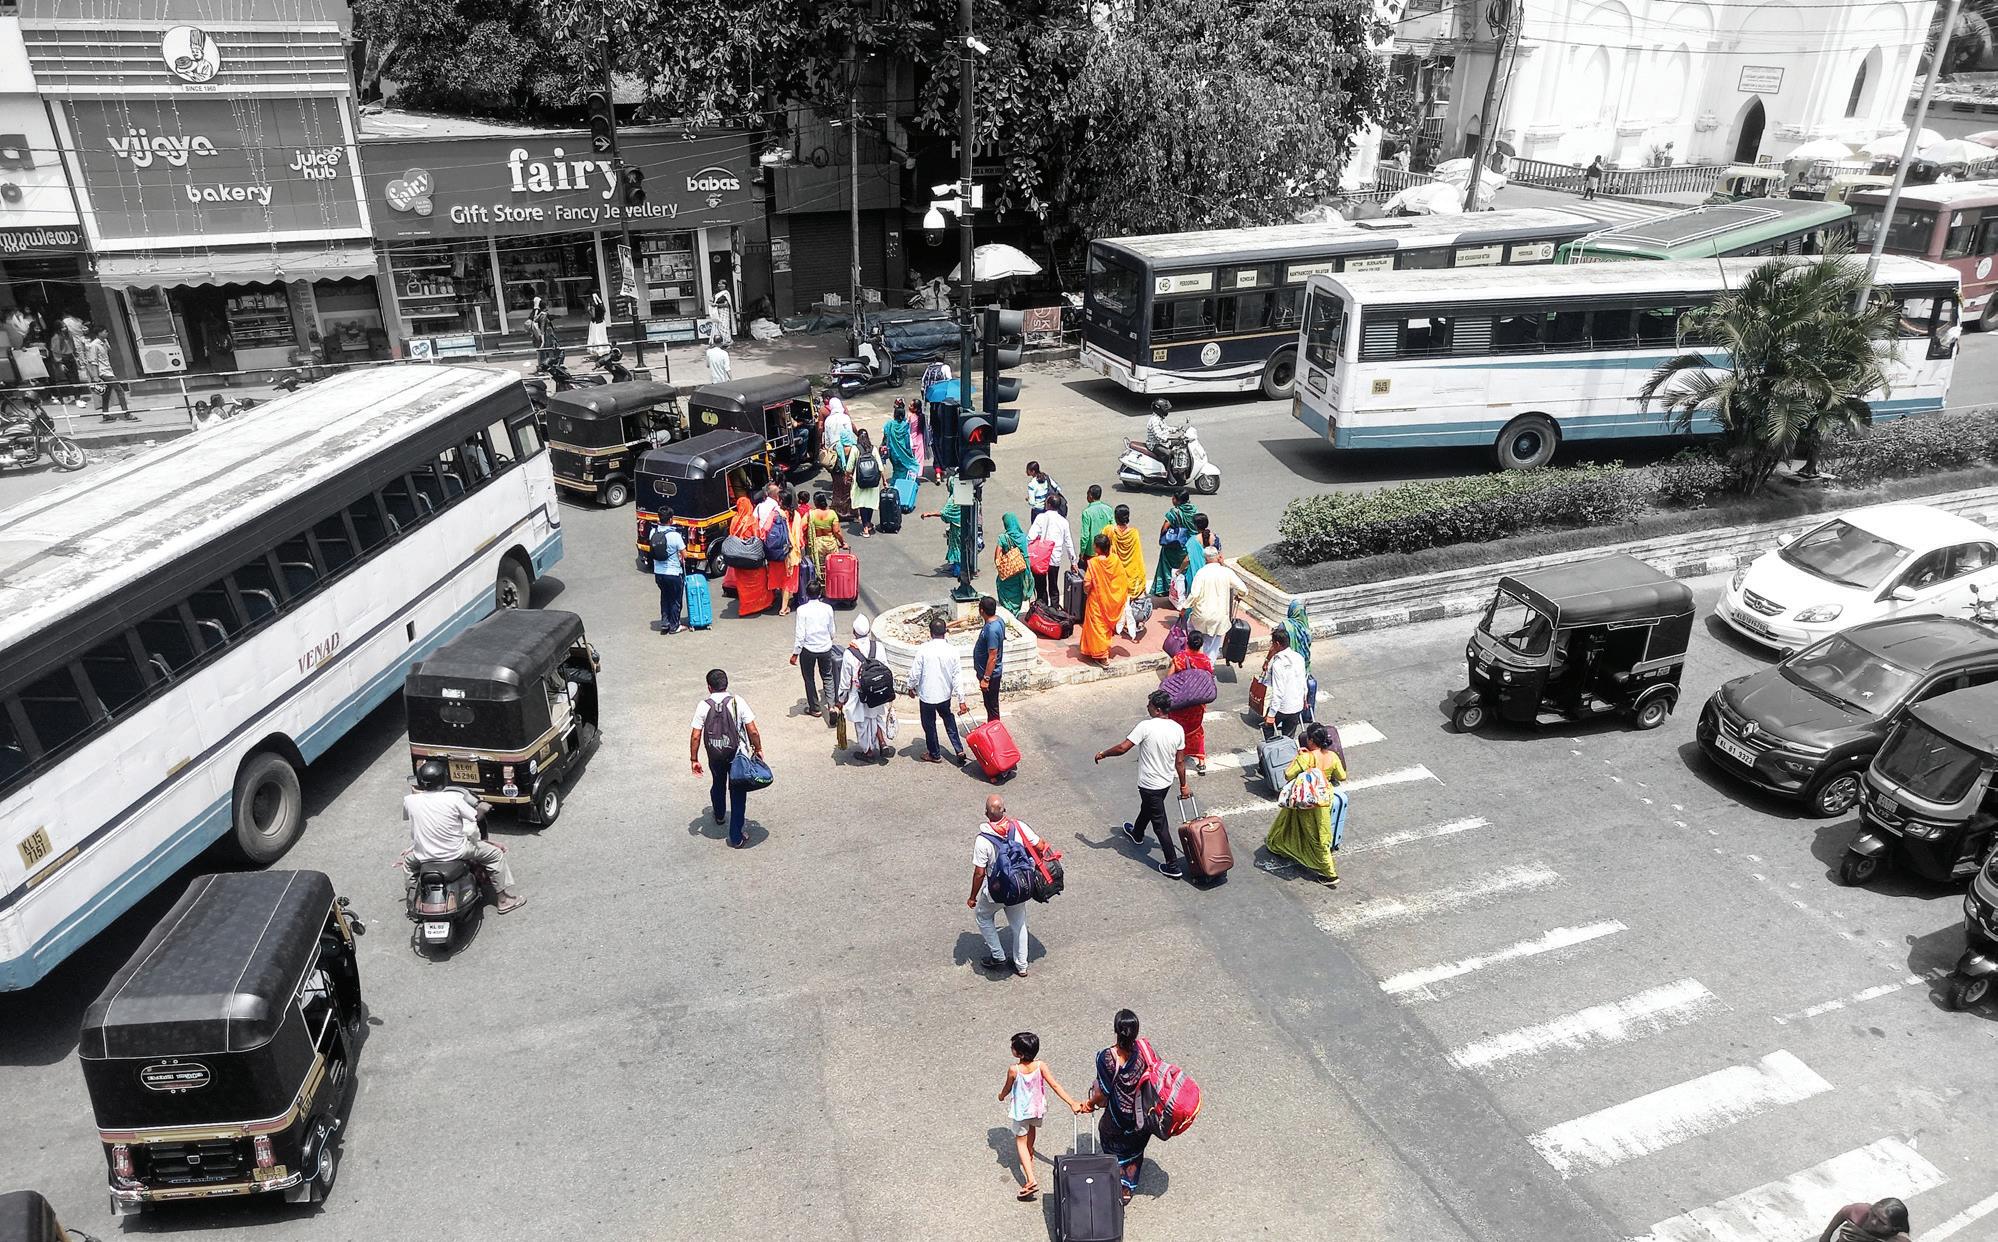
The intervention proposes the development of a continuous, pedestrian-priority corridor that integrates the KSRTC Central Bus Terminal and Thampanoor Railway Station. By formalizing IPT operations and enhancing pedestrian infrastructure, this corridor will function as a cohesive multimodal hub, facilitating efficient transfers for daily commuters, intercity travellers, and commercial visitors.
1. Safe Pedestrian Crossing from the exit/ entry of East Fort bus stand, Thampanoor bus stand and train station- 7 safe crossings
2. Foot over bridge to connect Thampanoor bus stand to the railway footover bridge for ease and safety- 1 barrier free foot over bridge to be added.
3. Pedestrian Connection to Thampanoor Railway Station and Bus Stand- Approx. 1500m in length.
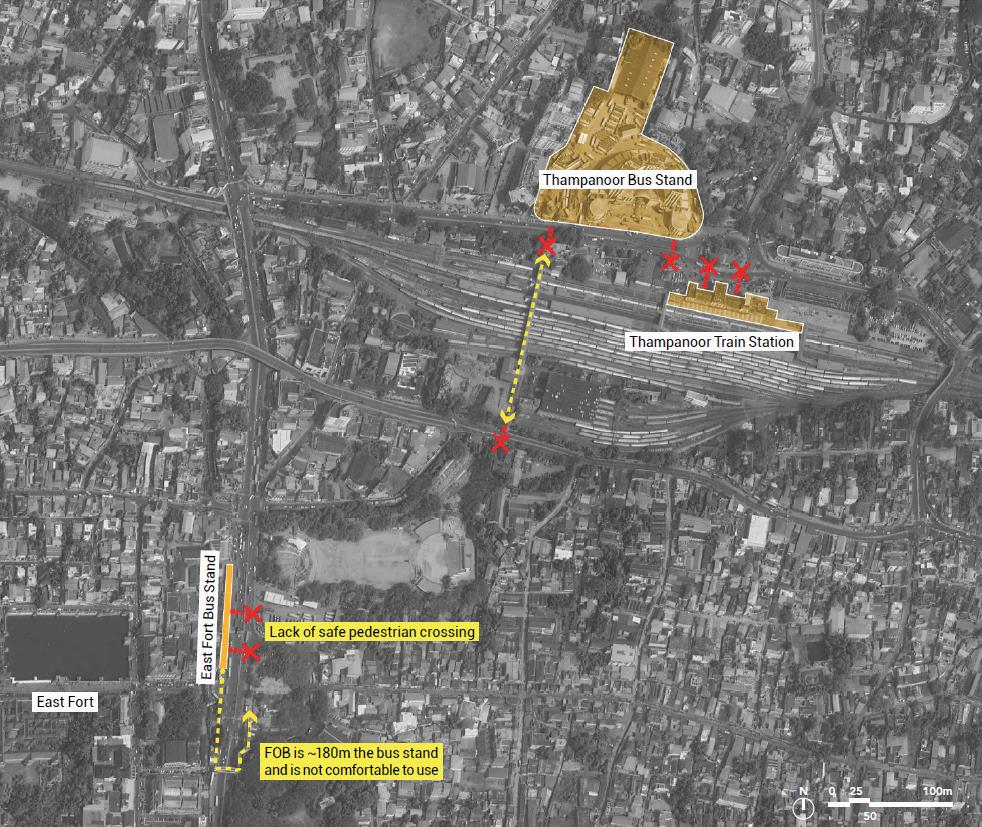
4. Safe and Comfortable Walkways- Minimum 2.5m width on both sides of the street.
5. Streamlined bus bays for safety and ease of commuters.
6. Providing dedicated IPT stops and integration of last mile connectivity.
7. Well-designed public realm with adequate shade, lighting, comfortable waiting spaces and easy to use signage must be prioritized.
8. Streamline last-mile connectivity and integrate fare systems across transit, IPT, and feeder services to enhance accessibility, boost ridership, and position public transport as a preferred, efficient mobility option.
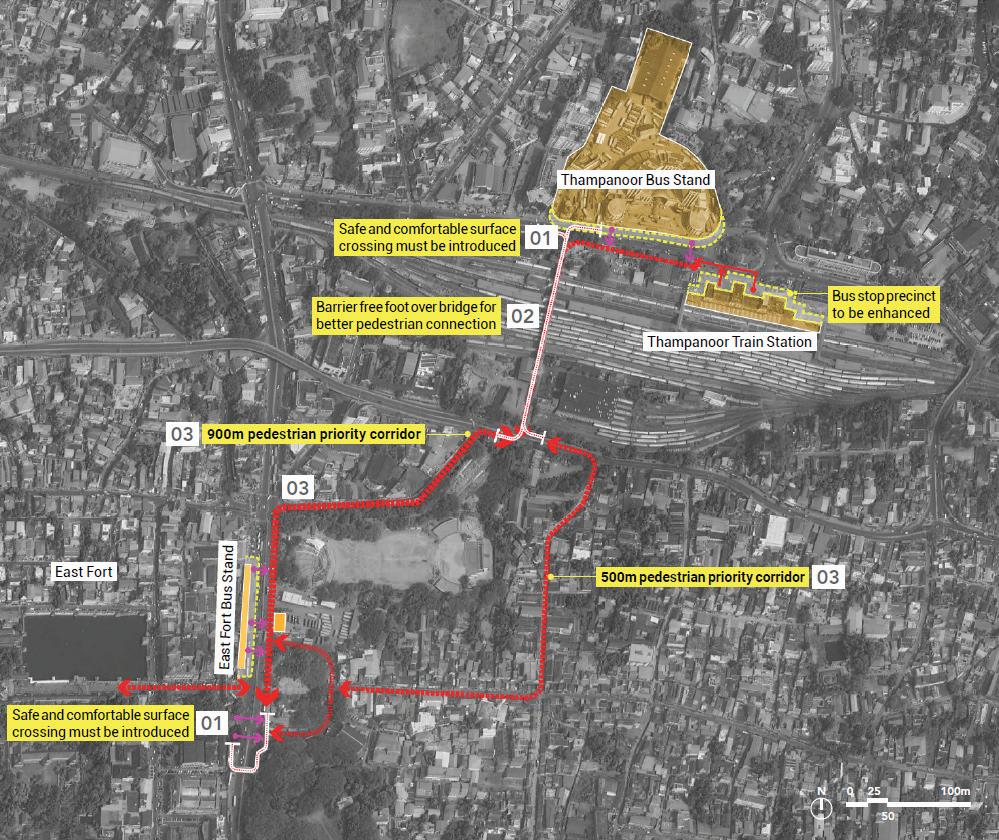
Existing transit node and its features
Palayam, located in a dense institutional and commercial zone, is marked by high pedestrian activity but suffers from a lack of safe, continuous footpaths and designated crossings. The bus stop is poorly defined and lacks comfortable waiting areas. There is no formal IPT stand, leading to congestion and pedestrian-vehicular conflict. The disorganised interface between various modes and poor signage further diminish the stop’s functionality as a key urban node.
Key Observations:
• Narrow or broken footpaths and no formal pedestrian crossings.
• No dedicated area for IPT operations; bus bays are disorganised.
• High conflict between vehicles and pedestrians due to market activity
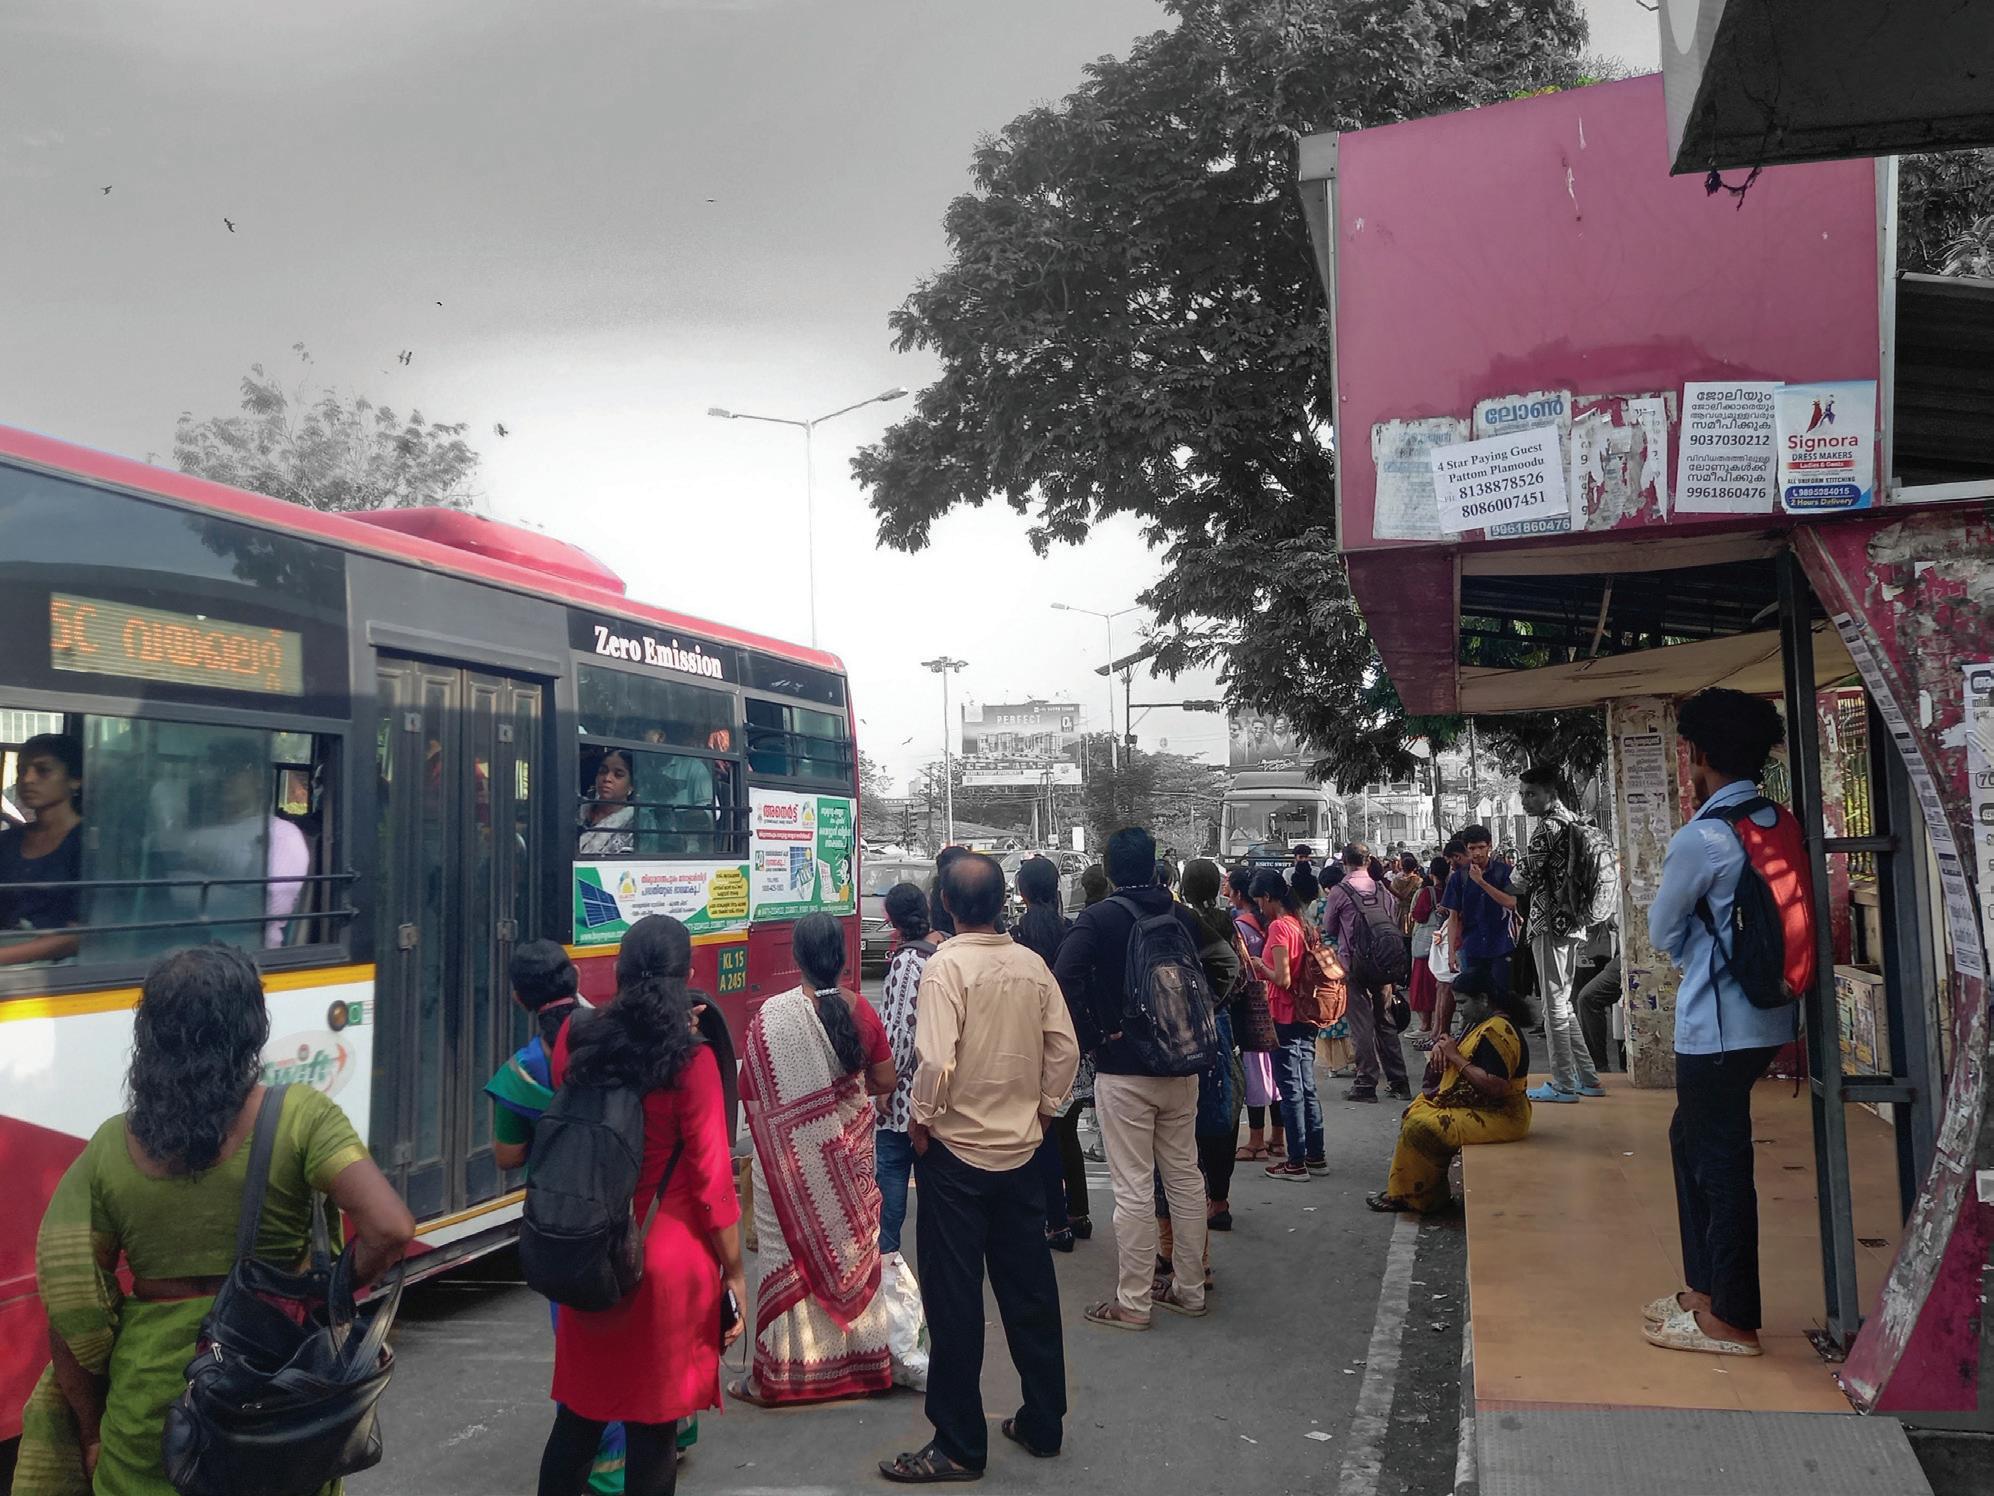
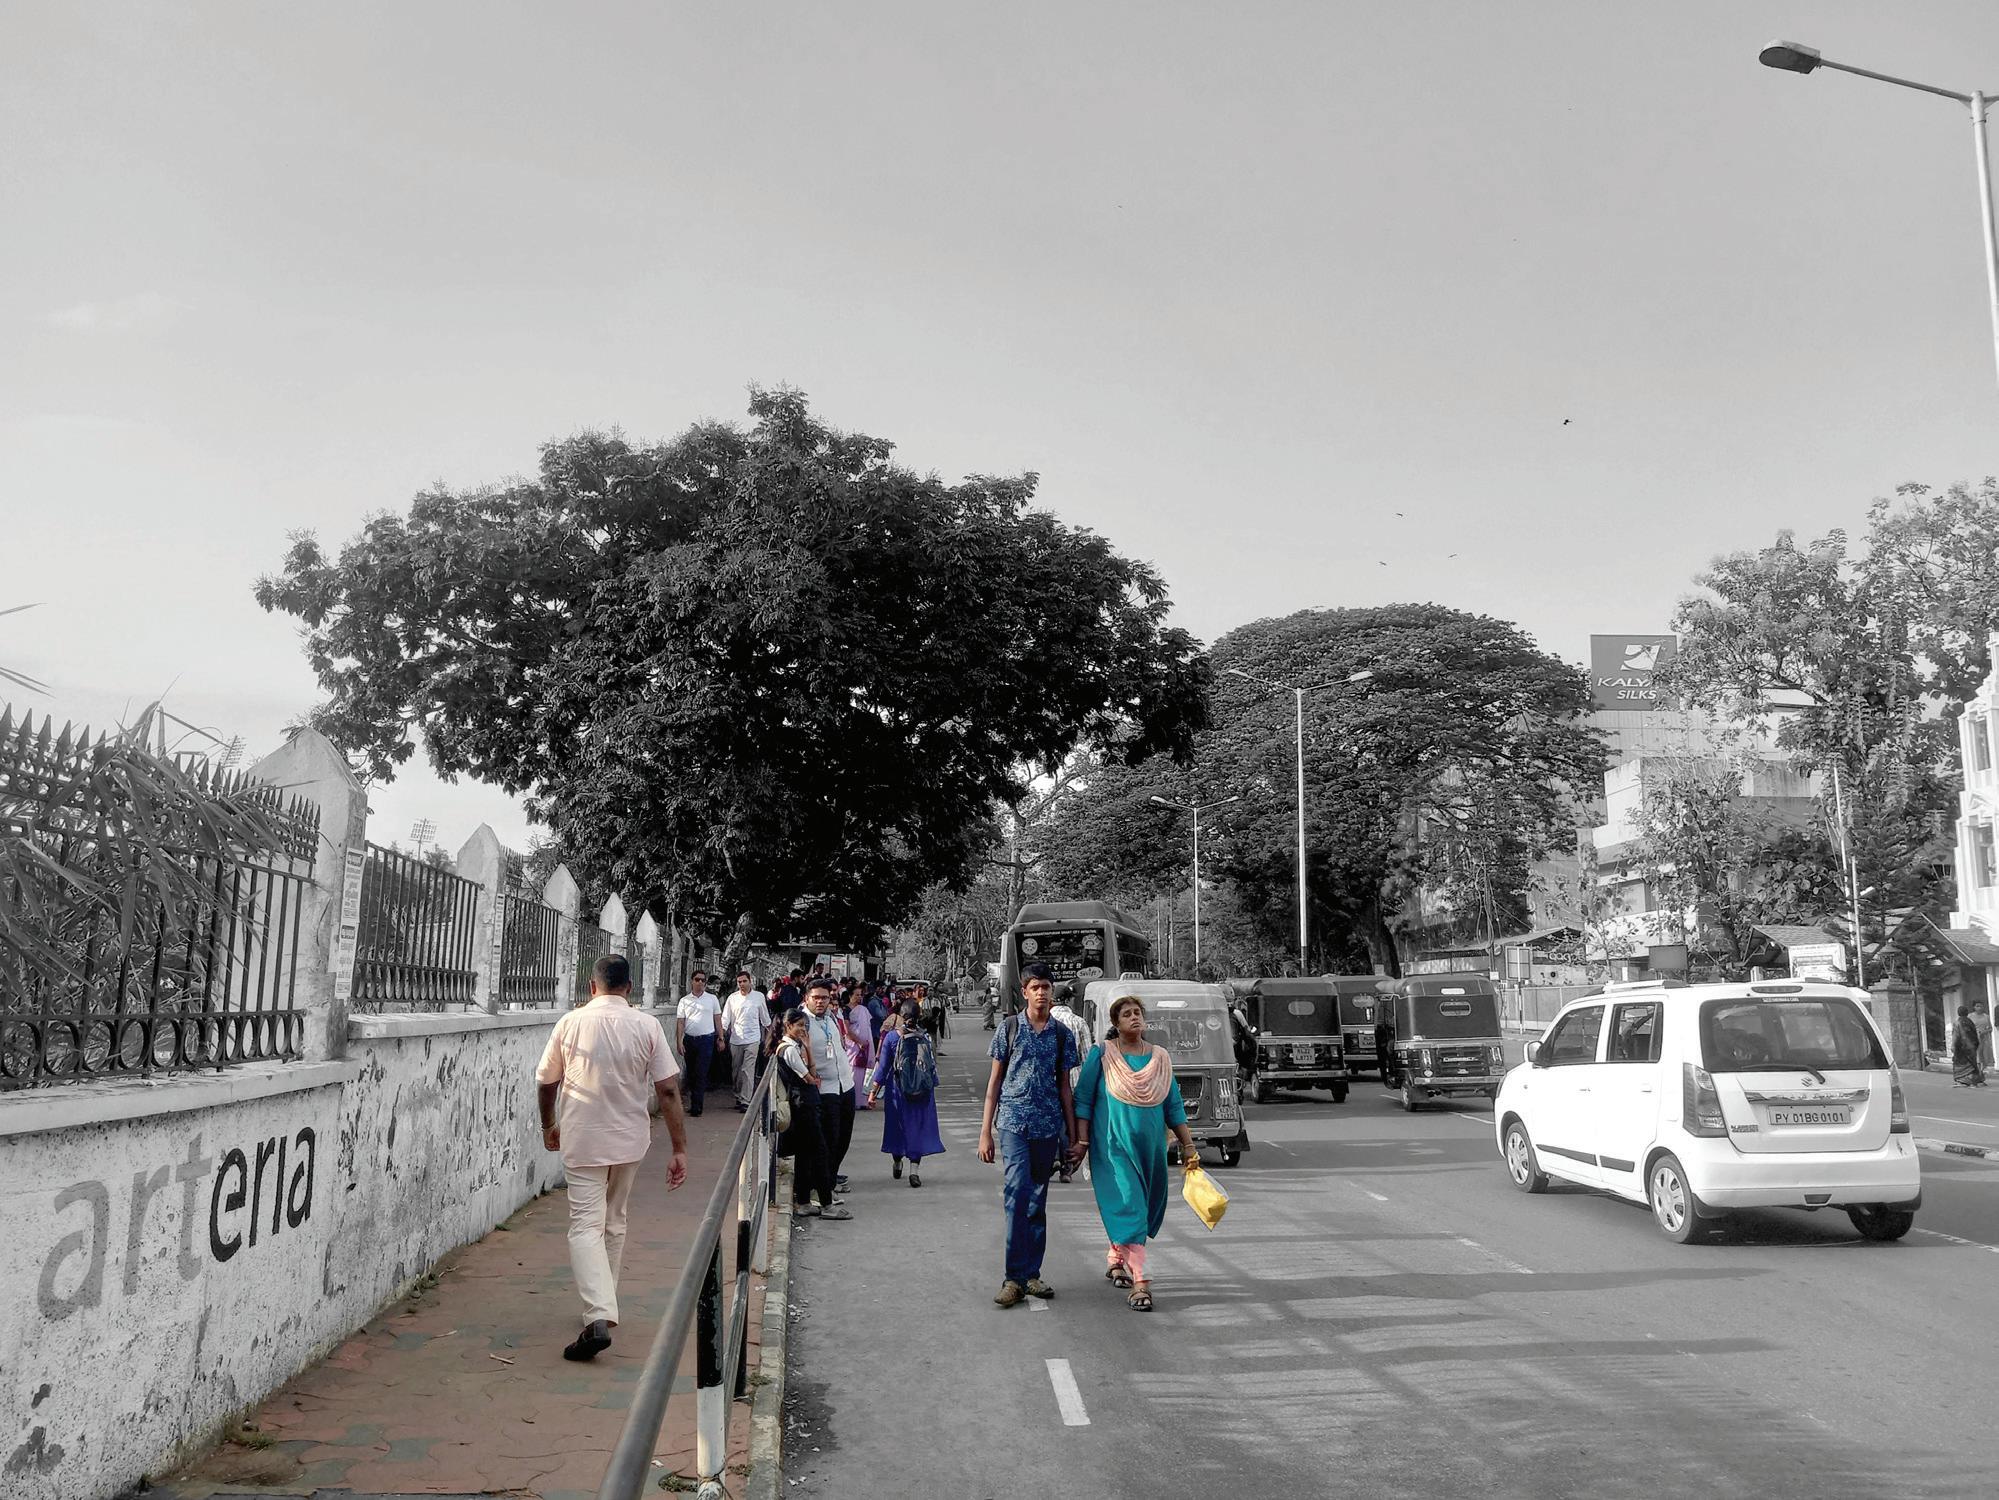
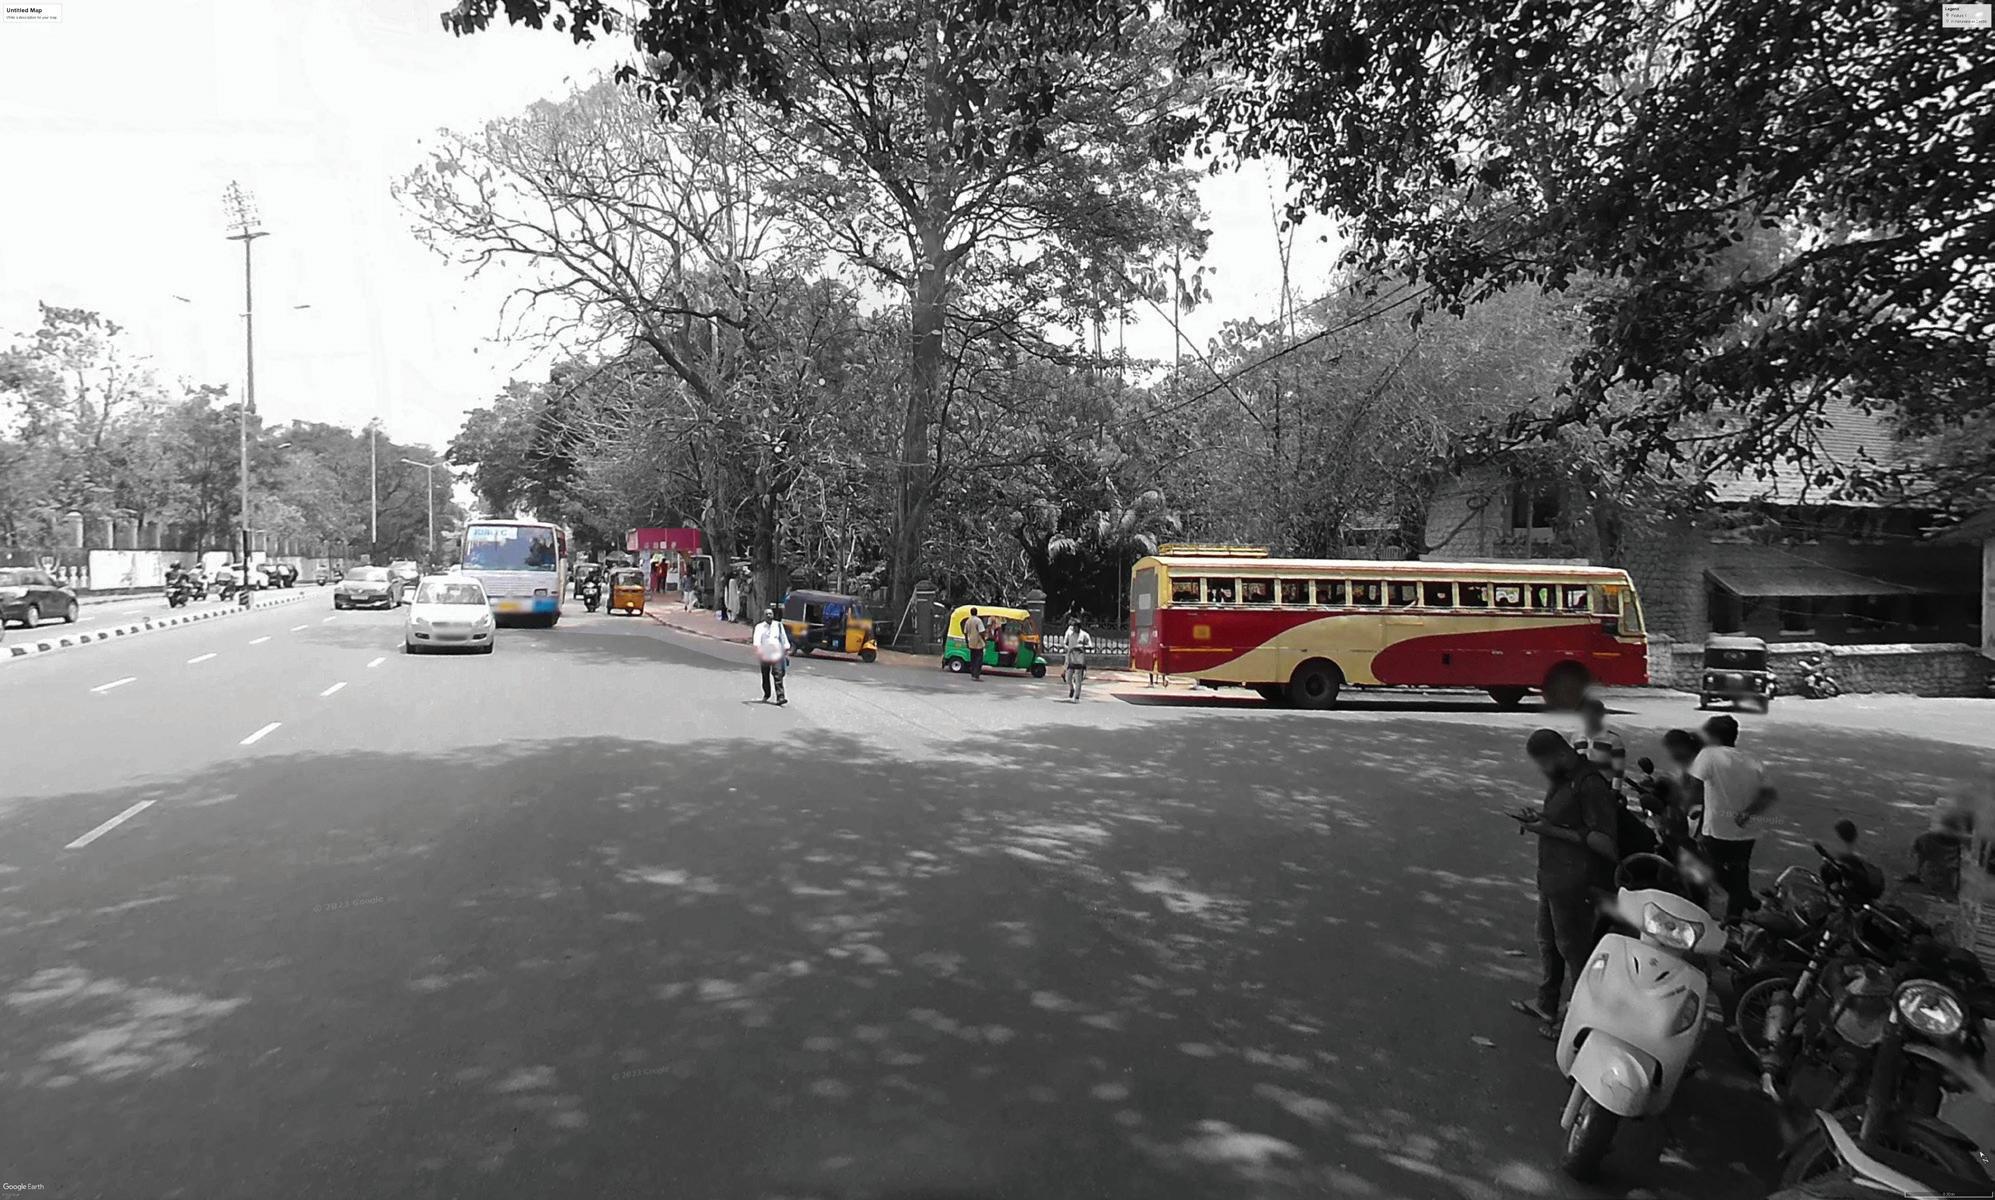
At Palayam, the intervention seeks to formalize IPT and bus operations through designated bays and improve pedestrian infrastructure, establishing the area as a legible, safe, and efficient multimodal transfer node. This will support the high volume of civic, institutional, and commercial activities within the precinct.
1. Safe Pedestrian Crossing- 11 safe crossing
2. Safe and Comfortable Walkways- Minimum 2.5m wide on both sides of the street.
3. Provide a safe and comfortable pedestrian realm- Approx length 1km
4. Providing dedicated IPT stops and integration of last mile connectivity
5. Well-designed public realm with adequate shade, lighting, comfortable waiting spaces and easy to use signage must be prioritized.
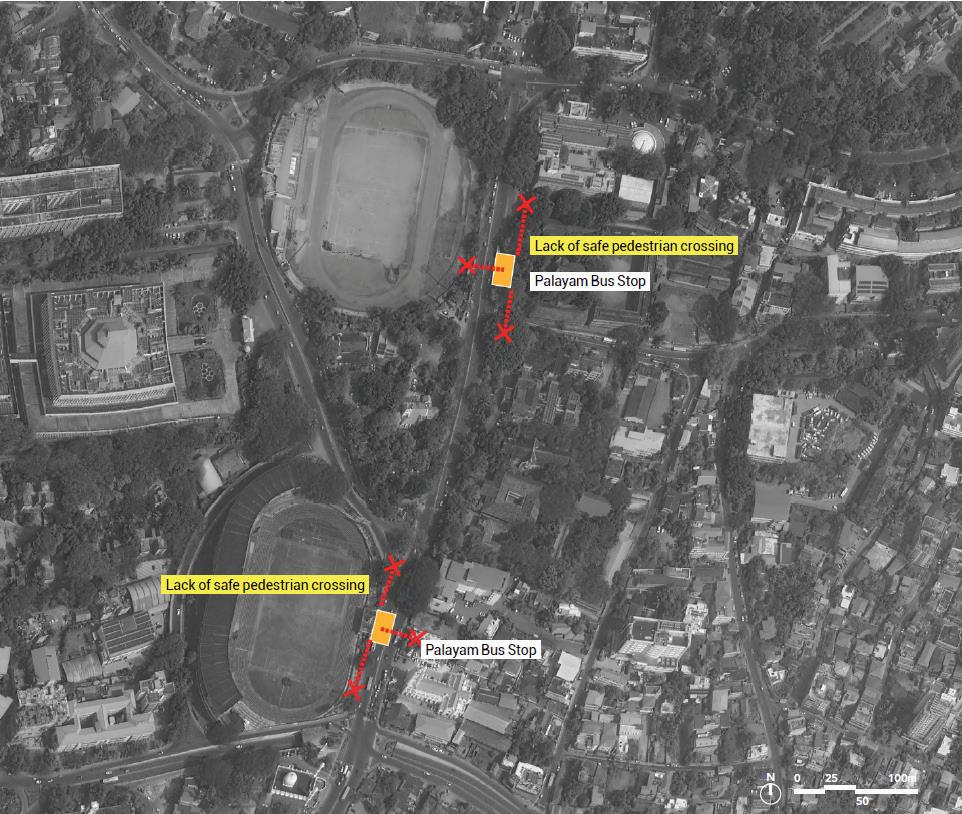
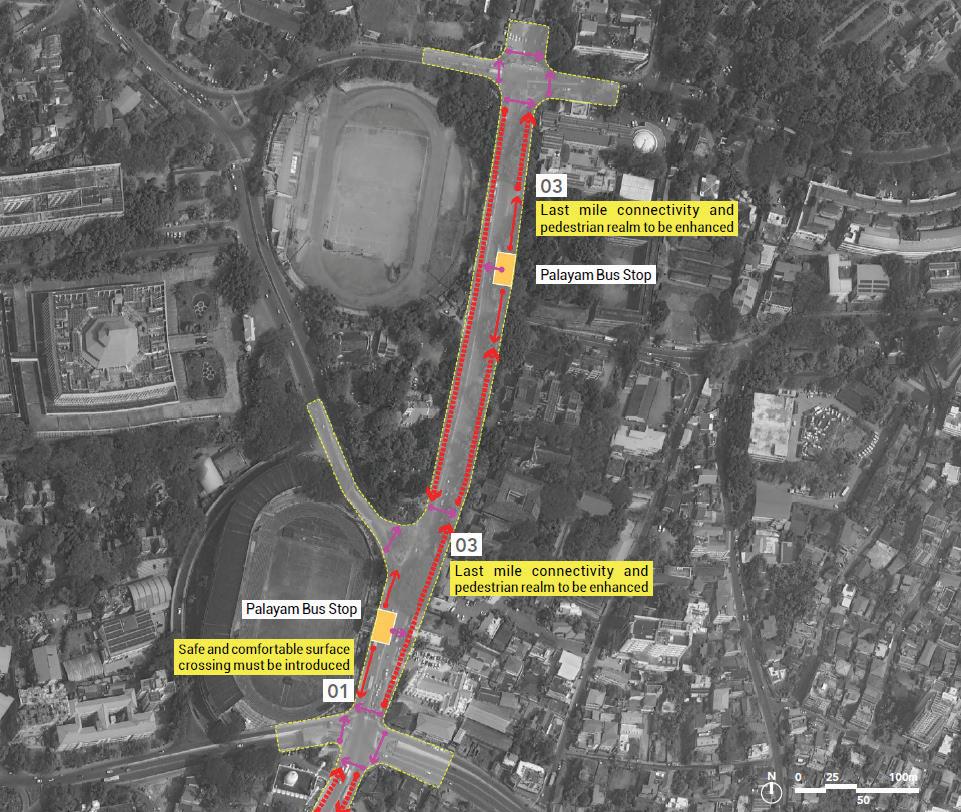
Existing transit node and its features
Despite its location near Kochuveli Railway Station and opposite a major destination like Lulu Mall, this bus stop lacks even the most basic infrastructure. There are no formal bus bays or shelters, and pedestrian access from the highway is unsafe and unclear. There is also no designated area for IPT, and last-mile connectivity between the station, mall, and bus stop is fragmented and poorly marked, reducing its effectiveness as a transit hub.
Key Observations:
• Bus stop lacks basic infrastructure, no shelter, seating, or lighting.
• IPT and pedestrian access are unregulated, especially from the highway.
• Poor connection to nearby railway station and mall.
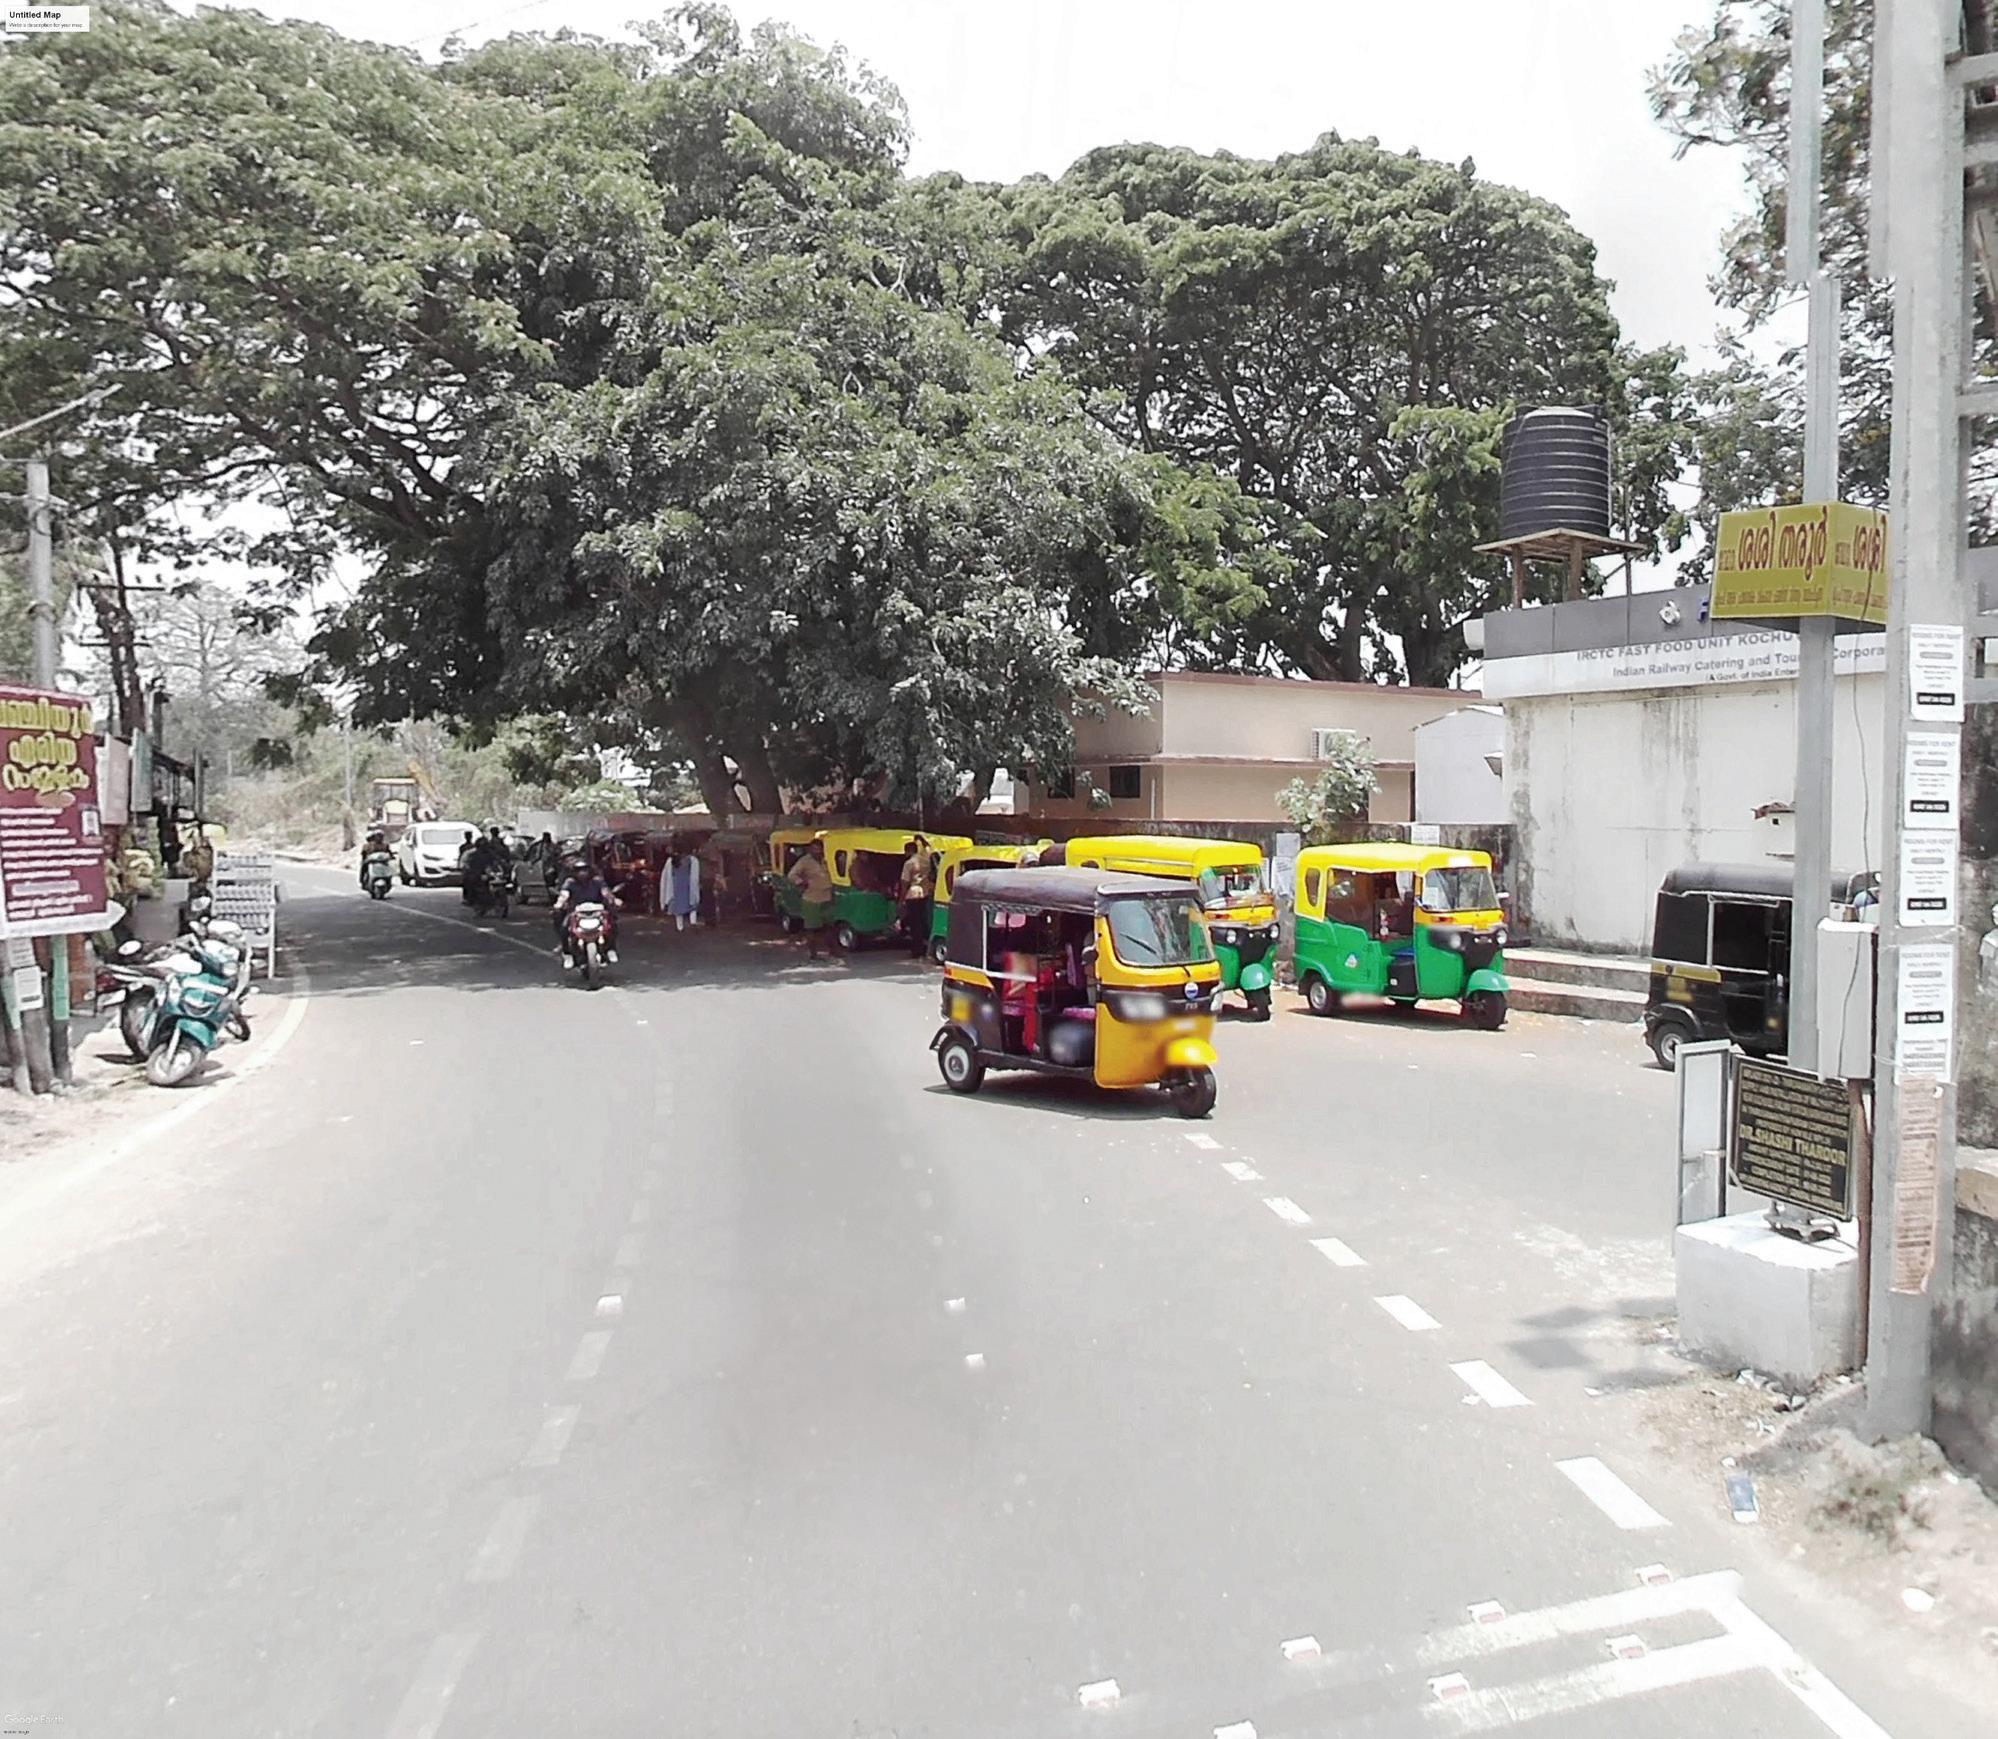
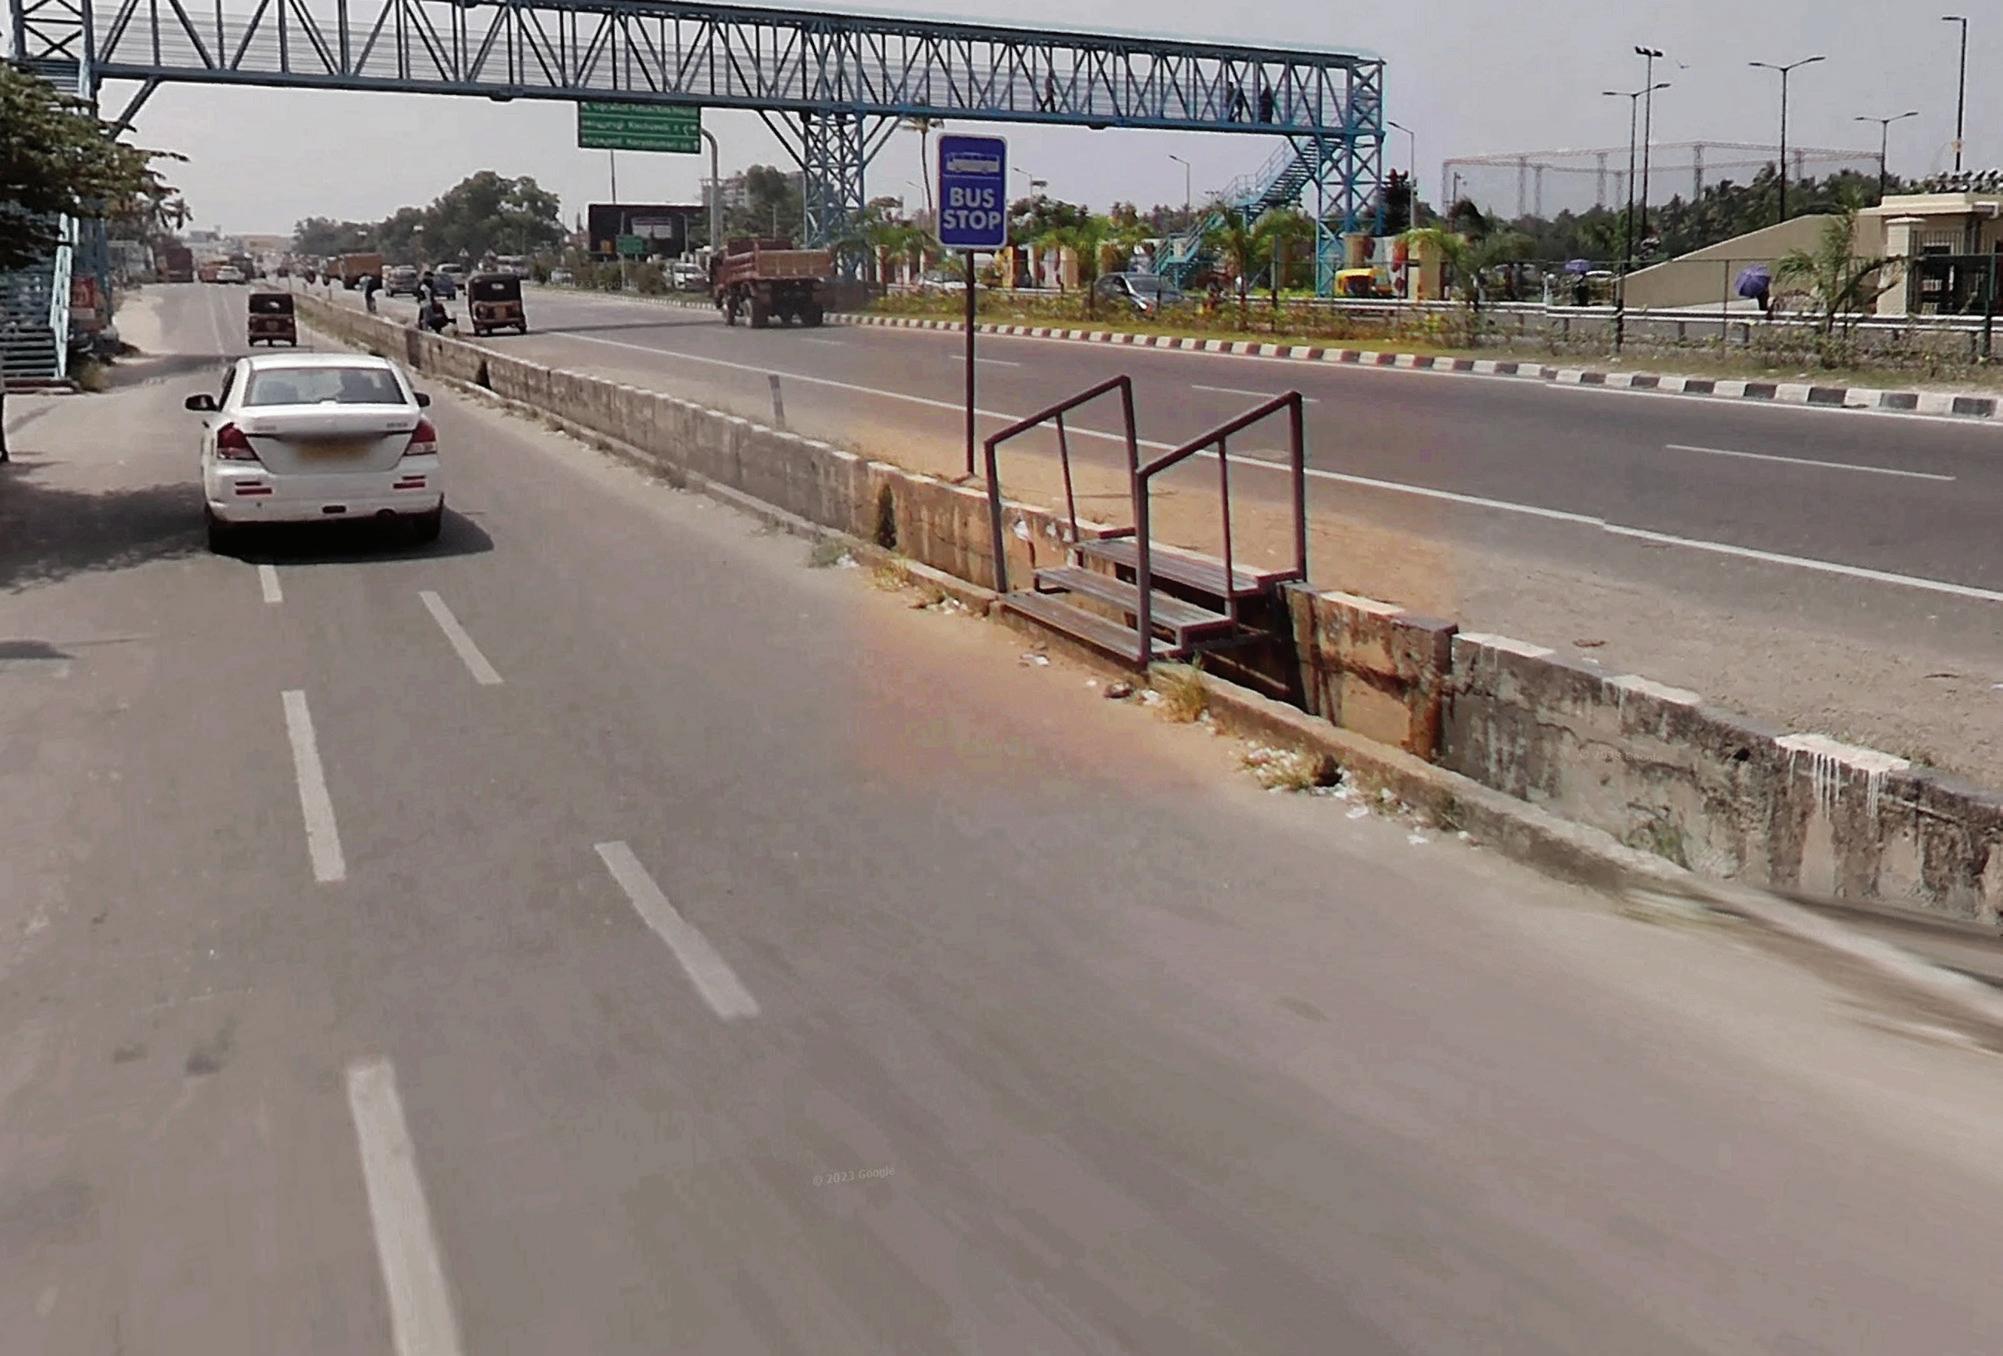
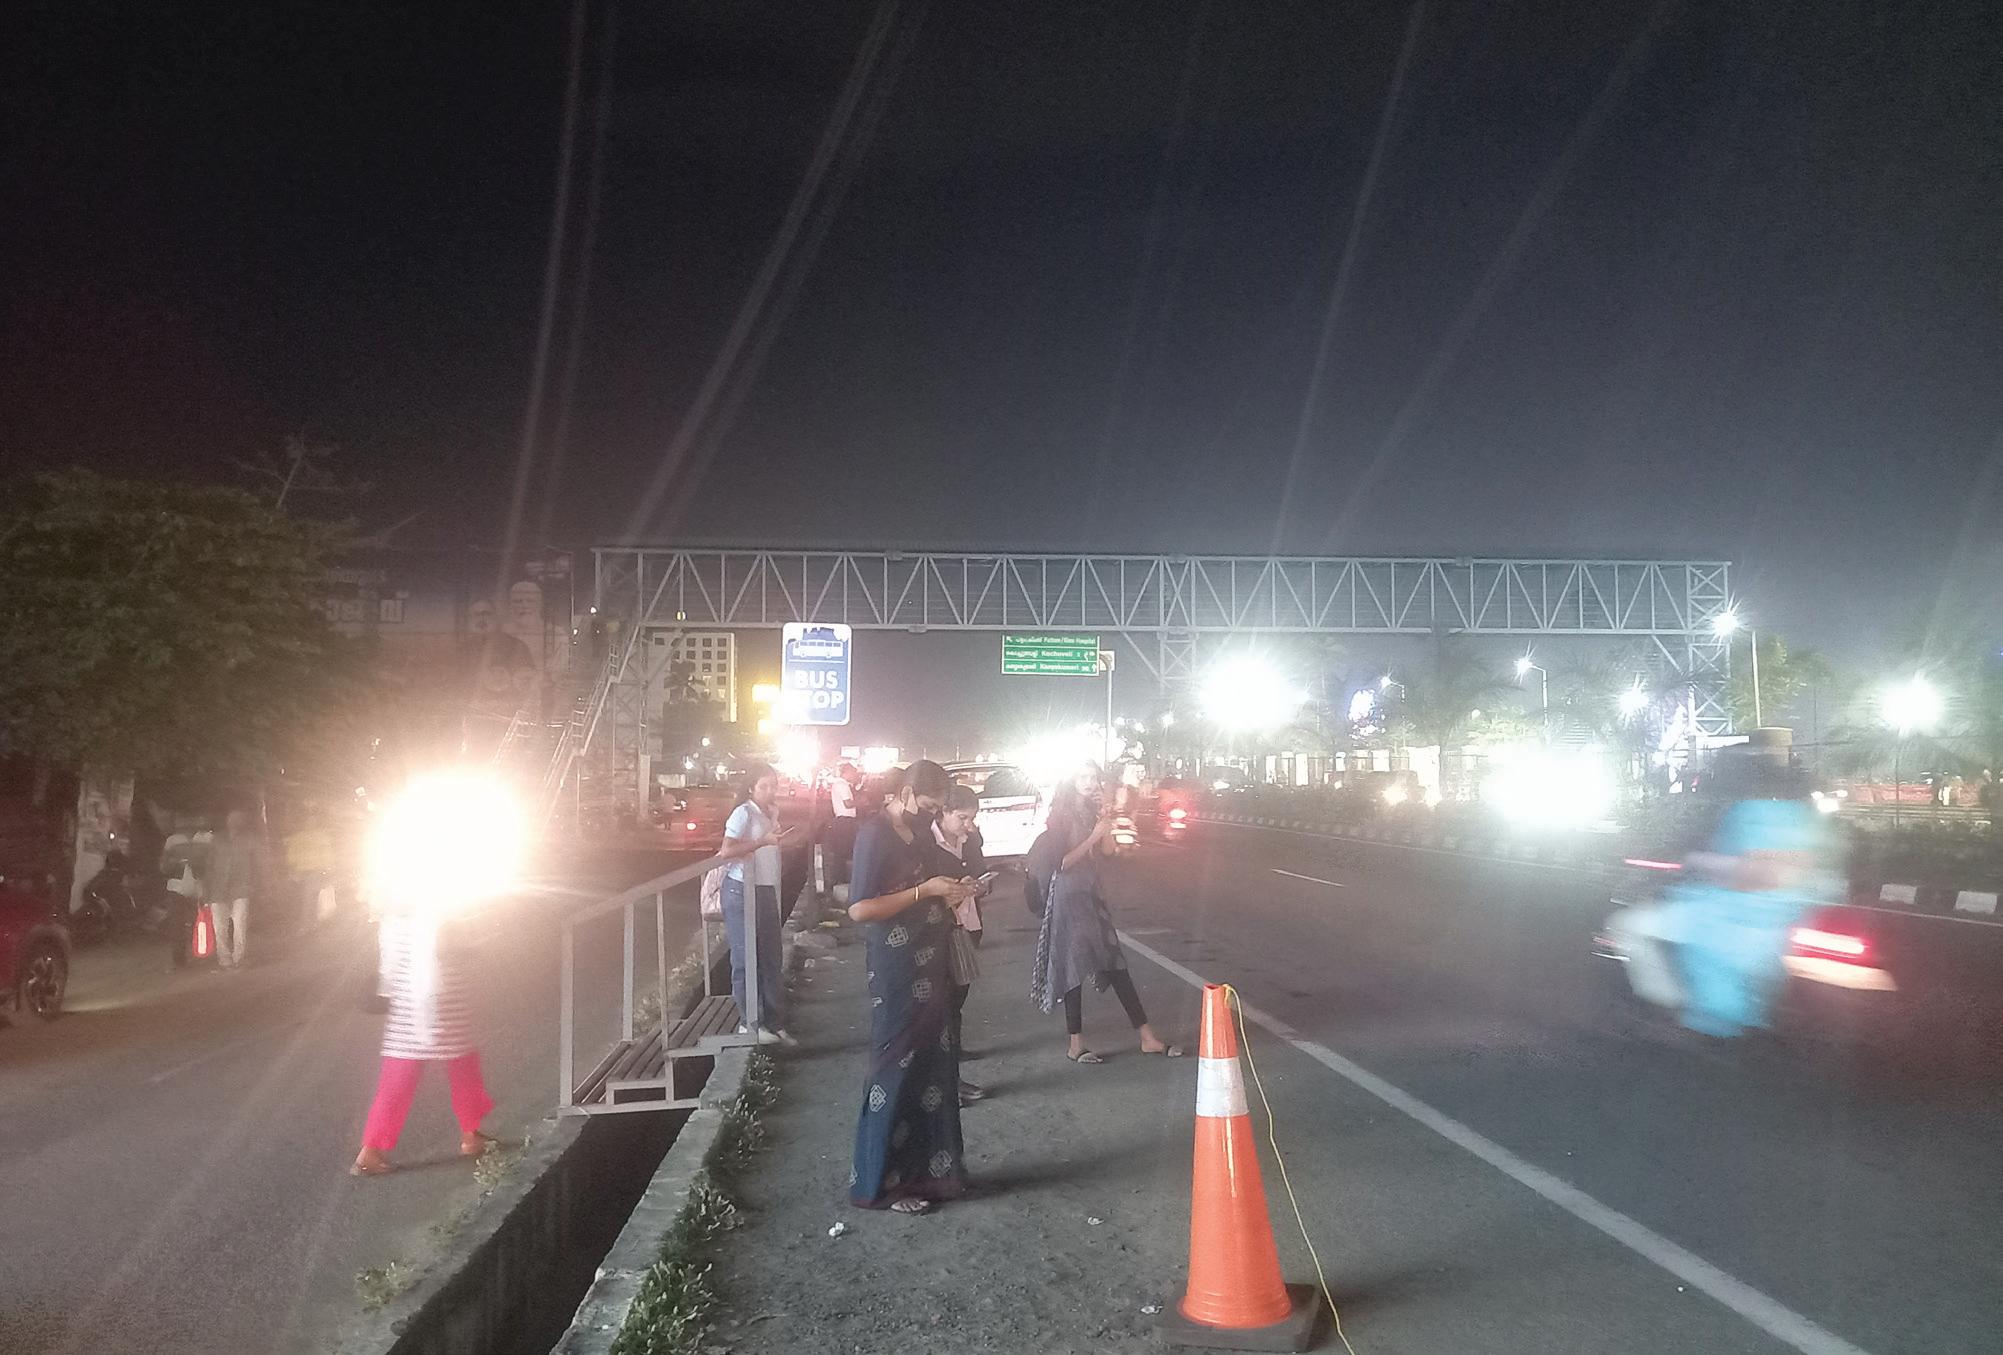
The proposal focuses on repositioning Kochuveli as a multimodal interchange node, seamlessly connecting the Kochuveli Railway Station, LuLu Mall, and city bus services through structured IPT bays and pedestrian linkages. This will strengthen Kochuveli’s role as a regional access point while enhancing user experience for shoppers and intercity passengers.
Key Interventions:
1. Safe Pedestrian Crossing- 3 safe crossings.
2. Safe and Comfortable Walkways- Minimum 2.5m wide on both sides of the street.
3. Providing additional safe and comfortable Bus Stop- 2 Bus Stops
4. Enhancing last mile connectivity between LuLu Mall, highway and the train station- Approx length 2km.
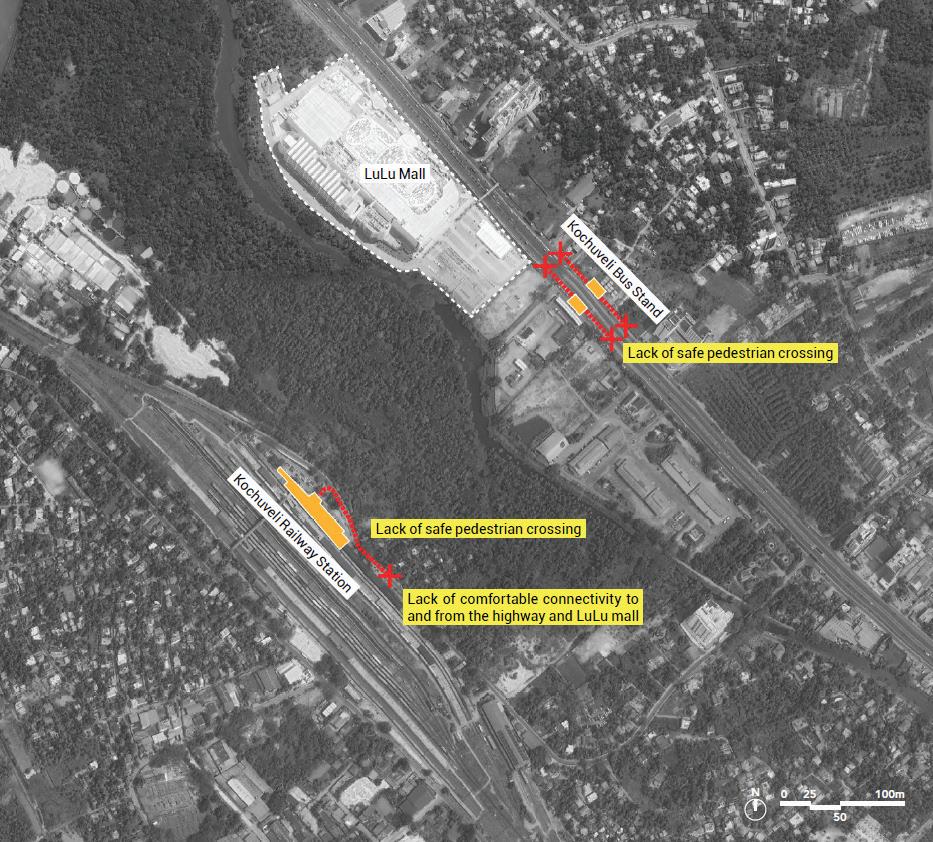
5. Potential direct access to LuLu Mall to be explored to capture footfall to use public transit.
6. Providing dedicated IPT stops and integration of last mile connectivity.
7. Well-designed public realm with adequate shade, lighting, comfortable waiting spaces and easy to use signage must be prioritized.
8. Streamline last-mile connectivity and integrate fare systems across transit, IPT, and feeder services to enhance accessibility, boost ridership, and position public transport as a preferred, efficient mobility option.
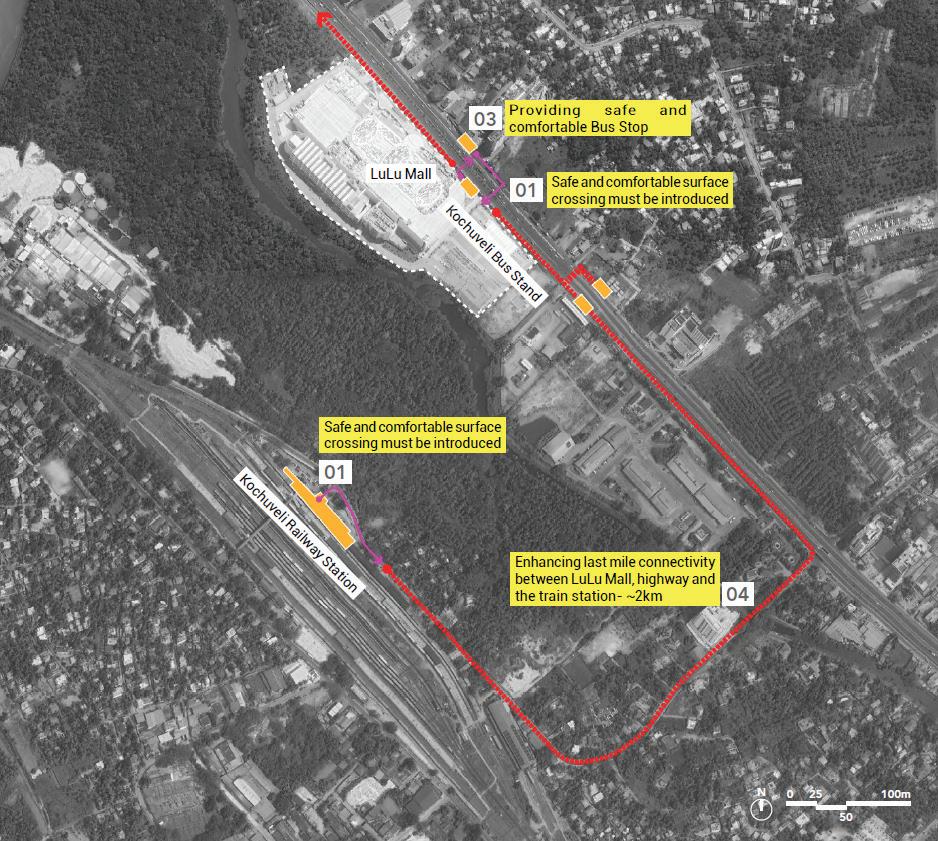
Existing transit node and its features
The Medical College bus stop serves a dense catchment of institutions but is hindered by unsafe pedestrian conditions, inadequate walkways, and the absence of designated IPT zones. The surrounding footpaths are narrow and inconsistent, making access uncomfortable and potentially hazardous. The precinct lacks shelters, seating, and well-organised bus bays, and the unregulated overlap between IPT and public bus services causes congestion and confusion for users.
Key Observations:
• Poor pedestrian infrastructure and no designated space for IPT.
• Area around the stop is congested and lacks seating, shade, or clear access.
• IPT and public buses currently operate in silos.
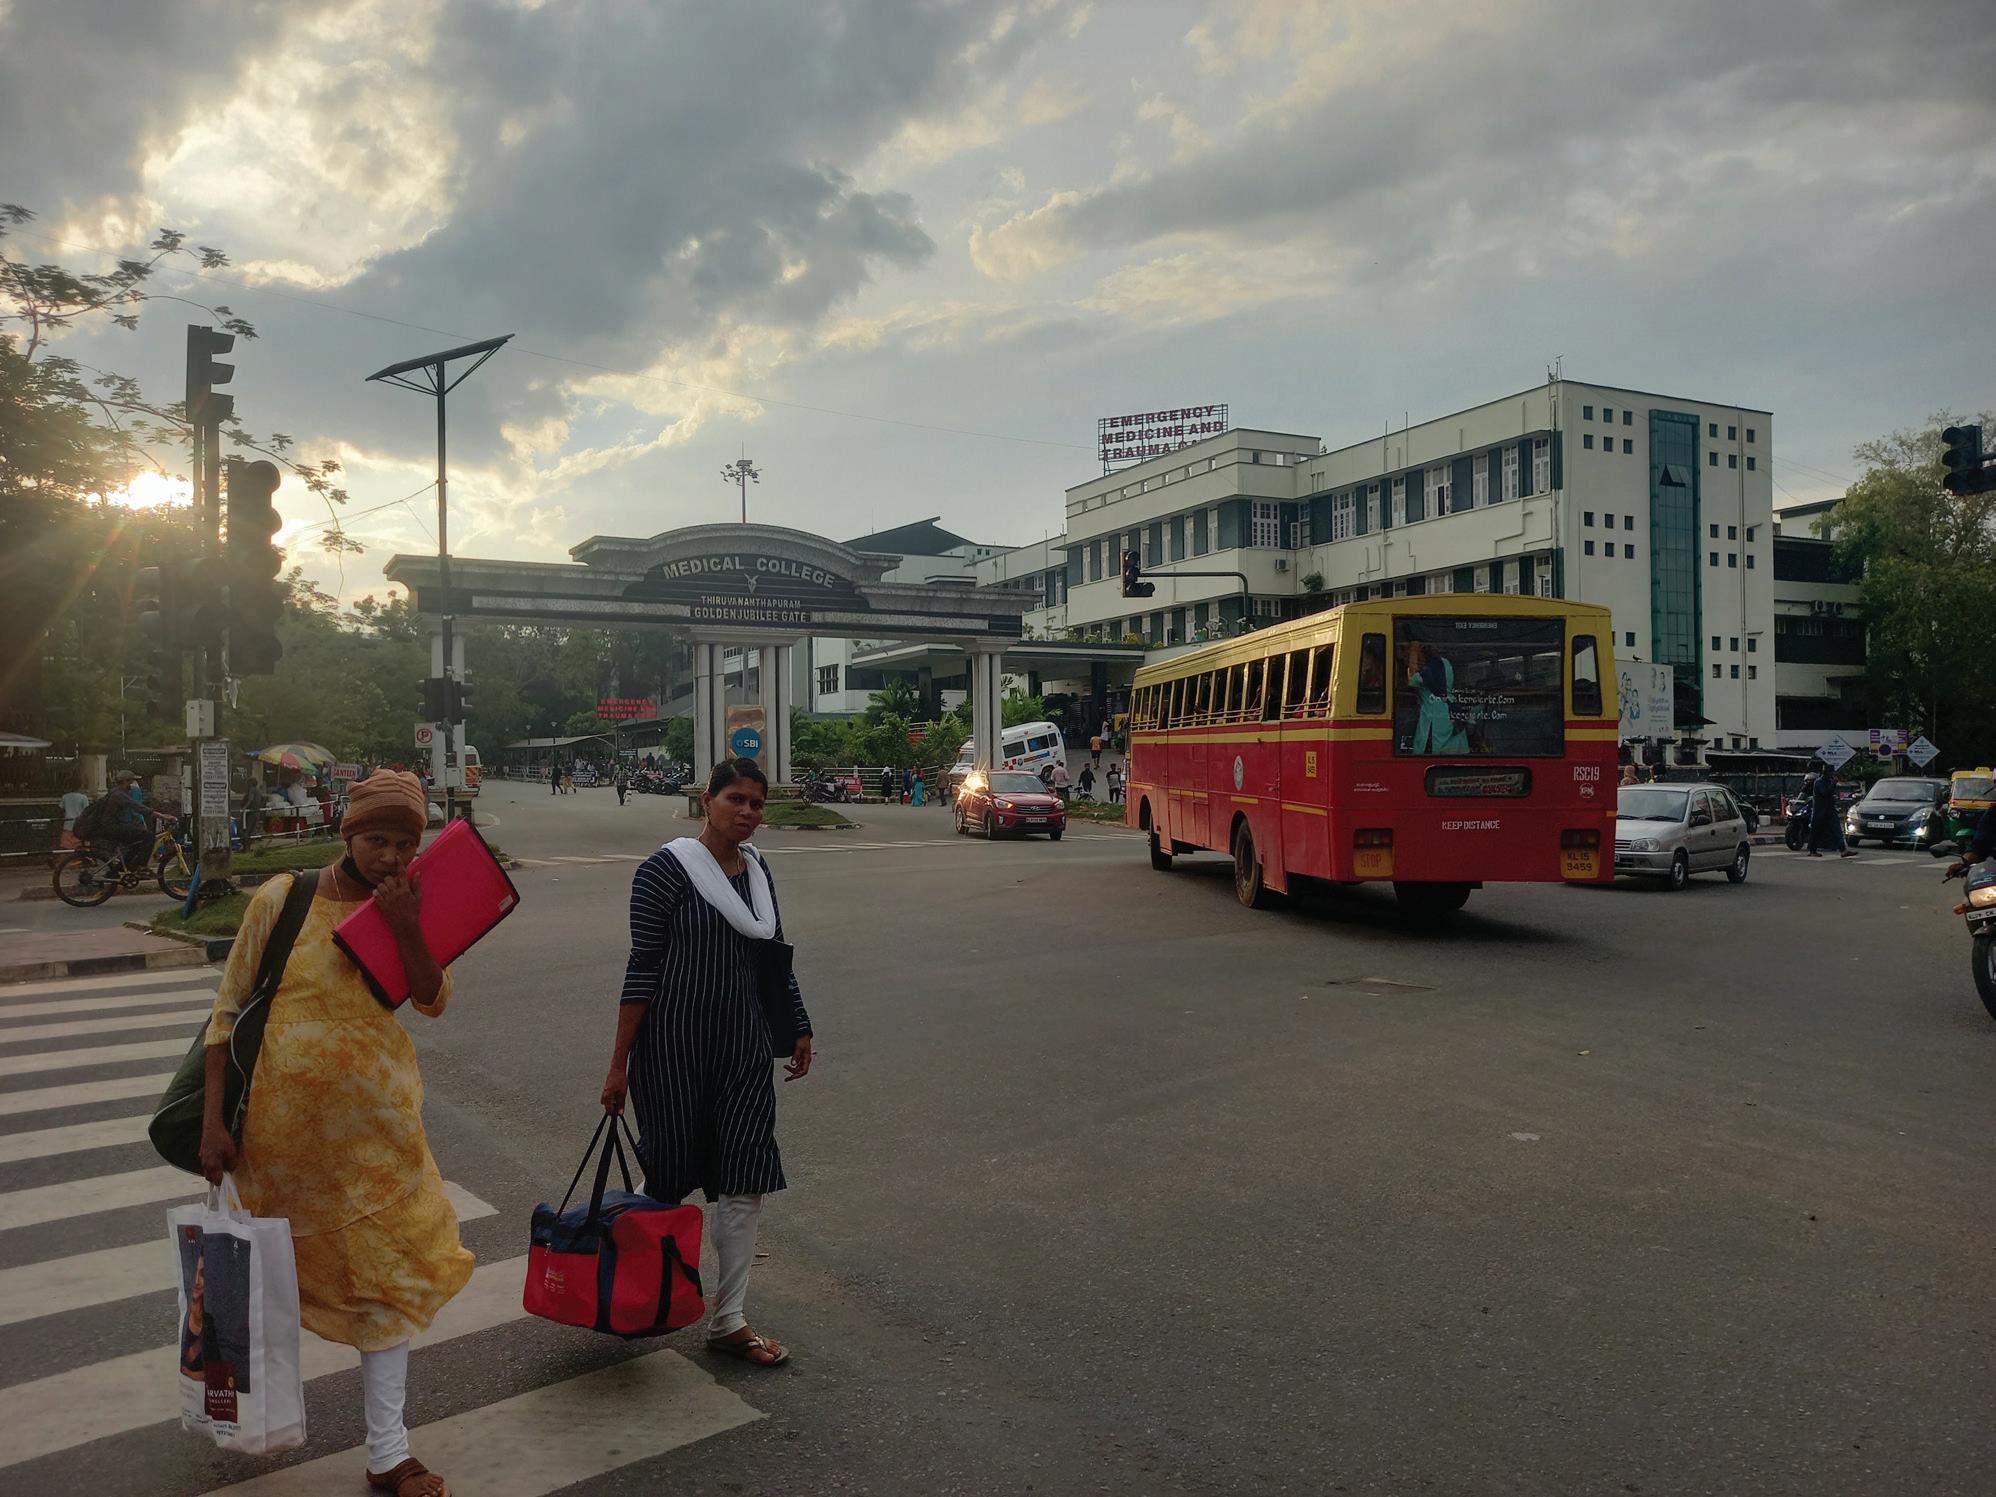
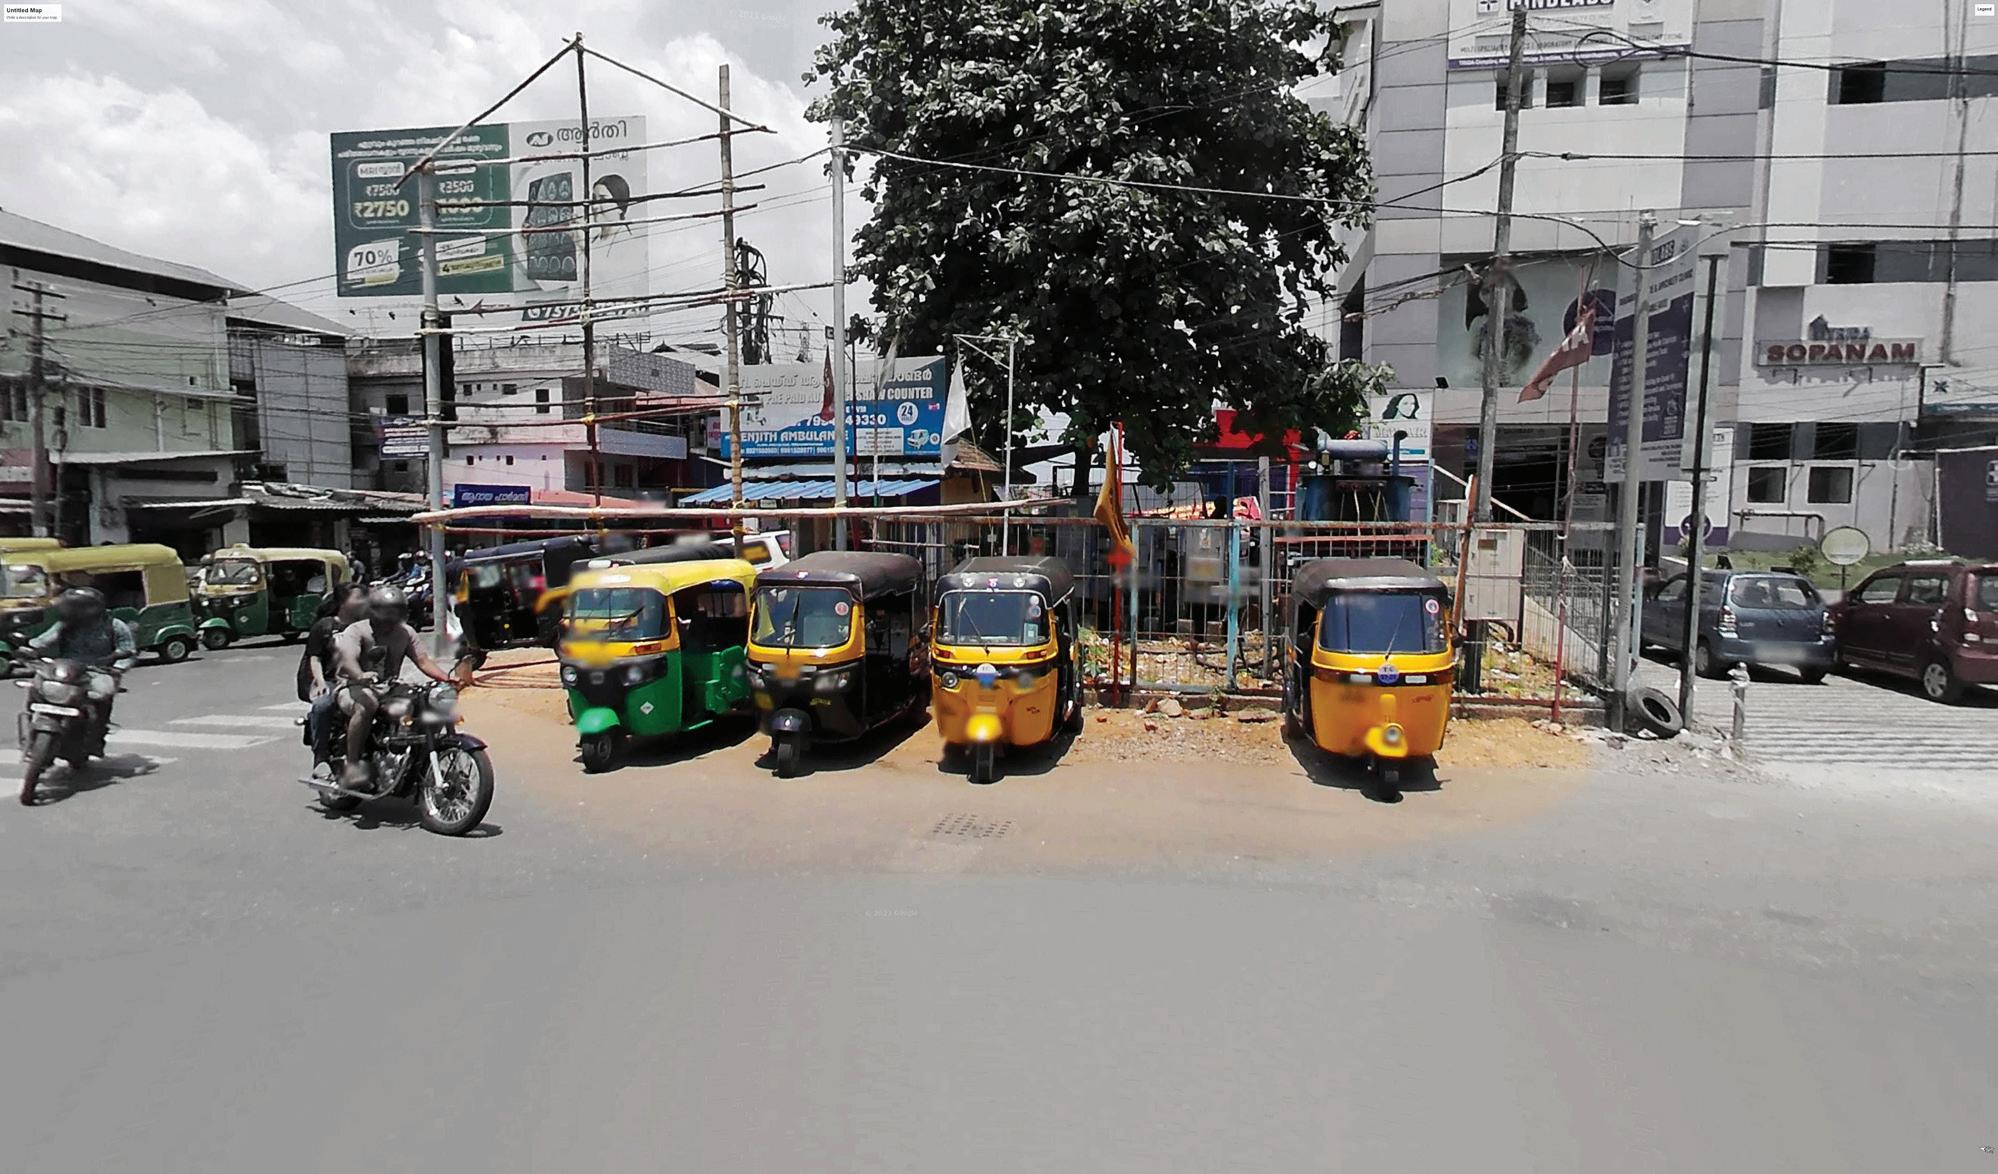
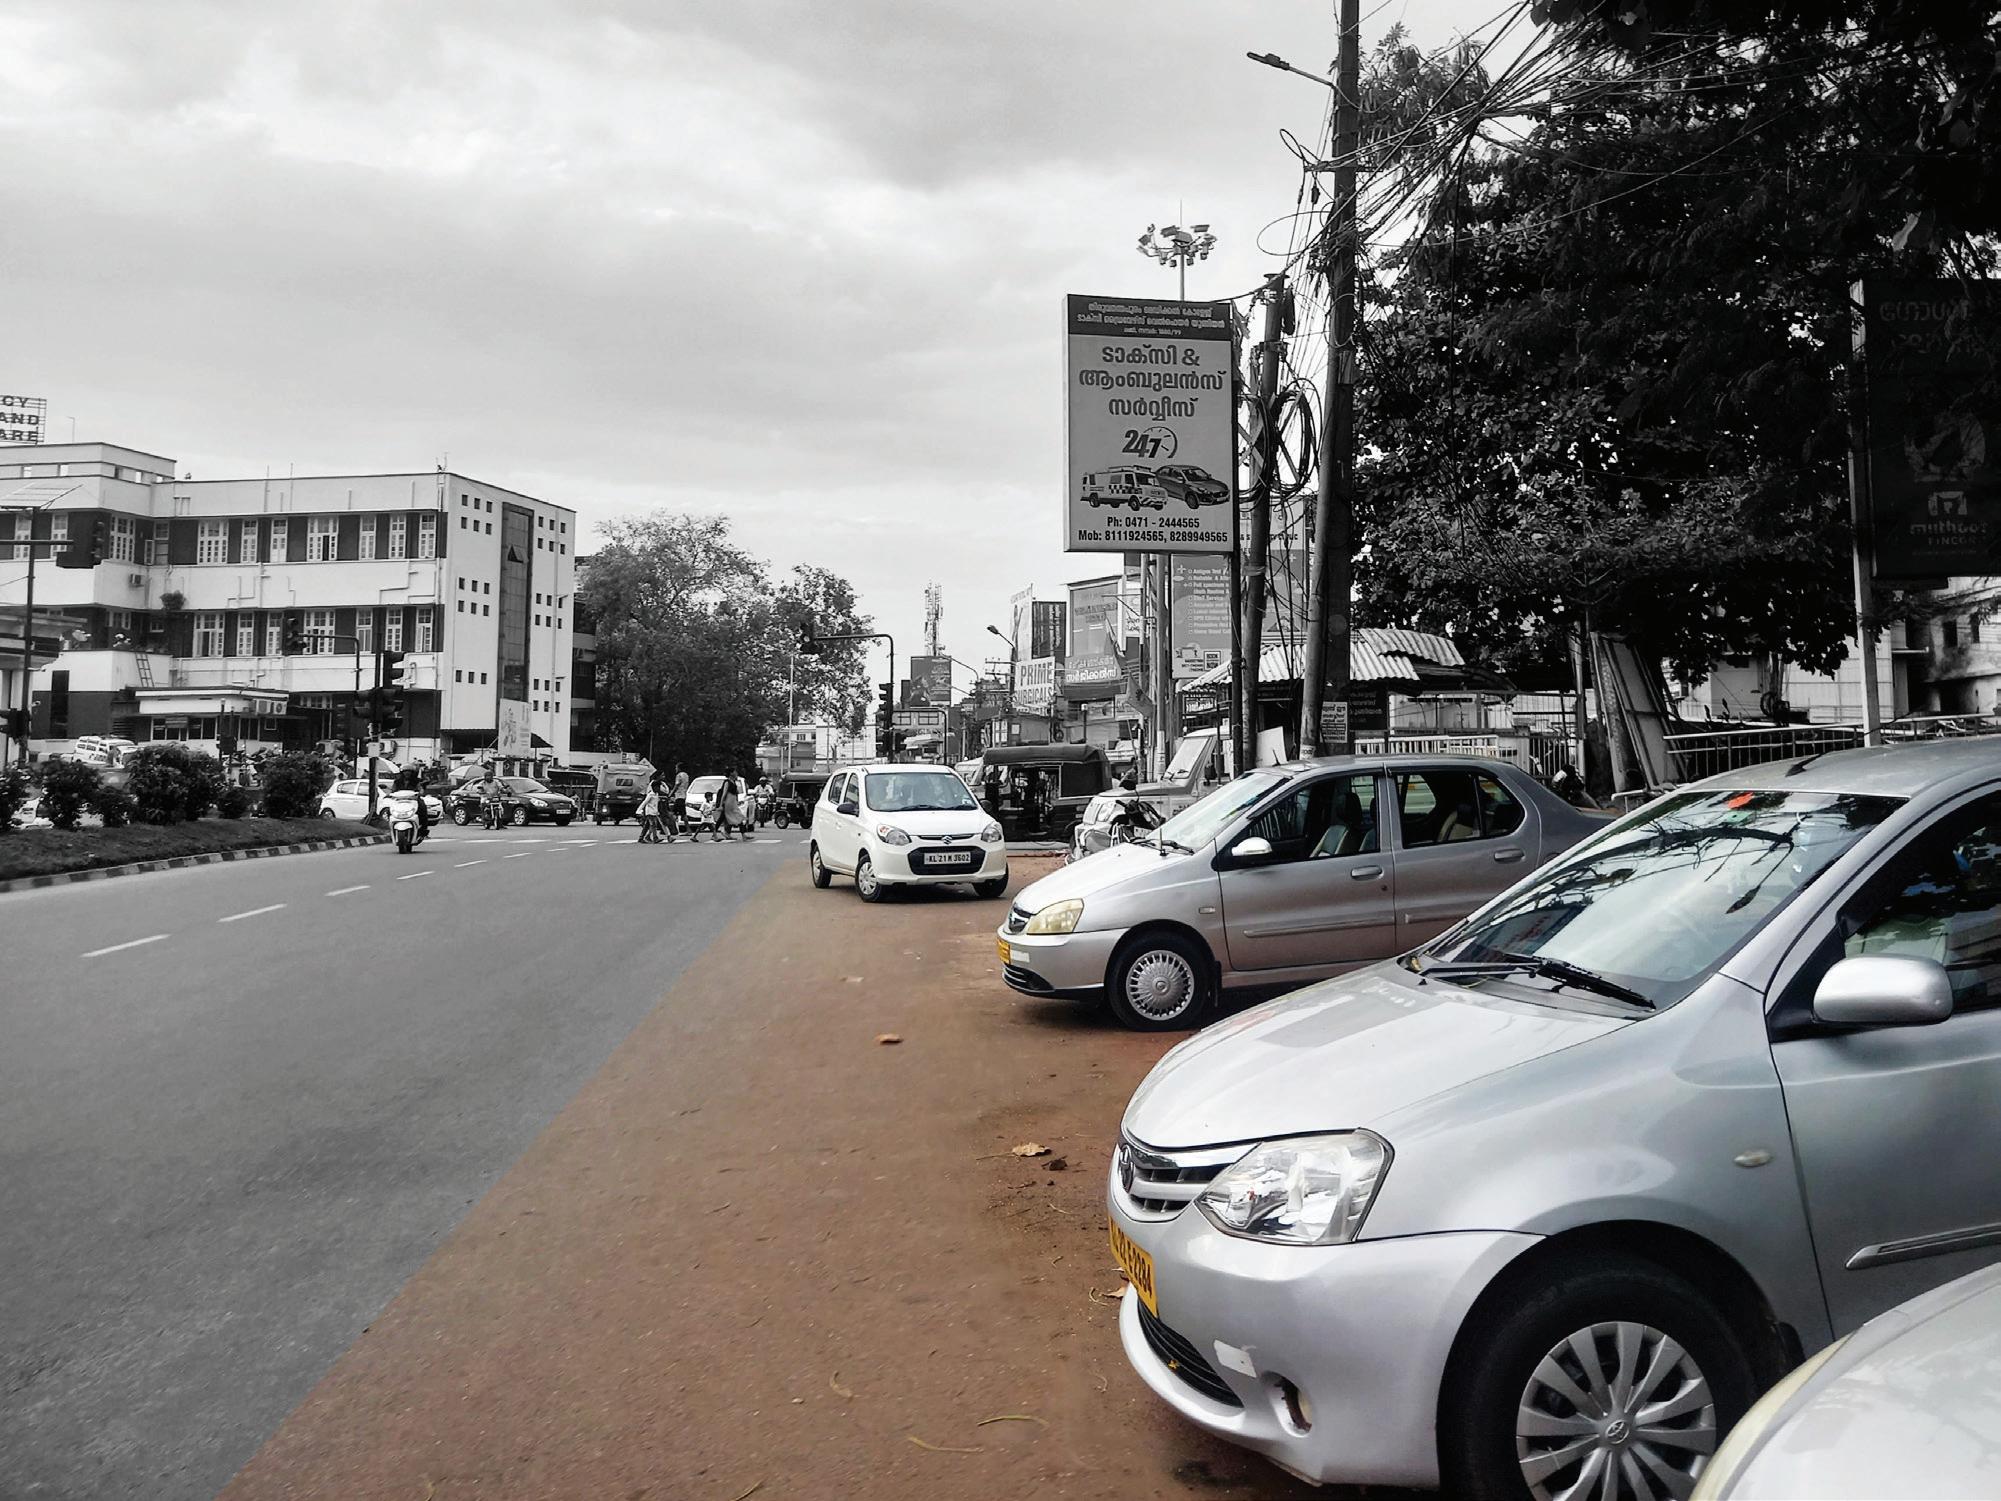
The intervention aims to transform the Medical College precinct into a well-organized mobility zone, with formalized IPT bays, reorganized bus operations, and safe pedestrian pathways. This is critical for managing the precinct’s high volume of pedestrians, including patients, students, and healthcare staff, ensuring efficient and safe circulation.
Key Interventions:
1. Safe Pedestrian Crossing- 3 safe crossings.
2. Safe and Comfortable Walkways- Minimum 2.5m wide on both sides of the street.
3. Providing additional safe and comfortable Bus Stop- 2 Bus Stops
4. Enhancing last mile connectivity between LuLu Mall, highway and the train station- Approx length 2km.
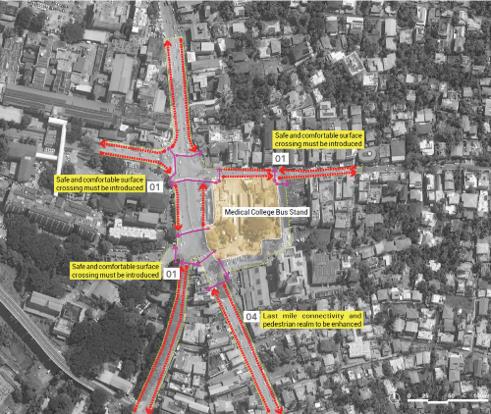
5. Potential direct access to LuLu Mall to be explored to capture footfall to use public transit.
6. Providing dedicated IPT stops and integration of last mile connectivity.
7. Well-designed public realm with adequate shade, lighting, comfortable waiting spaces and easy to use signage must be prioritized.
8. Streamline last-mile connectivity and integrate fare systems across transit, IPT, and feeder services to enhance accessibility, boost ridership, and position public transport as a preferred, efficient mobility option.
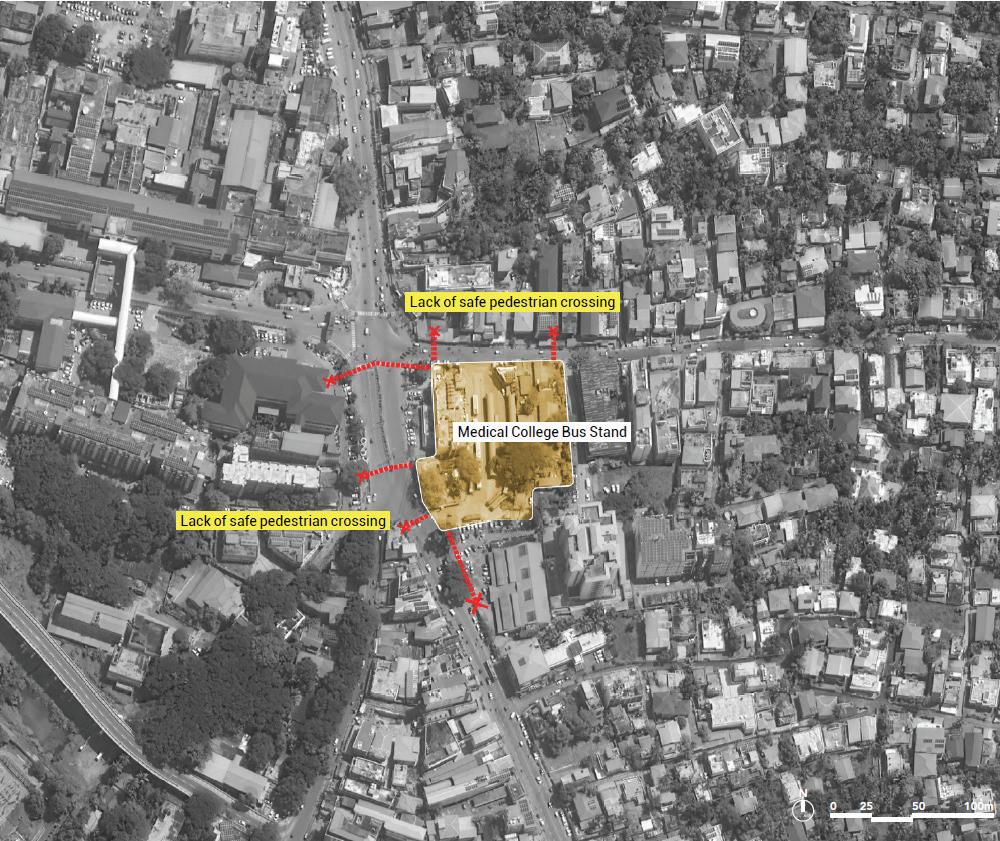
Existing transit node and its features
Kazhakkoottam, located near a major railway station and close to Technopark, a significant employment centre, suffers from unstructured transit operations. There are no formal IPT stands or bus bays, and pedestrian connectivity across the highway is unsafe. The area lacks clear pathways linking the station, bus stop, and Technopark, making last-mile access difficult. This undermines the potential of the node to serve the area’s growing commuter base effectively.
Key Observations:
• No dedicated IPT stands or bus bays; informal operations dominate.
• Unsafe pedestrian conditions near the highway and station.
• Weak connectivity to Technopark, a major employment hub.
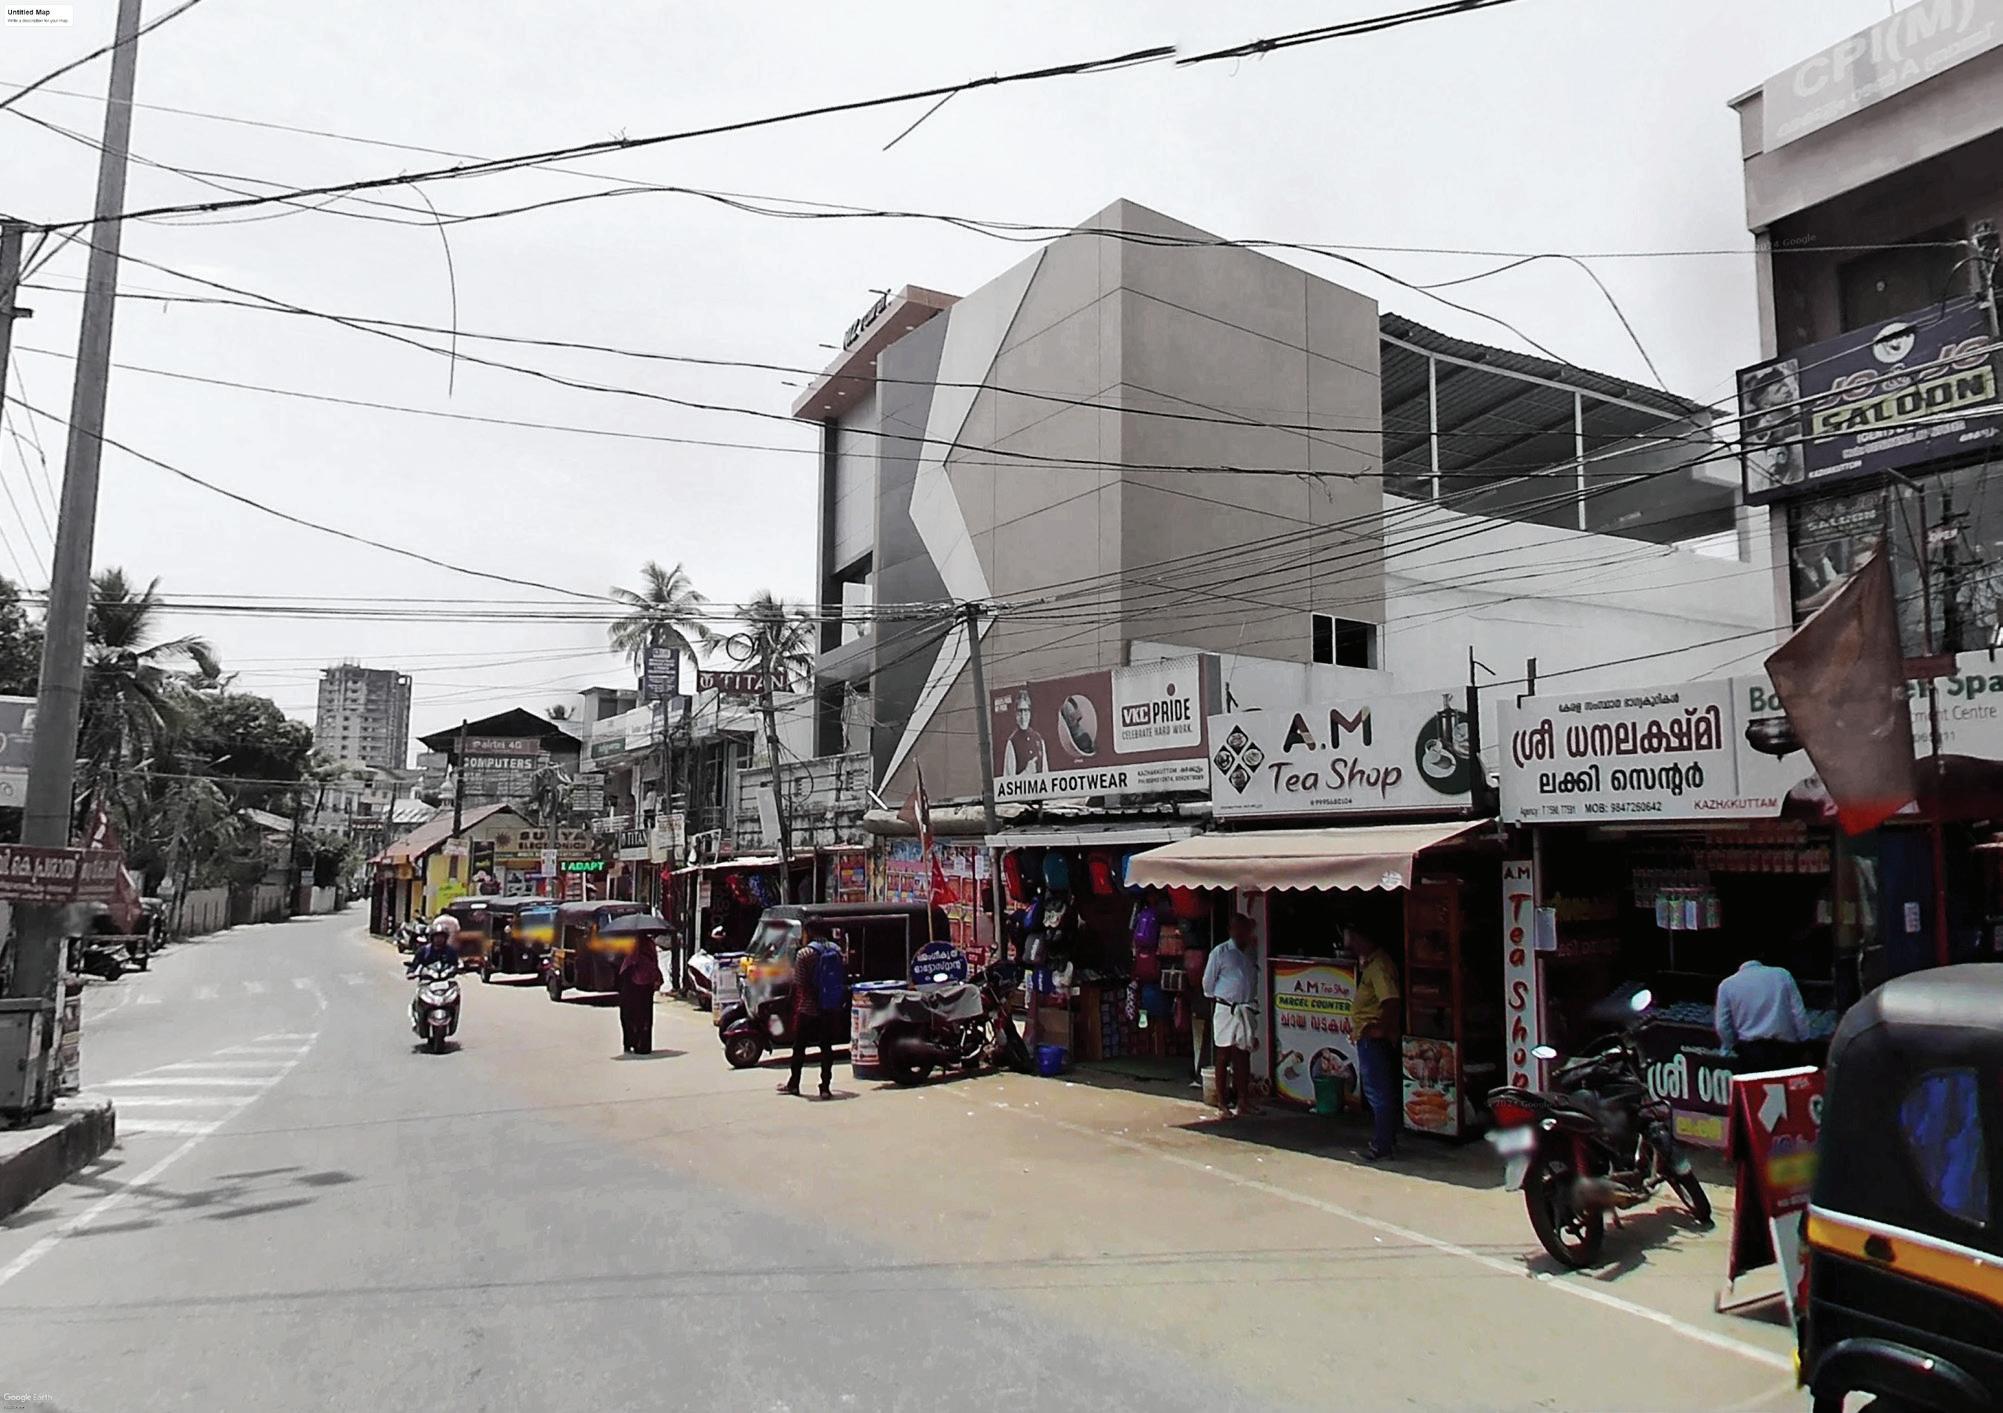
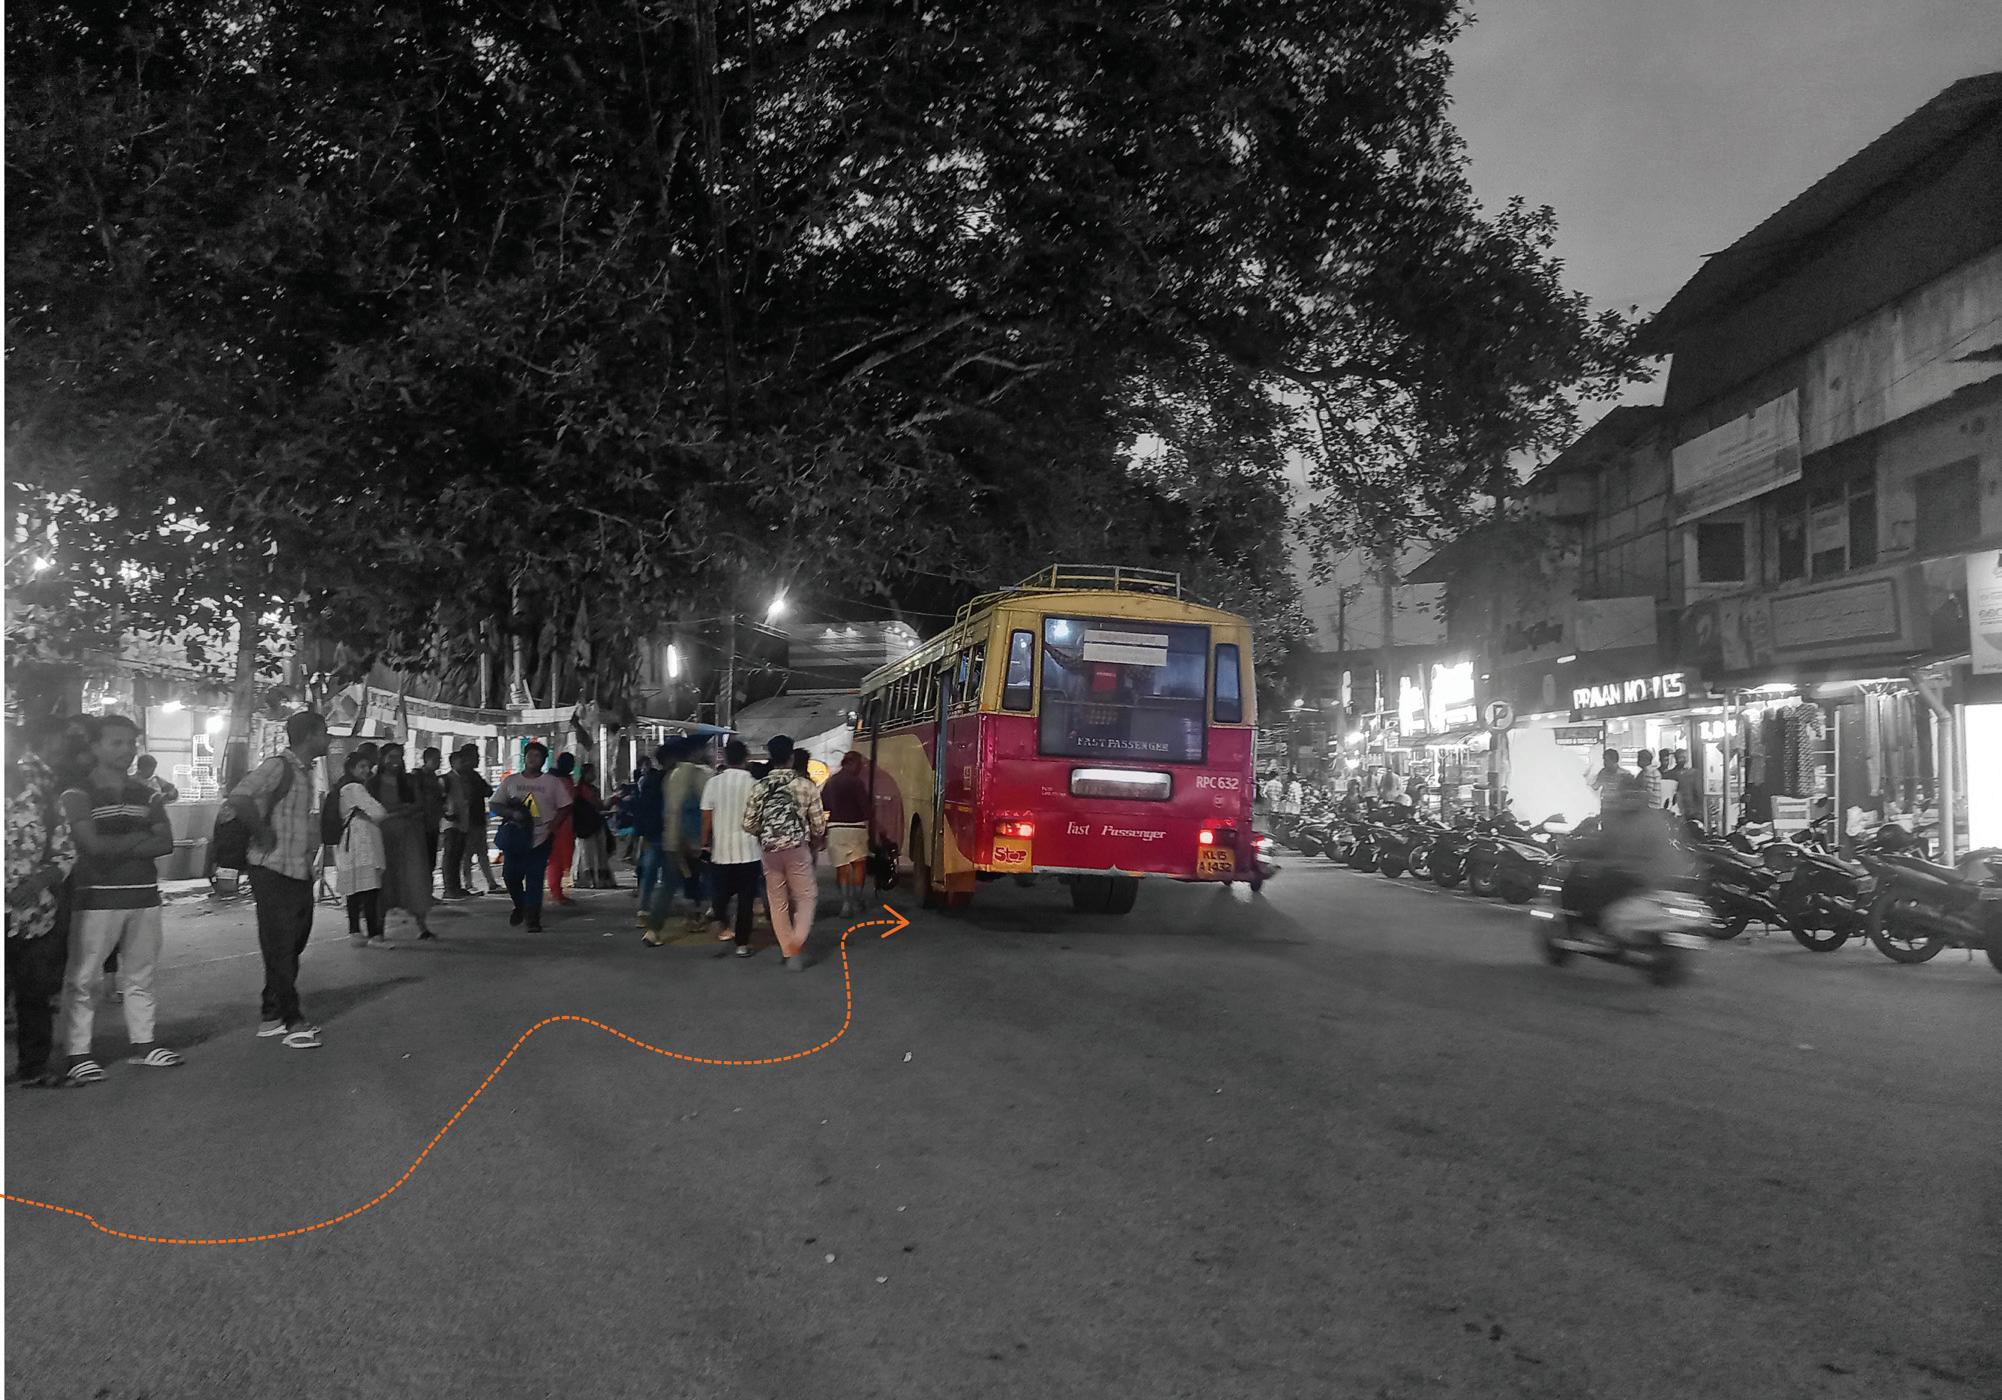
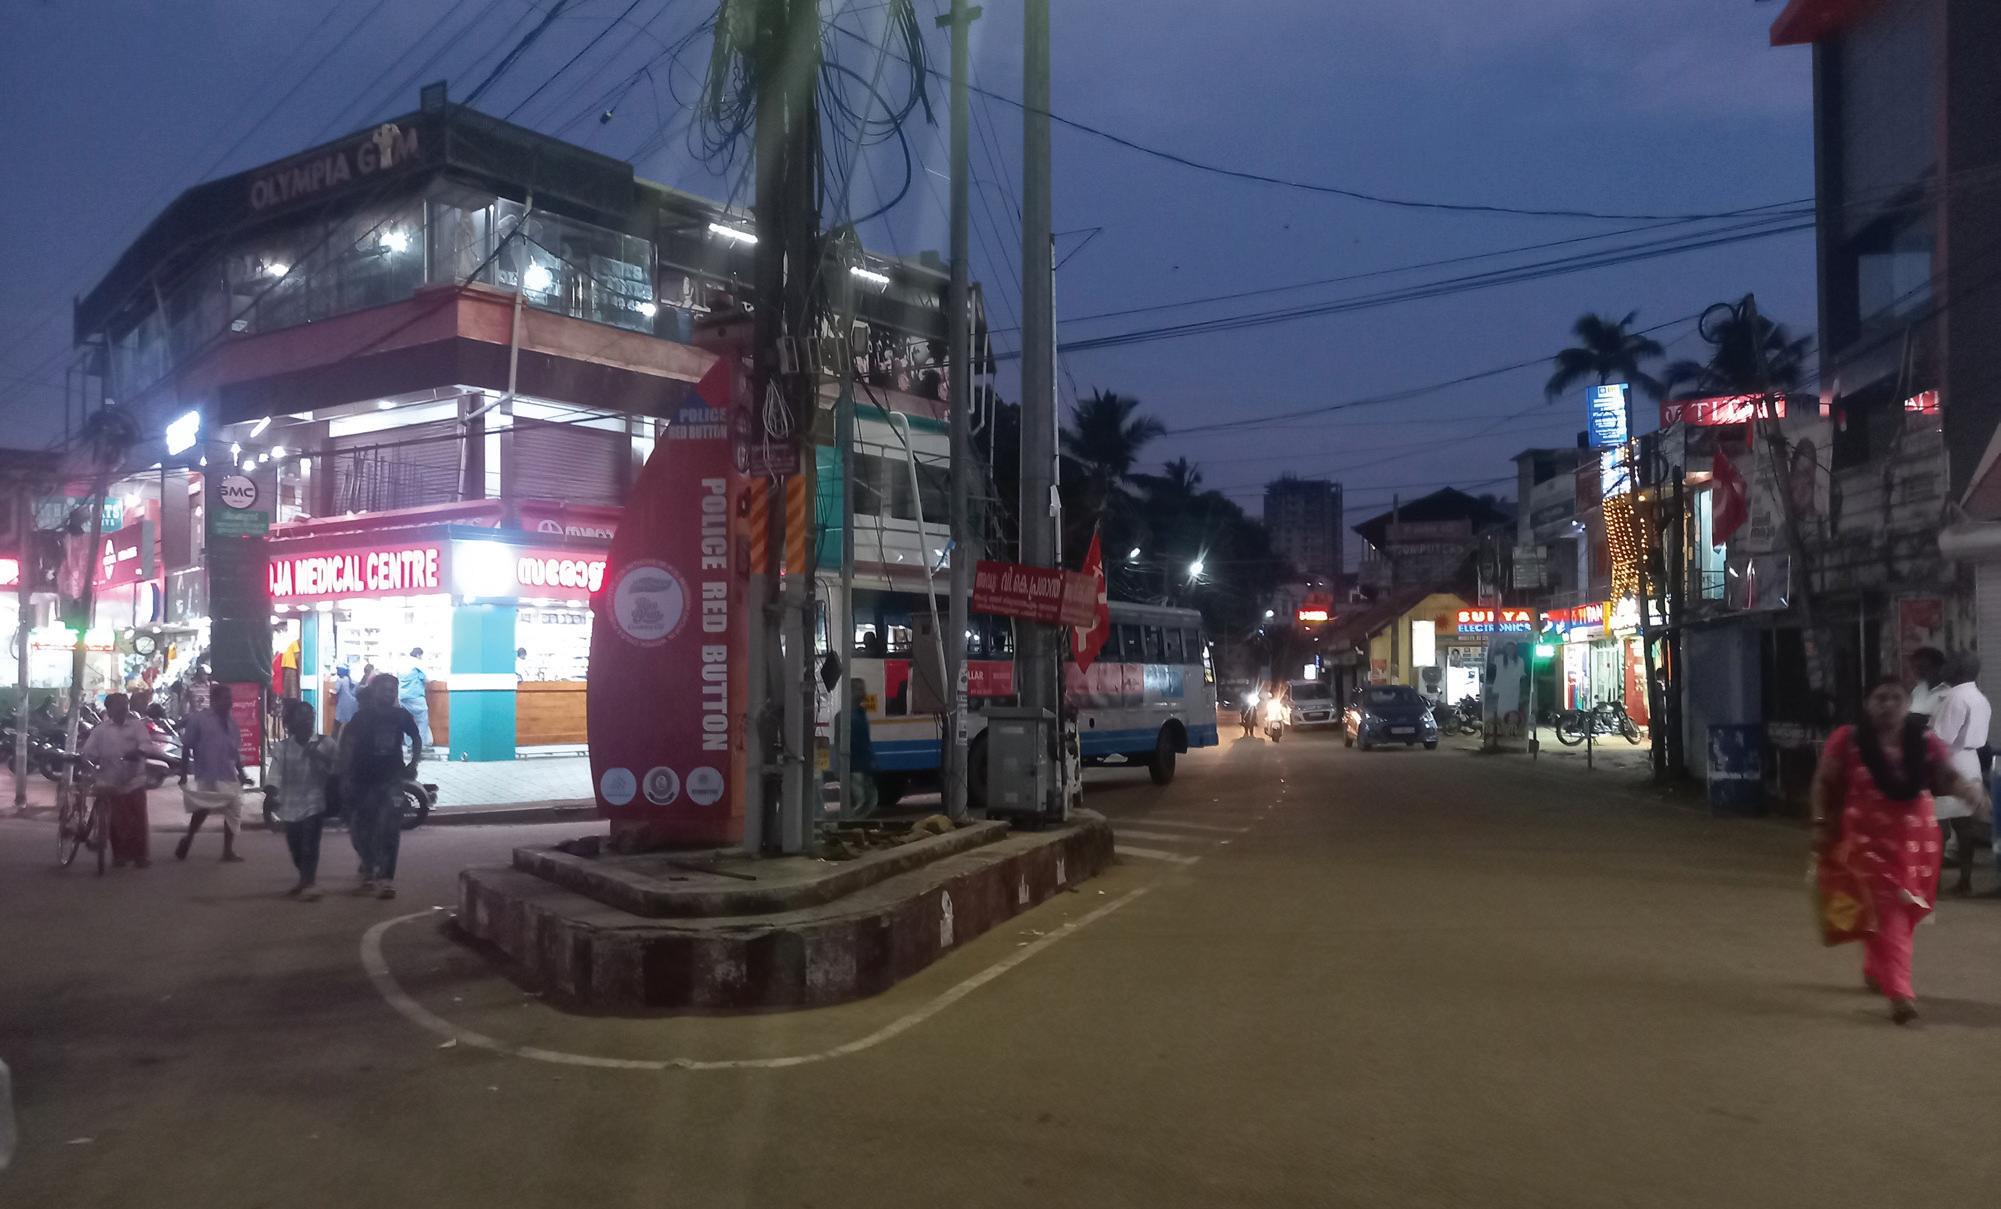
To address the growing demand for last-mile mobility in Kazhakkoottam, a dedicated IPT and NMT feeder loop is proposed, linking Technopark with the Kazhakkoottam Railway Station and primary bus stops. This intervention will enable organized, reliable access for the area’s expanding IT workforce and suburban commuters, reducing congestion on arterial routes.
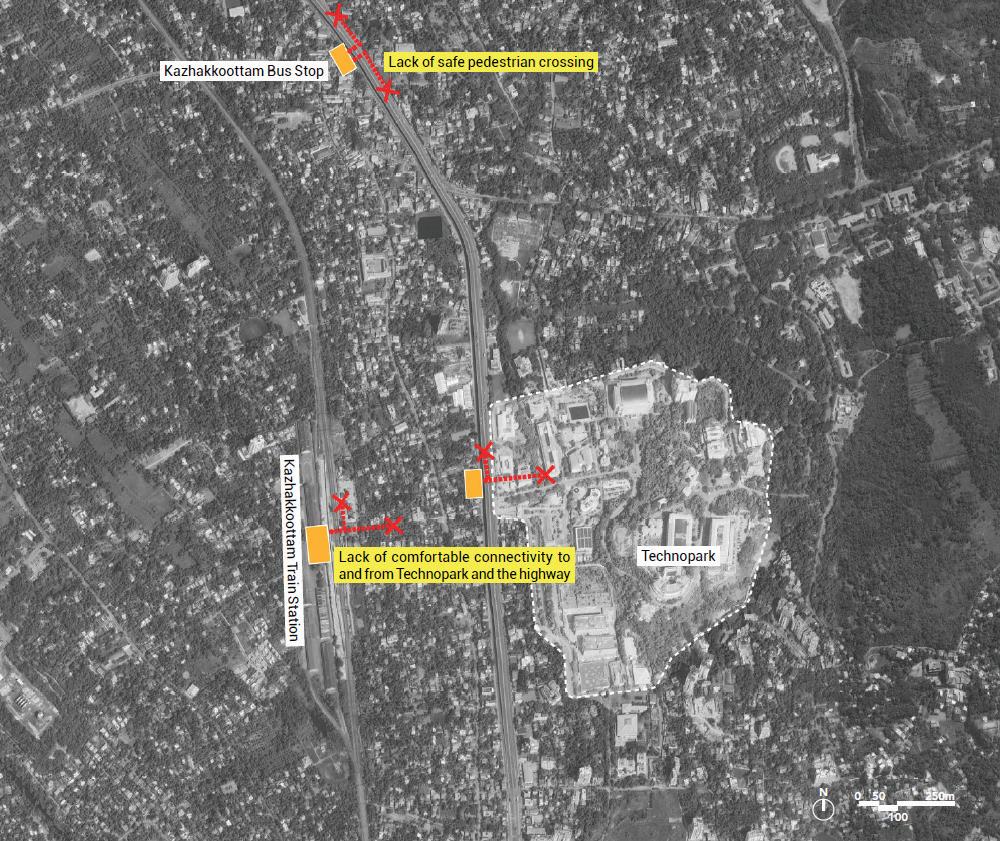
Key Interventions:
1. Safe Pedestrian Crossing- 3 safe crossings
2. Safe and Comfortable Walkway of minimum 2.5mt wide on both sides of the street. To be developed as a NMT loop connecting Kazhakkoottam bus stop, Technopark and Kazhakkoottam train station
3. IPT and last mile connectivity loop to be developed between Kazhakkoottam bus stop, Technopark and Kazhakkoottam train station for safe and comfortable movement- Approx 3 km loop.
4. Providing dedicated IPT stops and integration of last mile connectivity
5. Well-designed public realm with adequate shade, lighting, comfortable waiting spaces and easy to use signage must be prioritized.
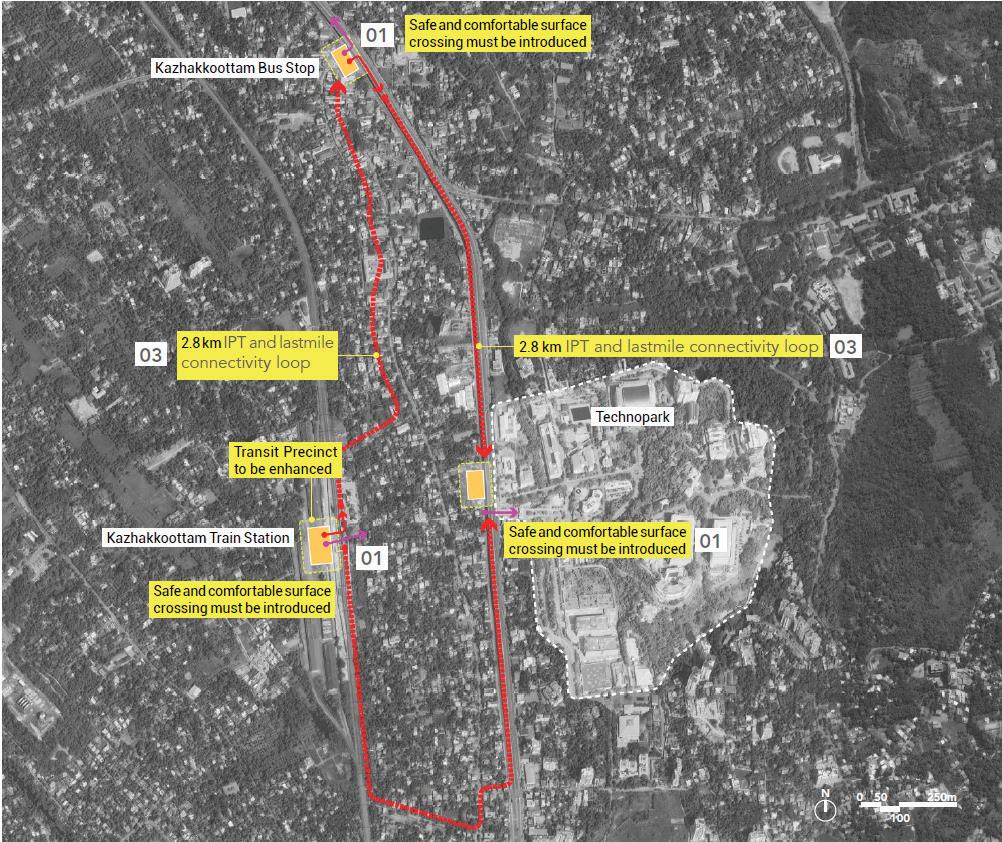
Existing transit node and its features
Neyyatinkara, a key bus stop in the low proximity zone, functions as a regional hub but lacks formal infrastructure to support its growing transit role. There are no dedicated IPT zones or structured pick-up and drop-off areas. Pedestrian infrastructure is minimal, with unsafe or missing crossings and poor access routes to surrounding streets and the nearby railway station. The overall lack of organisation at the stop contributes to inefficient transfers and low user comfort.
Key Observations:
• Bus stand lacks organized IPT and pedestrian infrastructure.
• Key regional node but underutilized due to poor access and visibility.
• No clear drop-off zones or walkable surroundings.
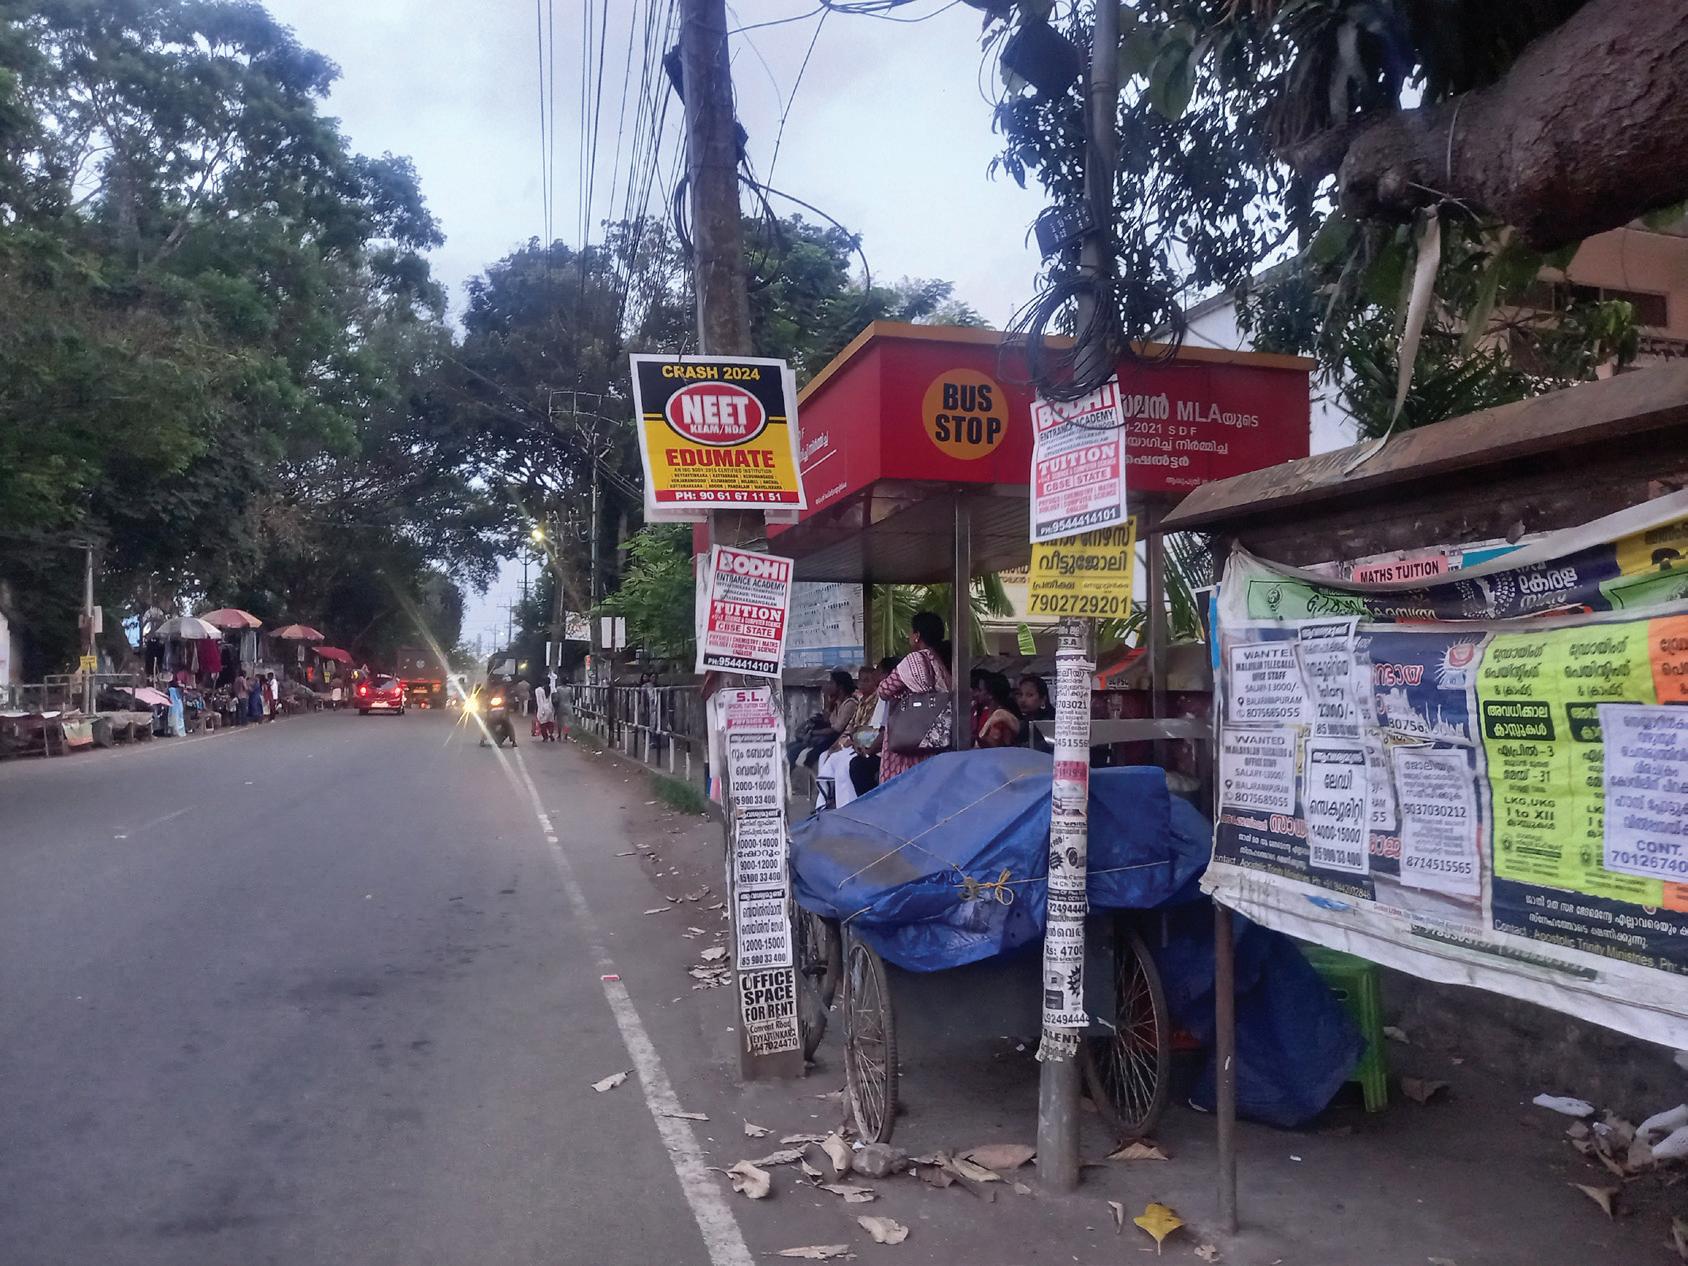
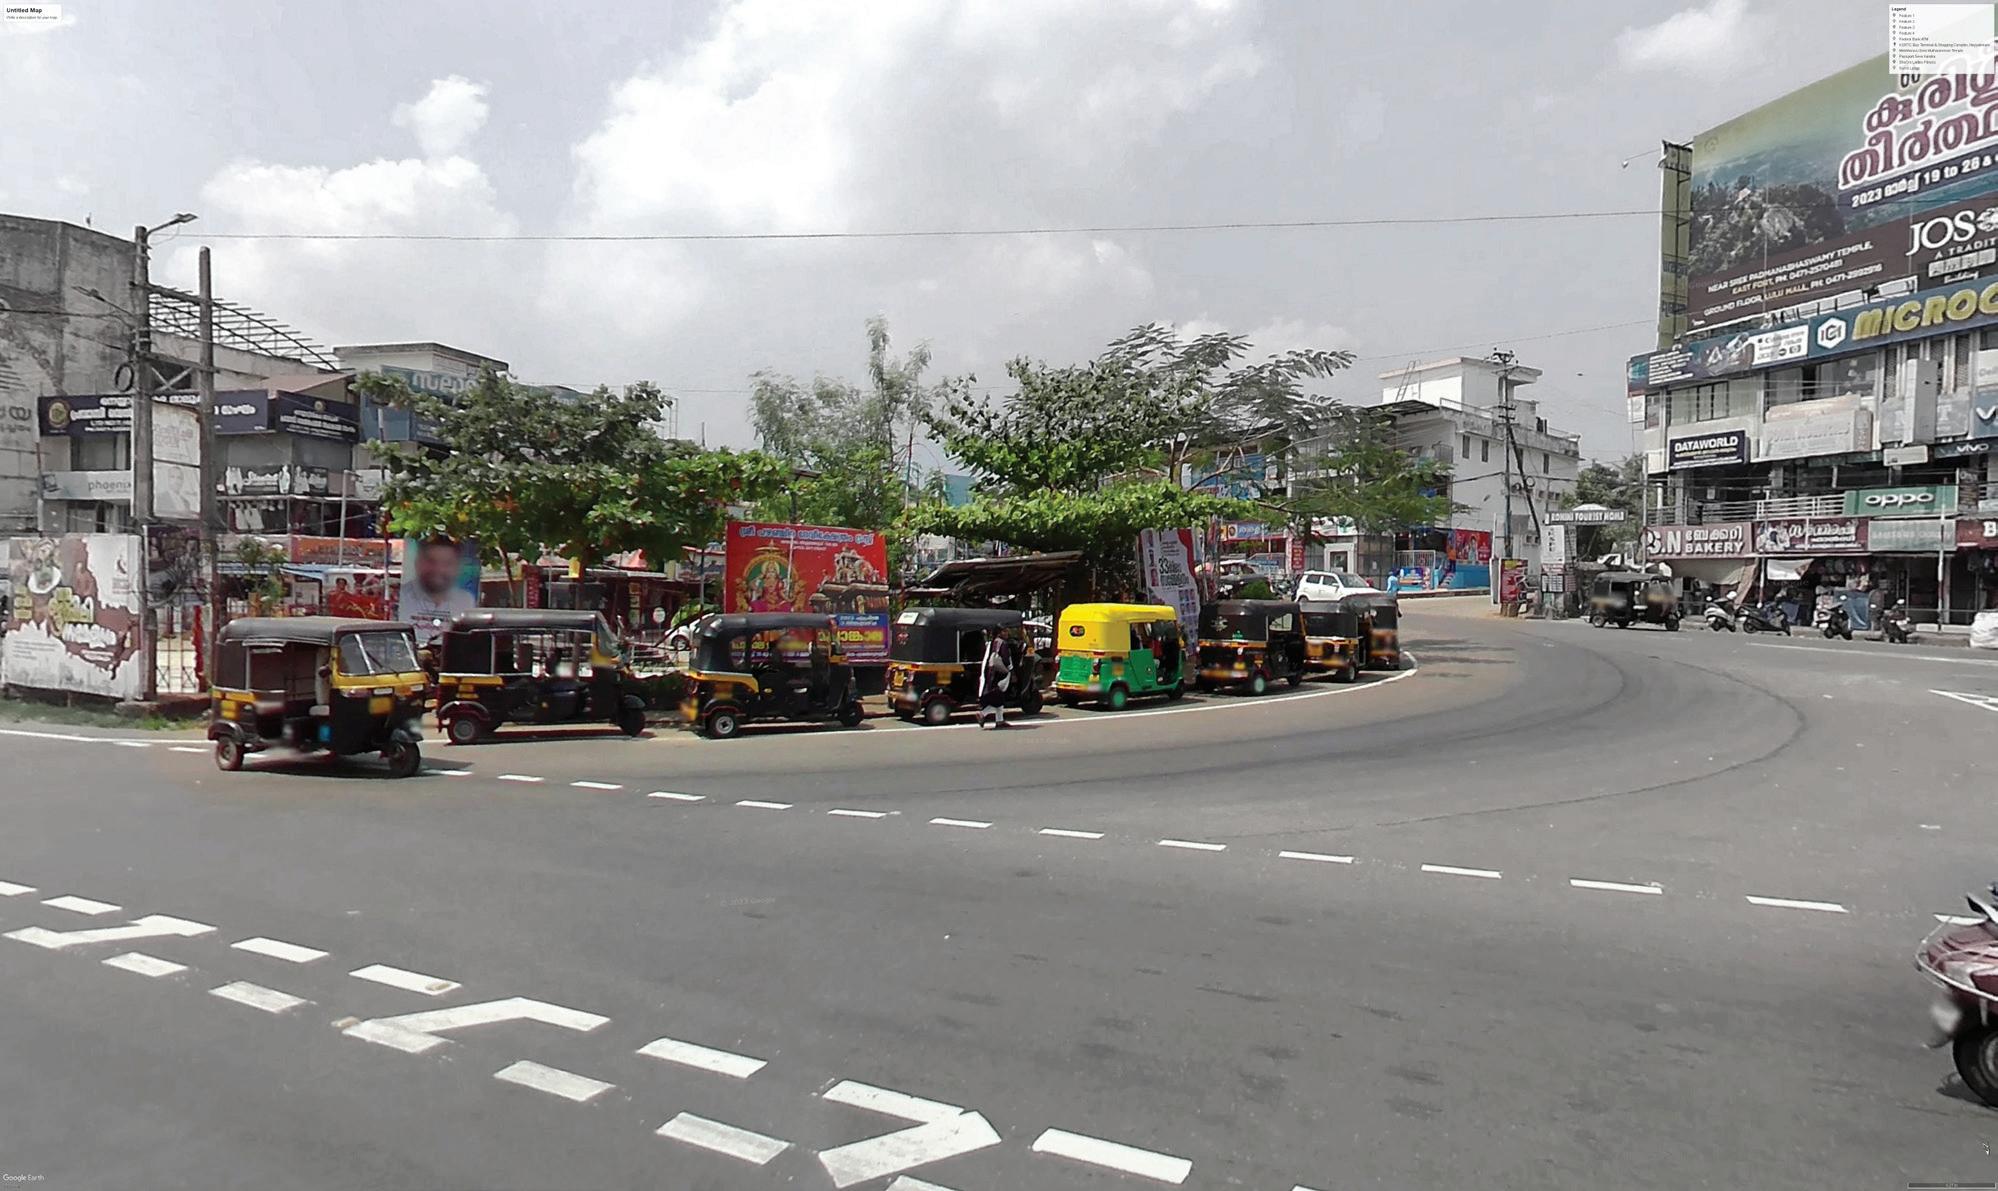
A structured feeder loop is proposed to integrate the Neyyattinkara Bus Stand and Railway Station, facilitating seamless transfers between regional and urban transport services. The intervention will formalize IPT operations and strengthen last-mile connectivity, enhancing mobility options for commuters from peripheral residential areas.
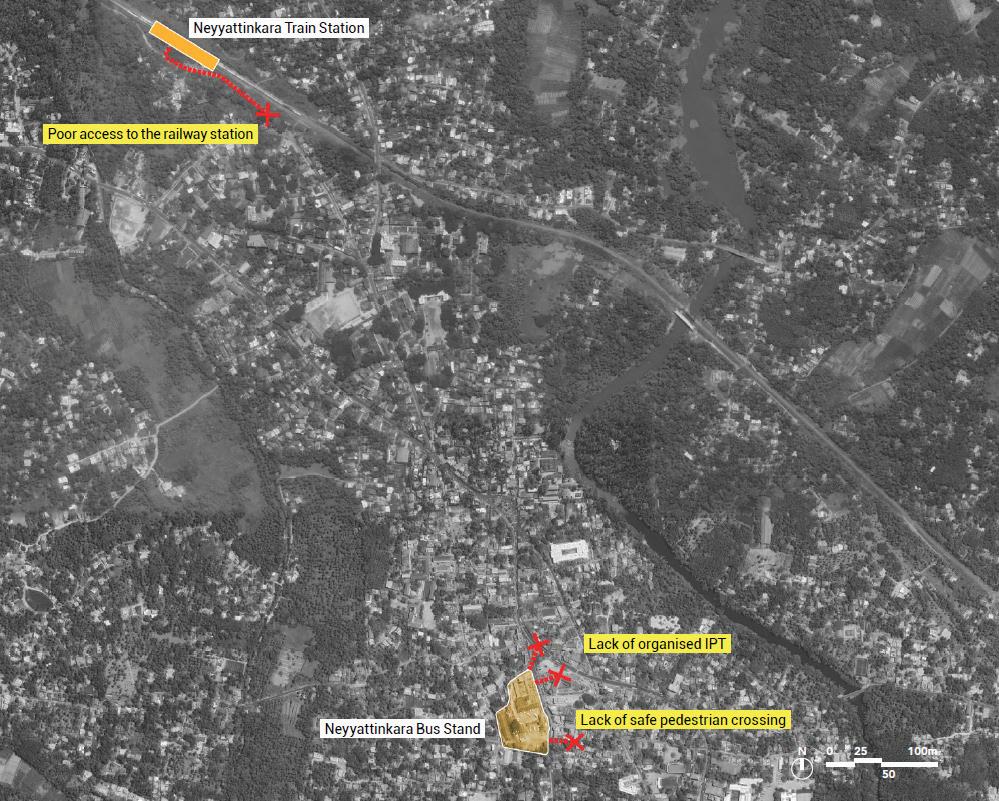
1. Safe Pedestrian Crossing- 4 safe Crossings
2. Safe and Comfortable Walkways- Minimum 2.5m wide on both sides of the street.
3. Providing a safe and comfortable Bus Stand precinct- Approx 01 acre.
4. Provide a safe and comfortable pedestrian realm- Approx length 2km
5. Providing dedicated IPT stops and integration of last mile connectivity.
6. Well-designed public realm with adequate shade, lighting, comfortable waiting spaces and easy to use signage must be prioritized.
7. Streamline last-mile connectivity and integrate fare systems across transit, IPT, and feeder services to enhance accessibility, boost ridership, and position public transport as a preferred, efficient mobility option.
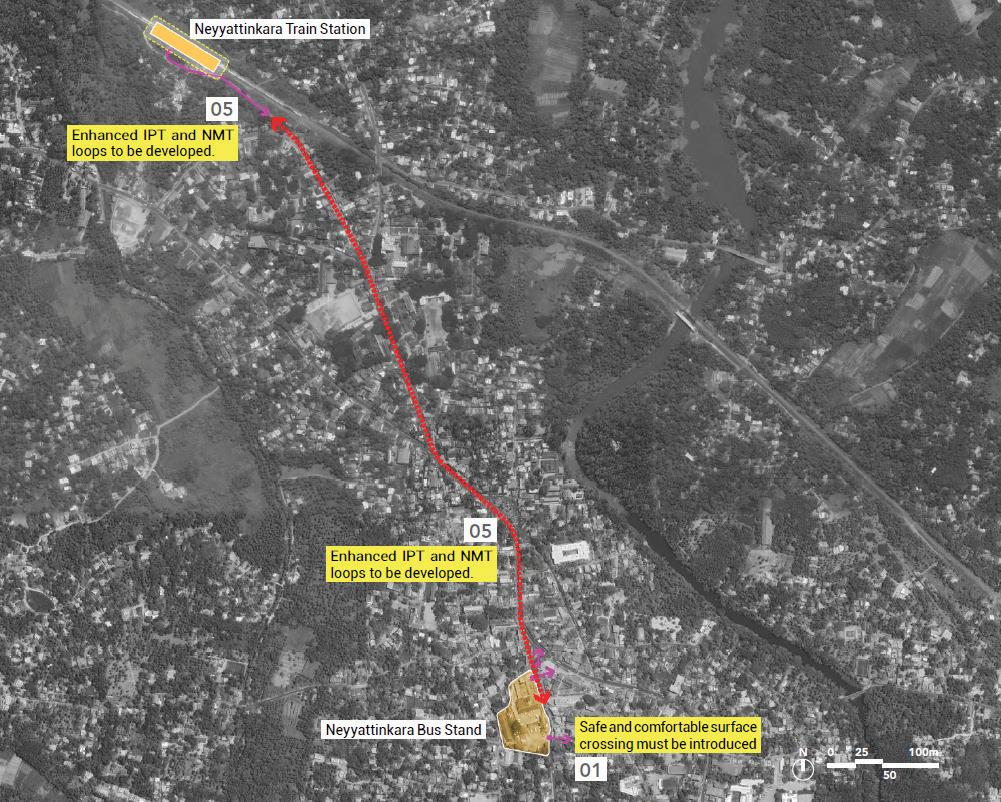

Located at the core of the city, Palayam is an intersection of various routes: The bus stop has seen to connect multiple suburbs to the major transit hubs of Thampanoor and East fort. It has shown intra city buses with high ridership and passenger boarding and drop off.
One of the busiest localities in the city core, which houses many administrative, cultural, and educational institutions. The area attracts high footfall due to the presence of stadiums, religious institutions, office of University of Kerala, Legislative assembly and hostels.
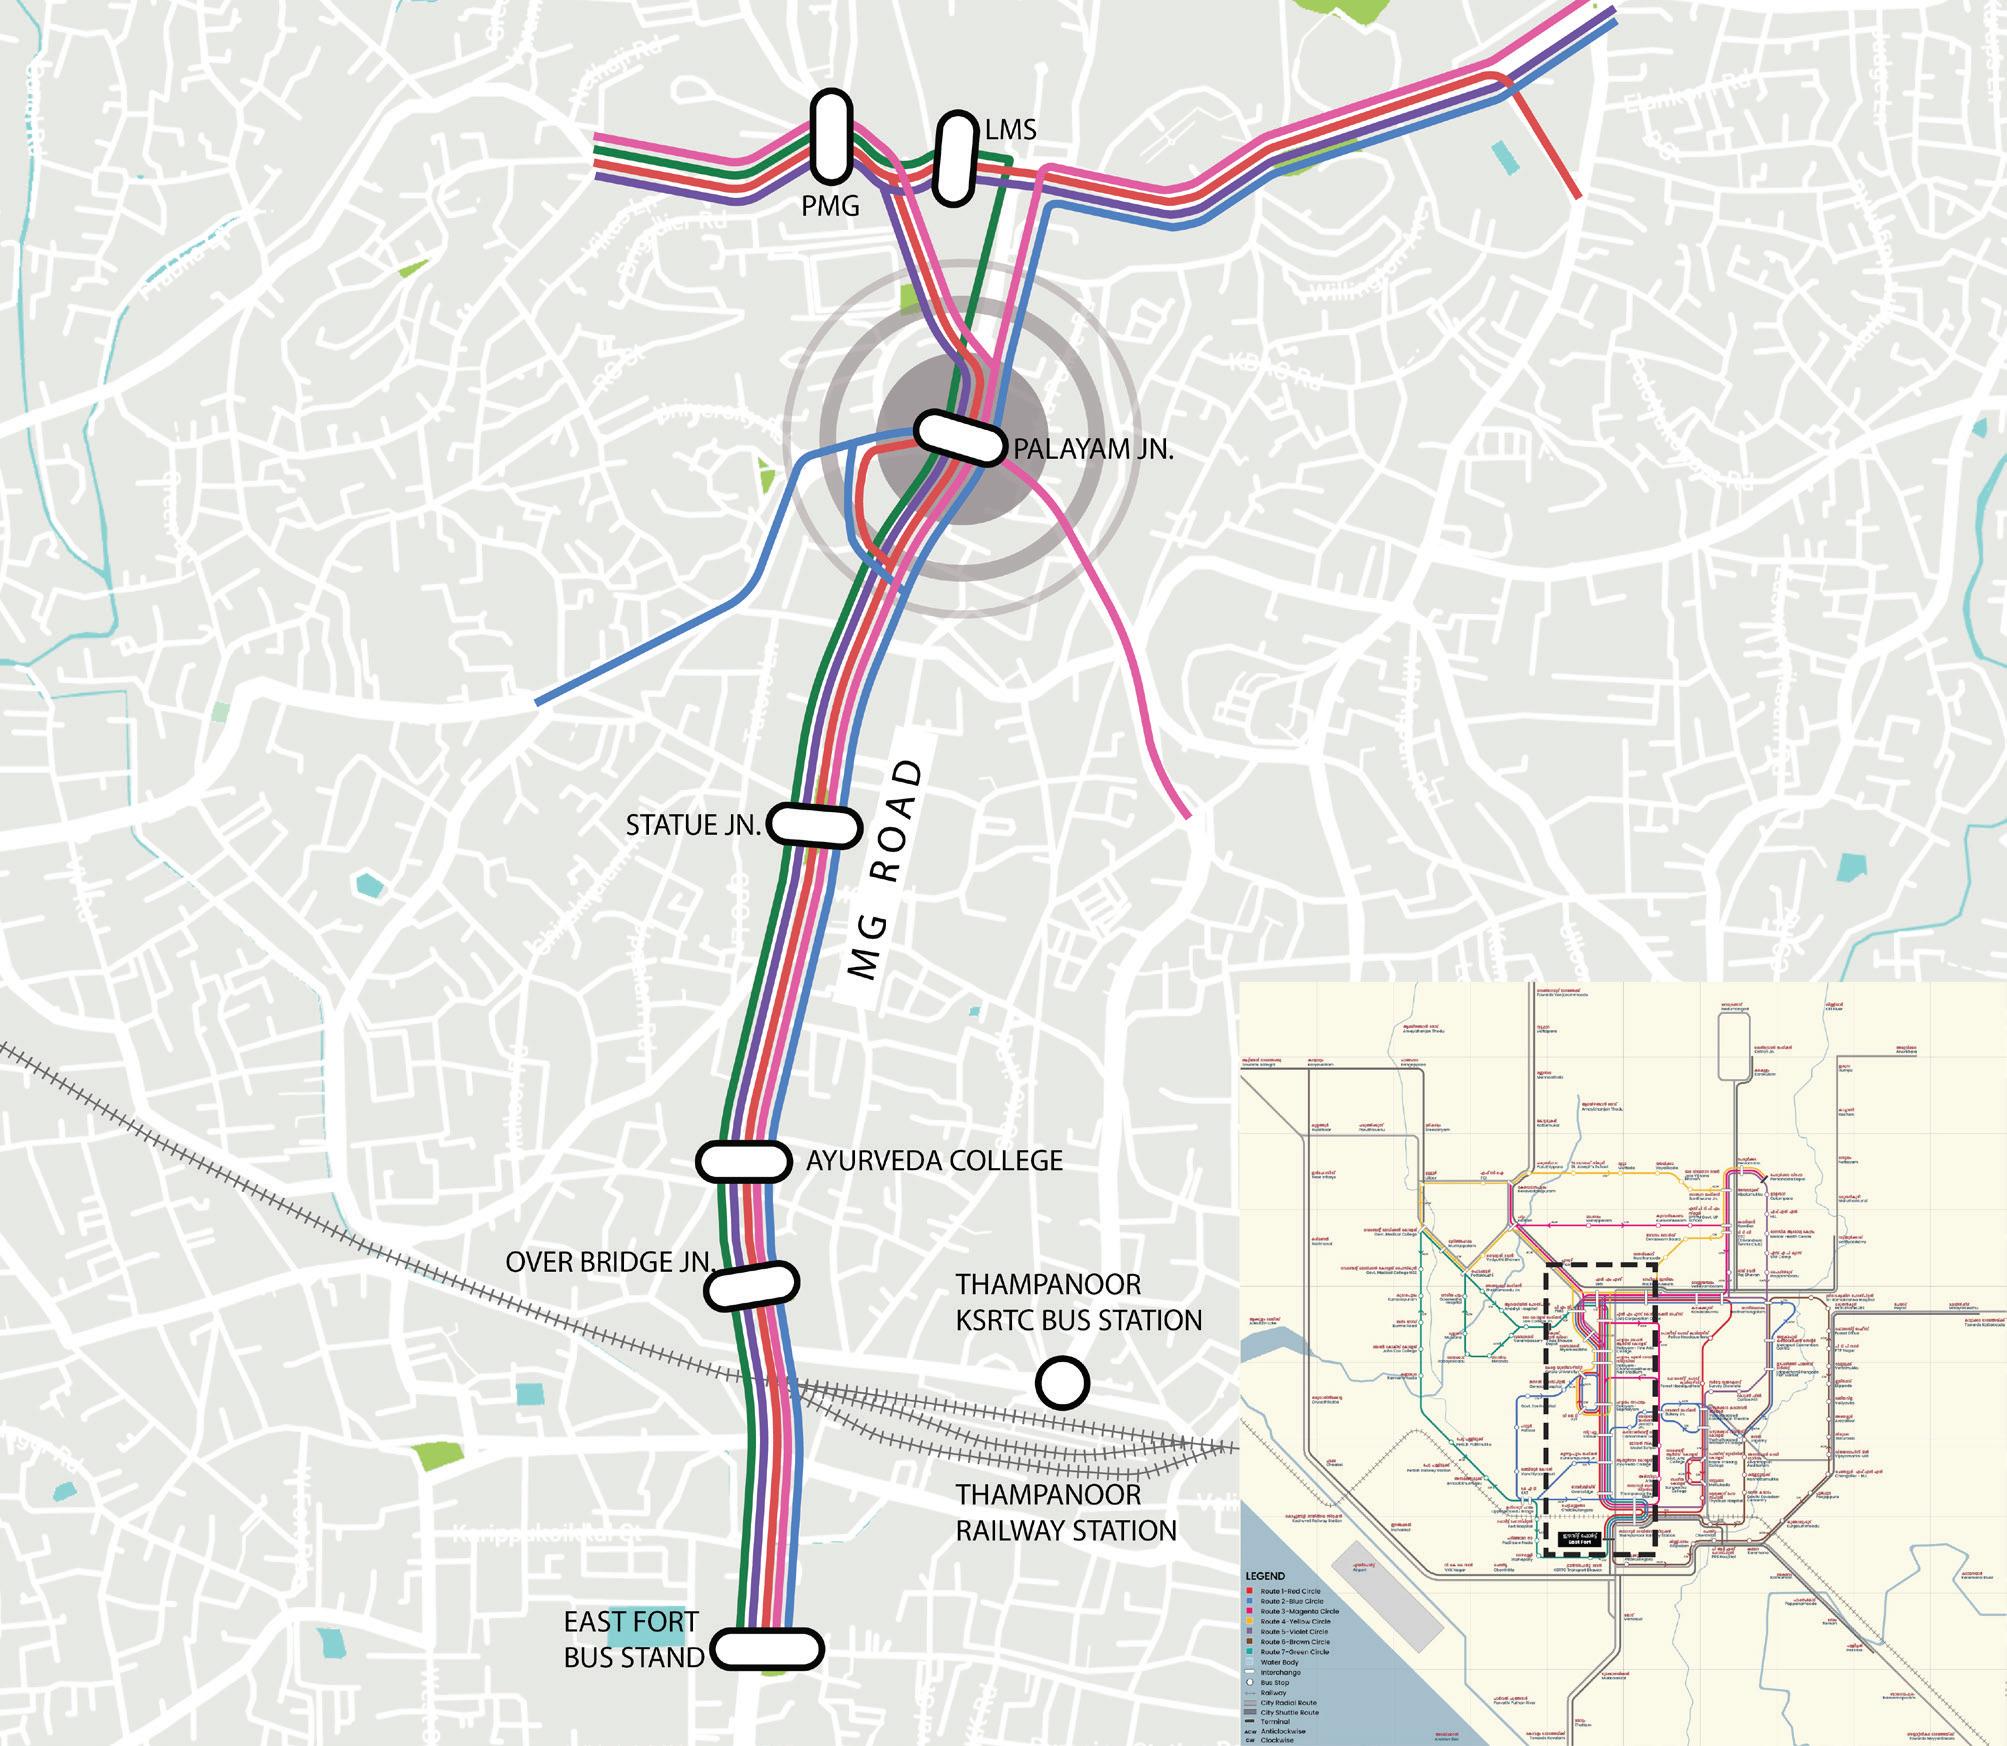
Fig. 66. Proposed intervention
• Intracity buses with high ridership
• Buses do not stop at the bus bay; passengers wait at the carriageway.
• Has bus shelter but lack adequate seating to meet the passenger demand.
• No signages or maps at the bus stops.
• Pedestrian crossings are away from the bus stop and the footpaths are narrow with railings hindering access.
• No dedicated IPT stops, autorickshaws park along the road shoulder
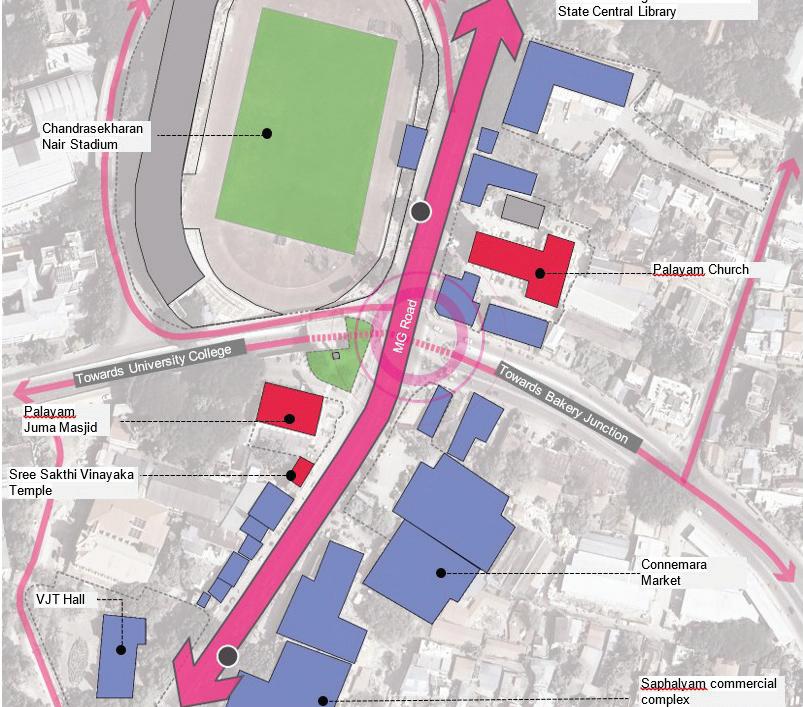
The Bus stop in Palayam has a shelter which is accessible by a ramp connecting to the footpath. However, as shown it is not able to accommodate the volume of passengers using the bus stop causing spillage onto the road. It can also be seen to lack a defined bus bay with buses stopping randomly by the side of the road adding to traffic congestion.
Further we can see in the images below that the Bus stop lacks adequate seating resorting to passengers even sitting on the floor of the bus stop shelter. It also lacks any signage or mapping of bus routes despite being a key point in interchanges and catering to multiple routes.
Despite its central location in Palayam, the availability of Integrated Public Transport services is limited. Upon inspection, it was noted that there are no designated IPT stops in the area. Instead, what was found was an informal arrangement where auto-rickshaws were parked along the road shoulder, located at one point along the busy stretch.
On analysing the NMT infrastructure in Palayam it was found that there is a lack of adequate pedestrian crossings and signals near the Bus stop, to facilitate safe crossing for pedestrians, resulting in jaywalking across the four-lane roadway.
The pedestrian walkways were found to be inadequate, with the width of the footpath being narrow considering the large volume of people accessing it. The narrow walkway further separated by railings causing people to use the shoulder instead.
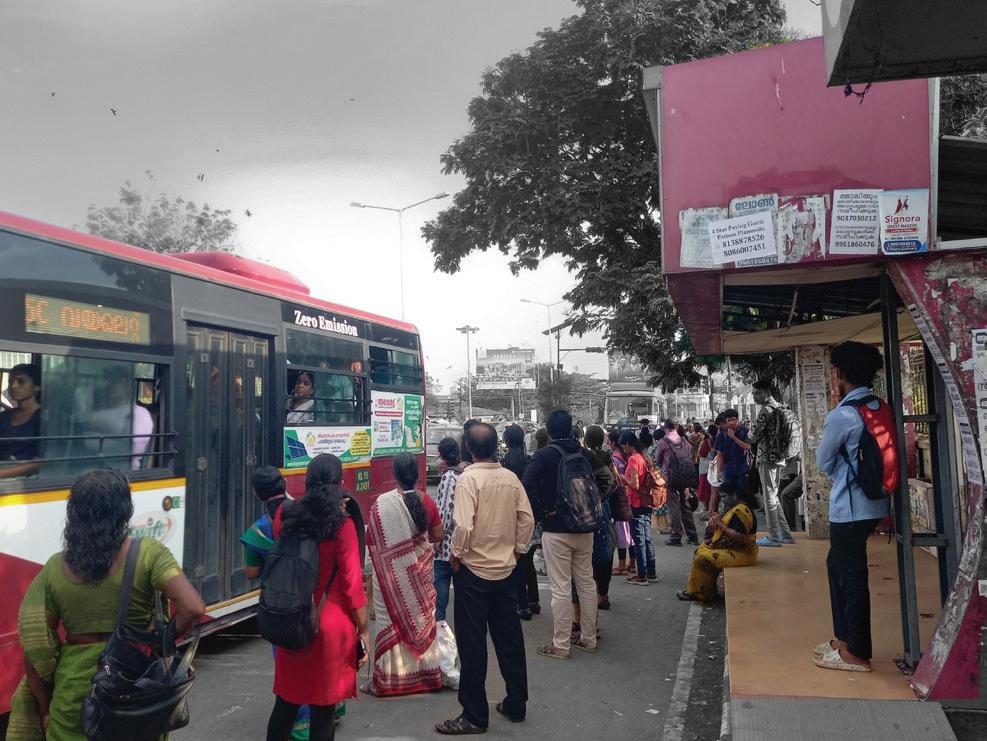
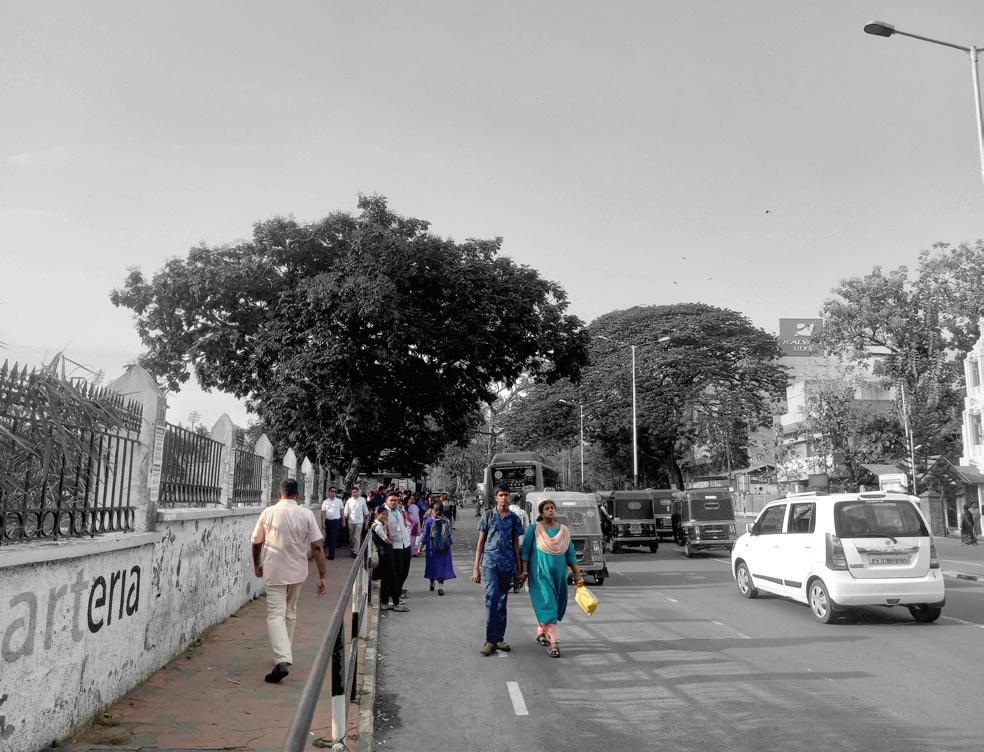
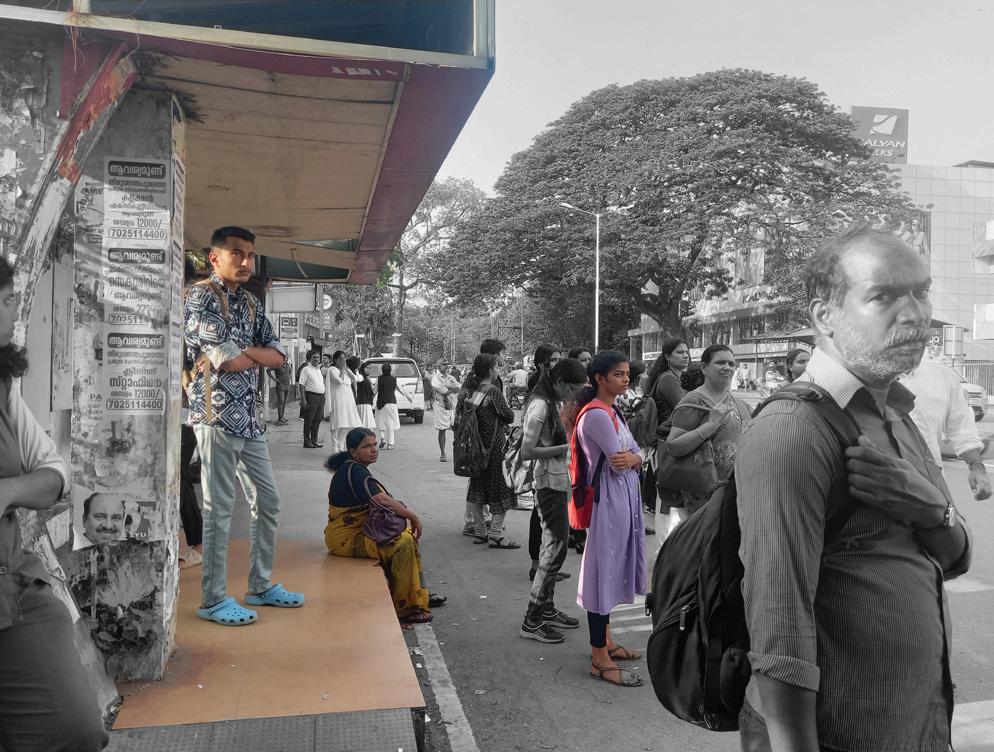
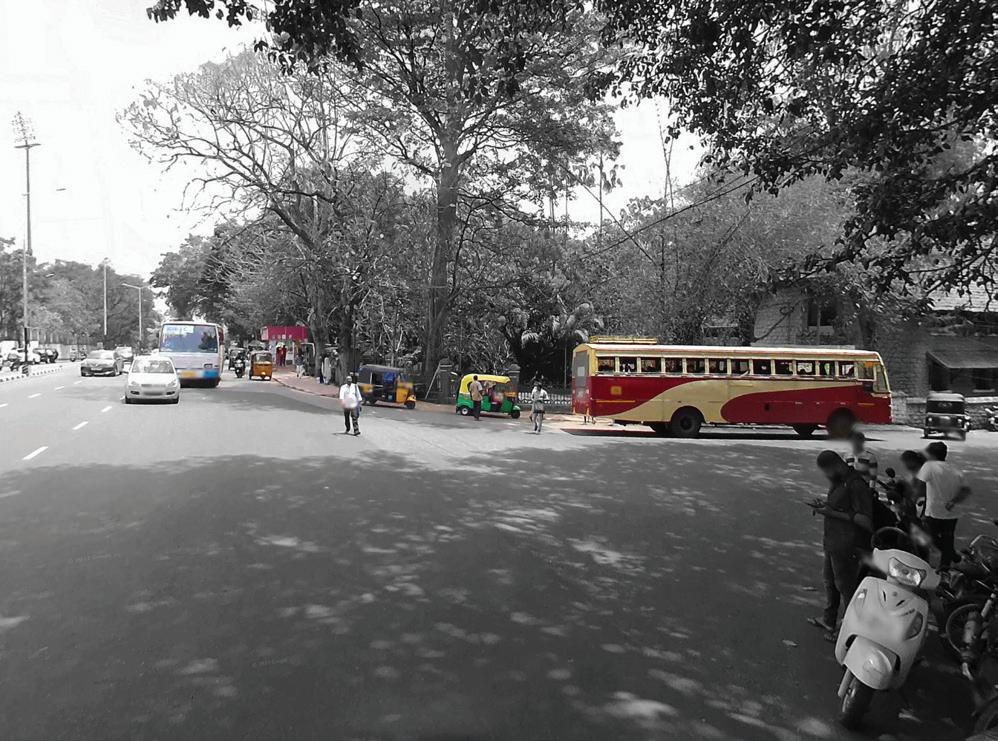
Inadequate greenery and landscaping were found, thus not providing needed shade and shelter for pedestrians. A lack of demarked cycle lanes and cycle parking facilities was also observed.
The Pedestrian Level of Service (LOS) analysis was carried out for the shortlisted bus stops using the parameters outlined below. The evaluation criteria and corresponding scoring methodology are presented in the following section. A sample assessment for Palayam Bus Stop is provsided thereafter to illustrate the application of the LOS framework.
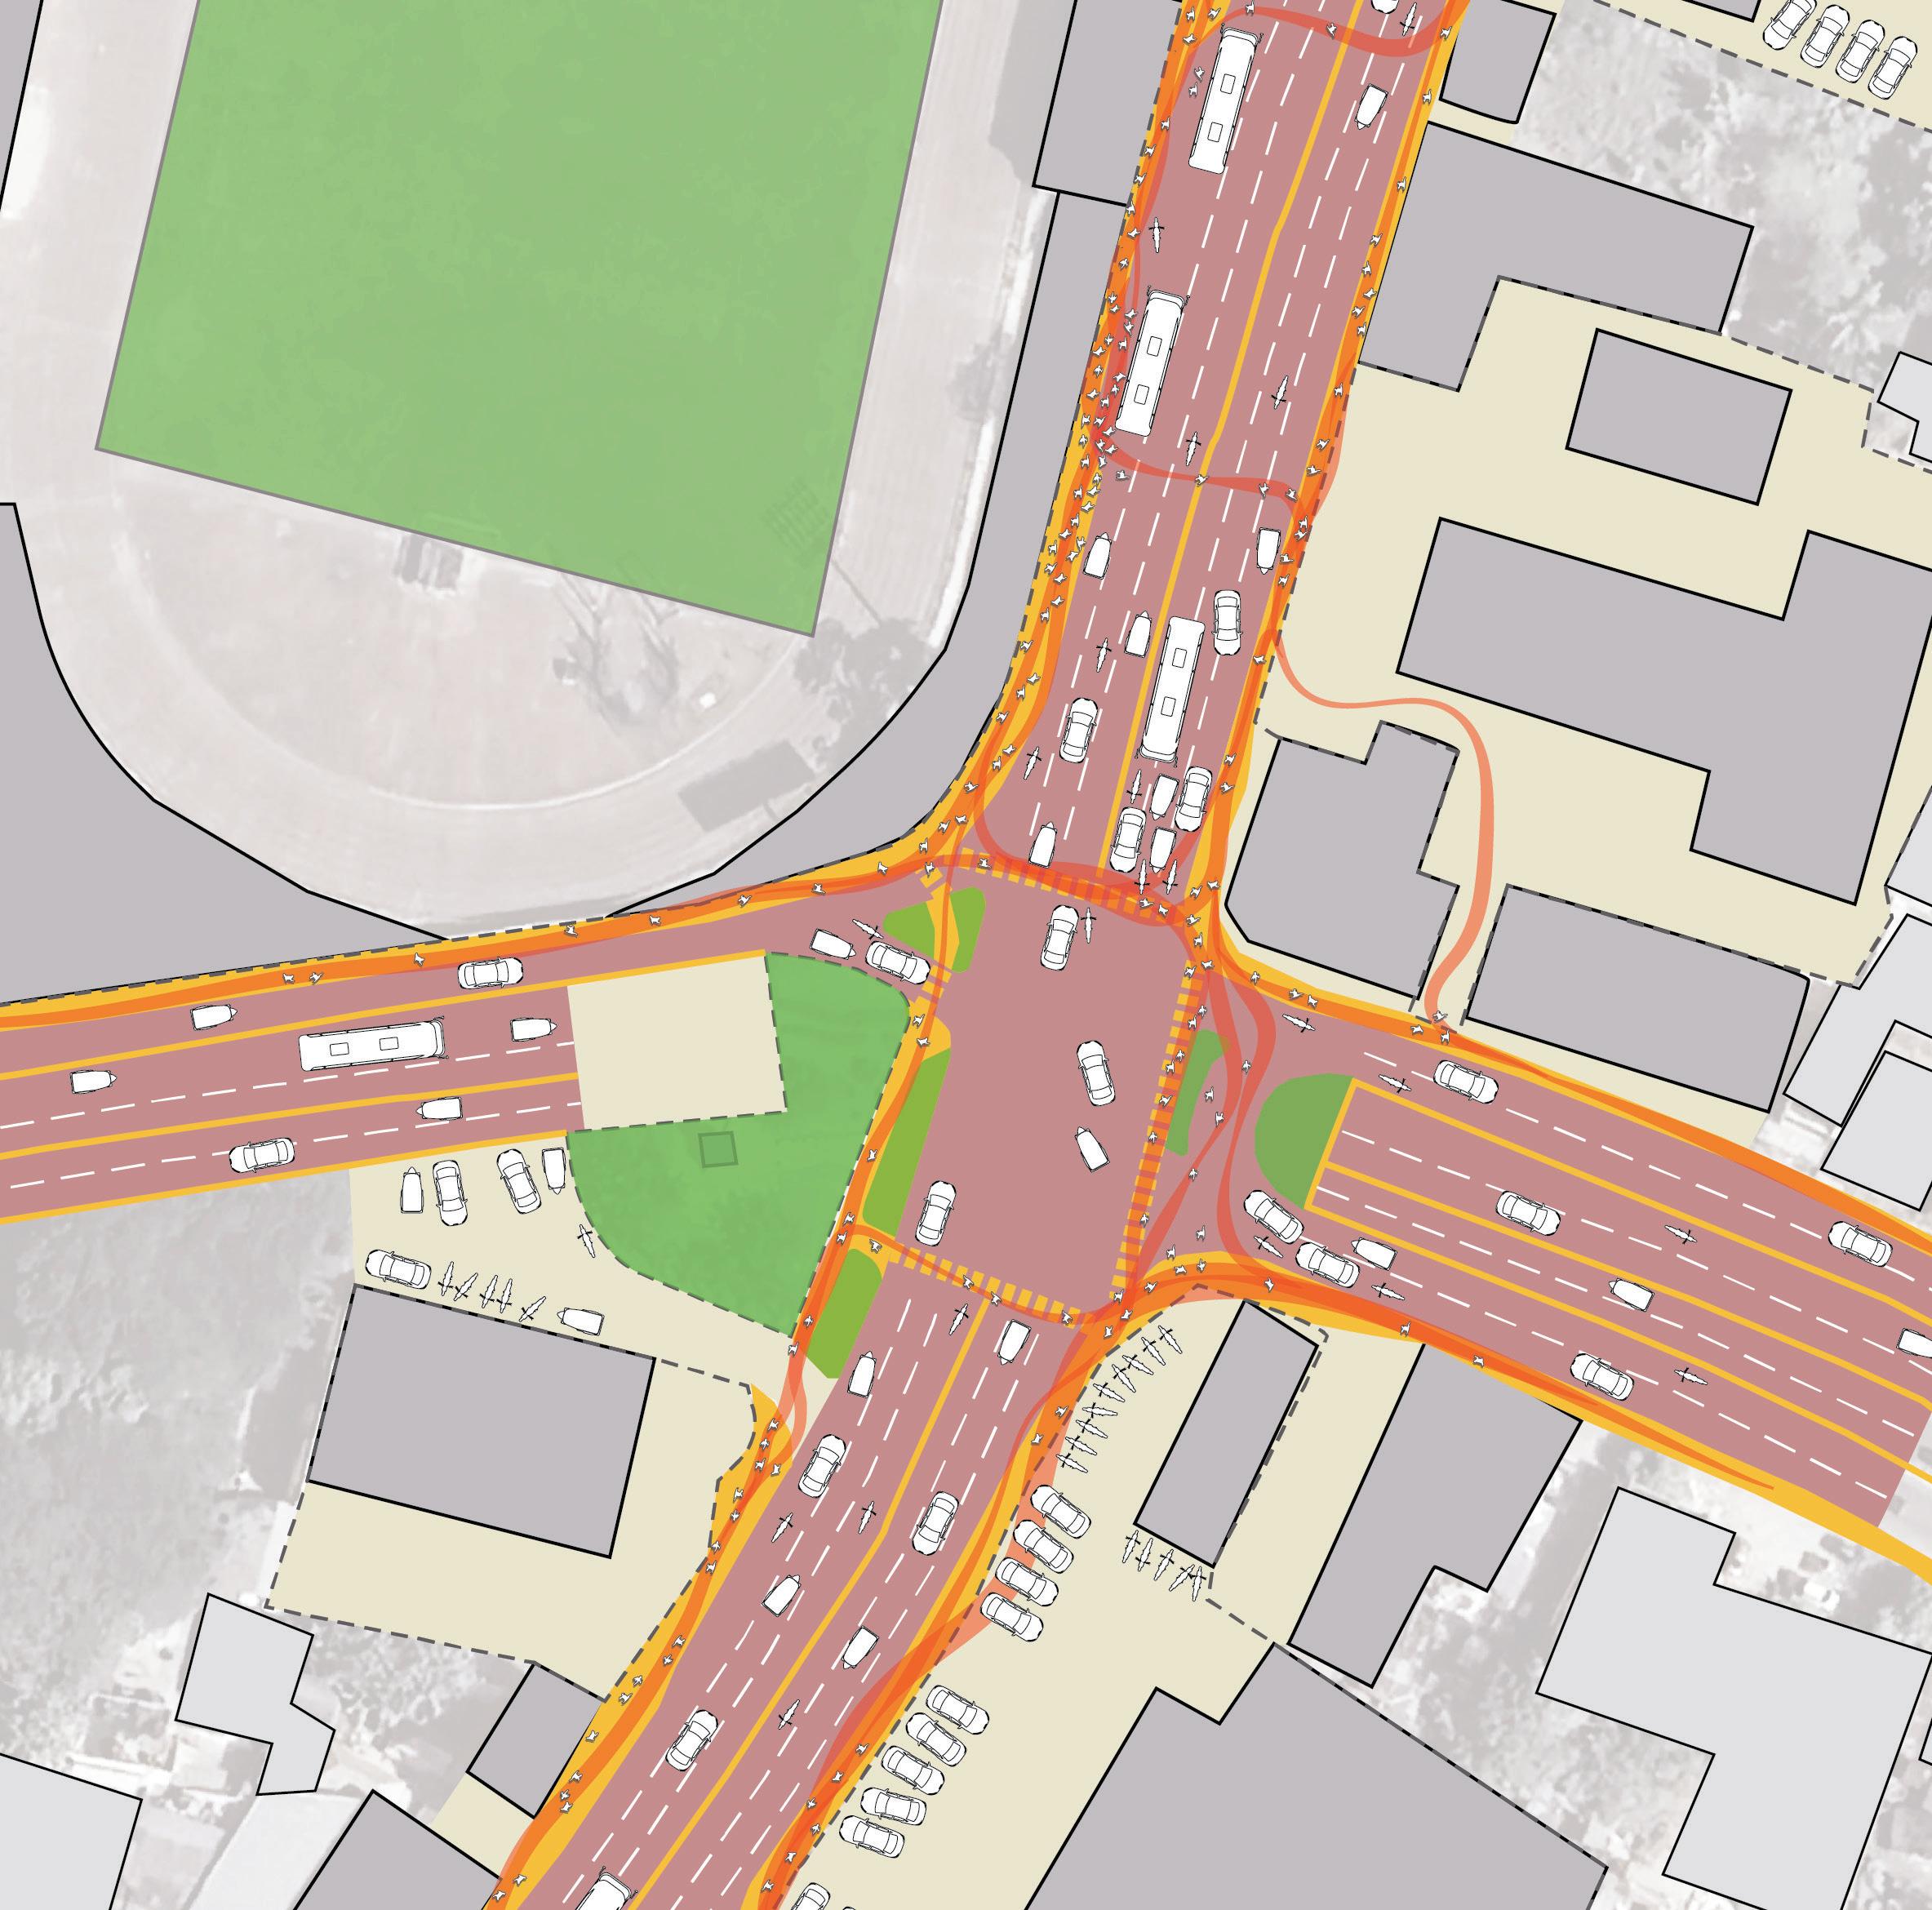
Table. 6. : Pedestrian LOS Analysis at Palayam
Table. 7. : Pedestrian LOS Analysis Marking Criteria.
1. Provision of dedicated IPT stops, to avoid auto rickshaws parking along the road shoulder.
2. Ensuring integration between various modes of transport with a coordinated public information system and unified fare structure.
3. Increase connectivity between different modes by synchronizing operational timing of feeder route services with public transport to avoid competition and rather matching modes to service requirements.
4. Bus and route rationalization with the use of numbers and assigned colours.
5. Fare Integration using smart cards or single journey ticket easing transfer from one mode to another as one seamless entity.
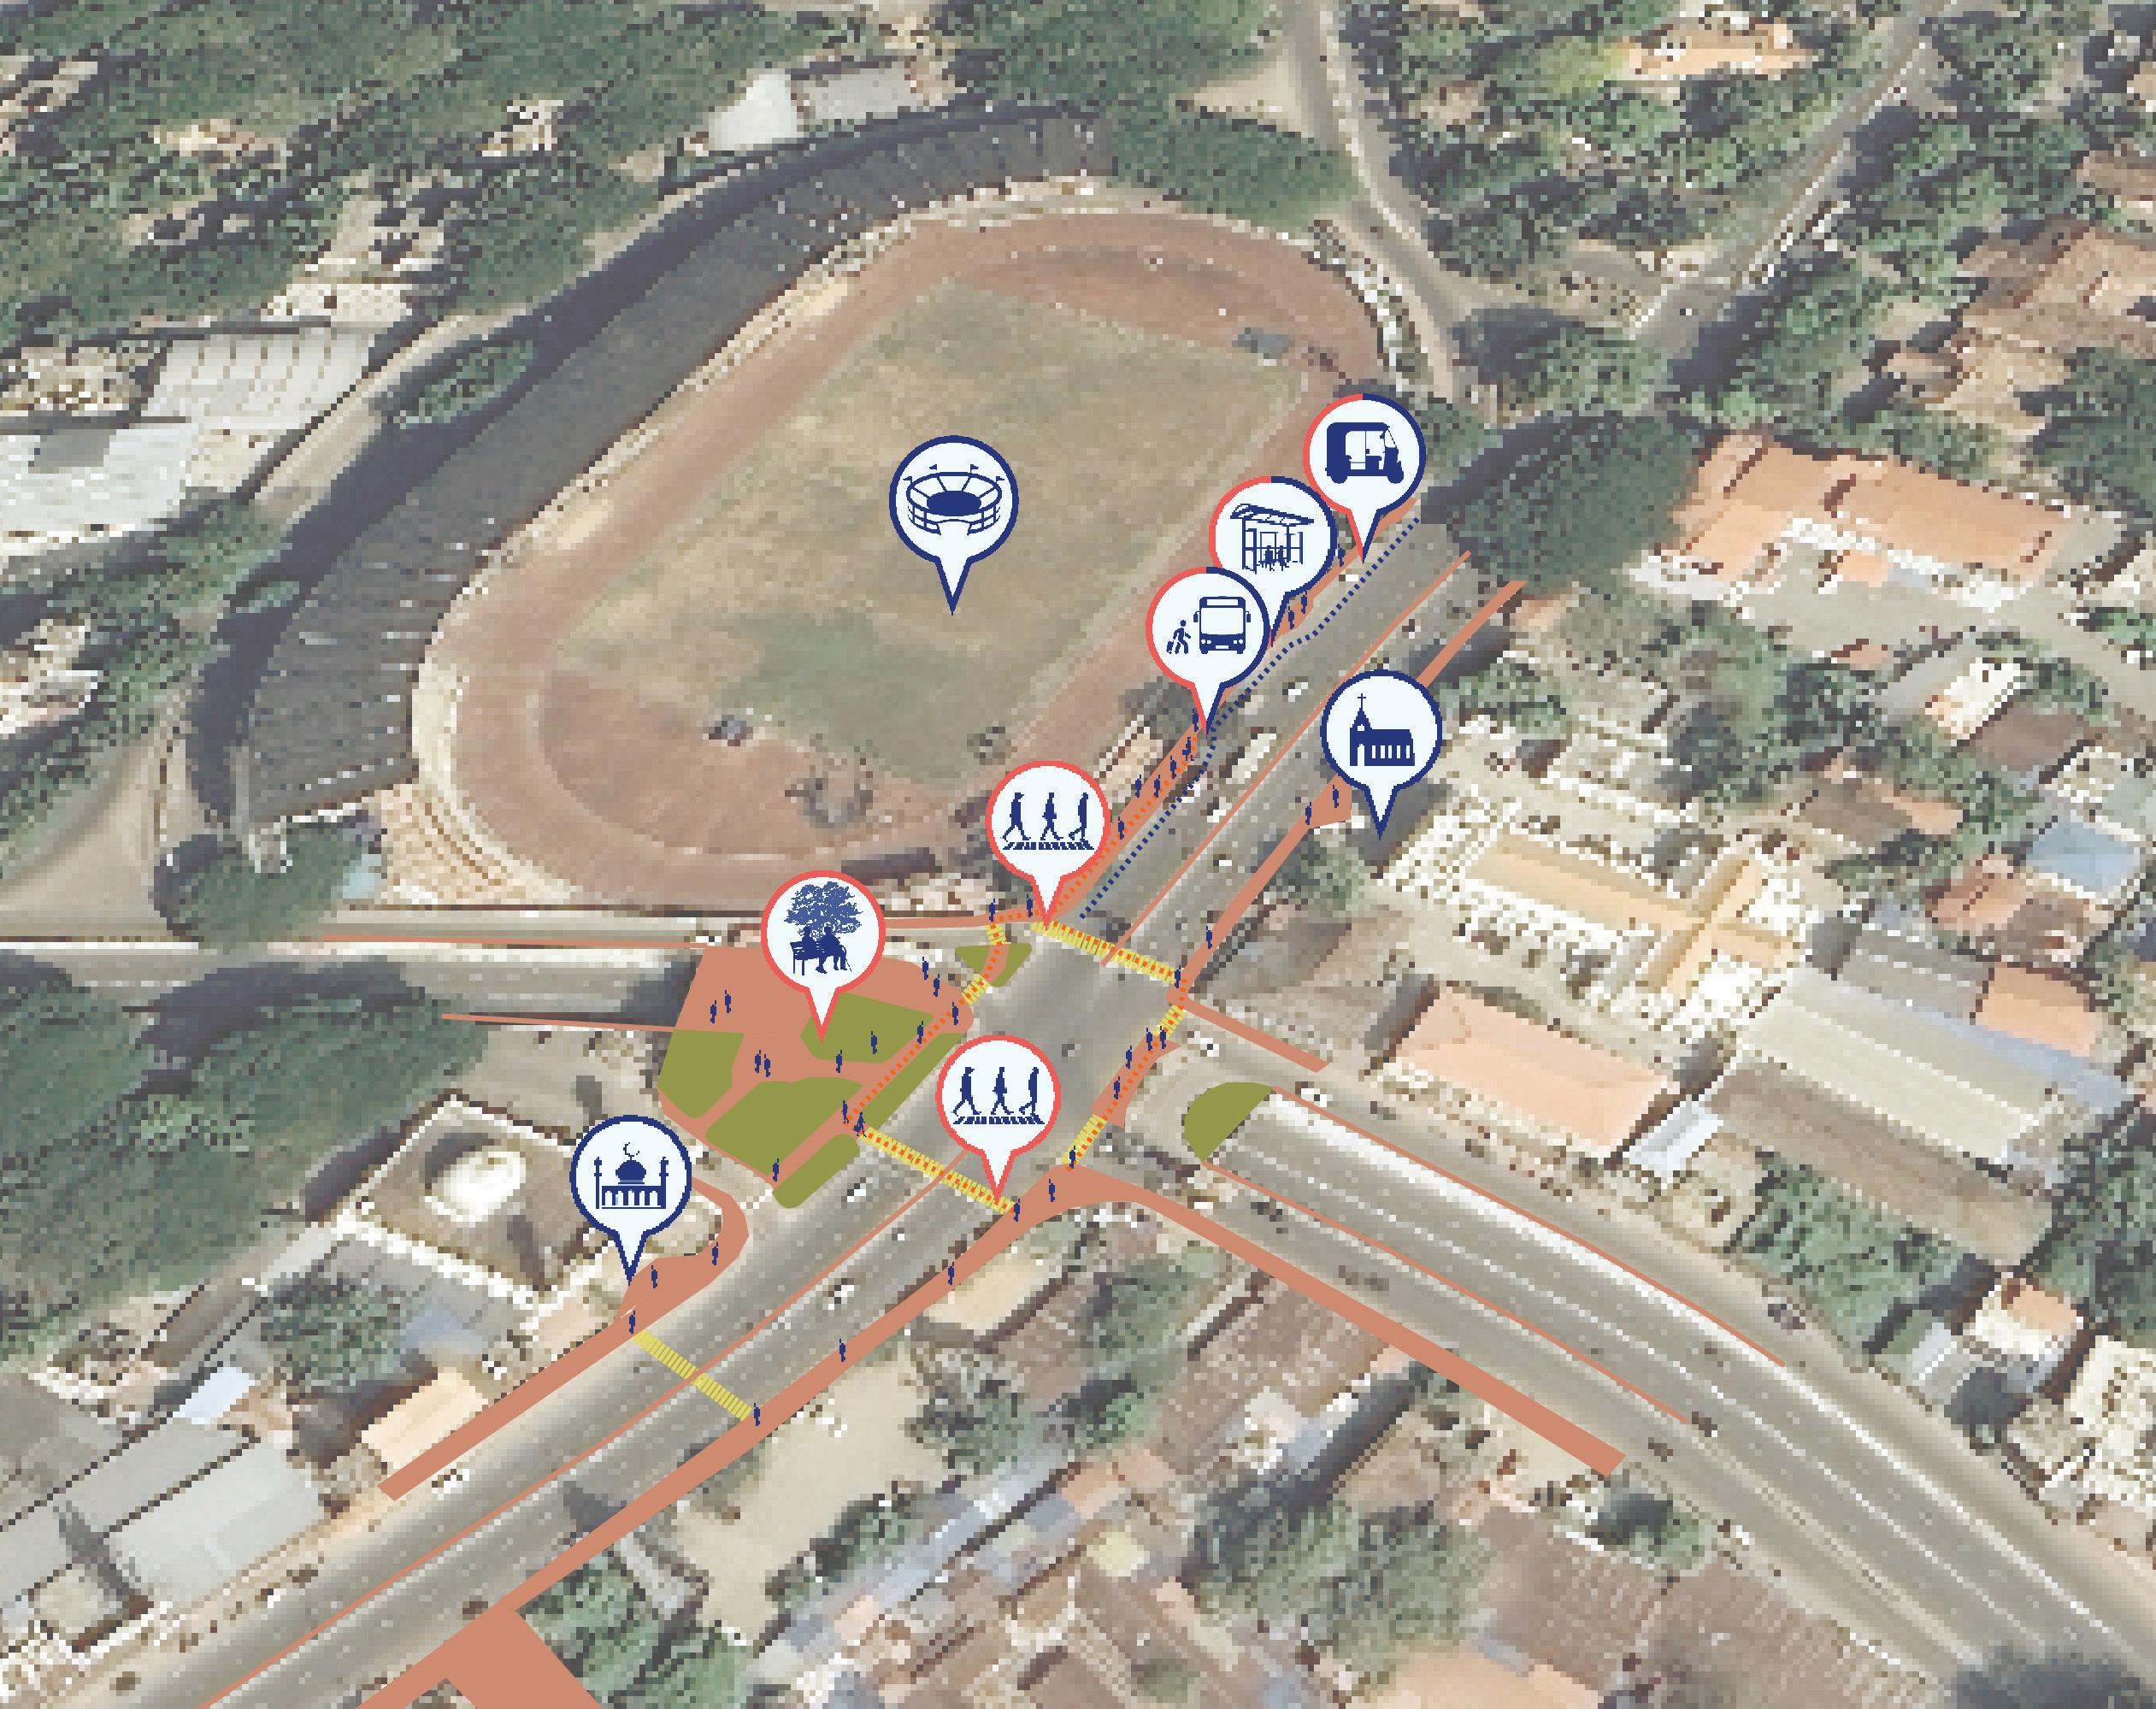
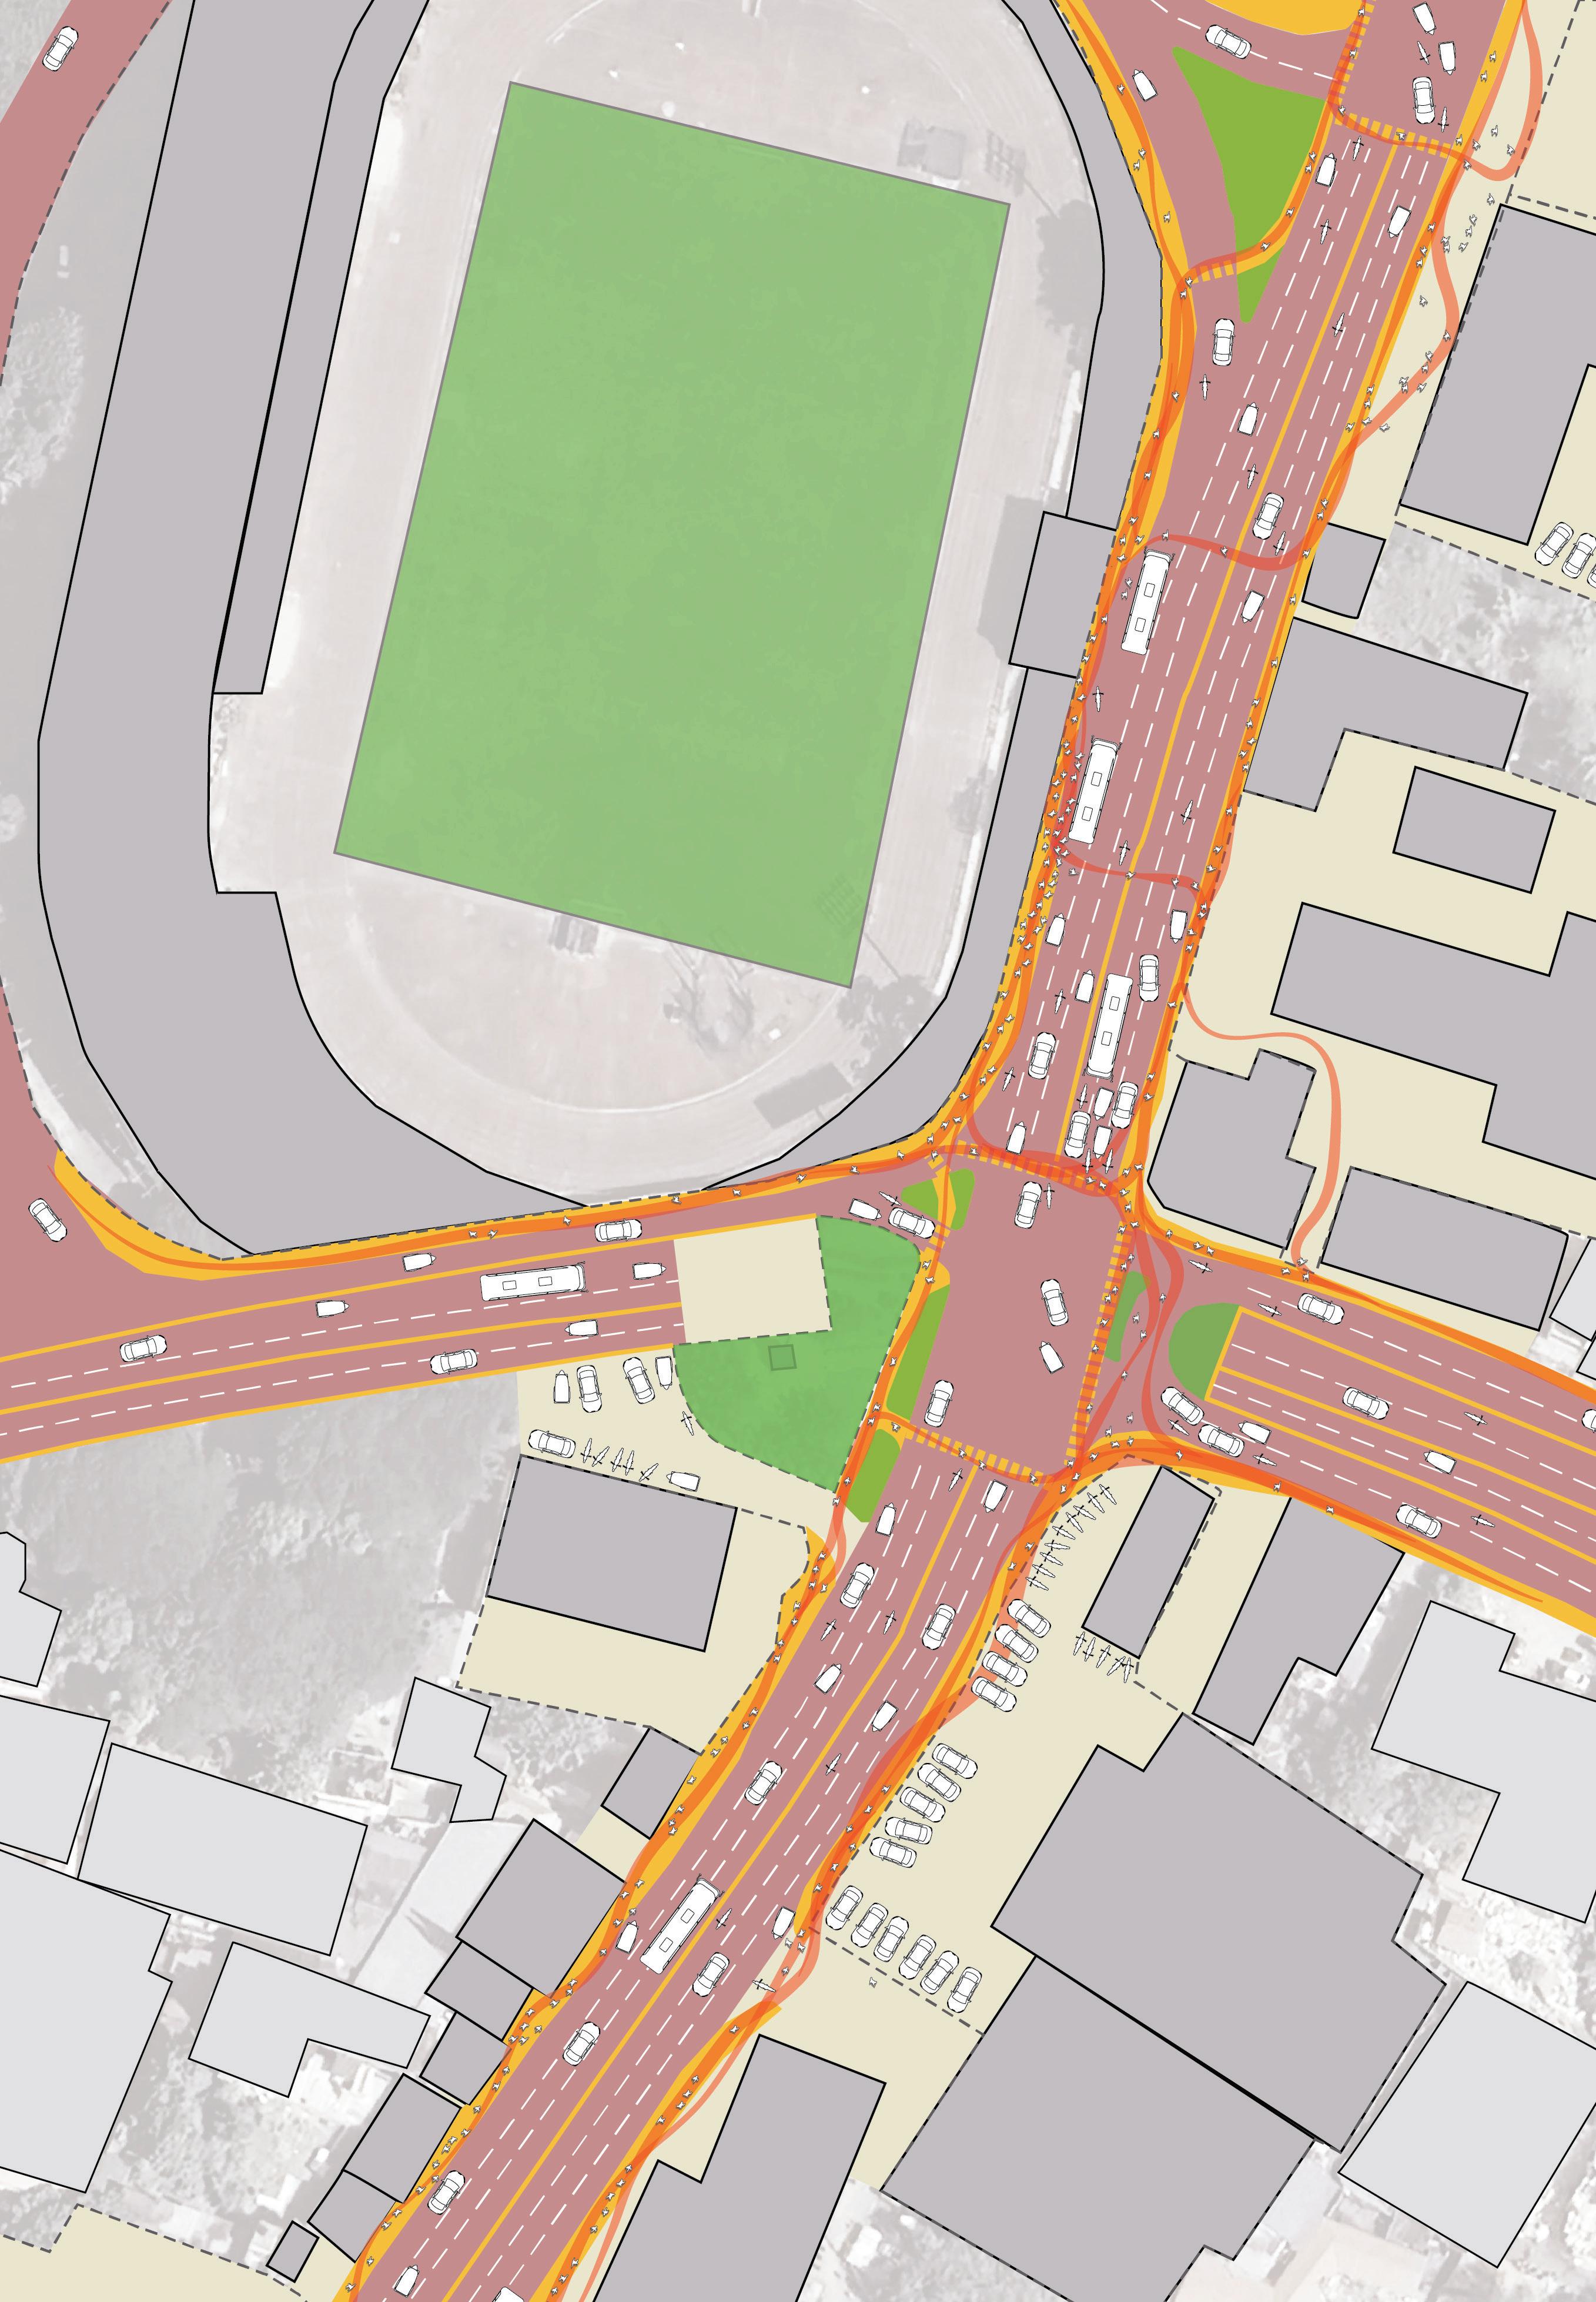
Intersection Design: Implement intersections featuring safer pedestrian crossings and wider, more accessible footpaths to enhance pedestrian safety and movement.
Dedicated Transit Lanes: Designate slow lanes specifically for buses and establish dedicated Intermediate Public Transport (IPT) stops close to bus stops to facilitate smoother transfers and better connectivity.
Bus Shelter Provisions: Ensure that bus shelters are adequately sized to accommodate the volume of passengers, including sufficient seating and clear, informative signage to improve overall user experience.
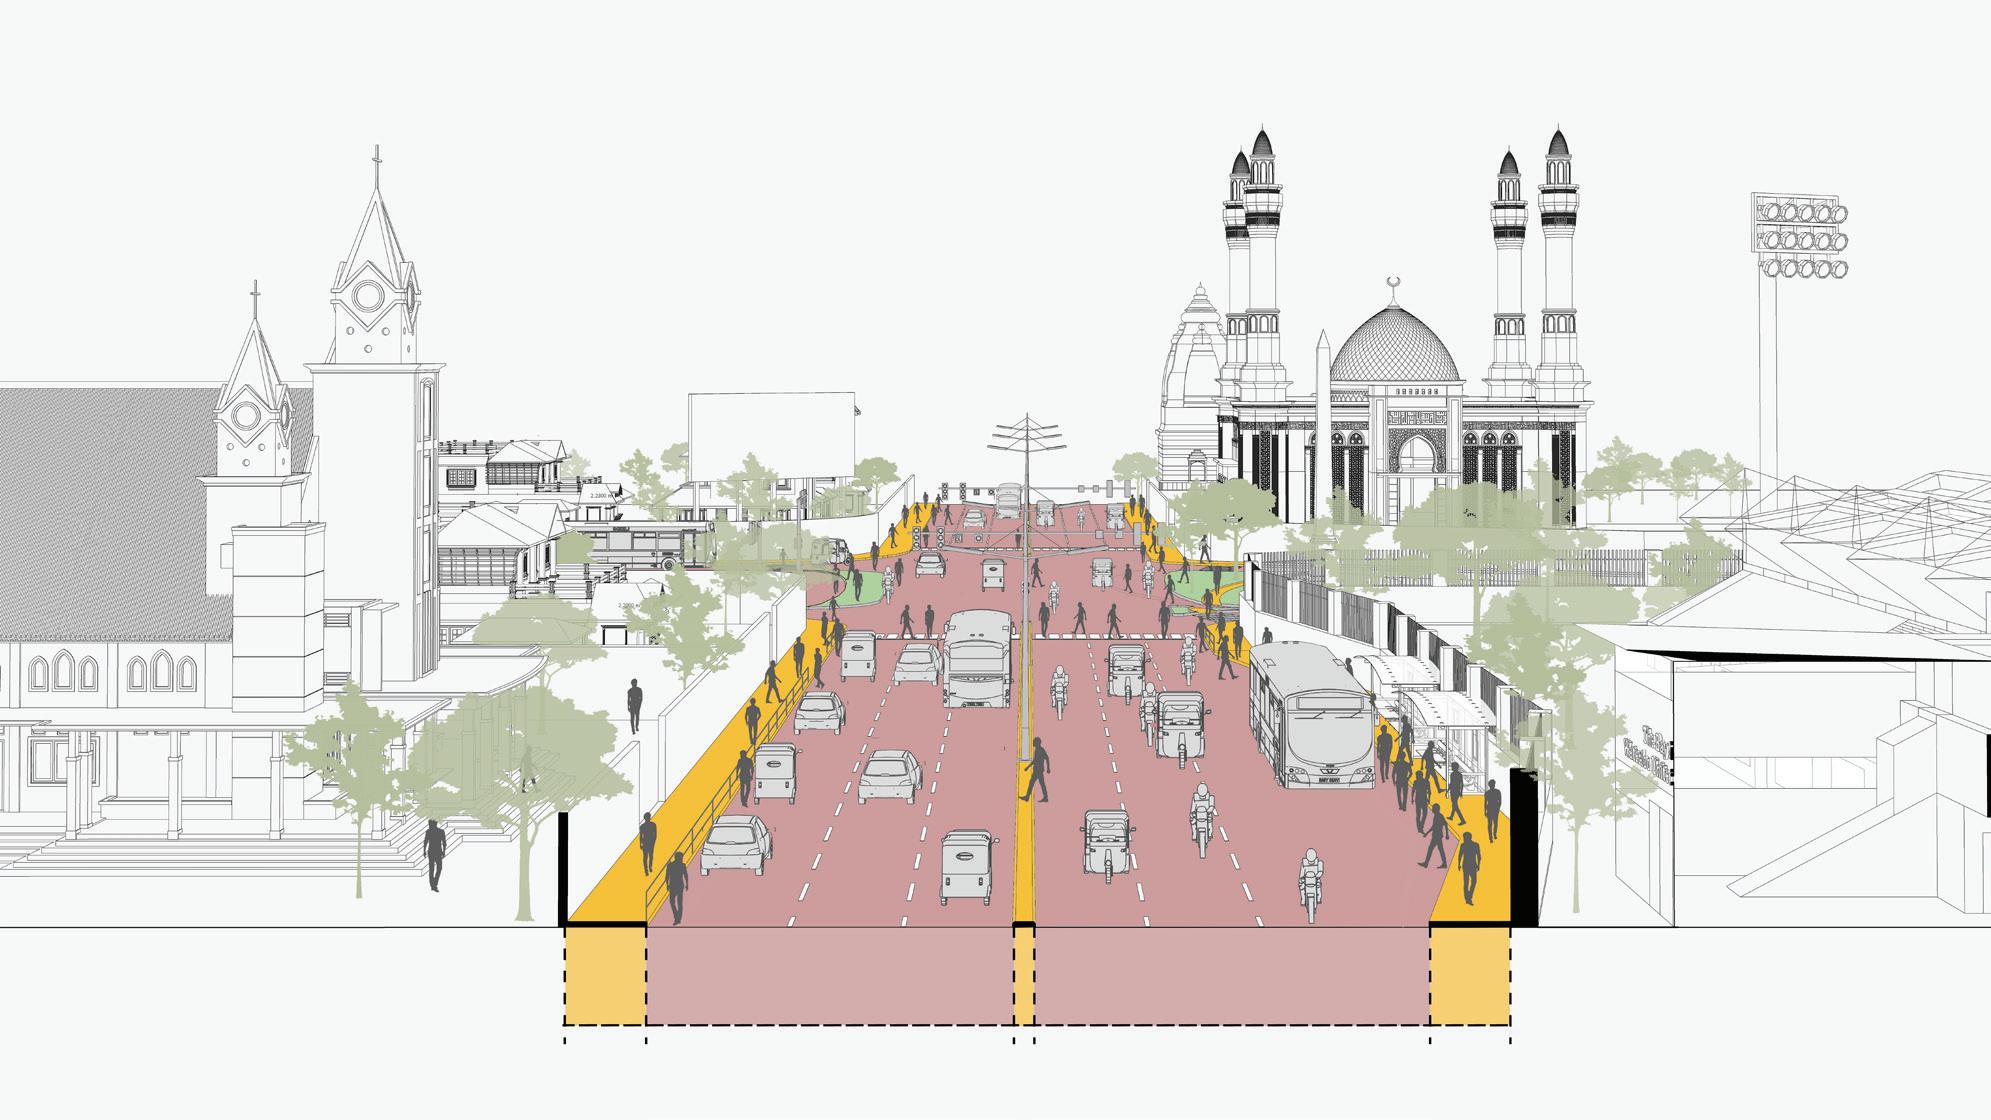
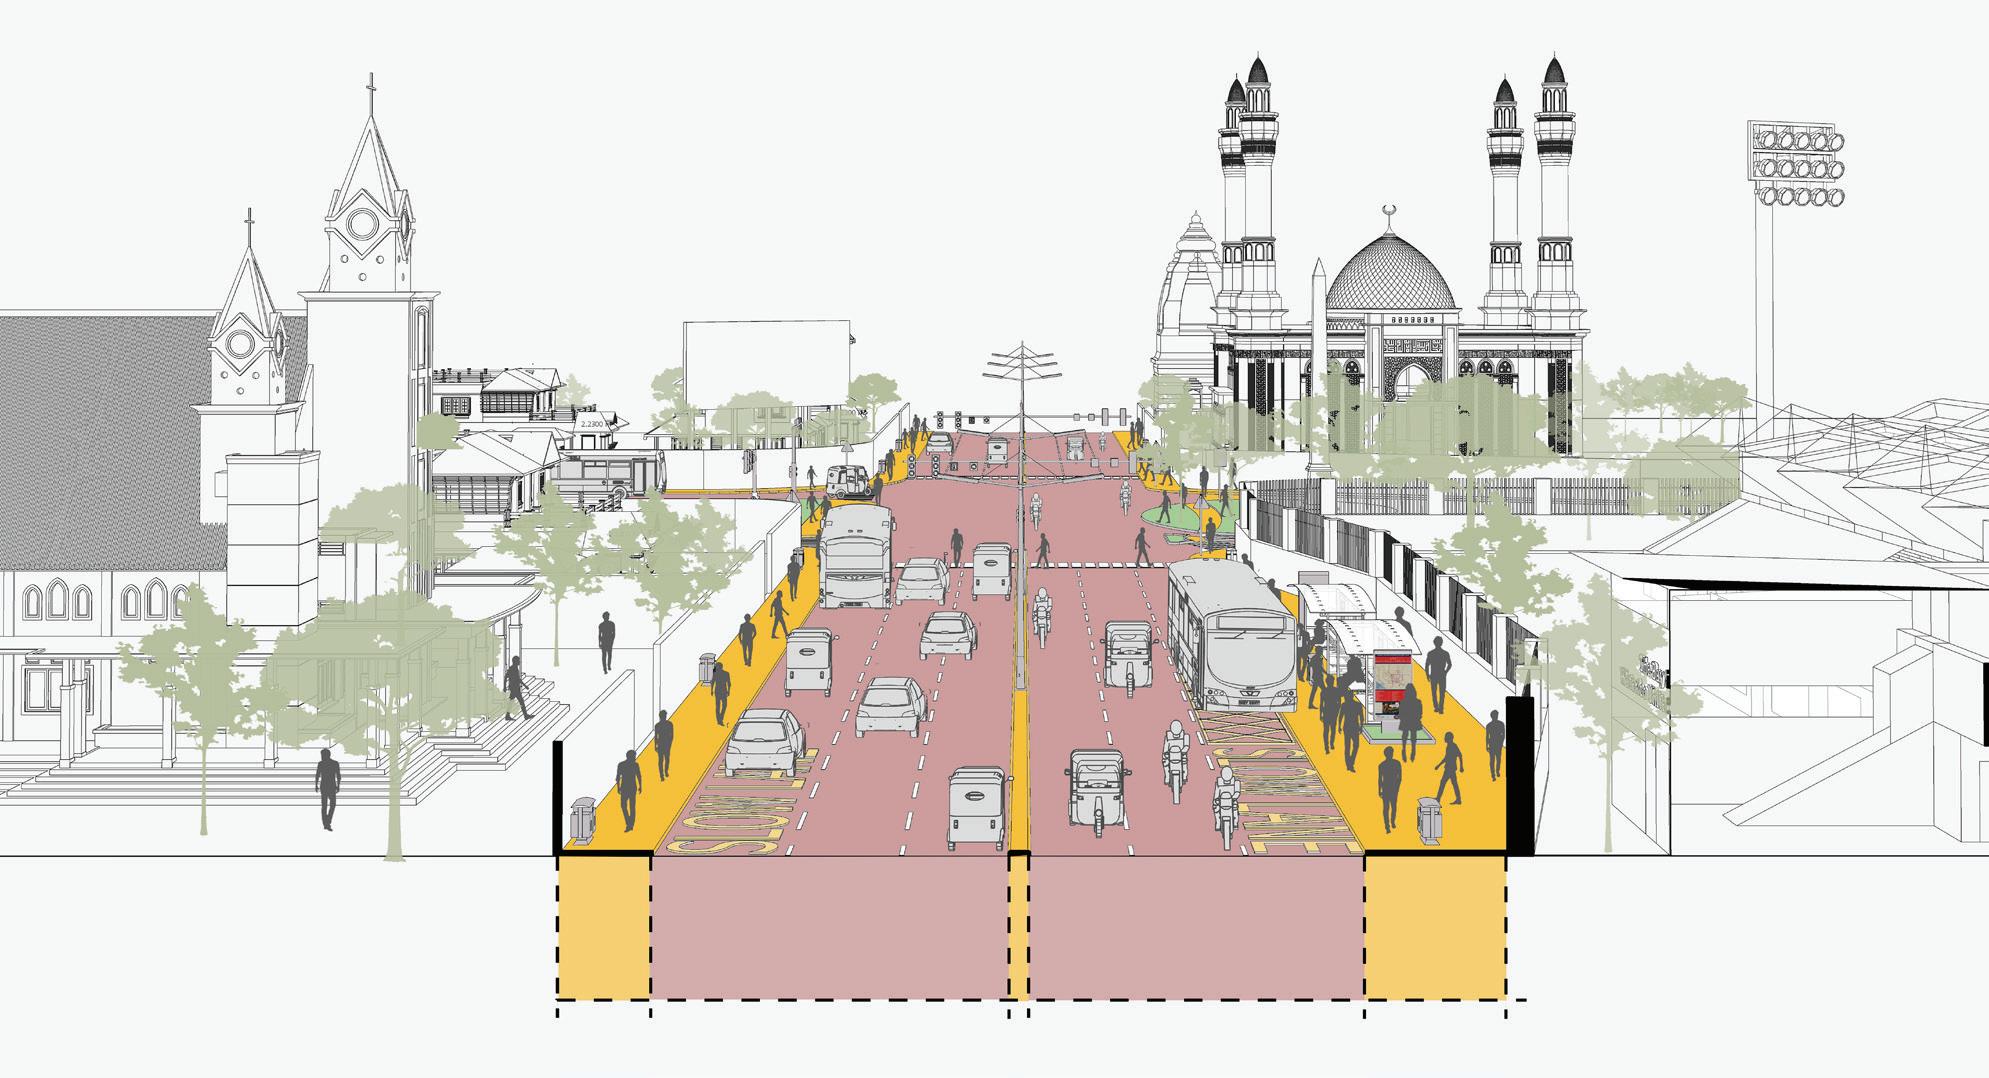

A Diagnostic and Strategy-Enabling Tool for Indian Cities
Developed under: GIZ SUM-ACA Project Sustainable Urban Mobility – Air Quality, Climate Action and Accessibility
India | Ministry of Housing and Urban Affairs (MoHUA)
India’s cities face compounding mobility challenges: rapid urbanisation, worsening air quality, rising motorisation, and deepening inequities in access to transport. Planning instruments such as Comprehensive Mobility Plans (CMPs) are extensively prepared, yet implementation has frequently been constrained by an over-reliance on travel demand forecasting and infrastructure-led approaches that do not adequately address systemic inefficiencies, institutional fragmentation, or emerging climate imperatives.
National-level policies have progressively widened the mandate for urban mobility planning. The National Clean Air Programme (NCAP, 2019) requires 122 nonattainment cities to prepare action plans linking mobility interventions to air quality targets. The Indo-German Green Urban Mobility Partnership (GUMP), signed in 2019 is a collaboration between the Ministry of Housing & Urban Affairs (MoHUA) and the German Federal Ministry for Economic Cooperation and Development (BMZ) to support and encourage environment friendly sustainable urban transport projects — supported by EUR 1 billion in concessional KfW lending for sustainable mobility infrastructure. It is in this context that the Integrated Mobility Plan (IMP) Evaluation Framework has been developed under the GIZ’s SUM-ACA project (Sustainable Urban Mobility – Air Quality, Climate Action and Accessibility), implemented in partnership with MoHUA. The framework is a diagnostic and strategy-enabling tool designed to shift city planning from predicting future demand to understanding current system performance and enabling cities to identify targeted, implementable interventions that serve equity, climate, and air quality objectives simultaneously.
This chapter documents the methodological basis of the IMP Evaluation Framework — the principles that shaped its design, the structured process through which it was developed, and the logic by which its nine dimensions and forty parameters were derived. Transparency of methodology is central to the credibility of the framework as a comparative assessment instrument.
The development of the IMP Framework is anchored in four core principles that define its scope, structure, and applicability:
The framework was constructed through a seven-step process that moves from a review of global and national frameworks through to validation against real city conditions. Each step produced a discrete methodological output that informed the next stage of development.
Table 2.1 Guiding Principles of the IMP Evaluation Framework conditions. Each step produced a discrete methodological output that informed the next stage of development.
Guiding Principle
City-Scale Measurability
Outcome-Oriented Structure
Systems-Based Approach
Alignment with Policy and Practice
Description
Indicators are designed to be measurable using secondary datasets — CMPs, Smart City systems, ITMS data, GIS layers, and administrative rds — ensuring applicability across cities without requiring primary data collection.
The framework focuses on mobility outcomes — accessibility, safety, inclusion, and emissions reduction — rather than isolated infrastructure provision.
Urban mobility is evaluated as an integrated system linking land use and urban form, public and informal transport systems, active mobility networks, digital ecosystems, and governance and financing structures.
Indicators and scoring logic are derived from the CMP Toolkit and Service Level Benchmarks (MoHUA), SUMP Guidelines (EU), ITDP, WRI, and World Bank toolkits, and the GIZ MaaS Readiness Framework.
Table 2.2 Methodological Flow for Development of the IMP Evaluation Framework Step
Step 1 Review of global and national frameworks (SUMP, CMP, SLB, ITDP, WRI, World Bank, GIZ)
Step 2 Translation of outcomes into system-level dimensions
Identification of core mobility outcomes
Definition of 9 functional mobility pillars
Step 3 Identification of parameters within each dimension Distinct performance areas and intervention levers
Step 4 Development of measurable indicators for each parameter City-scale, coverage-based metrics
Step 5 Integration of cross-cutting themes (climate, inclusion, digital) Mainstreamed across all parameters
Step 6 Development of scoring system (1–5 maturity scale) Standardised evaluation framework
Step 7 Validation and iteration using real city data Refinement for applicability and robustness
The review encompassed the EU Sustainable Urban Mobility Plan (SUMP) Guidelines (2nd ed., 2019); MoHUA’s Comprehensive Mobility Plan (CMP) Toolkit (2014) and Service Level Benchmarks (2012); ITDP’s Complete Streets Workbook and Women & Transport toolkit; World Bank Urban Transport Benchmarking; WRI India Low Emission Zones toolkit; GIZ MaaS Readiness Level for India (MRLI, 2021); and India’s National Clean Air Programme (2019), ClimateSmart Cities Assessment Framework 2.0 (2020), and National Disaster Management Authority guidelines. This breadth of review ensures that the framework captures global best practice while remaining grounded in India’s regulatory and institutional context.
The nine dimensions (pillars) of the IMP Framework are derived through a structured translation of SUMP thematic areas, CMP Toolkit guidance, and complementary practitioner frameworks into operational system components relevant to the Indian city context. Each dimension represents a distinct system lever — a domain where targeted interventions can produce measurable improvements in mobility outcomes. Together, the nine dimensions ensure that the framework captures both physical and institutional aspects of urban mobility.
The table below summarises how each dimension was derived, the source frameworks it draws on, its conceptual basis, and how it was adapted for the Indian context.
Table 2.3 Derivation of the Nine IMP Framework Dimensions and Their Adaptation to the Indian Context
IMP Dimension
Climate-Resilient & Compact Urban Growth
Public & Shared Transport Systems
Active Mobility (Walking & Cycling)
Equity, Inclusion & Informal Systems
Derived From Conceptual Basis Adaptation for Indian Context
SUMP (Accessibility, Environment), CMP Toolkit, TOD Policy
SLBs, CMP Toolkit, SUMP (Efficiency)
SUMP (Accessibility, Quality of Life), ITDP
SUMP (Inclusion), World Bank, ITDP
Integration of land use and mobility to enable accessibility
Service performance, accessibility, and reliability of PT systems
Walking and cycling as core modes
Inclusive mobility across all user groups
Expanded to include climate resilience and ecological continuity
Includes fare integration, MaaS, and multimodal performance
Includes universal access, child safety, and gender-sensitive design
Explicit inclusion of IPT and the informal sector
Climate & Environmental Sustainability
Parking & Travel Demand Management
Governance, Financing & Monitoring
Road Safety
Digital Integration
SUMP (Environment), NCAP, CSCAF
SUMP measure packages, ITDP, WRI
SUMP implementation steps, NUTP
SUMP (Safety), MoRTH, IRC
Emissions reduction and environmental performance
Demand management and behaviour change
Institutional and financial capacity
Reduction of fatalities and injuries
GIZ MaaS, DMAF, NCMC Digital enablement of mobility systems
Includes EV transition, air quality zones, and resilience
Focus on parking pricing and vehicle restraint mechanisms
Includes UMTA, funding mechanisms, and data systems
Includes school safety and gender safety perception
Elevated as standalone dimension for Indian Smart City context
Three cross-cutting themes — gender and social inclusion, climate and air quality, and digital integration — are mainstreamed across dimensions rather than isolated as standalone topics. Gender and inclusion considerations appear within Pillars II, III, IV, and VII. Climate and air quality objectives are embedded in Pillars I, V, and VI. Digital integration is both elevated as a standalone dimension (Pillar IX) and referenced within governance and monitoring parameters (Pillar VII).
For each of the nine dimensions, parameters were selected on the basis of three criteria: city-scale measurability using secondary datasets; conceptual alignment with the dimension’s mobility outcomes; and policy grounding in at least one national or international reference standard. This section documents the derivation logic and source frameworks for each parameter set, providing a traceable audit trail from source frameworks to adopted metrics.
This dimension was designed to assess the scale, intensity, and pattern of urban development, and the extent to which these dynamics are aligned with sustainable mobility and climate resilience objectives across six parameters. The selected parameters examine three interrelated concerns: (i) urban form and its interface with mobility systems, (ii) the accessibility outcomes of that urban form, and (iii) the resilience of the city’s development and mobility systems to climate and disaster risks. The parameter set was intentionally limited to aspects assessable at city scale using statutory plans, GIS-based land use and network data, CMPs, and state policy documents.
Resilient Urban Growth
Integration of Mobility with City Planning
Service Proximity
SUMP (Accessibility, Environment); NDMA; CSCAF; CMP Toolkit
CMP Toolkit; SUMP; TOD Policy
SUMP; CMP Toolkit; accessibility planning approaches
Street Network Structure & Connectivity
Disaster Risk Management
Climate Mitigation
ITDP Complete Streets; CMP Toolkit; walkability and permeability principles
NDMA; CSCAF; SUMP environment/resilience logic
NCAP; FAME; climate action and low-carbon mobility frameworks
Whether urban growth is being contained and directed toward existing serviced areas, while safeguarding ecological systems and reducing unsustainable outward expansion
Extent to which statutory land use planning and mobility planning are mutually reinforcing
Degree to which populated areas have essential services (schools, markets, healthcare) within walking distance, reducing motorised trip dependence
Whether the city has a coherent street hierarchy and interconnected network that supports walkability, permeability, and bus penetration
Whether mobility infrastructure planning is aligned with flood, heat, and emergency access considerations
Whether the city has adopted targets and measures for transport-related GHG reduction through modal shift, electrification, and low-carbon strategies
Policy intent and evidence of contained growth
Policy alignment
Coverage (%) –services within 15 min / 1 km walk
Composite –policy presence + % coverage indicators
Policy / coverage
Policy / coverage – GHG targets, EV, modal shift
This dimension was designed to assess the scale, intensity, and pattern of urban development, and the extent to which these dynamics are aligned with sustainable mobility and climate resilience objectives across six parameters. The selected parameters examine three interrelated concerns: (i) urban form and its interface with mobility systems, (ii) the accessibility outcomes of that urban form, and (iii) the resilience of the city’s development and mobility systems to climate and disaster risks. The parameter set was intentionally limited to aspects assessable at city scale using statutory plans, GIS-based land use and network data, CMPs, and state policy documents.
Network Coverage
Service Frequency & Reliability
Real-Time Service Integration
Service Level Benchmarks (MoUD, 2012); CMP Toolkit (2014)
SLBs (2012); Urban Bus Specifications UBS-II, MoUD (2013)
AIS-140 ITS Standard, MoRTH (2018); GIZ MaaS Readiness Level for India (2021)
Affordability
SLBs (2012); World Bank Urban Transport Benchmarking (2014–16)
Gender & Safety World Bank Gender Responsive Urban Mobility Toolkit (2022); ITDP Women & Transport (2017)
Physical Integration
Commuter Responsive Planning
National TOD Policy, MoHUA (2017); UMI Multimodal Integration resources (2016–18)
World Bank Urban Bus Toolkit; CMP Toolkit (2014)
Accessibility to public transport – ensuring spatial equity of coverage
Service quality as a primary driver of ridership – frequency and on-time performance
Seamless and informed journeys through real-time passenger information and fare integration
Economic access – ensuring public transport is financially accessible to lower-income households
Inclusive mobility – creating environments where women feel safe and can travel independently
Seamless multimodal transfers – ensuring stations function as connected mobility hubs
Adaptive service planning – routing and scheduling adjusted to actual ridership and equity needs rather than fixed forecasts
% population within 500m bus stop / 1km rail station
Average headway; % on-time; buses per lakh population
% fleet with RTPI; fare / service integration presence
Monthly pass as % of bottom-40% household income
Policy presence + user perception of safety
% major transit stations with multimodal access planning
Policy / process presence – route review mechanisms
This dimension assesses the extent to which cities support walking and cycling as primary modes for short-distance travel, recognising their critical role in improving accessibility, reducing emissions, and enhancing public health. Parameters focus on network continuity, inclusivity, and safety rather than isolated infrastructure provision. The emphasis on universal access and personal security reflects the need to create environments usable by all user groups, including children, elderly persons, and women. Together, these parameters evaluate whether active mobility is treated as a systematic, network-level priority.
Table 2.6 Parameter Derivation Framework for Pillar III: Active Mobility (Walking and Cycling)
Parameter
Continuity & Connectivity of NMT Networks
ITDP Complete
Streets Workbook (2016)
Universal Access
Personal Security
Harmonised Accessibility Guidelines, MoHUA (2021); World Bank Gender Toolkit (2022)
World Bank Gender Responsive Urban Mobility Toolkit (2022)
Network continuity –walking and cycling infrastructure must be uninterrupted to be usable, especially for commuting and school trips
Inclusive design – streets must be usable by children, elderly, and differently abled persons
Safety and comfort – lighting and active frontages are essential for women, children, and vulnerable groups to use streets at all hours
% arterial corridors with continuous footpath / cycle lane ≥1 km
Programme existence / coverage of barrier-free infrastructure
% streets with adequate lighting + eyes-on-street proxy
This dimension recognises that urban mobility in Indian cities is deeply shaped by socio-economic disparities and the prevalence of informal systems. Parameters were selected to assess whether mobility systems are inclusive of low-income populations, informal settlements, and non-formal transport services such as intermediate public transport (IPT). The inclusion of street vending policy and universal accessibility reflects the need to balance mobility efficiency with livelihoods and equitable access to public space. These parameters evaluate whether cities are moving towards a mobility system that is socially inclusive and reflective of ground realities.
Table 2.7 Parameter Derivation Framework for Pillar IV: Equity, Inclusion and Informal Systems
Low-Income
Access
CMP Toolkit (2014); World Bank Accessibility & Inclusion (2015–22)
Alternative Mobility (IPT)
Street Vendors & Informal Use Policy
National TOD Policy (2017); UMI Multimodal Integration (2016–18)
Street Vendors Act (2014); National Policy on Urban Street Vendors (2009)
Accessibility for Differently Abled Harmonised Accessibility Guidelines (2021); World Bank Toolkit (2022)
Spatial equity – ensuring informal settlements and low-income areas are not mobility-excluded
First / last mile access – IPT fills the gap where formal PT does not penetrate
Livelihood inclusion –vending around transit hubs must be regulated to coexist with pedestrian and NMT flows
Universal mobility – fleet and stations must be compliant with accessibility standards
% informal settlements linked to public transport services
Availability –safe, affordable, app-accessible IPT services
Policy presence / enforcement and designated vending zones
% compliant fleet and stations
Across five parameters this dimension evaluates the extent to which urban mobility systems contribute to climate mitigation, air quality improvement, and environmental sustainability. Parameters focus on measurable transitions such as fleet electrification, renewable energy integration, and emission control, while capturing broader policy responses such as low-emission zones and congestion management. The inclusion of resilient infrastructure ensures that environmental sustainability encompasses not only mitigation but adaptation to climate risks such as flooding and extreme heat. Parameters collectively reflect the dual objective of reducing environmental impact while ensuring system continuity.
Table 2.8 Parameter Derivation Framework for Pillar V: Climate and Environmental Sustainability
Low-Emission Fleet Share
Renewable Integration
FAME II (2019); EV Charging Guidelines, MoP (2022)
CSCAF 2.0 (2020); EV Charging Guidelines (2022)
Air Quality Integration
Emission Compliance & Congestion
Resilient Infrastructure
NCAP (2019); WRI Low Emission Zones Toolkit (2021)
NCAP (2019); WRI LEZ Toolkit (2021)
NDMA Urban Flooding Guidelines (2010); CSCAF 2.0 (2020)
Clean mobility transition – fleet electrification is the primary lever for transport-related air quality improvement
Energy sustainability – depots and stations powered by renewables reduce the life-cycle carbon of transit assets
AQ improvement – mobility plans must explicitly target hotspot areas with clean mode priorities and vehicular restrictions
Emission compliance and traffic performance as joint indicators of fleet quality and network efficiency
Climate resilience – transport infrastructure must be designed / retrofitted to withstand flooding, heat, and storms
% fleet on low-emission technology (e-bus, CNG, hybrid)
% depots and stations powered by renewable energy
Policy / coverage – LEZ, pedestrianisation, vehicular restrictions
BS-VI compliance (%) + peak V/C ratio on arterial corridors
% corridors, depots, and terminals with climate-resilient design
This dimension addresses the need to manage travel demand rather than continuously expand road capacity. Parameters were selected to evaluate whether cities are adopting policy instruments that discourage excessive private vehicle use and promote sustainable modes. Parking management is treated as a primary lever given its direct influence on travel behaviour. Broader vehicle restraint measures capture regulatory and fiscal interventions such as congestion pricing and lowemission zones. Together, these parameters assess whether cities are treating demand management as a core mobility strategy rather than an optional add-on.
Parking Policy ITDP On-Street Parking Management Toolkit (2016); GIZ Parking Management for Small & Medium Towns (2023)
Private Vehicle Restraint ITDP Taming Traffic (2021); WRI
India Low Emission Zones Toolkit (2021)
Demand management –parking supply and pricing directly shape private vehicle use decisions
Policy presence / demand-based pricing enforcement
Behaviour change – fiscal and regulatory instruments must disincentivise car use alongside PT improvement
Policy presence / coverage – congestion pricing, LEZ, levies
This dimension evaluates the institutional and financial foundations required to deliver sustainable mobility systems across six dimensions. Parameters were selected to assess whether cities have the institutional structures, funding mechanisms, and monitoring systems necessary for effective planning and implementation. Given the fragmented governance landscape in Indian cities, particular emphasis is placed on the presence of coordinated authorities such as UMTAs or SPVs. The inclusion of financing tools and data systems reflects the importance of long-term financial sustainability and evidence-based decision-making.
Table 2.10 Parameter Derivation Framework for Pillar VII: Governance, Financing and Monitoring
Institutional Framework (UMTA / SPV)
Funding & O&M Mechanisms
NUTP (2014); Metro Rail Policy (2017)
Value Capture Finance Policy (2017); NUTP (2014)
Land Value Capture / TOD Financing
Monitoring & Data
TOD Policy (2017); Value Capture Finance Policy (2017)
DMAF 2.0 (2020); SUMP Guidelines (2019)
Coordination capacity –empowered, cross-agency authority is the prerequisite for integrated planning
Financial sustainability – dedicated revenue streams ensure longterm operation without annual budget uncertainty
Financing integration – land-based instruments recover mobility investment costs from development that transit enables
Evidence-based planning – a mobility dashboard with KPIs enables adaptive management and performance accountability
Policy presence –statutory authority with financial autonomy
Finance mechanism presence –dedicated revenue streams
Finance mechanism presence –LVC instruments in use
Monitoring system and dashboard presence
Institutional & Stakeholder Coordination
SUMP Guidelines (2019)
Capacity Building SUMP Guidelines (2019)
Multi-agency coordination – regular forums with PT agencies, civic bodies, and civil society are necessary for integrated planning
Institutional capacity – staff competency in transport planning directly affects quality of plan preparation and implementation
Process / outcome – number of inter-institutional meetings per year
Process / outcome – proportion of staff with transport planning competency
This dimension treats road safety as a core outcome of urban mobility systems rather than a standalone sectoral issue. Parameters focus on measurable safety outcomes — fatalities and serious injuries — as well as proactive measures such as black spot treatment and school safety programmes. The inclusion of both outcome and intervention-based indicators ensures that cities are evaluated on their current safety performance as well as their efforts to improve it. This approach aligns with global Vision Zero frameworks while remaining grounded in Indian data availability and institutional practice.
Fatalities & Serious Injuries
Road Accidents in India, MoRTH (2023); IRC SP:88 (2010)
Black Spot Management
School & Child Safety
MoRTH Circular (2015 / 2019); IRC 131 (2022)
WRI India Safe Access to Schools (2016–21); World Bank Gender Toolkit (2022)
Safety outcomes – the ultimate measure of a city’s road safety performance is the rate of death and serious injury among road users
Risk reduction – targeted treatment of identified crash hotspots is the most cost-effective safety intervention
Child safety – school zones require dedicated measures because children are among the most vulnerable road users
Annual fatalities per 100,000 population, disaggregated by mode
% identified black spots treated through infrastructure or enforcement
% schools with Safe Access to School plans implemented
This dimension captures the growing role of digital systems in enabling integrated, user-centric mobility services. Parameters were selected to evaluate not only the availability of digital infrastructure but its integration, governance, and adoption by users. This includes policy readiness for data sharing, platform integration through MaaS and NCMC, and the availability of open data systems such as GTFS. Digital Integration is elevated as a standalone dimension — rather than embedded within governance — to reflect the central role of ITS and MaaS platforms in India’s Smart Cities Mission context and the GIZ MaaS Readiness framework.
Parameter Derived From Conceptual Basis Adopted Metric
Policy & Regulatory Readiness
Digital System Integration (MaaS)
NDSAP (2012); NCMC Guidelines (2019–20)
Data Infrastructure & Availability
GIZ MaaS Readiness Level for India (2021); NCMC (2019–20)
DMAF 2.0 (2020); NDSAP (2012)
Digital governance –enabling policies on open data, interoperability, and secure payments are prerequisites for MaaS and ITS at scale
Platform integration – a unified MaaS platform aggregating modes for trip planning, booking, payment, and feedback
Data availability – open, standardised datasets (GTFS, GTFS-RT, open APIs) are the foundation of third-party and MaaS platform access
Policy presence – open data mandates, interoperability frameworks, digital payment standards
Platform existence and rate of adoption by users
% transport operators providing open, standardised data feeds
Digital Travel Behaviour
GIZ MaaS Readiness Level for India (2021); ITDP Transport4All (2023)
User adoption – digital infrastructure is only effective if users actively use it for trip planning and ticketing
% PT riders using digital tools (apps, smart cards) at least weekly
The IMP Evaluation Framework comprises nine thematic pillars and forty parameters. Each pillar captures a distinct system lever required to achieve sustainable mobility outcomes, collectively encompassing both physical and institutional dimensions of urban mobility. The table below provides a summary view; detailed parameter derivation is presented in Section 2.4.
The 40 parameters span infrastructure coverage, service performance, policy adoption, institutional mechanisms, financing arrangements, and digital maturity — ensuring that no critical system component is overlooked. Each parameter is assessed on a standardised 1–5 maturity scale documented in Section 4.
The IMP Evaluation Framework adopts a five-point maturity scale (1–5) to assess each parameter in a consistent and comparable manner across all dimensions. The scoring system is designed to capture the progression from intent to fullscale implementation, recognising that cities may be at different stages of policy development, pilot implementation, and system-wide adoption.
1 No Intent
2 Only Intent
3 Progressing
4 Partly Achieved
5 Achieved
The parameter is absent from policy, planning documents, or implementation. There is no evidence of consideration in the city’s mobility framework.
The parameter is acknowledged in plans, policies, or strategies, but there is no evidence of implementation or operationalisation.
Initial implementation has begun through pilots or limited interventions, typically covering ≤30% of the city or system. Efforts are fragmented or not yet institutionalised.
The parameter is institutionalised and implemented across a significant portion of the city (~30–70% coverage), but gaps remain in consistency, quality, or system integration.
The parameter is fully implemented and mainstreamed across the city (≥70% coverage or system-wide adoption), supported by robust institutional, operational, and monitoring mechanisms.
While the scoring scale is standardised, assessment thresholds are calibrated to the type of metric used for each parameter:
• Coverage-based parameters: Evaluated using percentage thresholds — population coverage, network extent, or fleet share. The score 3 / Progressing threshold corresponds to ≤30% coverage; score 5 / Achieved requires ≥70%.
• Policy-based parameters: Evaluated based on the existence, statutory integration, and enforcement of policies. Score 2 reflects a drafted or notified policy with no evidence of implementation; score 5 requires policy fully embedded in regulatory and planning systems.
• Performance-based parameters: Evaluated using benchmarks — headways, on-time performance, affordability ratios, or fatality rates — derived from Service Level Benchmarks, SUMP Guidelines, and sector-specific standards.
• Process-based parameters: Evaluated based on institutional mechanisms, frequency of stakeholder engagement, and evidence of decision-making structures. Score 5 requires regular, institutionalised forums with demonstrated outcomes.
Each pillar score is calculated as the sum of its constituent parameter scores expressed as a proportion of the maximum possible score for that pillar. This produces a normalised pillar score (0–1) that enables cross-pillar comparison and radar chart visualisation:
Pillar Score = Σ (Parameter Scores) / (Number of Parameters × 5)
Pillar scores above 0.70 indicate broad achievement of that dimension’s objectives. Scores between 0.40 and 0.70 indicate partial achievement. Scores below 0.40 signal significant system gaps requiring priority attention in the city’s Integrated Mobility Plan.
Each score must be supported by evidence from secondary data sources. The ‘Comments / Notes of Evidence’ column in the framework spreadsheet captures the specific data source, document reference, or contextual note underpinning each score. Typical sources include:
• Statutory plans — Development Plans, Master Plans, zoning regulations, notified mobility policies
• Public transport authority records — service data, fleet registers, ridership, operational performance
• GIS and spatial data — accessibility analysis, network coverage, land use patterns
• Government reports — air quality data (CPCB / SPCB), accident records (MoRTH), disaster management plans
• ITS and digital systems — GPS tracking data, GTFS feeds, ticketing systems, RTPI platforms
• User surveys and studies — perception of safety, affordability assessment, gender-disaggregated travel data
Detailed scoring examples for each parameter — translating the generic 1–5 scale into context-specific thresholds and source references — are provided in the Scoring Examples sheet accompanying the IMP Evaluation Framework spreadsheet tool.
The IMP Evaluation Framework departs from conventional transport planning approaches in five important respects, each of which directly addresses a documented gap in the current practice of urban mobility planning in Indian cities.
Innovation
Supply-Led Diagnostic Approach
Mainstreaming of Climate and Air Quality Objectives
Description
Rather than forecasting future demand and sizing infrastructure accordingly, the framework diagnoses existing system performance and identifies where current supply falls short of equitable, sustainable service delivery. This enables faster and more targeted interventions without requiring years of primary data collection.
Air quality improvement and climate resilience are integrated as core planning objectives across multiple pillars, directly linking mobility interventions to NCAP targets, GHG reduction commitments, and climate adaptation requirements. This makes the framework uniquely suited to cities preparing Clean Air Action Plans alongside Comprehensive Mobility Plans.
Recognition of Informal Mobility Systems
Gender and Accessibility as Structural Requirements
The framework explicitly incorporates intermediate public transport (IPT), street vending, and informal sector workers as integral components of the mobility ecosystem rather than peripheral elements. This reflects the operational reality of Indian cities and ensures that planning responses are grounded in existing travel patterns.
Gender-sensitive design, safety measures, and accessibility for differently abled users are embedded across multiple pillars rather than treated as add-on considerations. This reflects the SUM-ACA project’s commitment to socially balanced mobility planning and aligns with GUMP’s equity objectives.
Scalable, Comparable Assessment
The standardised 1–5 scoring system enables comparison of mobility system maturity across cities and over time. This supports evidence-based prioritisation, benchmarking against peer cities, and monitoring of progress towards national and GUMP targets.
The IMP Evaluation Framework draws on the following primary policy, technical, and practitioner references:
1. MoHUA (2014) National Urban Transport Policy. Government of India.
2. MoUD (2012) Service Level Benchmarks for Urban Transport – Methodology & Manual. Government of India.
3. MoHUA (2014) Comprehensive Mobility Plan (CMP) Toolkit. Government of India.
4. MoHUA (2017) National TOD Policy. Government of India.
5. MoEFCC / CPCB (2019) National Clean Air Programme (NCAP). Government of India.
6. MoHUA (2021) Harmonised Guidelines and Standards for Universal Accessibility in India. Government of India.
7. MoHUA (2020) ClimateSmart Cities Assessment Framework 2.0. Government of India.
8. MoRTH (2018) AIS-140 Intelligent Transport Systems (Vehicle Tracking). Government of India.
9. MoRTH (2023) Road Accidents in India. Government of India.
10. EU / Rupprecht Consult (2019) Guidelines for Developing and Implementing a Sustainable Urban Mobility Plan, 2nd Edition. ELTIS.
11. ITDP (2016) Complete Streets: Planning & Design Workbook. ITDP India.
12. ITDP (2017) Women and Transport in Indian Cities. ITDP India.
13. WRI India (2021) Creating Low-Emission Zones in Indian Cities. WRI India.
14. World Bank (2022) Toolkit for Enabling Gender Responsive Urban Mobility and Public Spaces in India. World Bank.
15. GIZ (2021) MaaS Readiness Level for India (MRLI). Deutsche Gesellschaft für Internationale Zusammenarbeit (GIZ) GmbH.
16. GIZ (2023) On-Street Parking Management for Small and Medium Towns. GIZ GmbH.
17. NDMA (2010) National Guidelines on Urban Flooding. National Disaster Management Authority.
18. MoHUA (2017) Metro Rail Policy. Government of India.
19. MoUD (2017) Value Capture Finance Policy Framework. Government of India.
20. Street Vendors (Protection of Livelihood and Regulation of Street Vending) Act (2014). Government of India.
21. MoRTH Circular: Protocol for Black Spot Identification and Rectification (2015 / 2019). Government of India.
22. IRC 131 (2022) Guidelines for Identifying and Treating Blackspots. Indian Roads Congress.
23. WRI India (2016–2021) Safe Access to Schools. WRI India.
24. NPCI (2019–2020) National Common Mobility Card (NCMC) Specifications. National Payments Corporation of India.
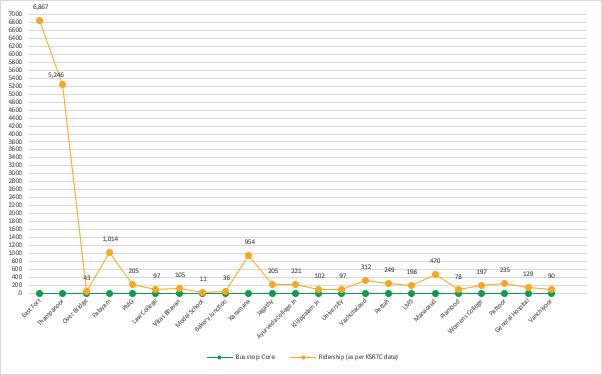
Fig. 74. KSRTC bus ridership in the city core
The evaluation reveals that ridership is highest at the bus stops located at East Fort, followed by Thampanoor and Palayam, all situated within the city’s core area. This high ridership at these key locations underscores their importance as central hubs in the transit network.
In analysing the type of bus stop at each location, it is noted that these stops serve intercity and intracity routes, and act as terminals or key transfer points. Given their critical role in the transit sys-
tem, addressing issues such as pedestrian-vehicular conflicts at these stops becomes paramount.
East Fort, Thampanoor, and Palayam are identified for interventions due to their high ridership and the complex interactions between pedestrians and vehicles in these areas. By focusing improvements on these bus stops, we can enhance overall transit efficiency and safety.
Table. 8. : Mode and Bus Stop Type- Core
Mode and Bus Stop Type
Bus stop Bus stop type Modes
East Fort Inter + Intra Bus
Thampanoor Station Inter + Intra Bus +Train
Over Bridge Intra Bus
Statue Intra Bus
Palayam Intra Bus
PMG Intra Bus
Law College Intra Bus
Vikas Bhavan Intra Bus
Model School Intra Bus
Bakery Junction Intra Bus
Karamana Intra Bus
Jagathy Intra Bus
Ayurveda college Jn Intra Bus
Killippalam Jn Intra Bus
University Intra Bus
Vazhutacaud Intra Bus
Pettah Intra Bus
LMS Intra Bus
Manacaud Intra Bus
Plamood Intra Bus
Womens College Intra Bus
Pattoor Intra Bus
General Hospital Intra Bus
Eanchakkal Intra Bus
Vanchiyoor Intra Bus
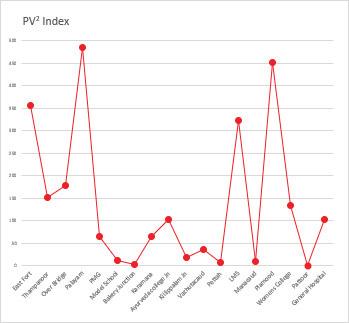
Fig. 75. - Pedestrian Vehicular conflict in city core
Core Area
Bus Stop Type
Sr no. Name Core/prox sub/ med_sub/suburb
Bus Stop Infrasructure
Inter/ Intra/ Inter+Intra
1 East Fort Core No Inter+Intra 2 Thampanoor Station Core Yes Regional Intrachange 5 Palayam Core No Intra Shelter Seating Bus Bay Maps+Signage
17052-53112
6564-10343
6564-10343
NMT Evaluation
Remarks IPT Stand/ Stopping Remarks
Pedstrian crossing is Unsafe.
FOB has limited usage
Chalai side has limited formal shelters and seating Stand
Pedstrian crossing is Unsafe.
Bus stop is located outside the station on the road
Limited public realm Stand
Pedestrian crossing is unsafe No
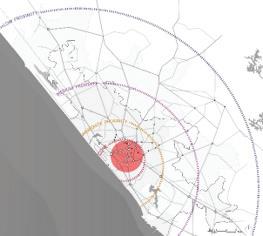
Not located close to the intra-city bus stop
Could be better organised
IPTs aprk in vcinity of the stop
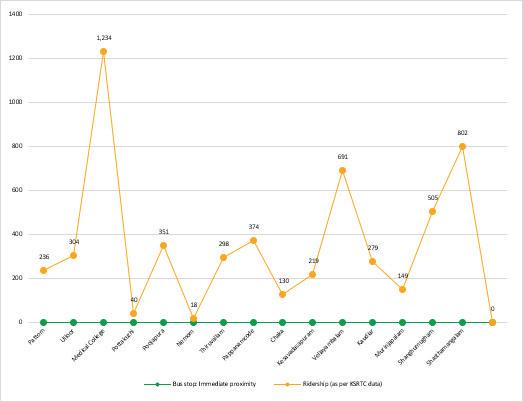
Fig. 77. - KSRTC bus ridership in the Immediate proximity area
Mode
Pattom Intra Bus
Ulloor Intra Bus
Medical College Intra Bus
Pottakuzhi Intra Bus
Poojapura Intra Bus
HLL Intra Bus
Nemom Intra Bus+ Train
Lulu mall/Kochuveli Intra Bus + Train
Pappanamcode Intra Bus
Chaka Intra Bus
Kesavadasapuram Intra Bus
Vellayambalam Intra Bus
Kaudiar Intra Bus
Murinjapalam Intra Bus
Shanghumugham Intra Bus
Fig. 79. - Pedestrian Vehicular conflict in immediate proximity area
Pedestrian Vehicular conflict
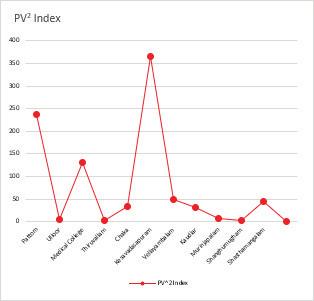
78. - Pedestrian Vehicular conflict in immediate proximity area
Bus Stop Type
Sr no. Name
7 Pattom
9 Medical College
Table. 9. Bus Stop type- Immediate Proximity
Bus Stop Infrasructure
Table. 10. Bus Stop Infrastructure- Immediate Proximity
Ridership
Table. 11. Ridership- Immediate Proximity
NMT Evaluation
Good/Fair/ Poor Remarks
Fair
Poor
Pedestrian crossing is unsafe
Bus stops away fropm shelter
Access to the off road bus stops is unsafe due to lack of crossings and signage
No
Yes
Fair No crossings near bus shelter No
Table. 12. : NMT Evaluation- Immediate Proximity
IPT both Taxi and Auto stands on the main road
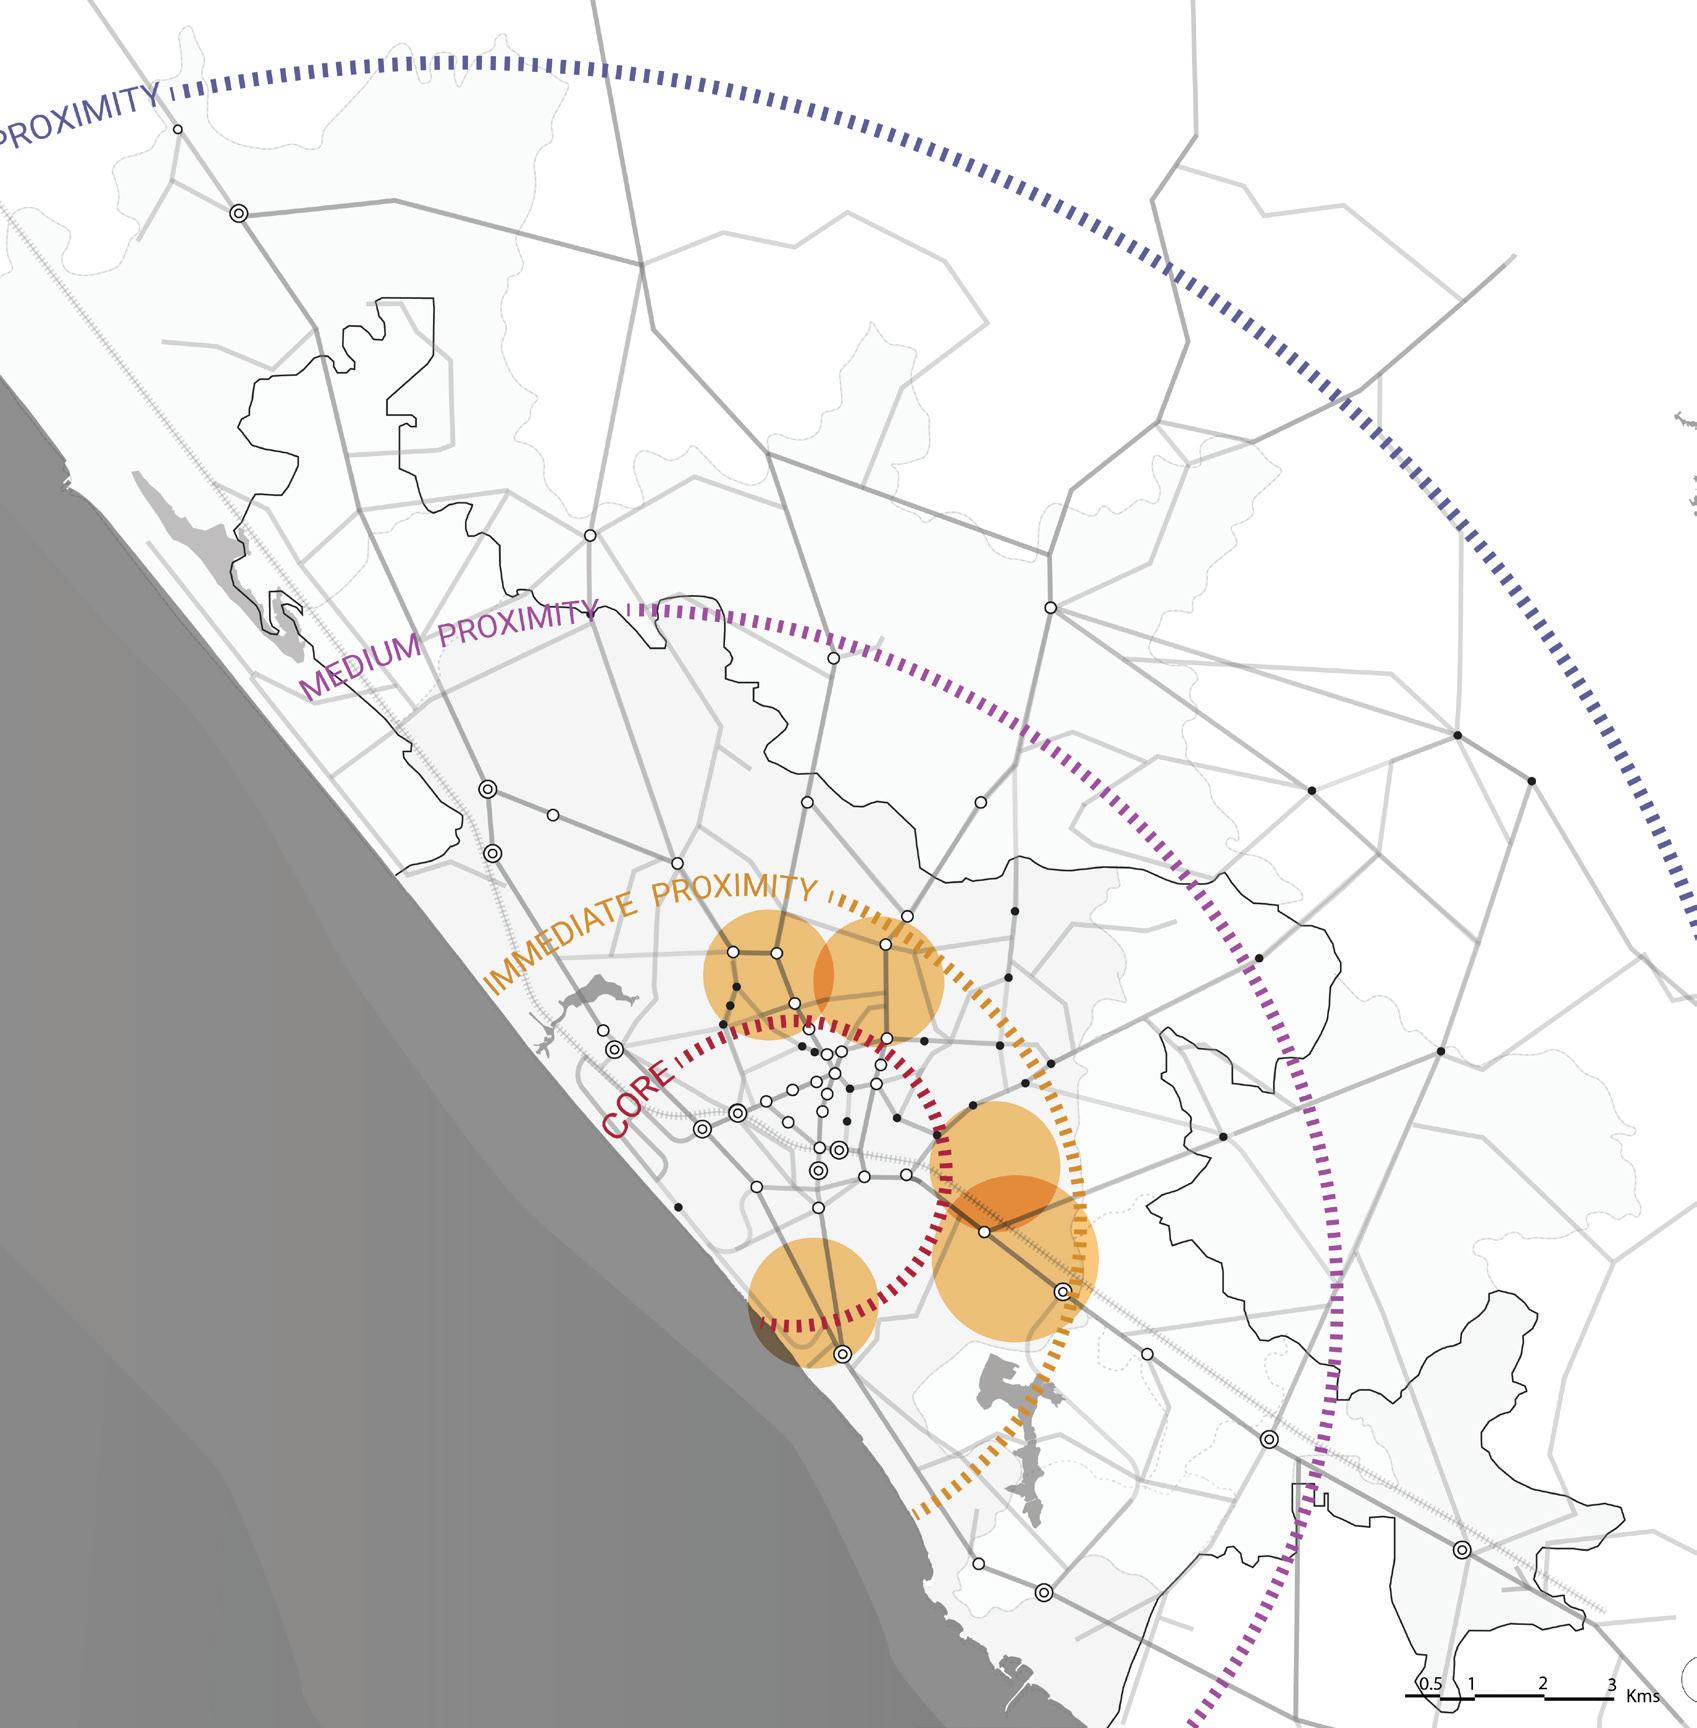
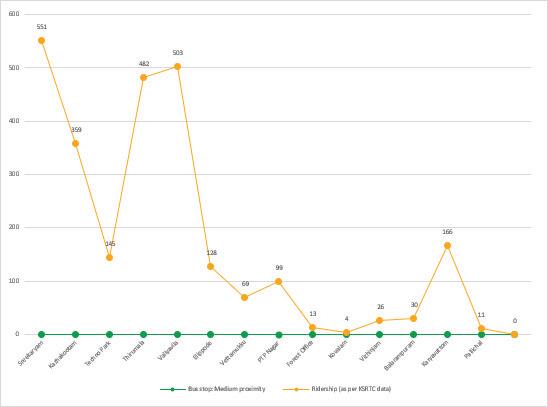
Fig. 81. KSRTC bus ridership in the medium proximity area
Mode
Sreekaryam Intra Bus
Kazhakootam Intra Bus+ Train
Techno Park Intra Bus
Thirumala Intra Bus
Valiyavila Intra Bus
Elipode Intra Bus
Vettamukku Intra Bus+ Train
PTP Nagar Intra Bus + Train
Forest Office Intra Bus
Kovalam Intra Bus
Vizhiniam Intra Bus
Balarampuram Intra Bus+ Train
Karyavottam Intra Bus
Pallichal Intra Bus
Table. 13. : KSRTC bus ridership in the medium proximity area
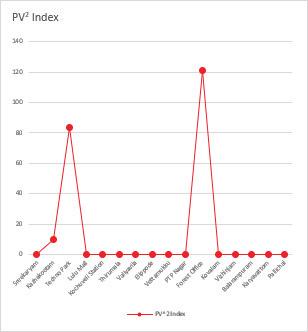
Medium Proximity Sub-Centres
Bus Stop Type
Sr
Bus Stop Infrasructure
Shelter Seating Bus Bay Maps+Signage
Table. 15. Bus Stop Infrastructure- Medium Proximity
Ridership
Table. 16. Ridership- Medium Proximity
NMT Evaluation
No footpath
Table. 17. : NMT Evaluation- Medium Proximity
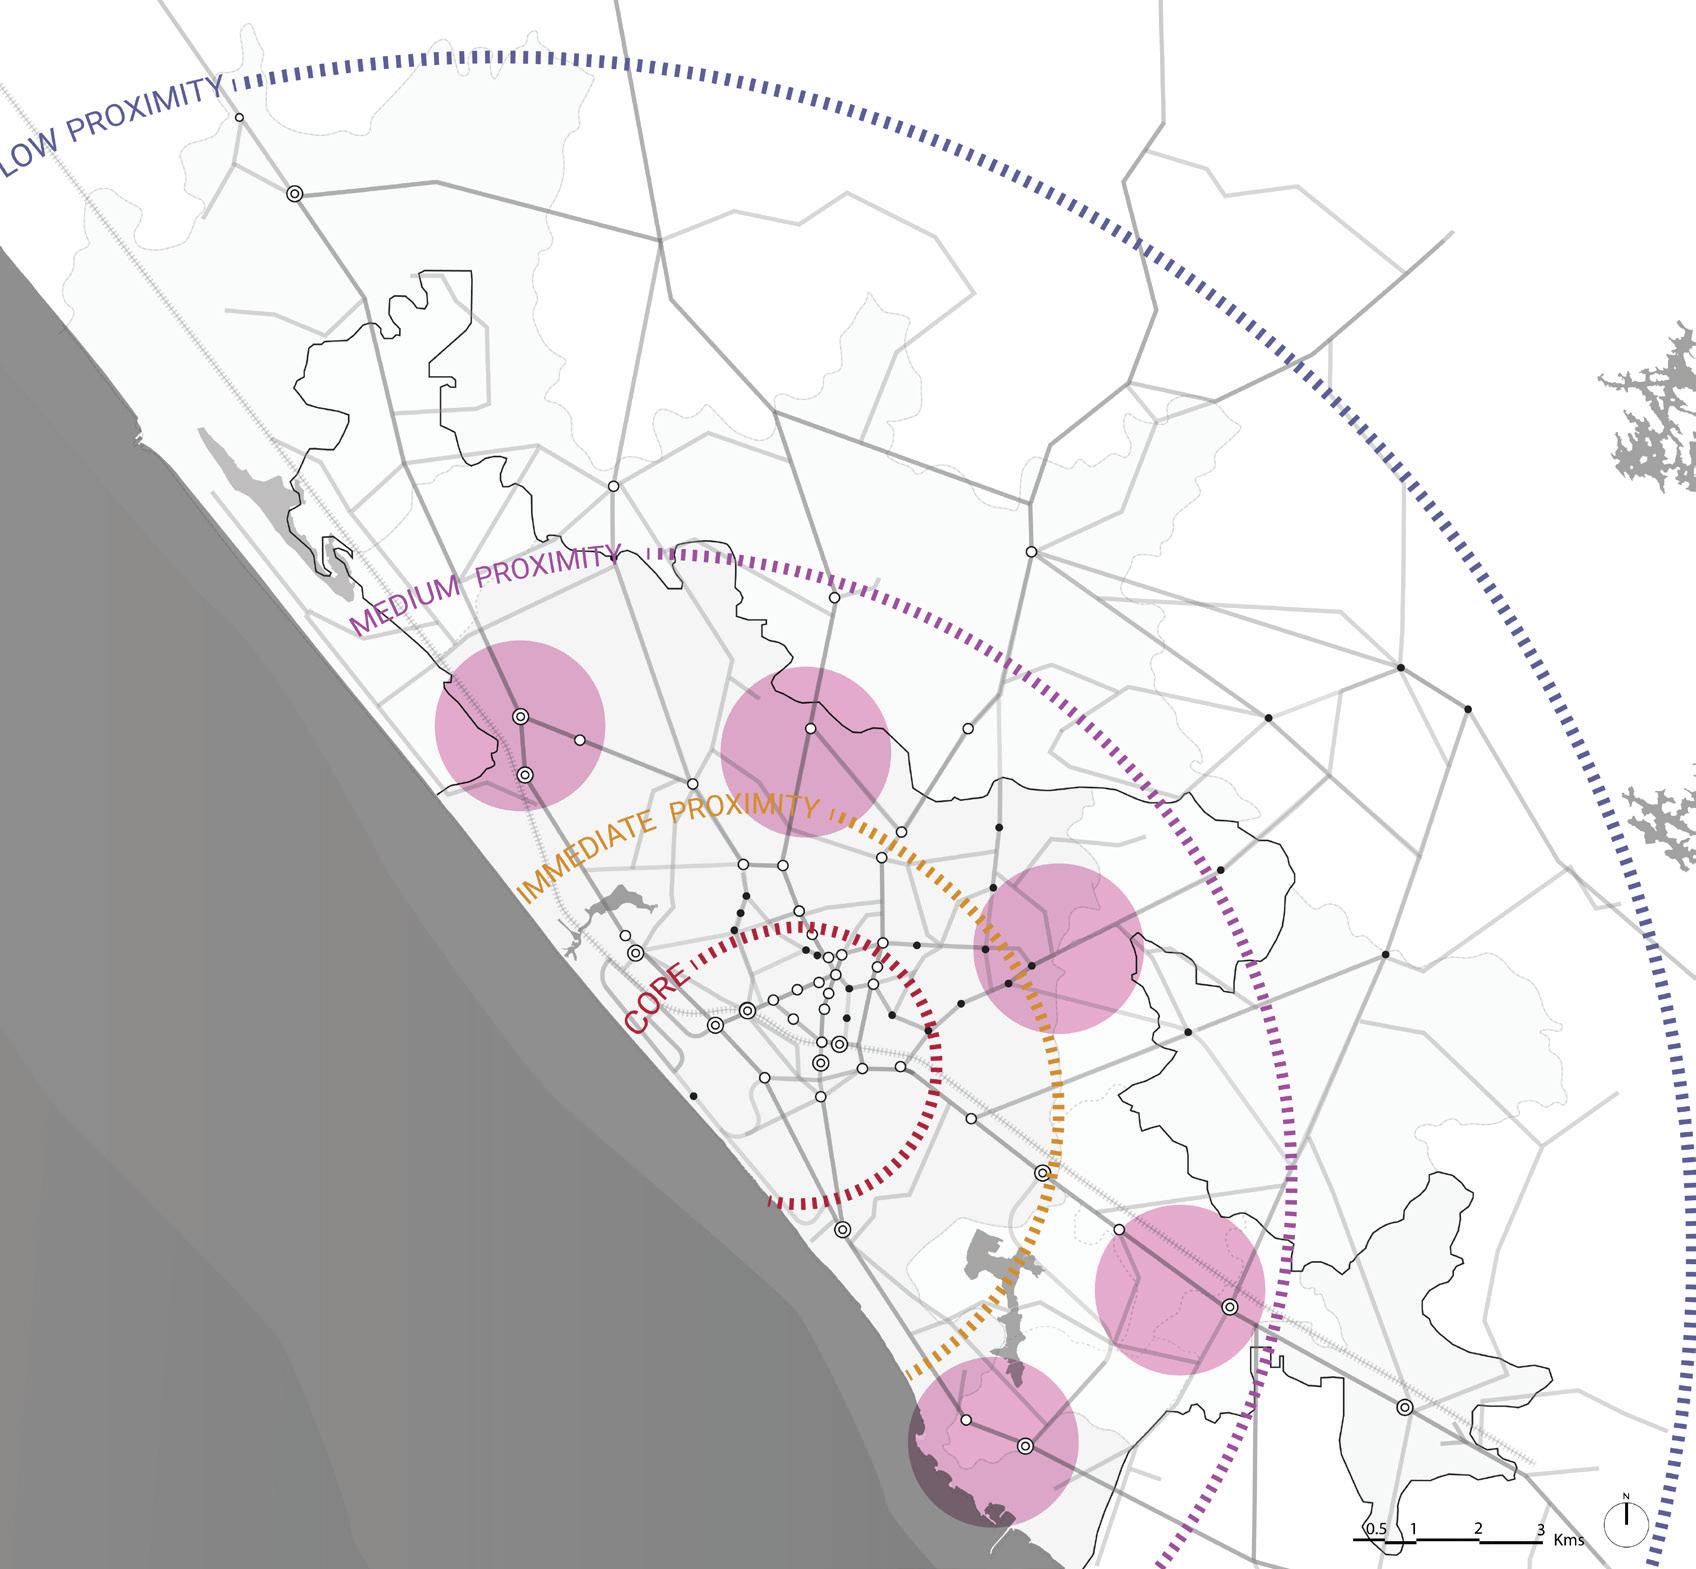
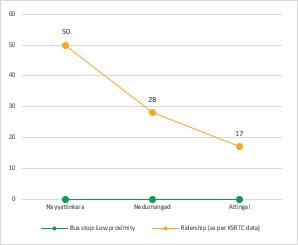
Nayyattinkara
Nedumangad Inter+Intra
Attingal Inter+Intra
Table. 18. : Mode and Bus Stop Type- Low Proximity
Bus Stop Infrasructure
Table. 19. Bus Stop type- Low Proximity Shelter Seating Bus Bay Maps+Signage
Table. 20. Bus Stop Infrastructure- Low Proximity
Table. 21. Ridership- Low Proximity
NMT Evaluation
Good/Fair/ Poor Remarks
Fair
Poor No footpath or appropriate crossings
Fair
Crossings provided with no footpath, over SWD in few places
Table. 22. : NMT Evaluation- Low Proximity
On main road
both Taxi and Auto stands at the junction
both Taxi and Auto on the side roads
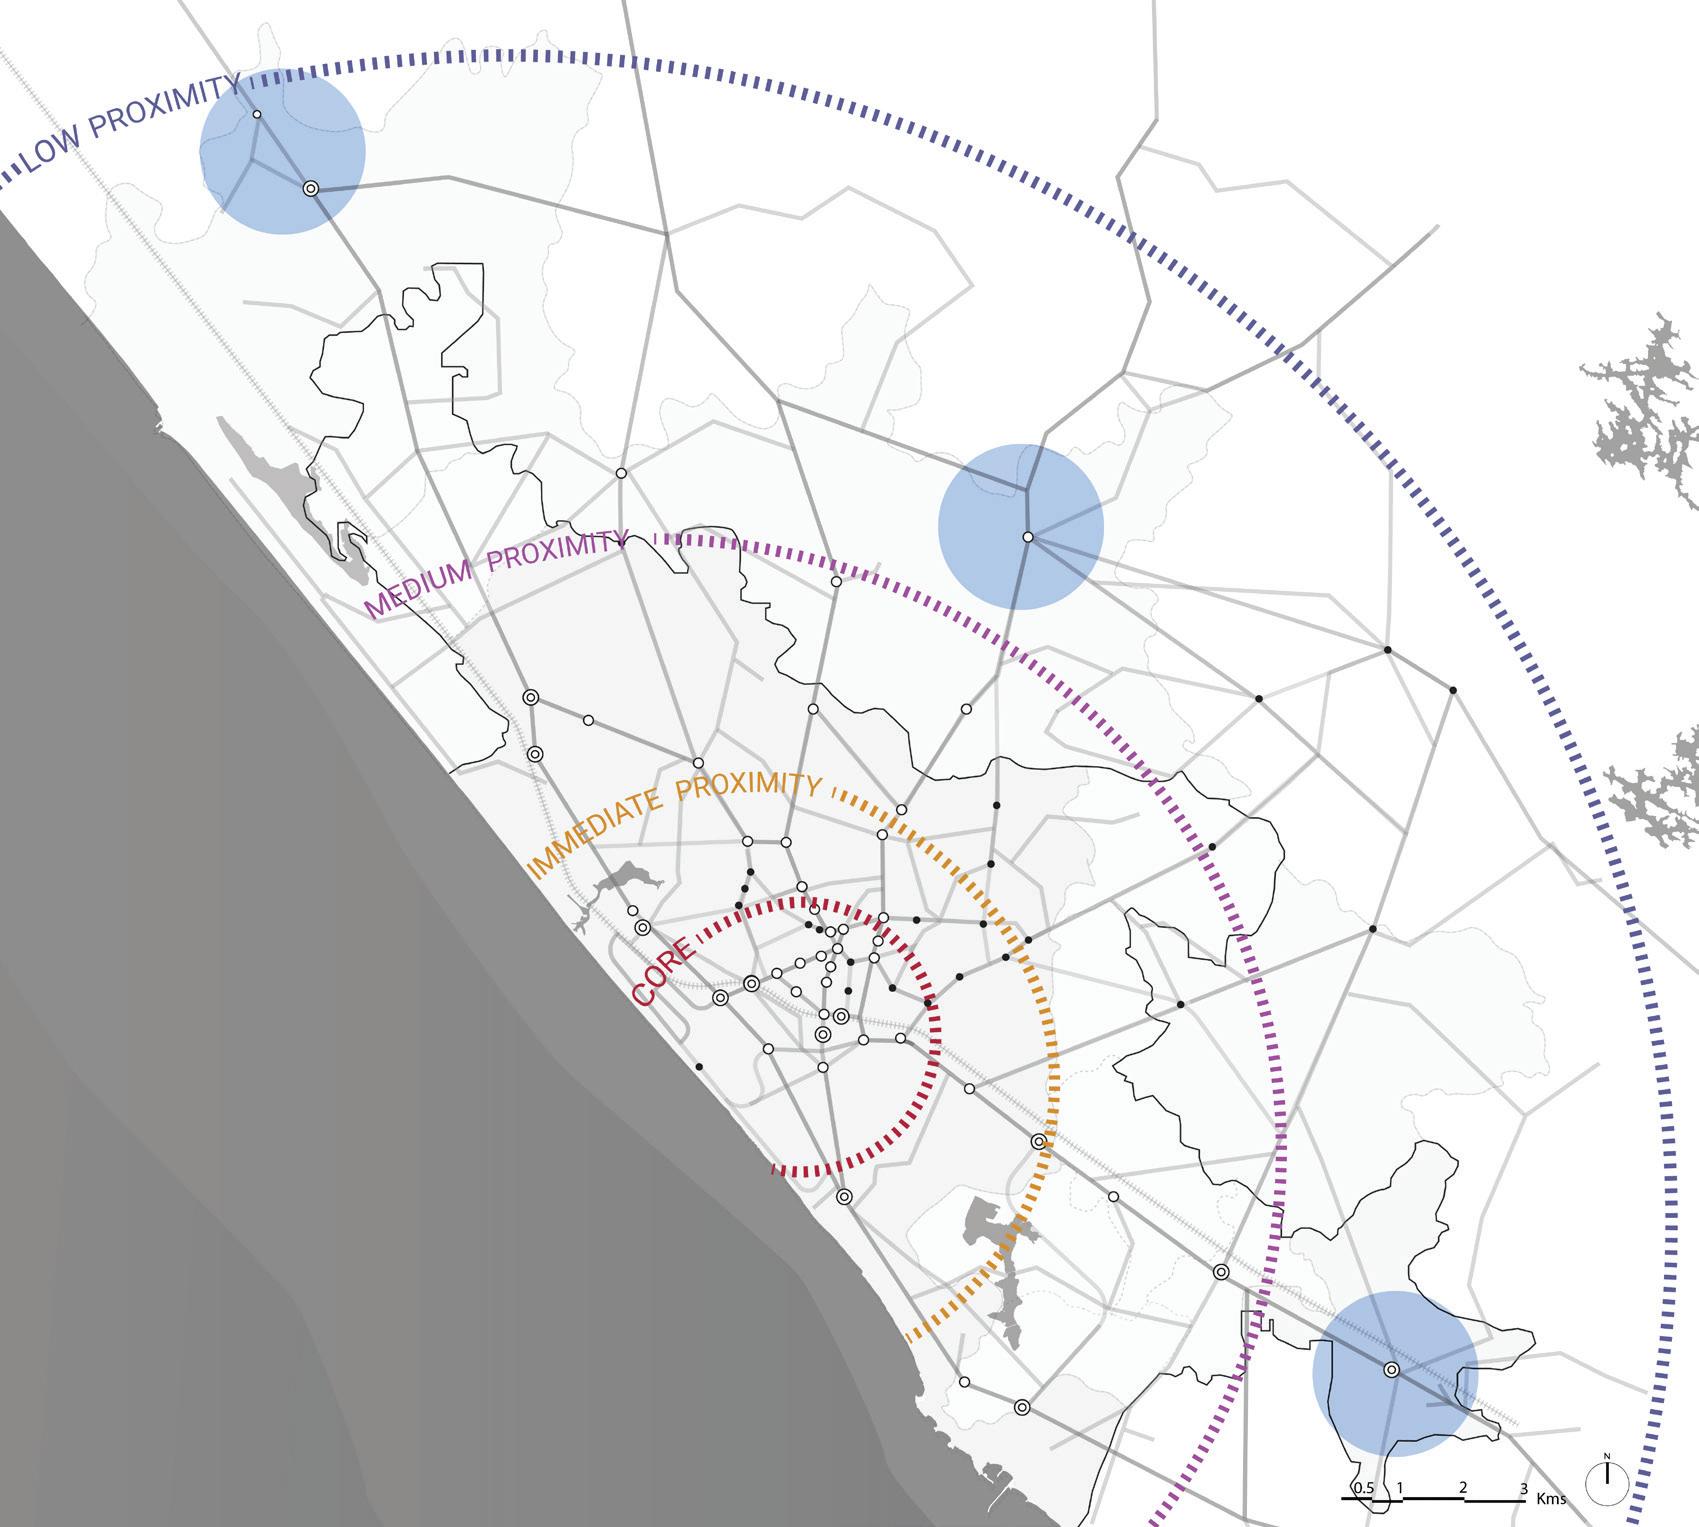
II
I Climate-Resilient & Compact Urban Growth
0.63
1
Resilient urban growth –Urban growth strategies explicitly integrate resilience principles by prioritizing the optimisation of existing urban land and infrastructure, discouraging unsustainable outward expansion, and safeguarding continuity of water bodies, ecological systems, and natural corridors.
Policy intent and evidence of contained growth
0.6
2 Integration of Mobility with City Planning – alignment of the city’s statutory Master Plan or Development Plan with its public transport, street design, and mobility strategies, ensuring that land use allocations and transport investments are mutually reinforcing to promote sustainable, compact, and climate-resilient urban growth.
3 Service Proximity – share of populated areas that has essential services such as schools, markets and healthcare within 15 min walking distance (1km).
4 Street Network Structure & Connectivity – presence of a coherent street hierarchy (arterial, sub-arterial, collector, and local streets) and interconnected street patterns that enable walkable block sizes (generally <2 ha) and adequate penetration of bus routes into local and collector streets, ensuring permeability and efficient network function.
5 Disaster Risk Management – alignment of mobility infrastructure planning with the city’s disaster management framework, ensuring flood resilience, heat resilience, and emergency access routes are factored into transport investments.
6 Climate Mitigation – extent to which the city has measured, monitored, and adopted targets for transport-related greenhouse gas emissions reductions, including policies for EV adoption, modal shift, and carbon neutrality.
1 Network Coverage – percentage of city population covered by public transport services, defined as those living within 500m of a functional bus stop or 1km of a metro/rail/BRT station, and/or percentage of wards/planning units with >80% coverage, to assess spatial coverage of public and shared transport services.
2 Service Frequency & Reliability – availability of adequate bus fleets, average operational headway and on-time performance of bus and metro services, assessing whether services are frequent and reliable enough to attract sustained ridership.
Optimised urban land use- TOD, landpooling/TDR, mixed use zoning in Master Plan 2040 & CMP -Final Report 2023
Compact growth around transit corridors- no policy
Sponge city concept for continuity of natural system and water bodies
Water bodies (Karamana, Killi rivers, Edayar backwater, Pattom Canal and other canals)- buffer zones
Transit-Oriented Development (TOD) and Growth corridors along the NH and bypass, mobility hub proposals, and mixed-use zoning around major corridors direct future growth toward transit-served areas.
Coverage (%) 4 Resilient neighbourhoods will provide the needs of daily living, within walking distance (1/2 to 1 km radius)
Inner city wards (CBD, mixed-use cores) show good proximate access to schools/markets/healthcare, peripheral wards show lower access.
Composite (policy presence + % coverage indicators)
3 Core city areas have a fine-grain street network with better walkable permeability, while several peripheral and residential belts still have weaker local street connectivity. Bus penetration is stronger along main corridors but remains limited in low-density neighbourhoods.
Policy/coverage 3 Kerala, Thiruvananthapuram DDMP and CDMP identify flood hazard zones, Other projects include improved drainage and resilience works on key corridors
Policy/coverage 3 CMP for Thiruvananthapuram outline transport emissions reduction, modal shift, PT accessibility as core objectives.
Public transport expanded a fleet of electric buses under the Smart City initiative.
Kerala EV policy (state-level) supports EV adoption, charging infrastructure, and incentives that indirectly benefit Thiruvananthapuram’s transport decarbonisation.
Population with access to PT (Public Transport): 7 lakh
• Total population (2023): 16.27 lakh
• CMP data suggest about half the population has reasonable access to bus stops (inner wards), while peripheral wards have lower access. No rapid transit yet, metro in planning stage.
Service performance
3 Real-Time Service Integration – Percentage of PT fleet linked to RTPI (≤30 sec refresh) and percentage stations with arrival displays or apps; combined with extent of fare/service integration (NCMC, capping, journey planners) and user feedback on reliability. Integration presence
bus fleet, 2023- 479
The headway of bus routes varies from 5mins to 15 mins during the peak hours and 15mins to 45 mins during the off peak hours.
No fully integrated real-time platform or integrated ticketing across operator citywide.
Initiative by KSRTC to implement PIS inside all the buses, all terminals and bus stops.
4 Affordability – affordability of public transport services measured by the average cost of a single trip by mode and monthly pass as a percentage of the average household income of the bottom 40% of households, ensuring equity in access. Affordability ratio 4 Bus fares in the city are generally affordable. Min fare Rs 10
5 Gender & Safety – availability of gender-sensitive services and safety measures, including percentage of transit hubs with clean, functional women’s toilets, adequate lighting, CCTV-surveillance for safety; perception of safety during off-peak (survey-based); adequate grievance redressal mechanisms, and staff training. Policy presence/ coverage
6 Physical Integration – percentage of major transit stations (bus terminals, metro stations, rail stations) that have been designed and implemented with multimodal access planning, including walking, cycling, IPT, feeder buses, and parking integration. Coverage (%)
Some safety infrastructure exists -new smart bus shelters with CCTV and lighting on select corridors.
CMP proposes multimodal hubs (e.g., near Central Station, Technopark), and bus rail interfaces exist at major stops. Implementation is limited, and many proposed interchanges remain planning or proposal stage.
III Active Mobility (Walking & Cycling)
0.47
V Climate & Environmental Sustainability
0.48
7 Commuter Responsive Planning – existence and effectiveness of institutionalised processes (e.g., service planning cells, route review committees) to regularly review and rationalise bus routes and schedules based on ridership data, passenger feedback, equity/access needs, and operational performance, ensuring bus services evolve to match changing demand patterns without relying on demand forecasting models.
1 Continuity & Connectivity of Active Mobility networks - estimated percentage of arterial corridors that have continuous (min 2m wide) footpaths and/or cycle lanes for a length of 1km or more.
2 Universal Access - guidelines or mandates published by road owning agencies that are being implemented to improve barrier-free movement across public streets for benefit of all users including children, senior citizens, differently-abled, etc.
3 Personal security - eyes on the street as well as street lighting coverage across the city measured through data sampling in the absence of detailed studies
Policy/Process presence
VI Parking & Travel Demand Management
0.3
2 Alternative Mobility – Availability of affordable and reliable IPT services that are safe for women and children and easily available directly or through apps specially for trips complementing public transport, such as short trips or feeder trips.
3 Street Vendors & Informal Use Policy – Existence and implementation of citywide policies to regulate and integrate street vending and informal economic activities around transit hubs, streets, and markets, ensuring coexistence with pedestrian and NMT flows, with designated vending zones and enforcement mechanisms.
4 Accessibility for Differently Abled (% compliant fleet/stations) – Percentage of public transport vehicles and stations equipped with universal accessibility features such as low-floor buses, ramps, lifts, tactile paving, auditory signals, and priority seating, aligned with harmonised accessibility standards.
1 Low-Emission Public Fleet Share – Share of the public transport and municipal fleet that operates on low-emission technologies (e-buses, CNG, electric rickshaws, hybrids) as a percentage of the total fleet, reflecting the city’s commitment to air quality and carbon reduction.
2 Renewable Integration (% depots, stations with green power) – Percentage of depots, stations, and terminals powered partially or fully by renewable energy sources (e.g., rooftop solar, solar carports, storage-integrated systems), supporting clean operations of transport assets.
3 Air Quality Integration – extent to which mobility plans and interventions address air pollution by prioritising clean modes in CPCB/SPCB-identified hotspot areas, incorporating low-emission zones, pedestrianisation, and vehicular restrictions.
4 Emission Compliance & Congestion – Percentage of freight/passenger vehicles that are BS VI compliant; combined with average peak-hour speed / V-C ratio on major arterial/ trunk corridors.
5 Resilient Infrastructure – Percentage of transport corridors, depots, and terminals that have been designed or retrofitted to withstand climate shocks such as flooding, heat waves, and storms, including raised platforms, pumping systems, and climate-resilient materials.
1 Parking Policy (existence, demand-based pricing) – Existence and enforcement of demand-based parking management strategies, including dynamic pricing, supply regulation, digital enforcement, and integration with sustainable transport objectives to discourage excessive private vehicle use.
3 Bus stop provisioning and route extensions are largely driven by operator proposals and public representations, a formal, data-driven and transparent process for route planning and optimisation is not clearly established
Coverage (%) 2 About 14.2% of the major road network has footpath availability, and only ~5% has >2 m wide footpaths, indicating very limited continuous walking infrastructure
Programme existence/coverage
2 There is no evidence of a dedicated, implemented universal access programme citywide. Footpaths are often encroached, poorly maintained, or unavailable, and barrier-free continuity (ramps, tactile paving) is not systematically provided. Public reports specifically highlight widespread footpath encroachment and poor pedestrian experience.
Coverage (%) 3 < 25% of city area covered with street lighting.
Street lighting and safer pedestrian amenities on selected corridors, but coverage is uneven and insufficient citywide. Many pedestrian areas remain poorly lit and unprotected.
vs PT access in CMP
Availability 3 Autos, e-autos, taxis — are readily available throughout the city and provide crucial first and last-mile connectivity. But operations are largely informal and not integrated with PT planning.
Policy presence 2 Corporation has initiated regulation under the Street Vendors Act, 2014, including formation of a Town Vending Committee (TVC) and a draft plan proposing -122 vending zones with vending/restricted/no-vending classifications and space limits (30–35 sq ft). Vendor listing and ID issuance have begun in select areas (e.g., Shanghumugham Beach), but citywide implementation remains partial.
Coverage (%) 2 Transport policy and state concessions for persons with disabilities exist (travel concessions extended even to private buses).
Accessibility in buses (wheelchair ramps and secure spaces) and stations is inconsistent and not comprehensively implemented. Universal accessibility standards are yet to be mainstreamed across fleets/stops. KSRTC has limited fleet of low floor buses
Fleet share (%) 2 Thiruvananthapuram has significantly increased its electric bus fleet under the Smart City project, 163 e-buses operating city routes.
E-rickshaws allowed to ply in the core
Coverage (%) 2 Smart city has initiated solar powered smart bus shelters
Policy/coverage 2 Air quality monitoring exists but is not systematically integrated into mobility planning decisions.
Performance 3 Vehicle emission regulations are enforced, but congestion remains significant on major urban corridors.
Coverage (%) 3 Recent infrastructure projects increasingly consider climate resilience and drainage improvements.
Policy presence/ coverage
2 CMP proposes pricing tables and recommends a detailed Parking Policy; implementation pending
Governance, Financing & Monitoring 0.47
2 Private Vehicle Restraint (congestion pricing, levies) – Adoption of fiscal or regulatory instruments such as congestion charges, low-emission zones, or workplace parking levies that disincentivise private vehicle travel, integrated with public transport and NMT improvement measures.
1 Institutional Framework (UMTA/SPV existence) – Existence of an empowered Unified Metropolitan Transport Authority (UMTA) or Special Purpose Vehicle (SPV) with statutory powers, financial autonomy, and mandate to coordinate multi-agency transport planning and operations.
2 Funding & O&M Mechanisms (dedicated revenue streams) – Presence of sustainable financial mechanisms such as dedicated state/municipal funds, transport cess, advertising revenue, or green bonds to ensure long-term operation and maintenance of public transport and NMT systems.
3 Land Value Capture/TOD-based financing – Use of land-based instruments such as betterment levies, impact fees, sale of premium FSI, or monetisation of transit-adjacent land parcels to finance mobility projects, integrated into TOD policies and development control regulations.
4 Monitoring & Data (mobility dashboard, KPIs) – Existence of a citywide transport monitoring framework, including a digital mobility dashboard that tracks key performance indicators such as ridership, service reliability, emissions, and safety, updated in real-time or periodically.
5 Institutional and Stakeholder Coordination – Existence of institutionalised forums meeting ≥2 times/year with citizen groups and PT agencies; Overall numbers of workshops and working groups.
6 Capacity Building - The staff has sufficient knowledge on Transport related planning for effectively plan, operate and manage their work
1 Fatalities & Serious Injuries (per 100k population) – Annual number of road traffic fatalities and serious injuries per 100,000 population, disaggregated by mode and user group, serving as a primary outcome indicator for road safety performance.
2 Black Spot Management (% treated) – Percentage of officially identified road crash black spots that have been mitigated through infrastructure redesign, signage, enforcement, or other safety measures within a defined period.
3 School & Child Safety (% schools with Safe Access Plans) – Percentage of schools in the city that have prepared and implemented Safe Access to School Plans, including traffic calming, crossing guards, school zones, and pedestrian infrastructure improvements.
1 Policy & Regulatory Readiness (data-sharing, payments) – Presence of enabling policies and regulations that mandate open data standards, interoperability across operators, and secure digital payments, ensuring MaaS and ITS adoption at scale.
2 Digital System Integration (unified platform availability & adoption) – Existence and adoption of a unified MaaS platform that integrates multiple modes for trip planning, booking, payment, and customer feedback, supported by real-time data and fare capping.
3 Data Infrastructure & Availability (open APIs, GTFS feeds) – Proportion of transport operators (public and private) providing open and standardised datasets (e.g., GTFS, GTFS-Realtime, APIs) that allow third parties and MaaS platforms to access real-time operational data.
4 Digital Travel Behavior (% users using digital tools weekly) – Percentage of public transport riders or city residents who use digital tools (apps, smart cards, online payment systems) for trip planning, ticketing, or travel at least once a week, indicating behavioral adoption.
Policy presence/ coverage 1 No congestion pricing, LEZs, or parking levies notified
Policy presence 2 Kerala Metropolitan Transport Authority (KMTA) has been constituted under the Kerala Metropolitan Transport Authority Act, 2019, with jurisdiction covering notified metropolitan areas including Thiruvananthapuram. However, unlike Kochi, no city-specific UMTA/SPV has been operationalised for Thiruvananthapuram to coordinate multi-agency transport planning and operations.
Finance mechanism presence
Finance mechanism presence
Monitoring presence
3 Partial mechanisms, CMP List financing option
1 Implement land value capture as a financing mechanism for upgrading infrastructure. But not implemented just proposed.
2 Does not have a citywide integrated mobility monitoring system or dashboard tracking KPIs. Data collection is agency-specific (KSRTC operations data).
Process/ Outcome 3 Inter-agency coordination are undertaken during CMP preparation, Smart City project implementation.
However, these engagements are project-driven and no institutionalised, permanent forum exists for regular coordination with citizen groups and transport agencies.
Coverage (%) 3 Black spots have been identified and treated through state road-safety initiatives
Coverage (%) 2 Safe Routes to School (SRTS) is an approach that promotes walking and bicycling to school through infrastructure improvements, enforcement, tools, safety education, and incentives to encourage walking and bicycling to school. The pilot areas identified are Kaniyapuram and Pallipuram areas, Indiraji Nagar, Karyavattom and Kurrisadi Areas, Tilak Nagar and Mayuram areas and Pavithra Nagar Area. It is recommended to take up pilot projects for SRTS in these areas in light with the consideration and elements suggested above.
Policy presence 2 CMP references digital systems, but no city-specific open data / MaaS mandate exists.
Platform existence & adoption 2 Multiple apps/platforms (Chalo, Yatri), but not a single unified MaaS with full fare capping across modes
Coverage (%) 2 No public GTFS/Realtime APIs or open datasets by city PT operators or private modes identified, data sharing fragmented.
User adoption (%)
3 Introduction of journey planner mobile application 'Chalo' in 2018