


Published by the Deutsche Gesellschaft für Internationale Zusammenarbeit (GIZ) GmbH
Registered offices
Bonn and Eschborn, Germany
B-5/2, Safdarjung Enclave
New Delhi-110029, India
T 011-49495353
F 011-49495391
E giz-indien@giz.de
As at June 2026, New Delhi
Prepared under Sustainable Urban Mobility – Air Quality, Climate Action and Accessibility (SUM-ACA)
Commissioned by
Federal Ministry for Economic Cooperation and Development (BMZ), Germany
Political Partner
Ministry of Housing and Urban Affairs (MoHUA), Government of India
Implementation Partners
Rourkela Development Authority
Rourkela Municipal Corporation
Capital Region Urban Transport (CRUT)
Rourkela Smart City Limited
Responsible
Manjunath Sekhar, Project Director, SUM-ACA
Project Coordinator
Rana Anwar Amani, Technical Advisor, SUM-ACA
Project Team

GFA Consulting Group GmbH: Zohra Mutabanna, Team Lead; Astha Malhotra, Technical Expert;
SGArchitects: Sandeep Gandhi, Principal, Inderjeet Kaur, Transport Planner, Prabhnoor Singh, Transport Planner, Sruti Debnath, Architect- Urban Planner, Nayanthara Sekhar, Jr. Urban Planner
Design and Layout
Studio POD
Photo and Map Credits
GIZ;GFA
Citation
GIZ (2026). Integrated Mobility Plan for Rourkela. SUM-ACA. New Delhi, India.
Disclaimer
Any maps used in the document are for informational purposes only and do not constitute recognition of international boundaries or regions; GIZ makes no claims concerning the validity, accuracy or completeness of the maps nor assumes any liability resulting from the use of the information therein.
Copyright All rights reserved
On behalf of the German Federal Ministry for Economic Cooperation and Development (BMZ)

Manjunath Sekhar Project Director, SUM-ACA GIZ
Urban mobility plays a critical role in shaping economic efficiency, environmental sustainability, and overall quality of life in cities. As an important industrial and educational centre with a planned urban structure and strong walking and cycling culture, Rourkela is witnessing evolving mobility needs driven by urban growth and changing travel patterns.
The Integrated Mobility Plan (IMP) for Rourkela provides a comprehensive and action-oriented roadmap for transforming the city’s transport system. It moves deliberately away from piecemeal interventions, bringing coherence to existing policies, ongoing initiatives, and future proposals alike, all anchored around the goals of inclusion, safety, and climate resilience. The IMP provides a unified roadmap that aligns infrastructure development, mobility services, policy direction, and institutional coordination to support sustainable urban mobility in the city.
Prepared under the Sustainable Urban Mobility – Air Quality, Climate Action and Accessibility (SUM-ACA) project, as part of the Indo-German Green Urban Mobility Partnership, the plan aligns with national priorities on sustainable urban transport and supports broader goals related to climate action, accessibility, and improved public health outcomes.
The preparation of the IMP has followed a structured and evidence-based approach involving mobility assessments, review of existing plans and policies, field observations, identification of system-level gaps, and extensive stakeholder consultations. Engagement with the Housing and Urban Development Department (HUDD), Rourkela Municipal Corporation (RMC), Capital Region Urban Transport (CRUT), Smart City Limited, planners, engineers, and local stakeholder, and other agencies has ensured that the plan reflects local priorities and institutional requirements. The plan builds upon Rourkela’s strengths while addressing challenges related to public transport accessibility, road safety, parking management, multimodal integration, and pedestrian and cycling infrastructure.
The plan follows a clear result-driven approach, translating mobility challenges into prioritised interventions across immediate, short-term, and long-term horizons. As a dynamic planning tool, the IMP supports coordinated implementation and continuous improvement, providing a roadmap towards a more liveable, equitable, resilient, and people centred mobility future for Rourkela.
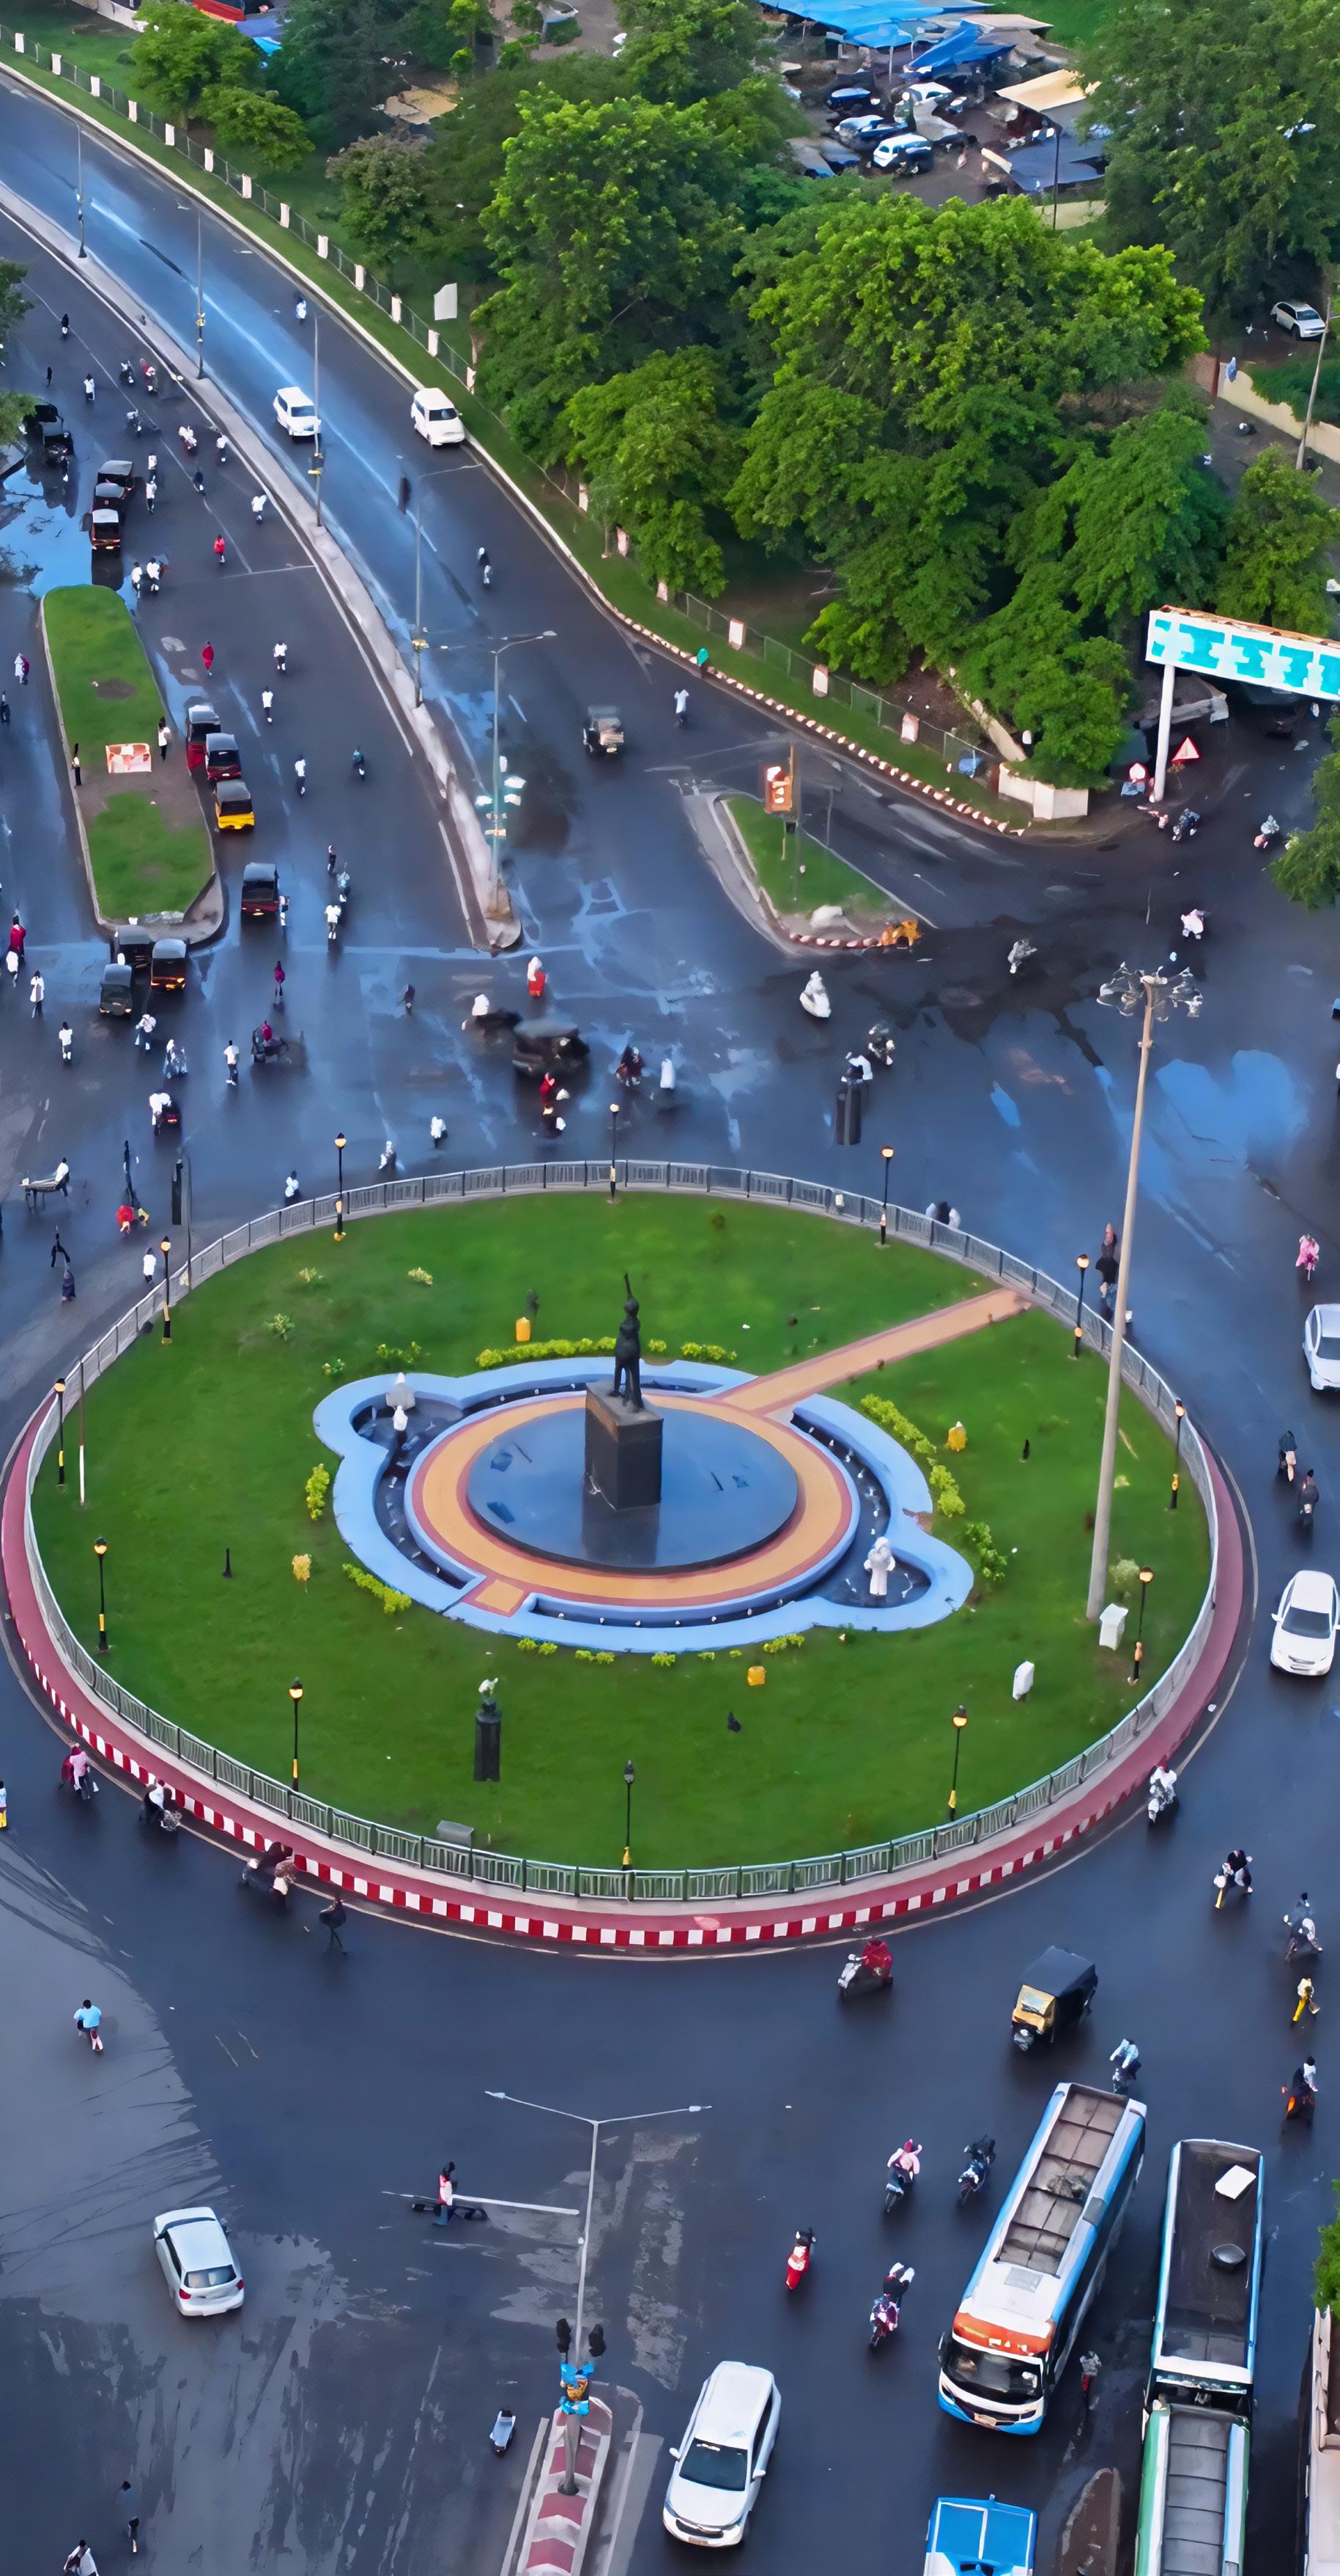
“Transforming Rourkela into a compact, accessible, and future-ready city where mobility networks seamlessly connect industries, neighbourhoods, and public spaces through safe, efficient & sustainable transport systems.”
The Integrated Mobility Plan (IMP) for Rourkela presents a strategic roadmap to protect the city’s strong non-motorised mobility culture while addressing emerging pressures from motorisation, congestion, safety risks, and fragmented transport planning. Prepared under the Sustainable Urban Mobility – Air Quality, Climate Action and Accessibility (SUM-ACA) initiative, the report combines policy review, field surveys, stakeholder consultations, and a nine-pillar assessment framework to identify priority mobility challenges and define actionable interventions for the city
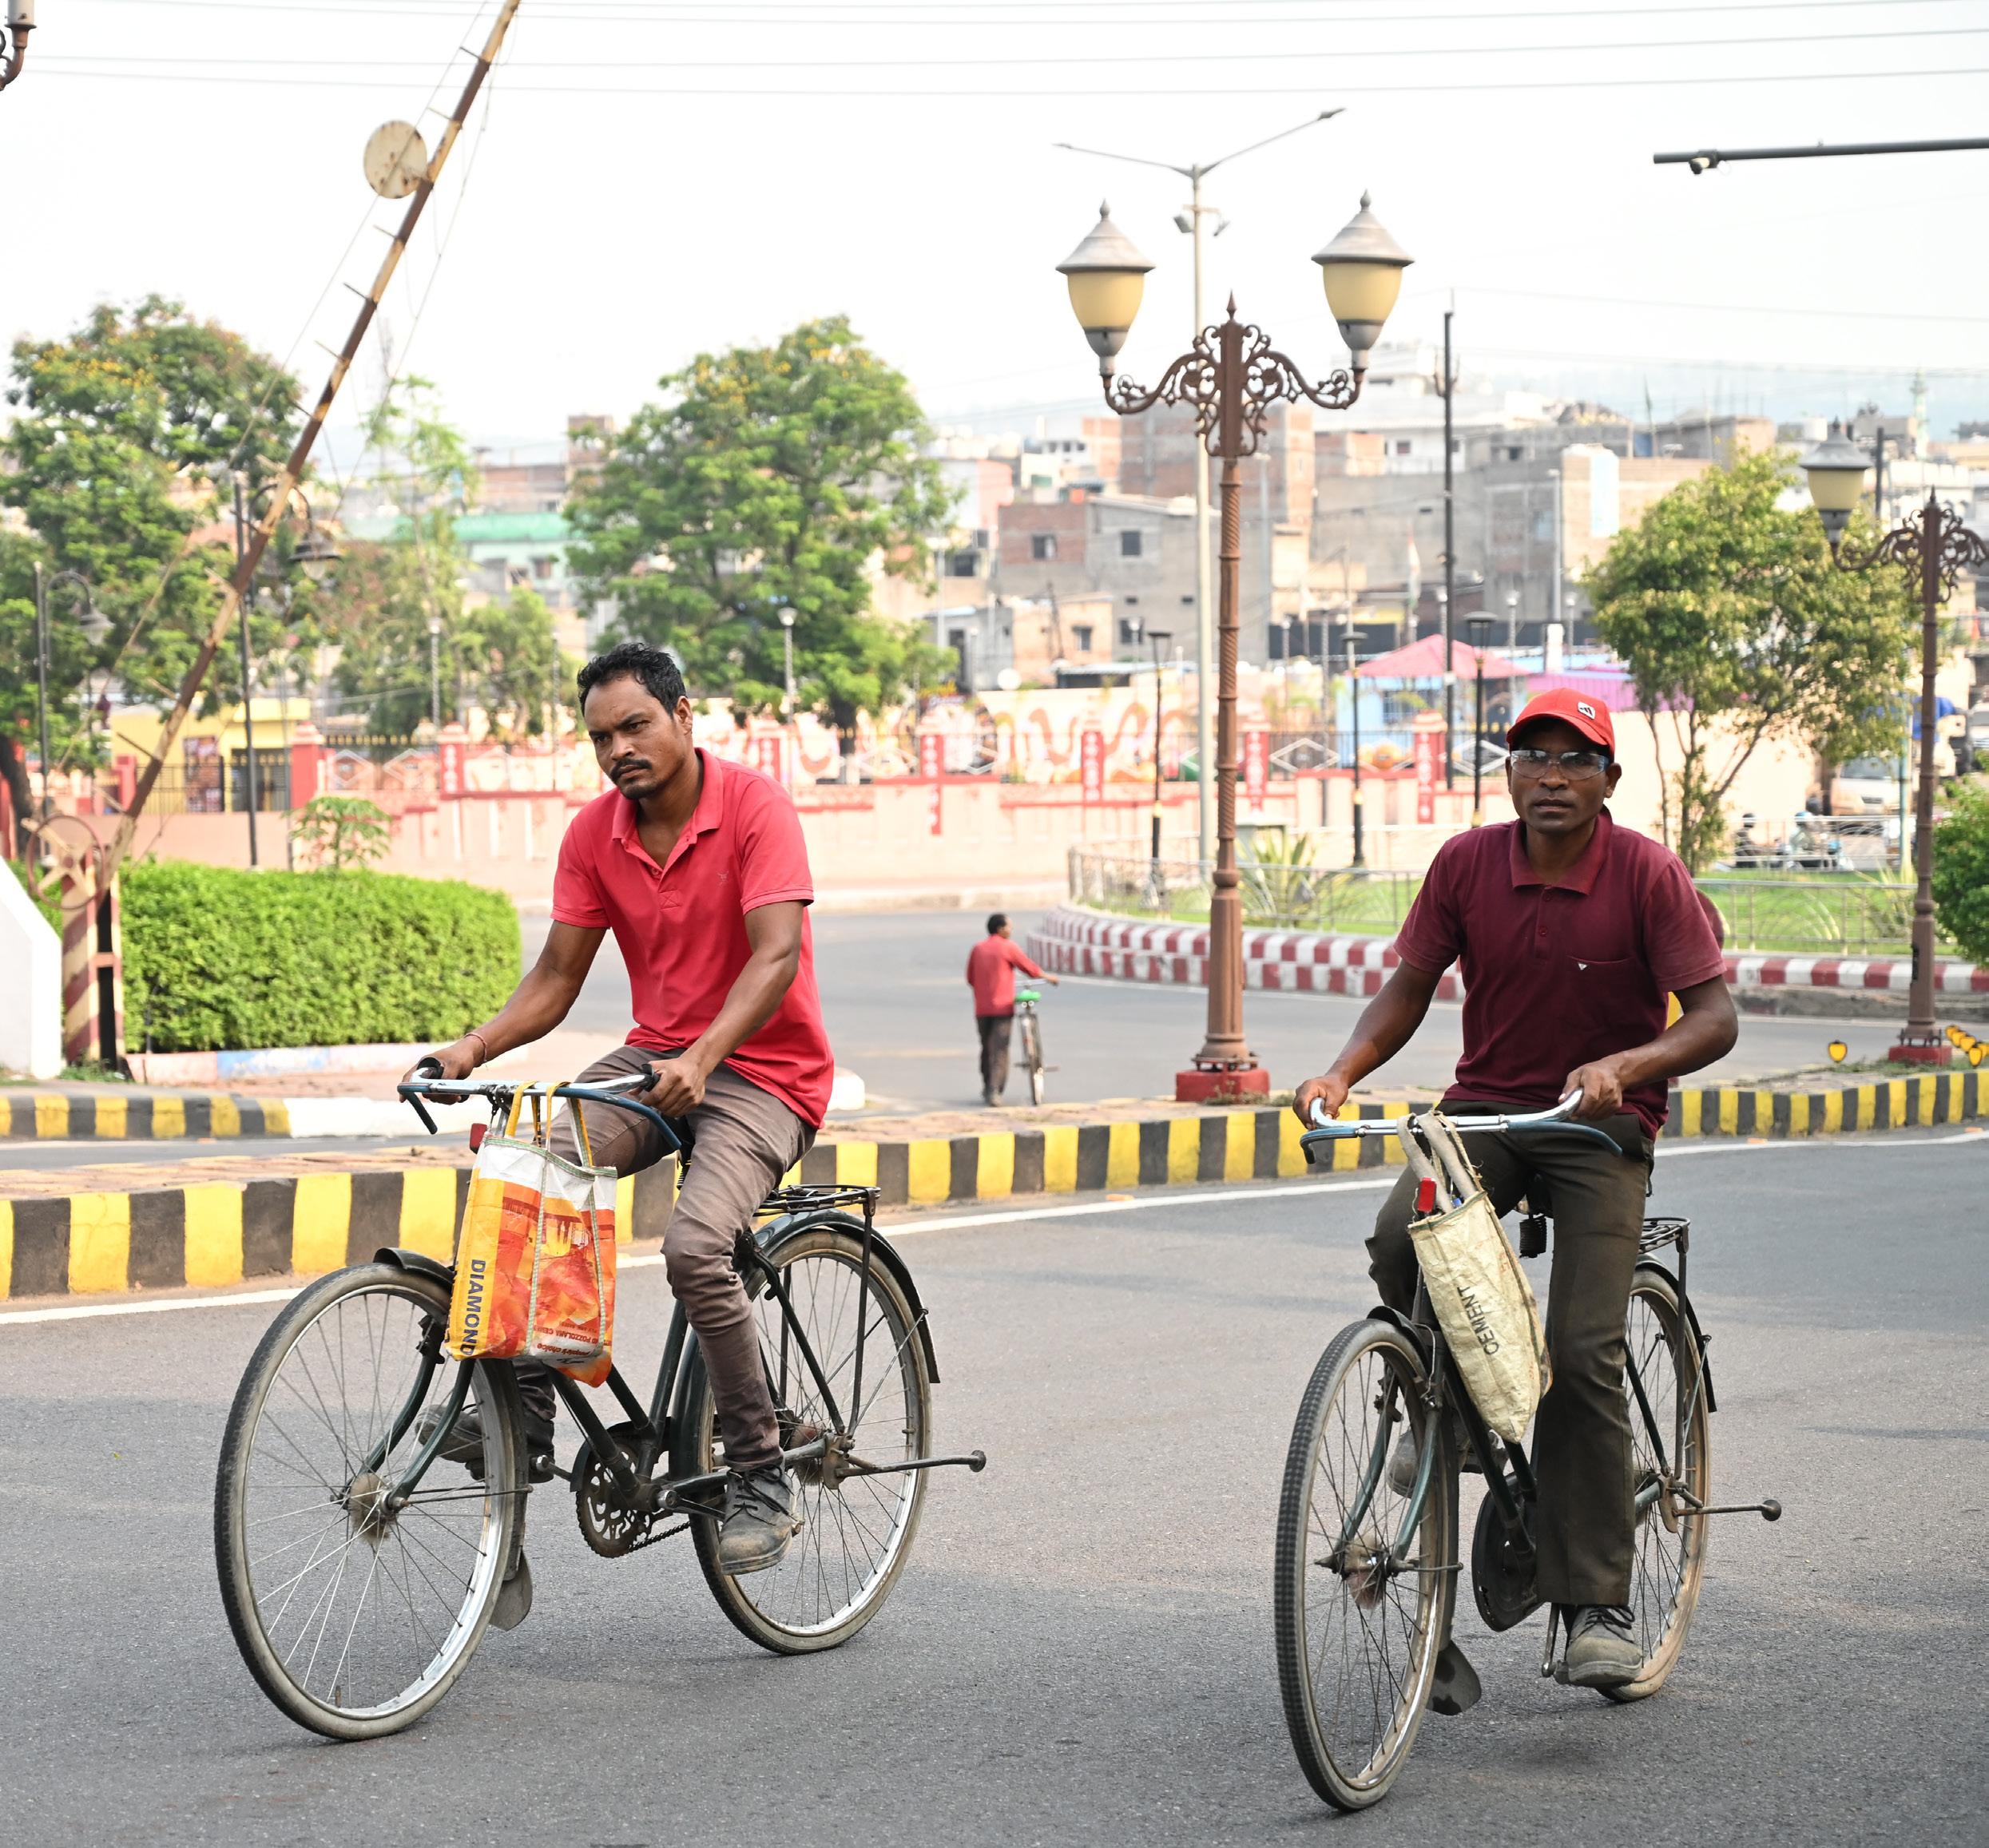
Rourkela has a distinctive mobility profile compared with most Indian cities. The city retains a high share of walking and cycling, with non-motorised transport continuing to play a central role in daily travel. At the same time, this advantage is under threat. Cycling infrastructure is largely absent, footpaths are discontinuous or encroached, formal public transport remains underutilised despite an established Mo Bus network, and vehicle ownership especially cars are rising. Congestion at key corridors and intersections, unmanaged parking on commercial streets, and weak first- and lastmile integration are already affecting mobility efficiency, safety, and overall liveability.
Using the nine-pillar IMP assessment framework, the report evaluates Rourkela across climate-resilient urban growth, public and shared transport, active mobility, equity and inclusion, environmental sustainability, parking and travel demand management, governance and financing, road safety, and digital integration. The assessment shows relatively stronger performance in Digital Integration, Public & Shared Transport Systems, and Climate-Resilient & Compact Urban Growth, supported by CRUT’s digital systems, commuter-responsive planning, and the city’s planned sectoral structure. However, the weakest areas are Parking & Travel Demand Management, Climate & Environmental Sustainability, Active Mobility, and Equity & Inclusion, revealing major gaps in infrastructure continuity, accessibility, clean mobility planning, and institutional mechanisms for inclusive implementation.
In response, the IMP defines five strategic goals for Rourkela: to protect and strengthen its non-motorised transport culture; improve road safety at critical intersections; strengthen public transport through feeder integration and route optimisation; introduce structured parking and travel demand management; and build stronger governance, financing, and data systems for long-term mobility delivery. Together, these goals seek to preserve Rourkela’s existing sustainable travel base while making the overall system safer, more efficient, more inclusive, and more resilient to future growth.
The report identifies five immediate priority projects under the SUM-ACA support framework: bicycle infrastructure planning for the 16.2 km Ring Road corridor including cycle tracks and a bus priority lane; safe redesign of Panposh Chowk, DPS Square, and Birsa Munda Chowk; a micro-bus feeder service plan to improve coverage and last-mile access; a parking solution and management plan for Kachehri Road; and a low-occupancy route analysis and rationalisation exercise for the Mo Bus network. These interventions are designed as practical, high-impact actions that directly address the city’s most urgent and visible mobility gaps.
Beyond the immediate actions, the report proposes a broader programme of mediumand long-term reforms and investments. These include gender-responsive public transport safety measures, multimodal interchange design, a citywide NMT and universal accessibility programme, IPT regulation and e-rickshaw transition, fleet electrification and renewable energy integration, parking policy reform, creation of a mobility steering mechanism, stronger monitoring and public dashboards, land value capture and TOD-linked financing approaches, open data systems, and a phased move toward integrated digital mobility services. These measures are intended to institutionalise sustainable mobility rather than rely only on isolated projects.
The report concludes that Rourkela is at a critical transition point. The city still has a rare opportunity to retain and strengthen its sustainable mobility base before motorisation becomes structurally dominant. If the recommended projects and institutional measures are implemented in a phased manner, Rourkela can improve safety, increase public transport effectiveness, manage parking more efficiently, support cleaner transport systems, and establish a stronger foundation for evidencebased urban mobility planning. The IMP therefore serves both as a priority action agenda and as a long-term framework for inclusive, climate-responsive, and peoplecentred mobility development in Rourkela.
Abbreviation Full Form / Meaning
ADB
Asian Development Bank
AMRUT Atal Mission for Rejuvenation and Urban Transformation
API Application Programming Interface
BPL Bus Priority Lane
BS VI Bharat Stage VI (emission standards for motor vehicles)
B/A Boarding and Alighting
CDP City Development Plan
CPCB Central Pollution Control Board
CRUT Capital Region Urban Transport
DPR Detailed Project Report
ECS Equivalent Car Space
EPK Earning Per Kilometre
EV Electric Vehicle
FAME
Faster Adoption and Manufacturing of Hybrid and Electric Vehicles
FAR Floor Area Ratio
GHG Greenhouse Gas
GIS
Geographic Information System
GTFS General Transit Feed Specification
GTFS-RT General Transit Feed Specification – Real Time
H&UD Housing and Urban Development (Department)
IMP Integrated Mobility Plan
IMSC Integrated Mobility Steering Cell
IPT Intermediate Public Transport
IRC Indian Roads Congress
ISOCARP International Society of City and Regional Planners
ITS Intelligent Transport System
ITMS Intelligent Traffic Management System
KPI Key Performance Indicator
LOS Level of Service
LVC Land Value Capture
MaaS Mobility as a Service
MNRE
MoHUA
MoRTH
Ministry of New and Renewable Energy
Ministry of Housing and Urban Affairs
Ministry of Road Transport and Highways
MoEFCC Ministry of Environment, Forest and Climate Change
NCAP
NIT
NMT
National Clean Air Programme
National Institute of Technology
Non-Motorised Transport
NULM
National Urban Livelihood Mission
OD Origin-Destination
OR Occupancy Ratio
PCU
PPP
PT
PWD
Passenger Car Unit
Public-Private Partnership
Public Transport
Public Works Department
RDA Rourkela Development Authority
RL/ATL
Revenue per Lane per Trip / Actual Traffic Load
RMC Rourkela Municipal Corporation
ROW Right of Way
RPwD Rights of Persons with Disabilities (Act 2016)
RTO
SAIL
SCP
SOPs
STA
Regional Transport Office
Steel Authority of India Limited
Smart City Proposal
Standard Operating Procedures
State Transport Authority
iRAD integrated Road Accident Database
TDM
Travel Demand Management
TOD Transit Oriented Development
ULB Urban Local Body
UMTA
Unified Metropolitan Transport Authority
VGF Viability Gap Funding
Rourkela’s urban mobility system is undergoing a significant transition, driven by its emergence as a key industrial and educational hub in Rourkela. The presence of large employment generators such as Rourkela Steel Plant, along with expanding institutional areas and growing residential neighbourhoods, has led to increasing travel demand across the city. At the same time, rising motorisation, dispersed land-use patterns, and a network of high-speed arterial roads have intensified challenges related to congestion, road safety, and first- and last-mile connectivity. Although several initiatives have been undertaken to improve junction design, road infrastructure, and non-motorised transport facilities, these efforts have often been implemented in isolation, resulting in gaps in continuity, integration, and overall system performance. The absence of a coordinated and outcomeoriented mobility framework has limited the city’s ability to effectively prioritise investments, optimise network efficiency, and align stakeholders toward a shared vision.
In this context, the preparation of an Integrated Mobility Plan (IMP)
for Rourkela is both timely and essential. The IMP is envisioned as a comprehensive and forward-looking strategy that brings together ongoing projects, proposed interventions, and policy measures under a unified mobility framework. By integrating land use and transport planning, strengthening public and non-motorised transport networks, and prioritising data-driven and phased implementation, the IMP will support Rourkela in addressing its current mobility challenges while preparing for future growth in a structured and resilient manner.
The IMP has been prepared under the Sustainable Urban Mobility –Air Quality, Climate Action and Accessibility (SUM-ACA) initiative, implemented as part of the Indo-German Green Urban Mobility Partnership. Through SUM-ACA, GIZ supports nine cities across five Indian states in transitioning toward efficient, inclusive, and climate-responsive urban mobility systems. In this context, the Rourkela IMP establishes a structured roadmap for sustainable mobility transformation, grounded in local priorities, existing city plans and international best practices.
Rourkela
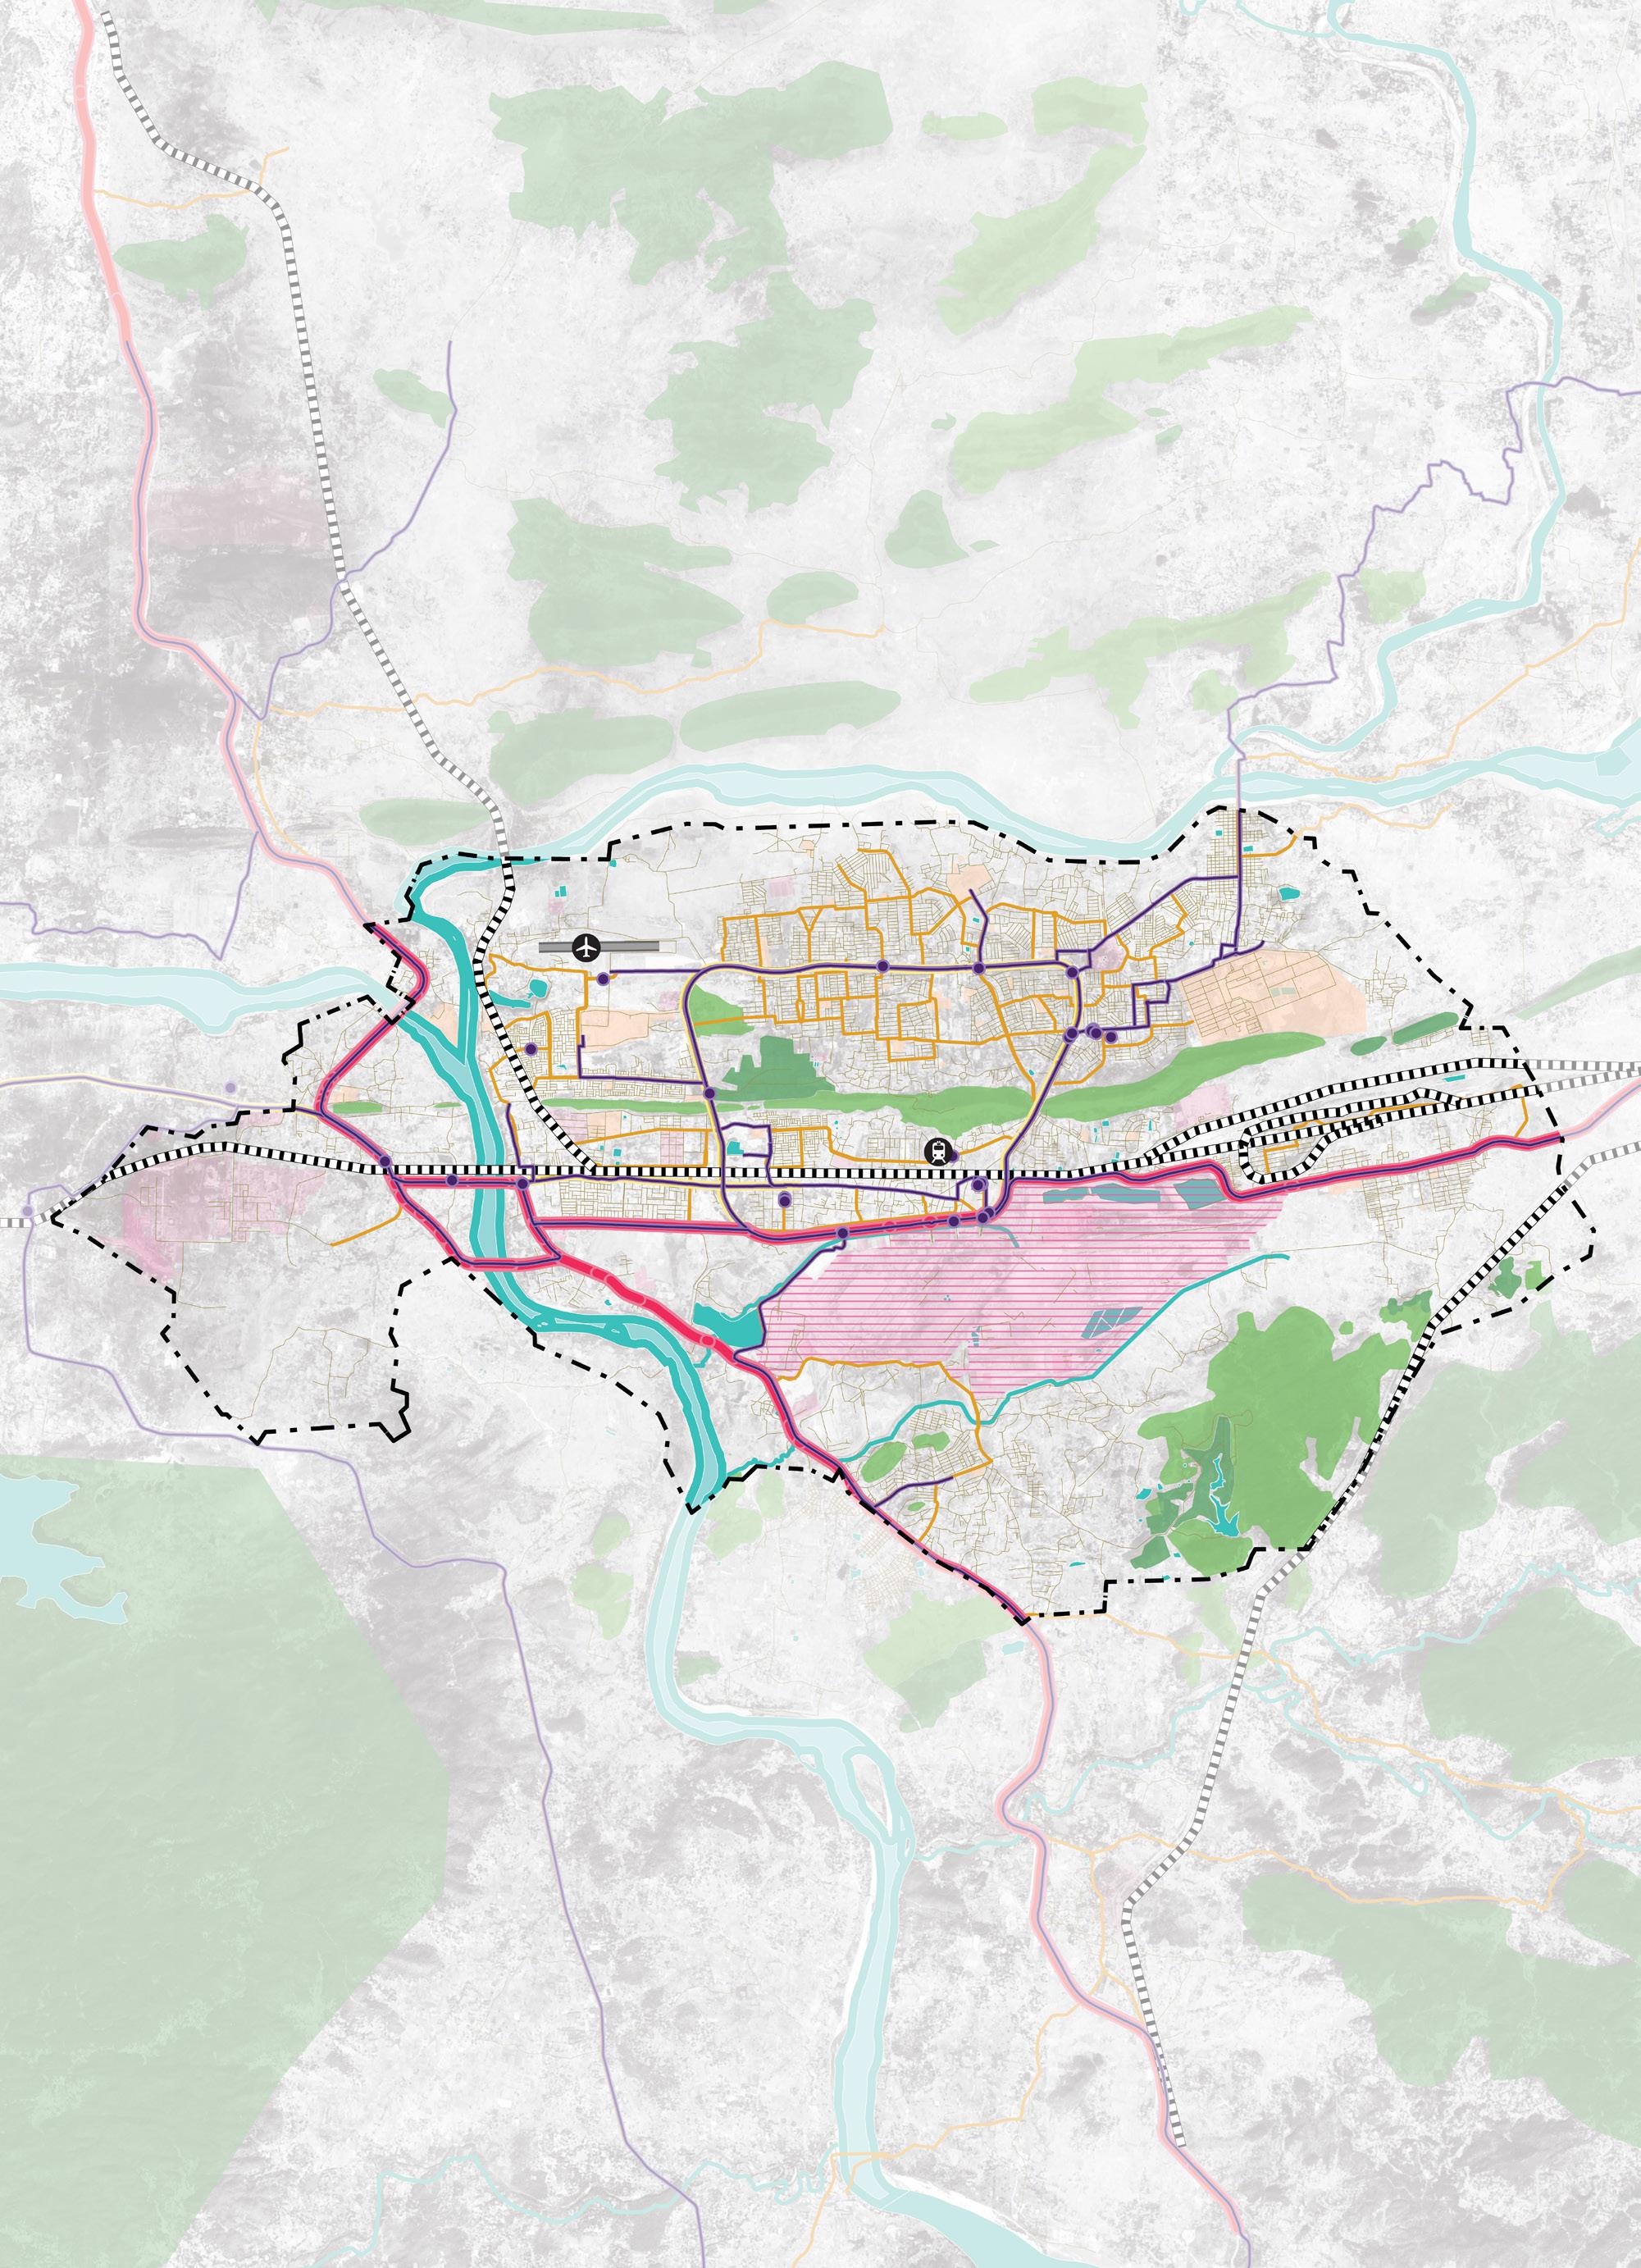

Planning Boundary
National Highway
State Highway
Rourkela Steel Plant
NIT Rourkela
Bus Routes
Bus Stops
Rourkela Railway Station
Rourkela Airport
Initiated under the framework of IndoGerman Development Cooperation, the Sustainable Urban Mobility – Air Quality, Climate Action and Accessibility (SUM-ACA) initiative, aligns with India’s National Determined Contributions (NDCs) under the Paris Agreement and the 2030 Agenda for Sustainable Development, and particularly aims at the SDGs of Sustainable Cities and Communities, and Climate Action. SUMACA employs a multi-actor, multipronged strategy, working with local governments to develop contextually relevant, socially equitable, climatefriendly, and innovative solutions. This collaborative approach emphasizes
capacity development, knowledge sharing, and the formalization of best practices once technical cooperation concludes.
Furthermore, SUM-ACA seeks to strengthen linkages between environmental quality and climate change concerns by establishing clear connections between existing transport and environmental policies, institutional and individual capacities, data collection methodologies, and potential health outcomes. The performance of the SUMACA project is evaluated against five module indicators and respective output indicators as listed below:
M1 | SUM Strategies
M2 | Data
M3 | National Guidelines
M4 | Capacity Development
M5 | Air Quality and CO2
Support cities and states in creating sustainable, low carbon urban mobility strategies
Improve use of integrated climate, air quality, and mobility data for evidence-based planning
Develop national guidelines for integrated, climate-resilient urban mobility planning
Train decision-makers and professionals in sustainable and inclusive mobility practices
Reduce transport emissions and improve urban air quality through sustainable mobility measures
Output 1: The Indo-German Green Urban Mobility Partnership (GUMP) is supported
Position GUMP as a global platform for advancing green urban mobility
Develop three city/state-level sustainable mobility strategies
Output 2: Evidence-based data on climate action, air pollution control and access to urban mobility has been improved
Create a national framework for collecting air quality and mobility behaviour data
Establish 15 digital tools for integrated mobility planning and data management
Output 3: Processes for the implementation of integrated mobility plans are demonstrated
Prepare 8 integrated mobility plans through stakeholder-led planning processes
Pilot interdepartmental coordination models in 5 selected cities
Output 4: The institutional and personal capacities of national, state, and local actors for the realisation of integrated mobility, including green recovery, are strengthened
Train 30 professionals through climate and mobility-focused capacity-building programs
Equip 3,000 professionals with practical sustainable mobility implementation skills
Fig. 4. SUM-ACA Objectives and Outcomes
The duration of the SUM-ACA project is for four years (2022-2026). The project is being implemented across five Indian states and respective cities namely, Kerala (Kochi & Trivandrum), Karnataka (Hubli-Dharwad & Mysore), Odisha (Bhubaneswar & Rourkela), Meghalaya (Shillong) and Gujarat (Surat & Rajkot). The implementation of output indicator 3 “Processes for the implementation of integrated mobility plans”, aim to strengthen the competence of urban actors for the planning and
implementation of IMPs. The primary pillar of the output indicator is to enhance the capacity of urban stakeholders to effectively plan and implement IMPs. The project aims to support intersectoral transport planning which emphasizes on the inclusion of vulnerable groups such as women and people with disabilities. Intended outcomes serve the purpose of restoring the attractiveness of public transport and increase accessibility through intermodality.
India’s national transport related policies and programmes consistently emphasise the need for integrated, people-centred and climate-aligned mobility planning, providing a clear foundation for cities to prepare Integrated Mobility Plans. The National Urban Transport Policy (NUTP) sets the core direction by promoting public transport, non-motorised mobility and land-use integration principles that directly align with an integrated planning approach.
Complementing this, the CMP Toolkit provides the technical framework, data
standards and evaluation methods that guide cities toward holistic, multimodal planning rather than isolated sectoral projects. National programmes like FAME I/II, PM e-Bus Sewa, and PM E-Drive reinforce this direction by supporting electrification, modern bus systems, and charging infrastructure, all of which require coordinated planning across transport, energy and urban systems. Together, these policies signal that India expects cities to adopt comprehensive, integrated mobility planning.
Table. 1. Sustainability Mobility in Indian Context
Program / Guidelines
National Urban Transport Policy (NUTP)
Comprehensive Mobility Plan (CMP) Toolkit / Guidelines
& II
PM e-Bus Sewa
PM E-Drive / National EV Infrastructure Programmes
National Mission on Sustainable Habitat (NMSH) under National Action Plan on Climate Change
Objective / Focus
• Promote people-centred mobility
• Prioritises public transport, walking & cycling as the backbone of urban mobility
• Encourages integrate land-use & transport
• Advocates for clean & sustainable mobility
• Pushes for institutional strengthening
• Provide standard methodology for mobility planning, including data collection, modelling, LOS benchmarks, and scenario analysis
• Focuses on shifting trips from private vehicles to public transport, walking, and cycling
• Details project prioritisation framework for short-, medium-, and long-term interventions
• Strong national push for EV adoption, especially in public & shared transport
• Focus on demand incentives
• Support for charging infrastructure
• Promotes energy-efficient, low-emission mobility
• Introduce 10,000+ electric buses via PPP models with central support for operations & depots
• Supports depot infrastructure, charging and power infrastructure (behind-the-meter power, substations etc.)
• Scale up public charging networks and enable widespread EV use.
• Encourage private-sector participation in charging infrastructure
• Demand incentives for EV adoption, Subsidy for e-2W/e-3W buyers (on battery capacity)
• Address climate change impacts through sustainable urban planning
• Promote energy-efficient and low-carbon urban transport systems
• Encourage modal shift to public and nonmotorised transport
• Integrate climate resilience into urban infrastructure
Influences / Supports for Integrated Mobility Plan (IMP)
Establishes the core philosophy for IMPs. Cities are encouraged to shift from vehicle-centric projects to integrated, multimodal solutions, embedding PT, NMT, safety, and demand management into every planning stage.
To be consider as the technical backbone of IMPs by defining the process, required datasets, modelling tools, and prioritisation framework; ensures uniformity and evidence-based decision-making across cities.
Encourages IMPs to integrate EV transition strategies, including fleet conversion plans, charging infrastructure needs, depot readiness, and TCO-based financial evaluation for e-mobility investments.
Shapes IMPs to address modern e-bus deployment needs such as route rationalisation, depot electrification, accessibility standards, operational contracting structures, and cost optimisation.
Emphasize IMPs to plan for charging corridors, public charger locations, grid augmentation, energy demand projections & private sector participation models, thus making electrification a structured part of city mobility.
Positions IMPs within a broader climate action framework by linking mobility planning with emission reduction targets and resilience strategies. Encourages inclusion of GHG accounting, climate adaptation measures, and sustainable transport indicators in mobility planning and monitoring.
The Integrated Mobility Plan for Rourkela aims to build on the city’s exceptional non-motorised transport, one of India’s highest cycling modal shares, and translate it into a safe, inclusive, and wellconnected mobility ecosystem. The IMP envisions a city where every resident can
move freely and sustainably, industrial and institutional zones are seamlessly accessible by public and active transport, and the growing pressure of motorisation is managed through integrated, peoplefirst planning.
Addresses key mobility gaps to build a connected, safe, efficient, inclusive, and sustainable transport system for all.
1. Build Safe, Connected & Inclusive Active Mobility
Create a city-wide network of safe walking and cycling infrastructure and improve safety at high-risk locations to support Rourkela’s strong non-motorised transport base.
Aligned Pillars: Active Mobility | Road Safety | Equity & Inclusion
Plan and develop missing bicycle infrastructure across priority corridors
Improve pedestrian infrastructure, crossings and street design
Redesign 3 critical intersections to enhance road safety for all users
2. Strengthen & Optimise Public Transport Network
Introduce traffic calming and conflict reduction measures
Improve the efficiency, coverage and reliability of public transport through route rationalisation and micro-transit services to ensure seamless first- and last-mile connectivity
Aligned Pillars: Public & Shared Transport Systems | Digital Integration | Equity & Inclusion
Identify reasons for low occupancy of CRUT bus routes
Rationalise and restructure CRUT bus routes to improve efficiency and ridership
Develop and implement a Micro Bus service plan for reliable first- and lastmile connectivity
Integrate services with Mo Bus and IPT systems and explore digital tools for better operations and user information
3. Manage Parking & Improve Urban Mobility Efficiency
Introduce sustainable parking solutions and demand management measures to reduce congestion, optimise road space and support a more liveable and efficient city
Aligned Pillars: Parking & Demand Management | Governance & Financing | Climate Sustainability
Develop a comprehensive parking solution and management plan for Kacheri Road
Implement parking regulation, pricing and enforcement mechanisms
Optimise on-street and off-street parking supply and improve kerb management
Leverage parking revenues for mobility improvements and system sustainability
Protect and strengthen Rourkela’s non-motorised transport culture, by planning missing bicycle infrastructure to build a safe, continuous, and connected citywide network for walking and cycling.
Improve public transport quality, frequency, and coverage, by developing a structured micro-bus feeder service plan and identifying the causes of low occupancy on CRUT bus routes.
Address critical road safety risks through targeted engineering improvements at three identified accidentprone intersections.
Introduce structured parking and travel demand management through a comprehensive parking solution and management plan for Kachehri Road.
Strengthen institutional capacity and governance for integrated mobility delivery, supported by dedicated financing, monitoring systems, and climate-aligned and inclusive mobility standards.
Rourkela is one of the important industrial cities in eastern India and serves as a major economic, educational, and transport hub within the state. Anchored by the presence of the Rourkela Steel Plant, the city has evolved as a key centre for industrial production, employment generation, and regional connectivity.
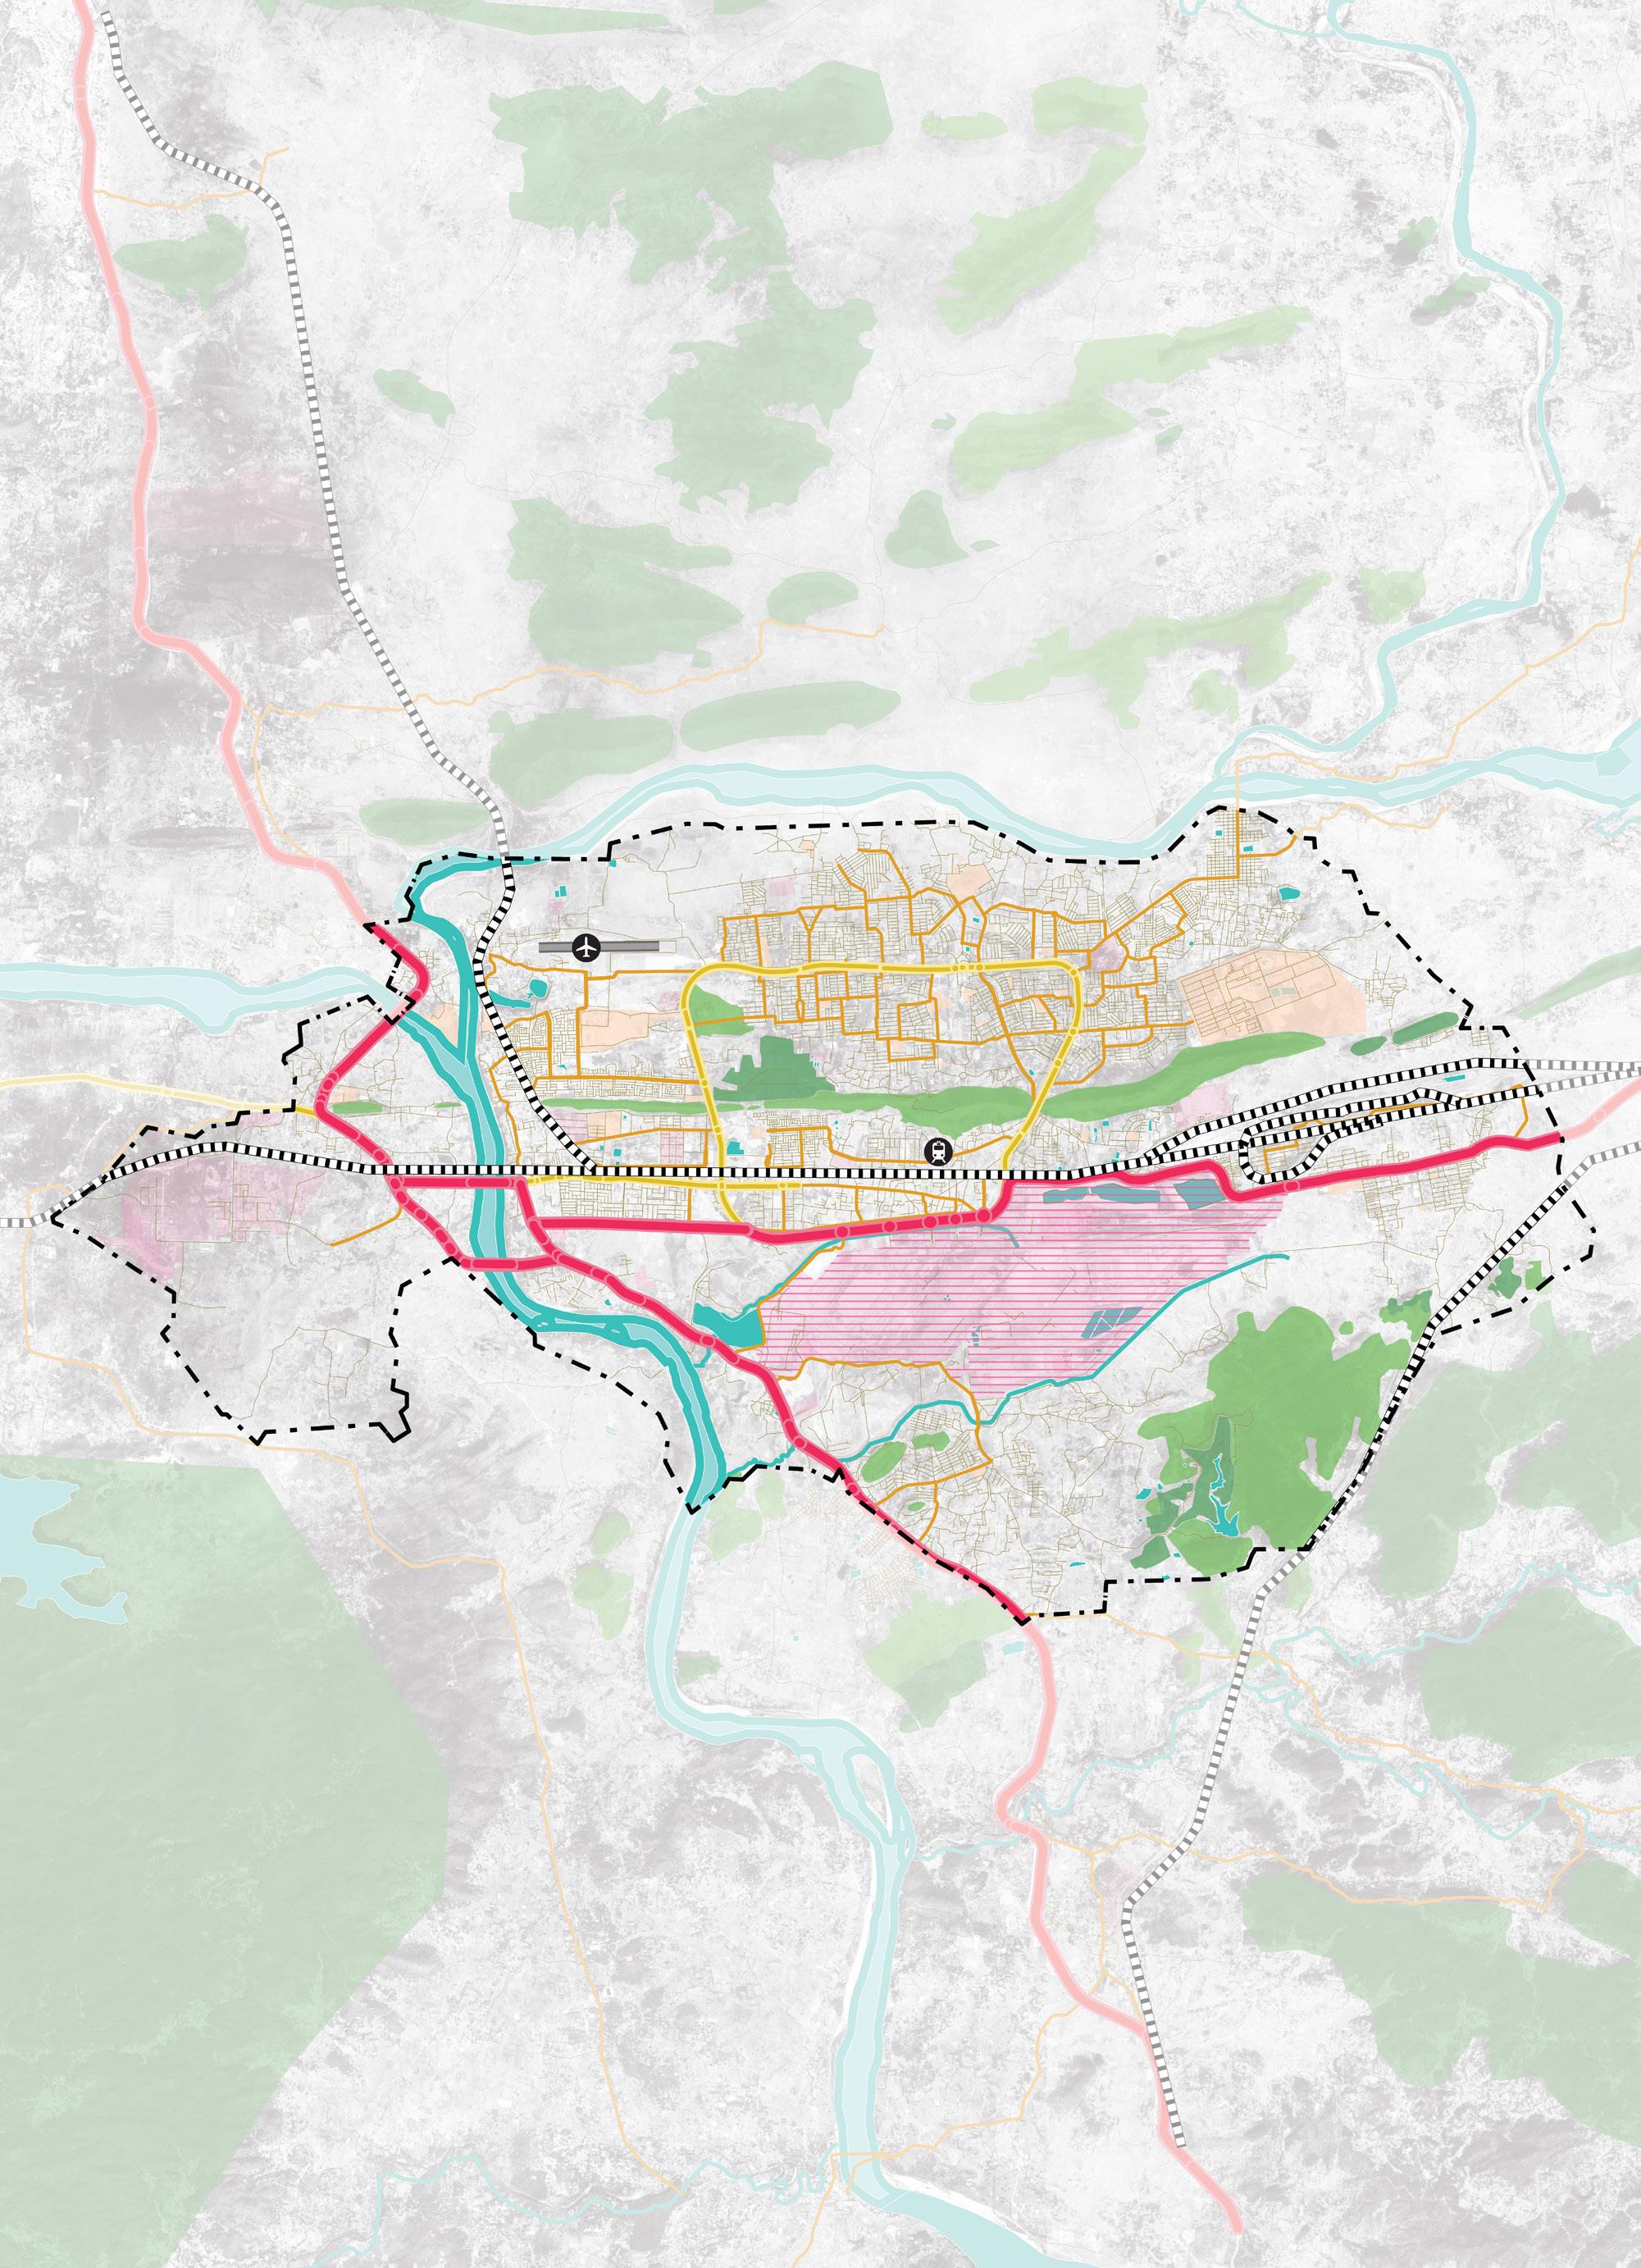
The Rourkela Development Planning Area covers approximately 259 sq. km, comprising the Steel Township, Civil Township, and 52 surrounding villages, reflecting a diverse and spatially dispersed urban structure. With a population of approximately 7.9 lakh (2026 estimate) and projected to exceed 1 million by 2037, the city is experiencing steady demographic and spatial growth. This growth, combined with increasing economic activity, is resulting in rising travel demand across industrial zones,
residential areas, and key institutional nodes. Rourkela is well connected through regional highways, rail networks, and emerging air connectivity via Rourkela Airport. Key transport nodes such as the railway station, bus terminal, and industrial corridors act as major trip attractors, generating strong daily movement patterns. The city’s historic ring road network plays a critical role in connecting different sectors, although increasing congestion in core areas is beginning to affect its efficiency.
Urban governance and planning are primarily guided by the Rourkela Development Authority (RDA) along with municipal institutions, while public transport services are operated by Capital Region Urban Transport under the Mo Bus/Ama Bus system.
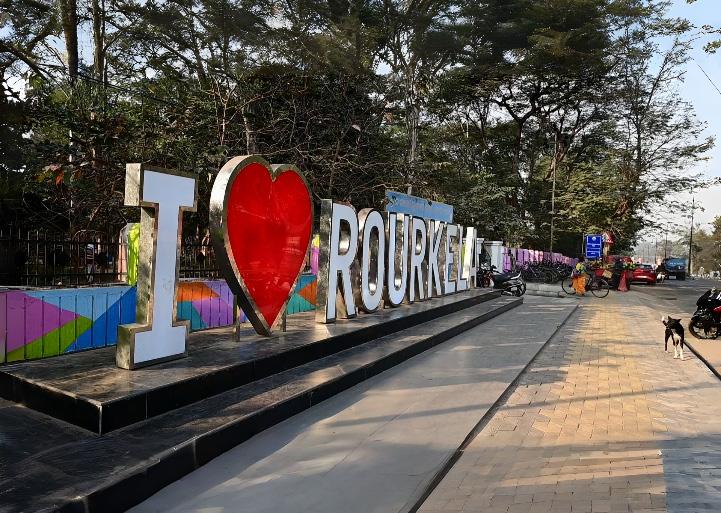
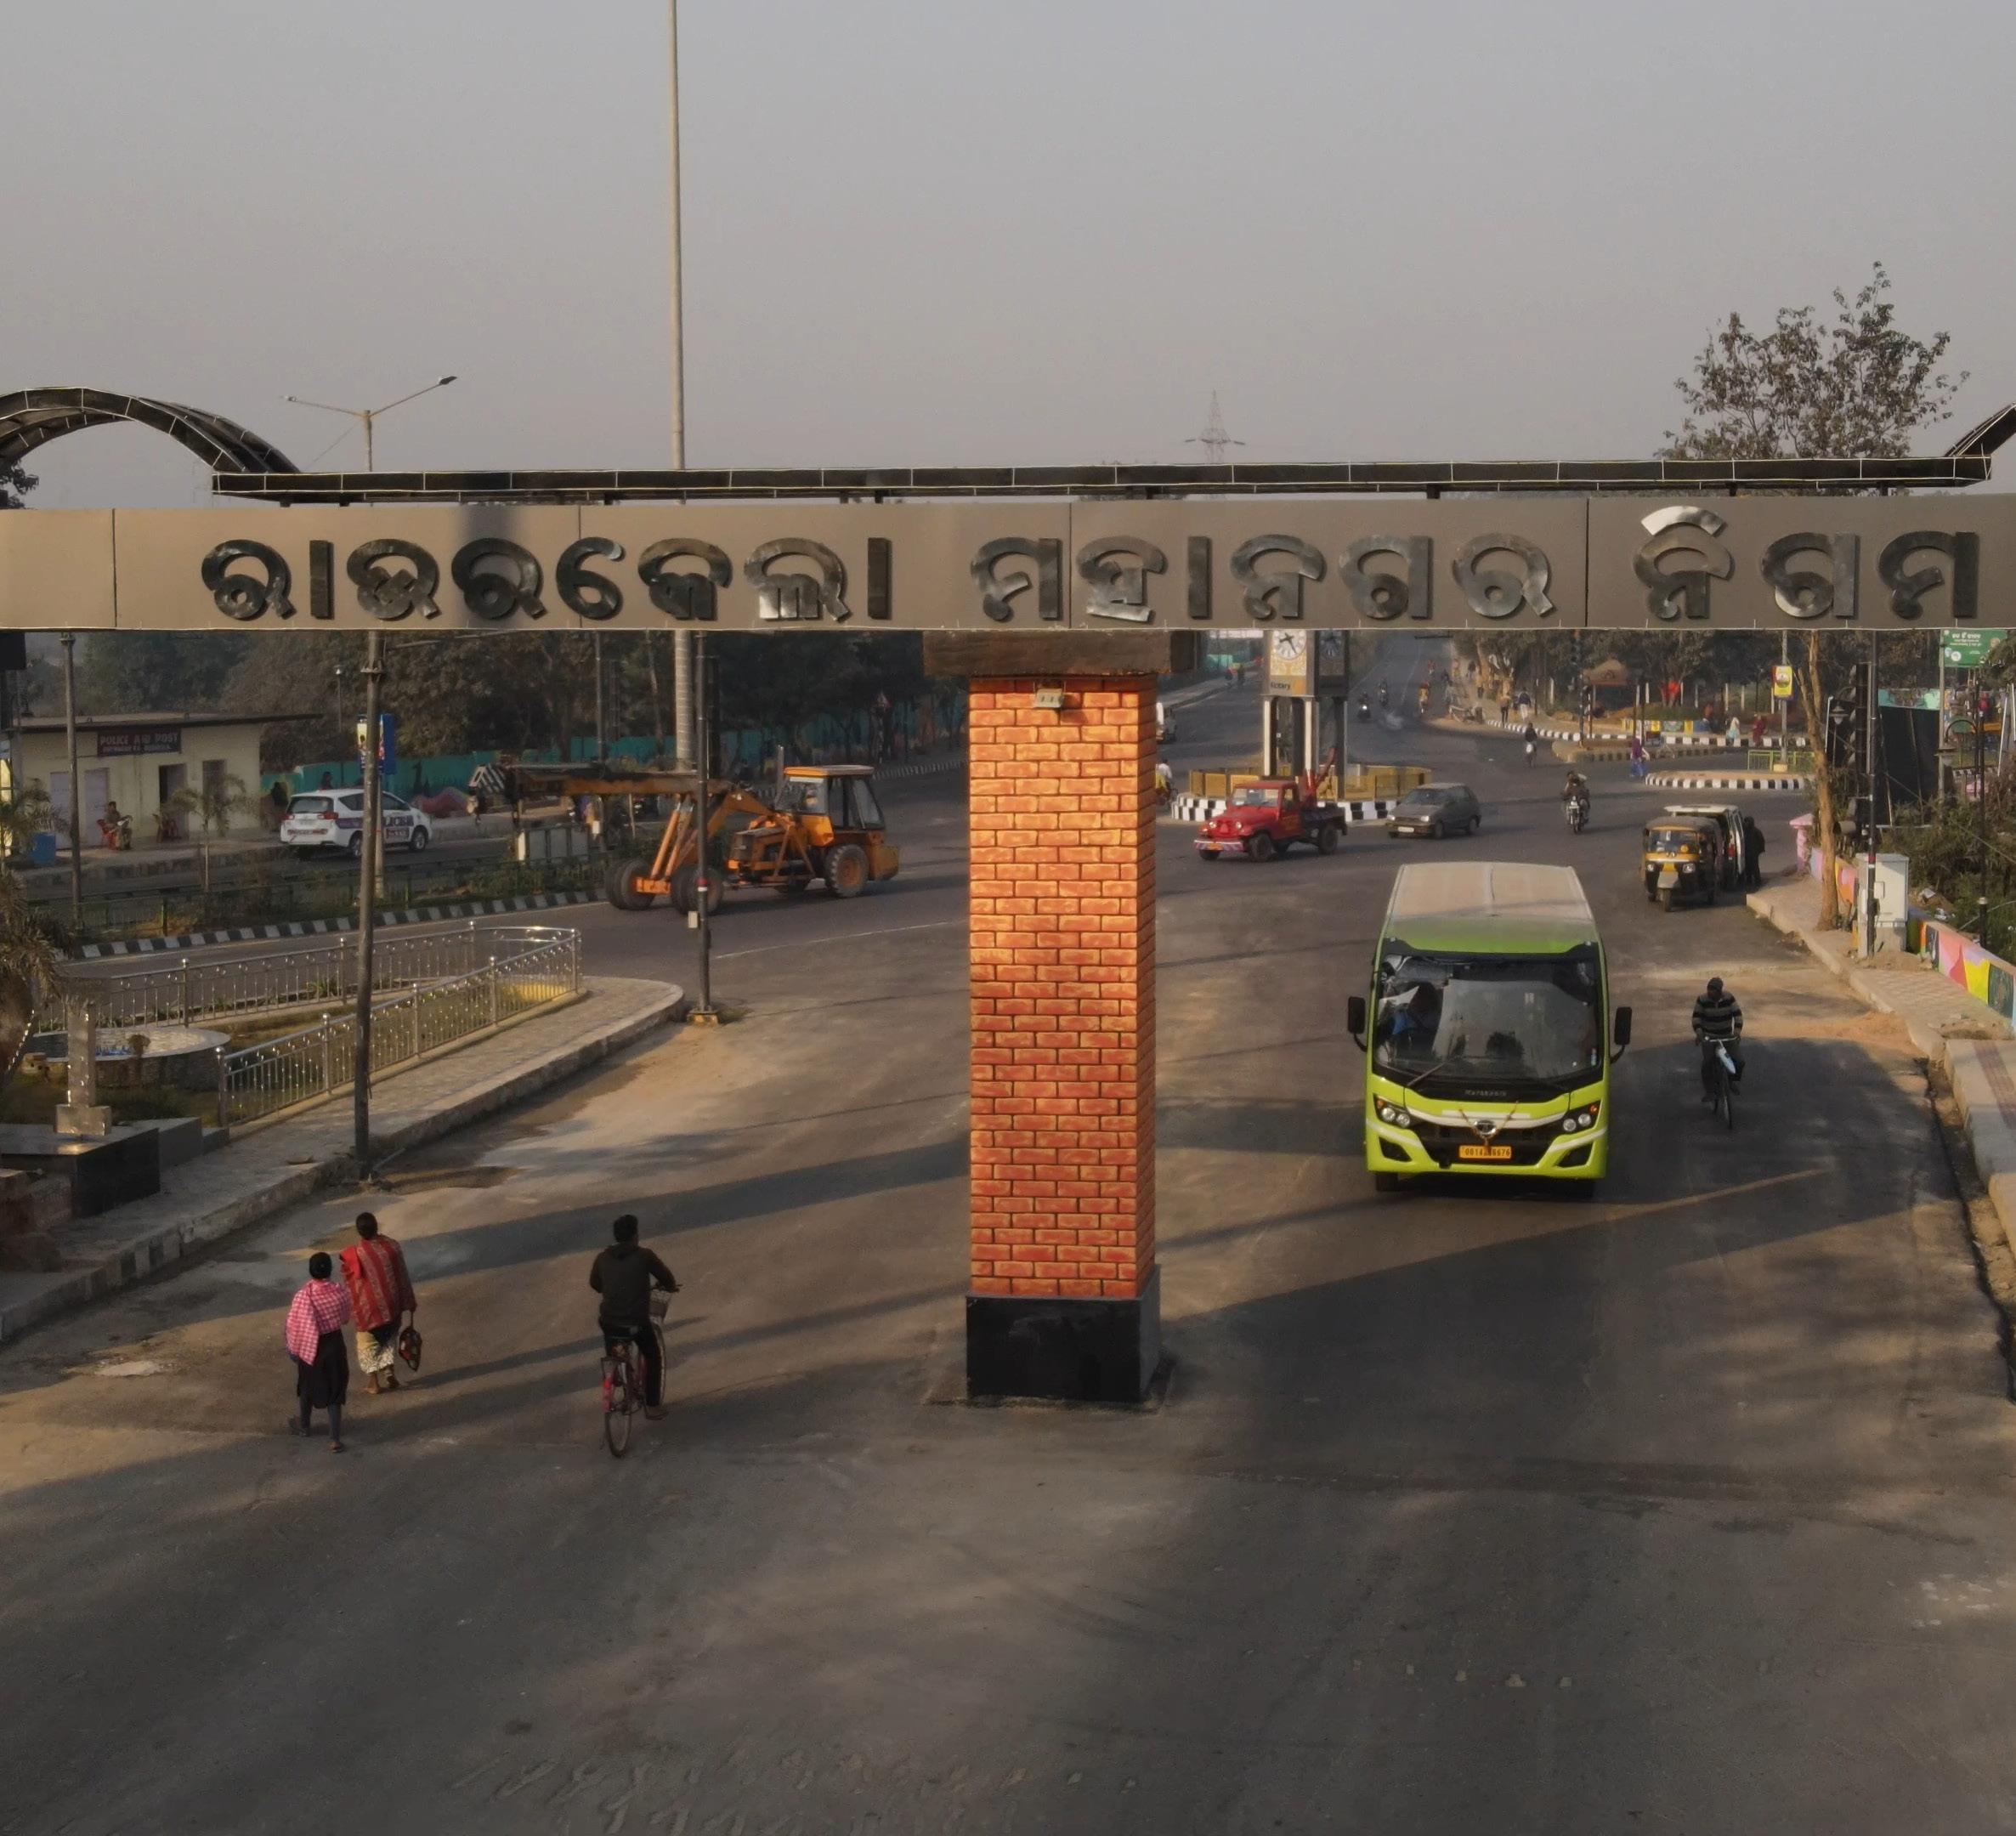
Planned as an industrial township, Rourkela has developed around the Steel Plant and its associated residential sectors, creating a structured yet functionally segregated urban form. Over time, the city has expanded beyond its original planned boundaries
into peripheral villages and emerging residential areas, leading to a more dispersed spatial structure.
The city’s travel patterns are strongly influenced by:
High-density areas are concentrated around the central core particularly near the Steel Plant, railway station, and bus terminal where there is strong potential for walking and cycling. Peripheral areas, including villages and low-density settlements, are more dependent on intermediate public transport (IPT) and private vehicles.
Rourkela also exhibits a strong nonmotorised transport (NMT) culture, with a significant share of trips undertaken
by walking and cycling, particularly for short-distance travel (0–3 km). However, with increasing urban expansion and rising incomes, there is a gradual shift toward motorised modes, especially twowheelers.
As the city continues to grow, ensuring efficient, safe, and sustainable mobility systems becomes critical to maintaining its industrial productivity, accessibility, and overall liveability.
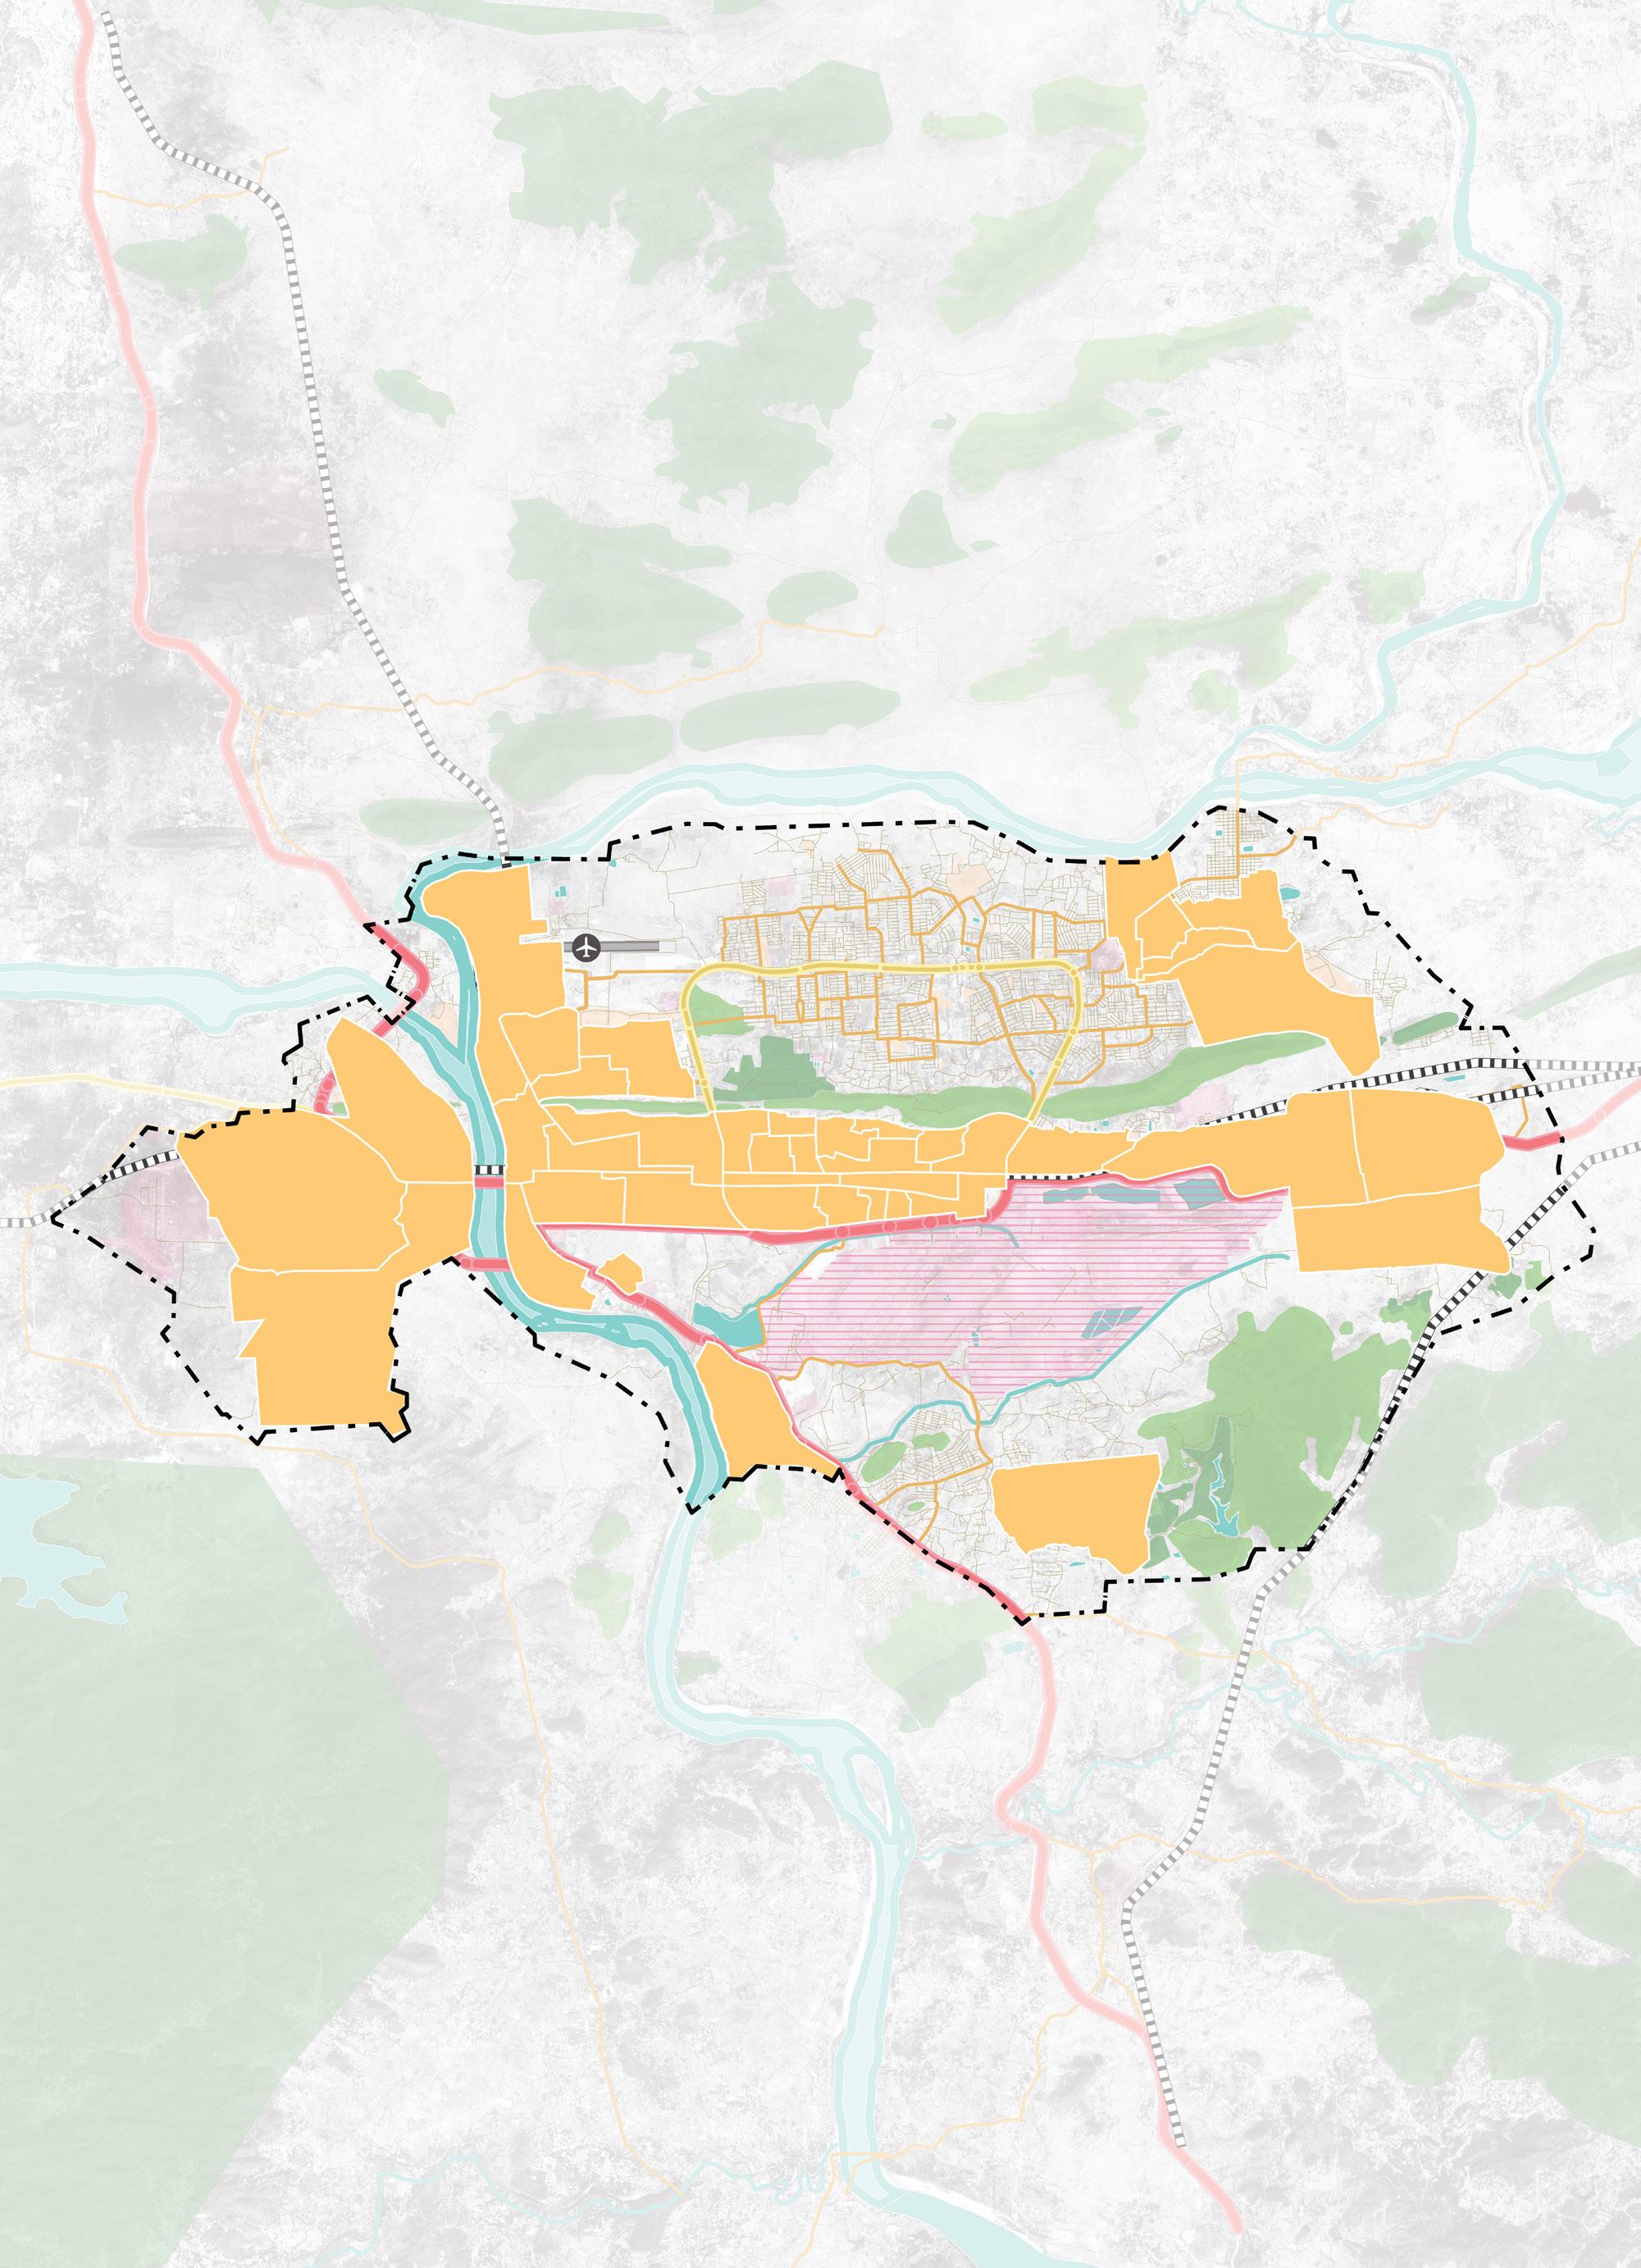
Rourkela
Planning Boundary
National Highway
State Highway
Primary Roads
Rourkela Steel Plant NIT Rourkela
Rourkela Railway Station
Rourkela Airport
Rourkela’s mobility system reflects a rare and defining characteristic among Indian cities: an exceptionally high reliance on non-motorised transport (NMT), co-existing with deepening pressures from rising motorisation, inadequate infrastructure, and a formal public transport network that remains
significantly underutilised relative to the city’s travel demand. Understanding these dynamics is essential to the Integrated Mobility Plan, as they shape both the opportunities and the urgencies that the plan must address.
Peak Hour Survey 2026
2011 Census-Highest among all Modes
Modal Distribution
Five distinct datasets inform the understanding of how Rourkela’s residents travel — the Census of India 2011 (covering Sundargarh Urban Area), the Rourkela Comprehensive Development Plan 2015, the Smart City Proposal 2016, the ISOCARP research study, and the Peak Hour Traffic Volume Survey conducted in 2026 across the
Peak Hour Survey 2026)
953,486 trips per day
Ring Road and major intersections as part of the baseline study. Together, these sources indicate a remarkable persistence of non-motorised travel while also highlighting the growing dominance of private motorised vehicles and informal transit modes in the city’s mobility pattern.
Table. 2. Mode Share Distribution Percentage of Census Smart City Rourkela CDP and Peak Hour Survey
9. Mode Share Percentages in 2011 Census, Smart City Proposal 2016, Rourkela CDP and 2026 Peak Hour Survey
The comparison table below present mode shares from both sources side by side. The Census 2011 data reflect travel patterns for the full Sundargarh urban agglomeration, while the 2026 Peak Hour Survey captures mode share
on the primary Ring Road corridor and surveyed junctions, representing peakhour commuter trips — particularly the steel plant and institutional travel demand that forms the backbone of daily movement in the city.
Table. 3. Mode Share Distribution as per Census and Peak Hour Survey
With 35.7% modal share in Census 2011 and 5.8% in the 2026 Peak Hour Survey, cycling in Rourkela have significantly decreased. This reflects that the primary mode of commute has shifted deeply by the Steel Township and the residential sectors to the Steel Plant. Despite the absence of any dedicated infrastructure, junction surveys confirm over 1,350 cyclists per peak hour at major nodes including Space Square, Birsa Munda Chowk, and Hanuman Vatika.
With motor vehicles travelling at 40–60 km/h on the Ring Road and no protected cycle tracks, cycling has progressively become unsafe. Mode shift analysis indicates approximately 69,562 daily
Two-wheelers hold a modal share of 13.7%, a significant decline from their 2011 levels despite absolute population growth from 552,239 to an estimated 794,572 in 2026. This reduction in twowheeler share is not a shift toward sustainable modes, but rather, it reflects an upward migration to four-wheelers.
cycling trips lost since 2011 relative to population growth, replaced by three-wheelers and buses. Without infrastructure investment, Rourkela risks permanently losing this advantage.
Walking accounts for 24.2% of Census 2011 trips and 24.6% in 2026 which is essentially stable. The CDP (2015) records an even higher 45.4% when including intra-sector movement. Despite this, footpaths are absent or fragmented citywide; wherever present, at +230 mm above carriageway level and are frequently encroached. No surveyed junction provides raised crossings, refuge islands, or pedestrian signal phasing.
Car trips have more than doubled in modal share terms, from 3.0% to 10.1%, confirming that the dominant mode shift in Rourkela is from two-wheelers to private cars. This transition carries significant implications for road space consumption, parking demand, and long-term congestion.
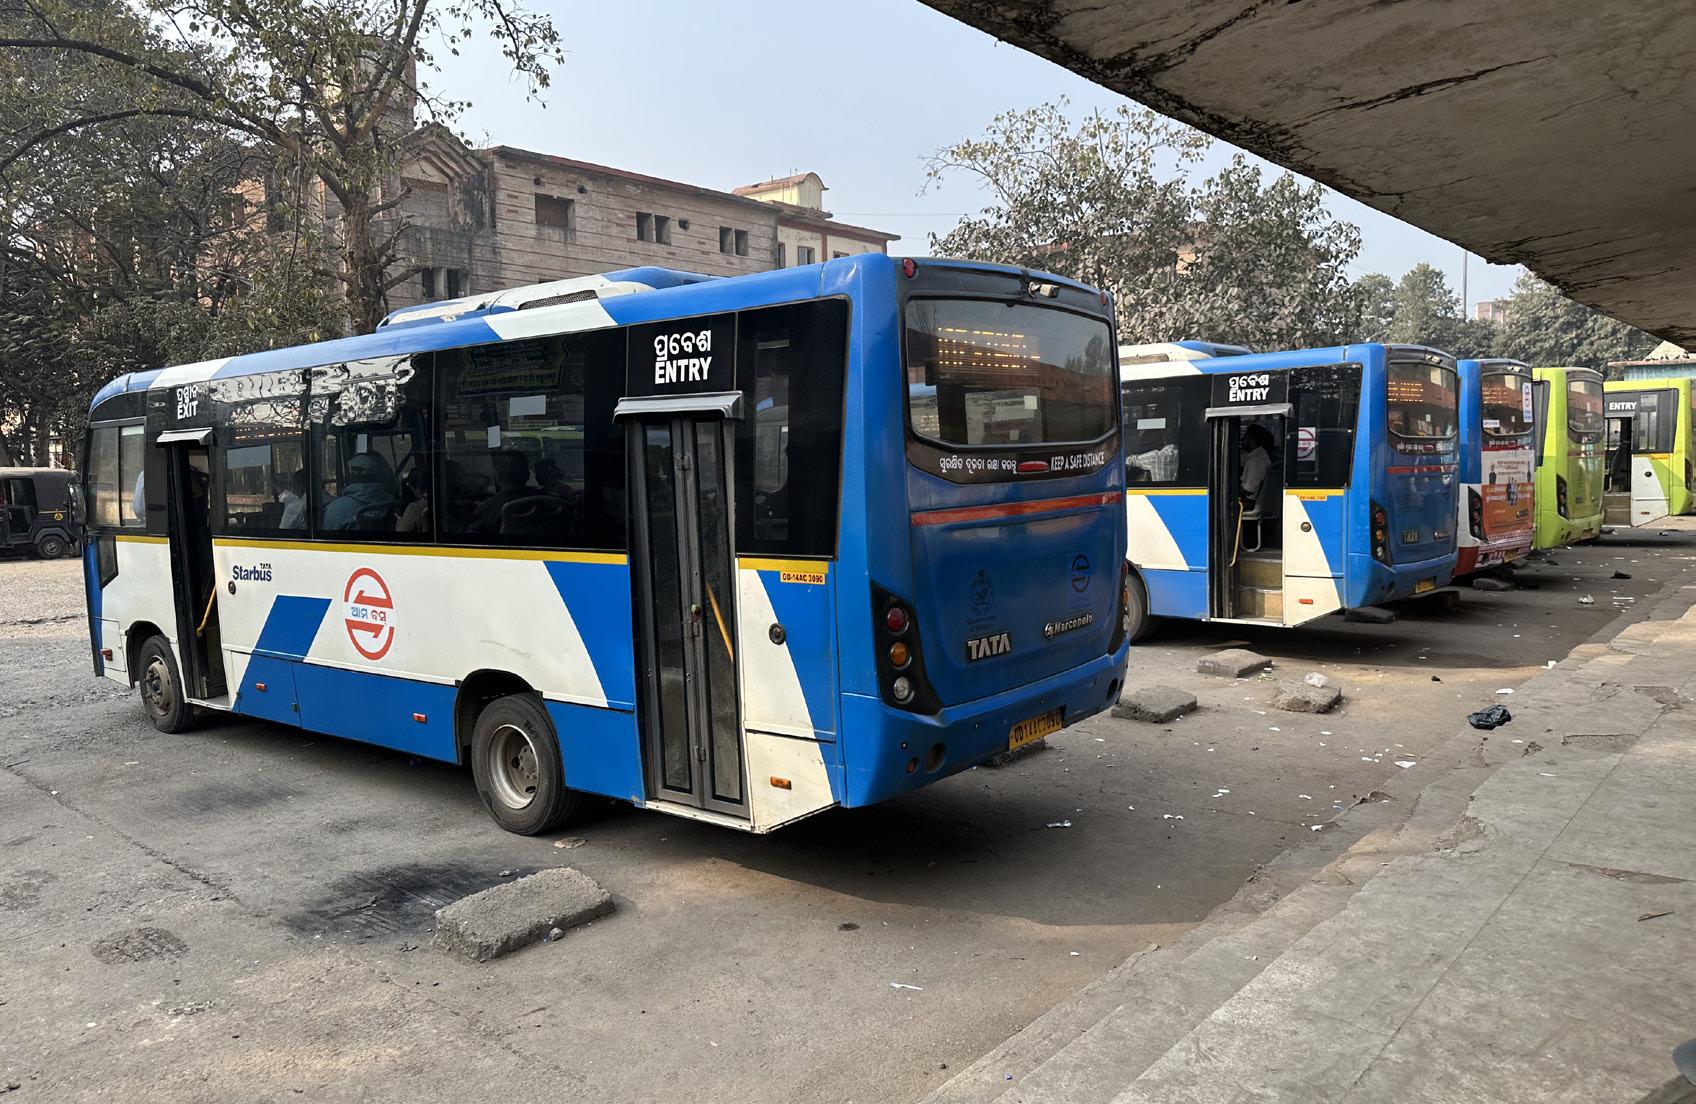
CRUT’s Mo Bus carries approximately 5.5% of trips across 25 routes and 100 buses, with 44,581 daily passengers, constrained by 77-minute average headways, uneven coverage, and no feeder integration. Auto-rickshaws (approximately 12,900 registered) fill the gap with a 3.5% modal share, operating entirely informally.
With a PCTR of 1.2 and a 2026 population of ~794,572, the city generates approximately 9.5 lakh daily trips. Around 15% fall within 0–1 km — ideal for walking — while longer industrial commutes dominate the upper end. Travel demand is concentrated along the Ring Road corridor, forming the primary spine for NMT and PT investment.
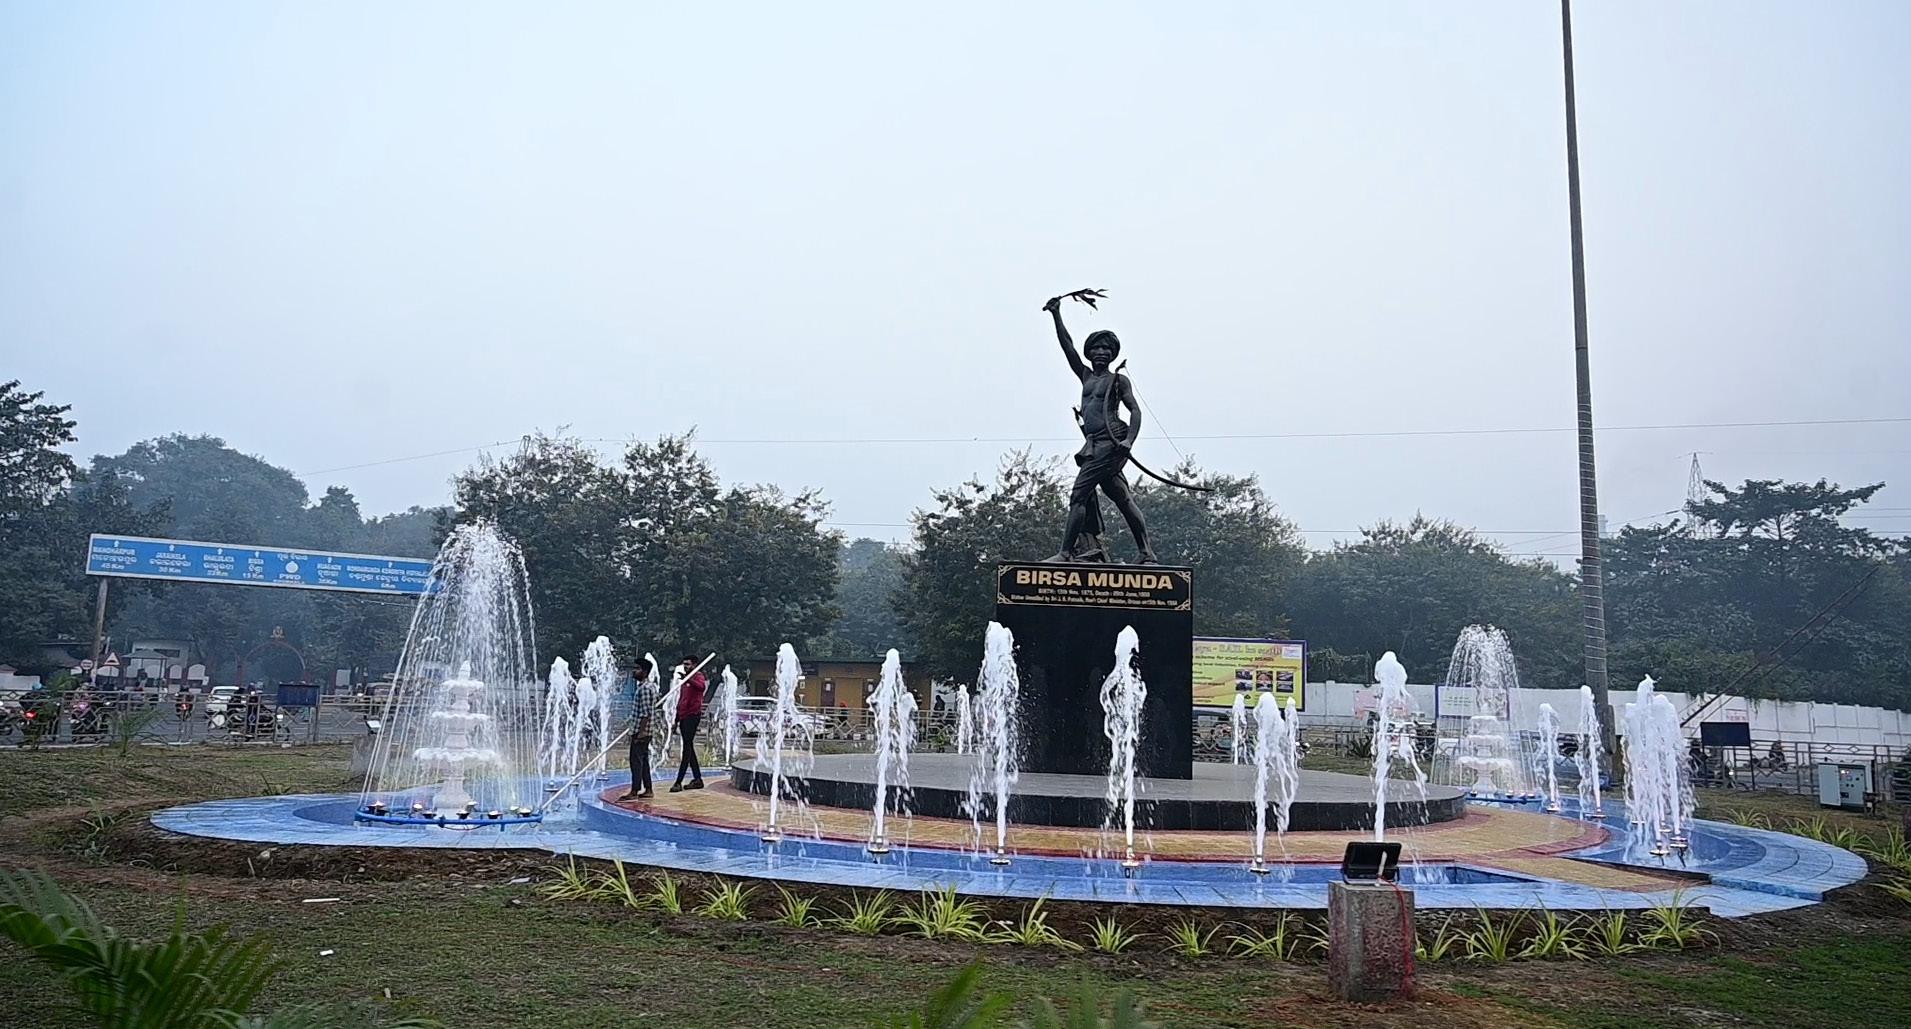
Peak-hour congestion is significant on the Municipal Chowk–Powerhouse stretch, the Bisra Square–Udit Nagar corridor, and around major commercial junctions. Birsa Munda Chowk (8,000–9,000 PCU/hour) already requires active police management. Multiple intersections like Panposh Chowk, DPS Square, and others are accident-prone,
lacking channelization, pedestrian crossings, and cycling infrastructure. On Kachehri Road, unmanaged onstreet parking reduces carriageway capacity despite total supply (503 ECS) exceeding peak demand (309.5 ECS), pointing to a management rather than supply problem.
The modal analysis and baseline assessment identify five interconnected urban mobility challenges that form the core focus of this Integrated Mobility Plan:
Missing Bicycle Infrastructure: Despite cycling accounting for 35.5% of all trips — one of India’s highest modal shares — Rourkela has no continuous, protected cycle network. Cyclists share the Ring Road with motor vehicles travelling at 40–60 km/h, and junction design offers no dedicated provision for cyclists at any surveyed location. The IMP addresses this through a citywide bicycle infrastructure plan prioritizing the Ring Road corridor and key trip-generating nodes.
Road Safety at Critical Intersections: Multiple intersections across the city are characterized by high conflict points, inadequate geometry, and a complete absence of pedestrian and cyclist infrastructure. Three intersections — Panposh Chowk, DPS Square, and Birsa Munda Chowk — have been identified as priority locations for engineering intervention, selected based on traffic volumes, crash history, and the presence of vulnerable road users.
Absence of a Micro-Bus Feeder Service: With average headways of 77 minutes and no structured feeder system, the Mo Bus network fails to serve peripheral areas and cannot compete with informal IPT for short-to-medium distance trips. A micro-bus service plan is needed to extend coverage, improve frequency on underserved corridors, and create structured last-mile connections to the formal bus network.
Parking Management on Kachehri Road: Unregulated on-street parking on Kachehri Road — the city’s primary commercial corridor — reduces effective carriageway width, creates pedestrian conflicts, and contributes to peak-hour congestion. With total supply (503 ECS) already exceeding peak demand (309.5 ECS), the challenge is one of organization and management rather than supply. The IMP develops a structured parking solution including bay demarcation, pricing strategy, and enforcement.
Low Occupancy on CRUT Bus Routes: Despite carrying 44,581 daily passengers, many CRUT routes operate at low occupancy, undermining financial viability and service quality. Potential causes include route overlaps, misaligned alignments, poor scheduling, and competition from informal IPT on the same corridors. A systematic route performance analysis will identify the root causes and recommend rationalization, frequency adjustments, and network redesign to improve occupancy and ridership.
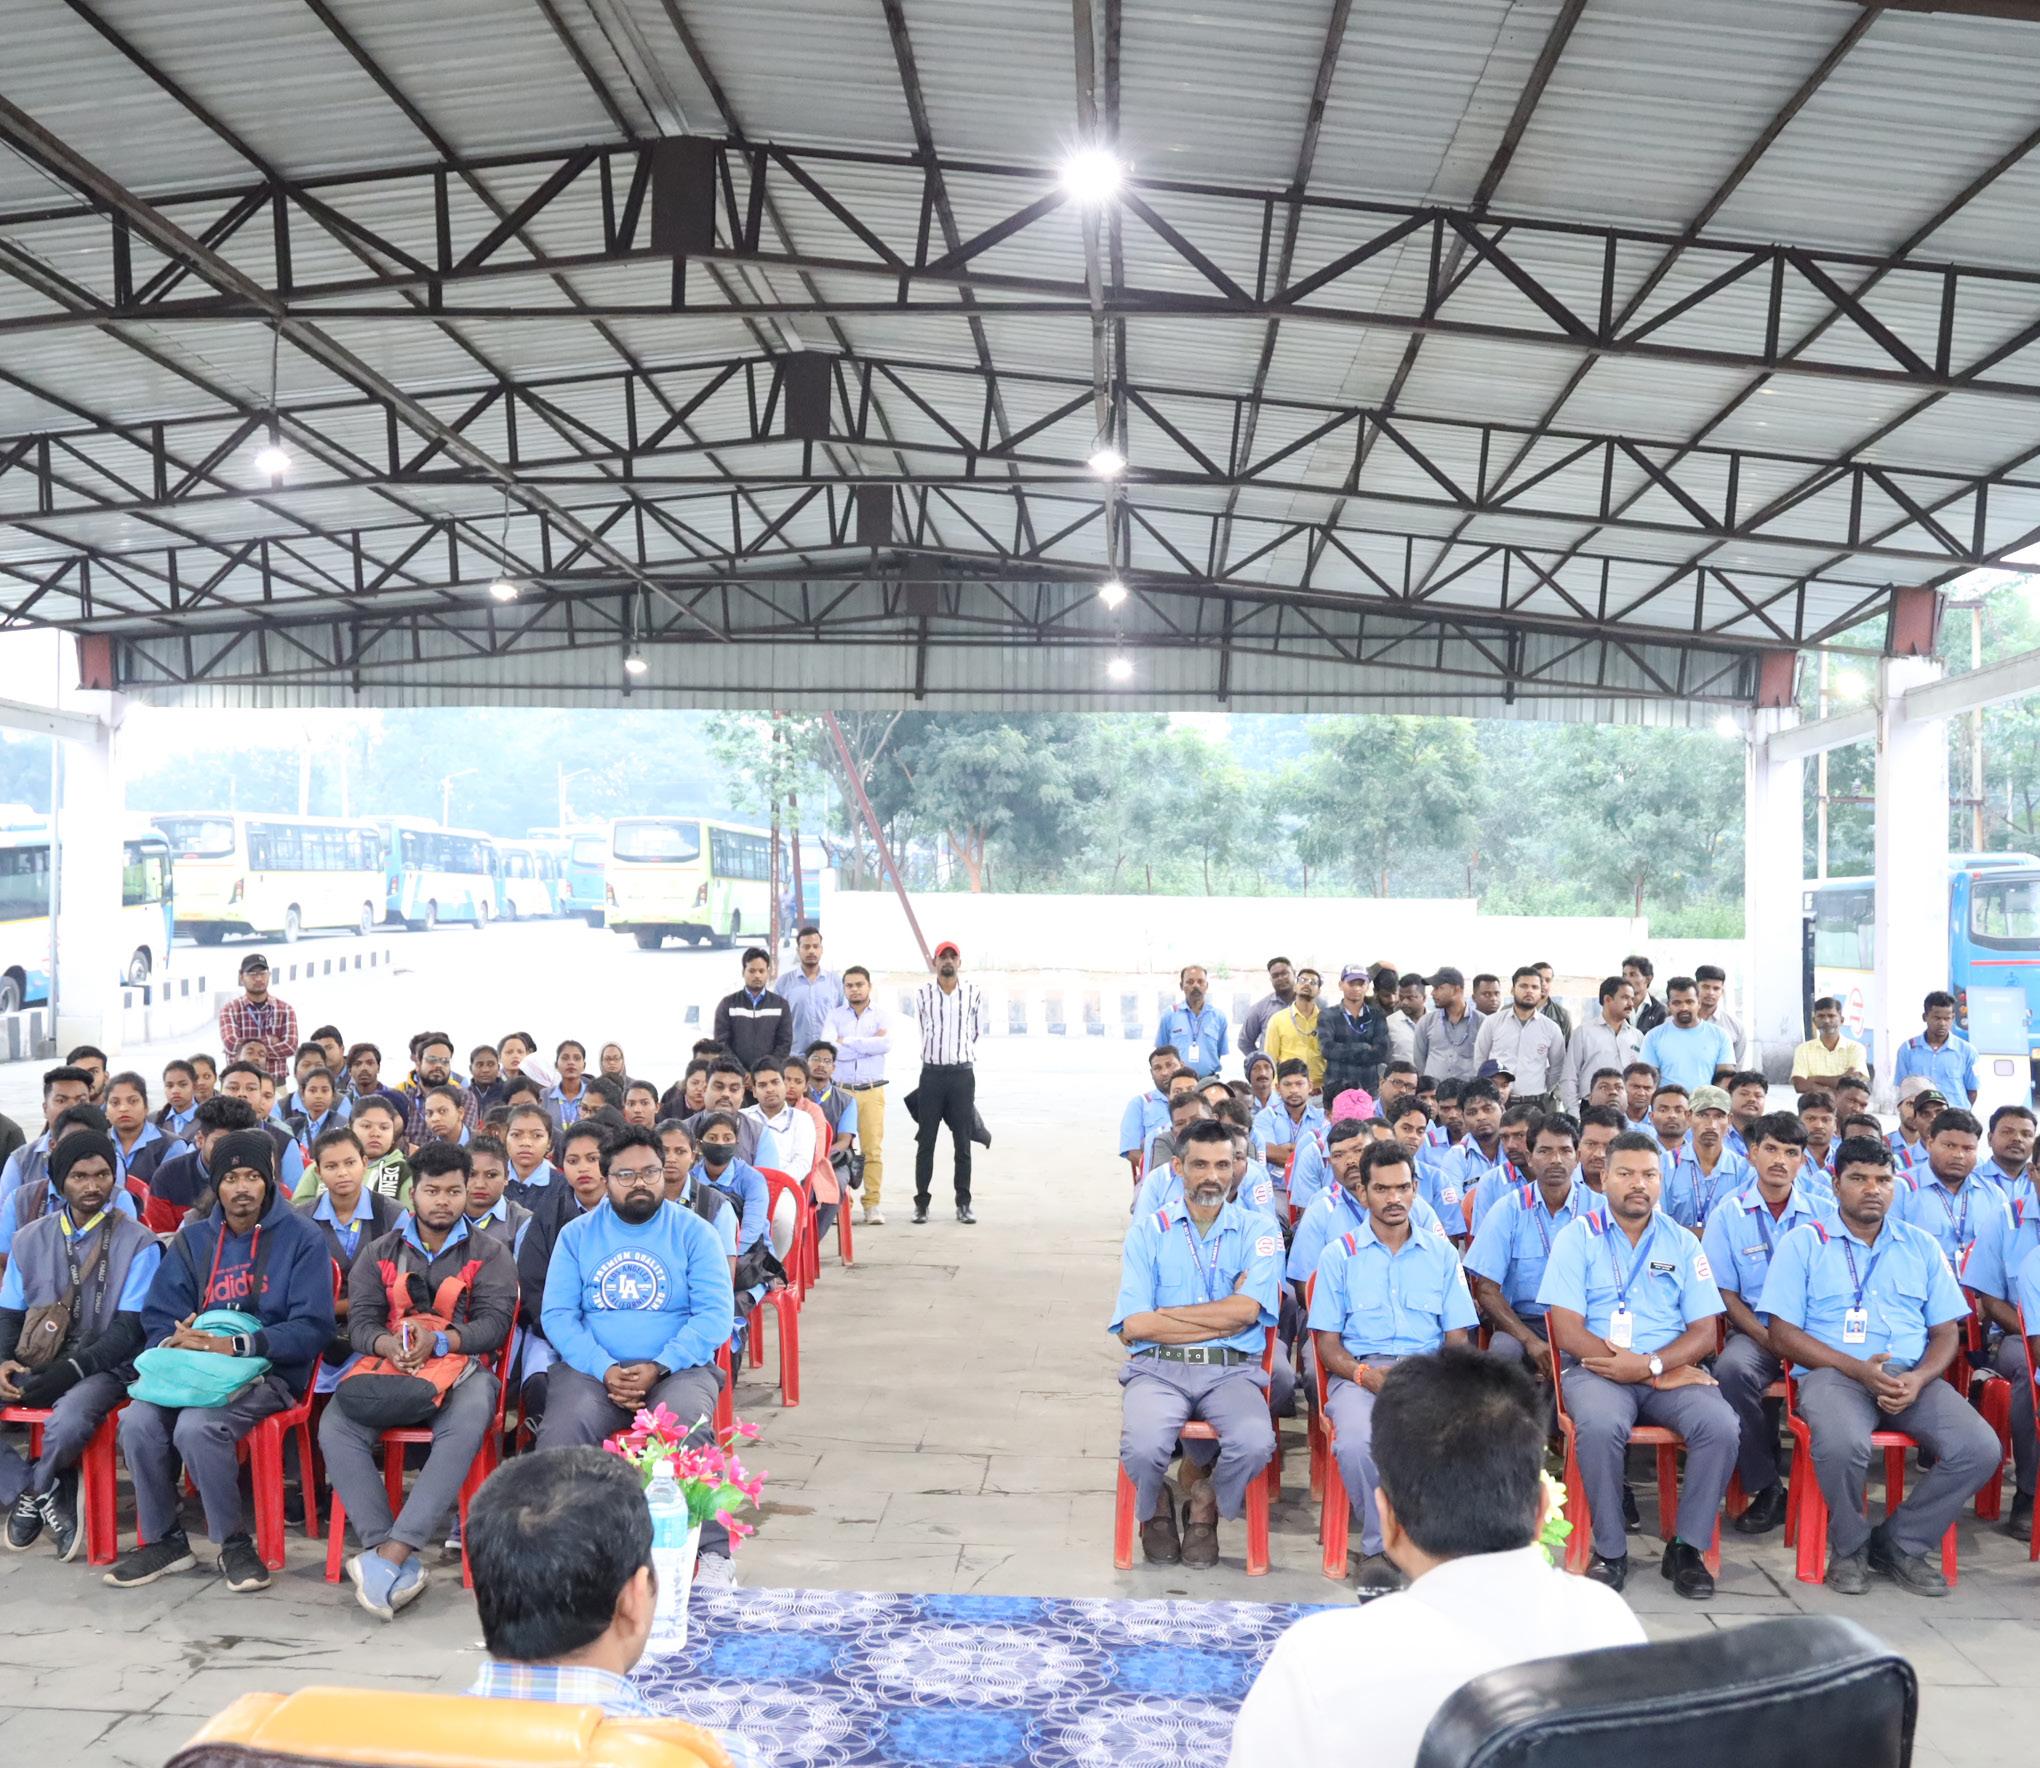
The institutional framework for the Rourkela IMP requires coordinated action across multiple agencies with complementary roles. At the strategic level, the Ministry of Housing and Urban Affairs and the Housing & Urban Development Department, Government of Odisha, provide policy direction, programme alignment, and funding support. At the city and regional level, Rourkela Municipal Corporation, Rourkela Development Authority, Capital Region Urban Transport, Rourkela Smart City Limited, Public Works Department, the Traffic Police, and the Regional Transport Office are central to planning, implementation, operations, enforcement, and corridor-level
improvements. Given the city’s industrial character, the Steel Authority of India also plays an important role in mobility planning within the Steel Township and along key access corridors. Supporting stakeholders such as utility agencies, environmental and disaster management authorities, academic institutions, private operators, civil society organisations, and local communities contribute technical inputs, service delivery, capacity building, and user perspectives. Together, this multi-agency framework is essential to reduce institutional silos, improve project coordination, and enable phased, integrated delivery of sustainable mobility interventions across Rourkela.
HIGH
LOW
Fig. 12. Stakeholders Mapping
LEGEND: STAKEHOLDER TYPE
CENTRAL GOVERNMENT
ACADEMIA/TRAINING INSTITUTION
STATE/PARASTATAL AGENCIES INTERNATIONAL AGENCIES
LOCAL GOVERNMENT
PRIVATE SECTOR
CIVIL SOCIETY/THINKTANKS
The preparation of the IMP for Rourkela followed a systematic and evidencebased approach. The methodology integrates national and international best practices while remaining grounded in Rourkela’s spatial structure, travel behaviour, institutional context, and emerging 15-Minute Neighbourhood vision. The key stages are outlined below:
1
3 5 2 4 6
Fig. 14. IMP Methodology
A comprehensive review was undertaken of city, state, and national mobility-related documents, including development plans, transport studies, NMT and parking policies, Smart City proposals, road safety strategies, and public transport initiatives.
The city’s current mobility system was evaluated using a structured pillar-based IMP framework covering multimodal integration, accessibility, safety, sustainability, governance, and land use integration.
Existing projects and policies were mapped against defined mobility pillars and performance indicators. This process highlighted missing links, institutional bottlenecks, spatial inequities, infrastructure deficiencies, and areas requiring reform or investment.
Based on identified gaps, a portfolio of strategic interventions was developed. Projects were designed to support integrated, low-carbon, and people-centric mobility, aligned with neighbourhood-level improvements and corridor-scale upgrades. Emphasis was placed on practicality, scalability, and phased implementation.
Structured consultations were conducted with key agencies, including RMC, CRUT, HUDD traffic police, and other stakeholders. Feedback was incorporated to refine proposals, ensure institutional ownership, and prioritise projects based on urgency, feasibility, and impact.
The final stage translated strategies into actionable recommendations, categorised into immediate, short-term (2–3 years), and medium-term (3–5 years) actions. Clear institutional responsibilities, sequencing logic, and measurable indicators were defined to guide implementation and monitoring.
To understand the current policy and institutional landscape shaping urban mobility in Rourkela, a review of relevant city, state, and national plans, policies, and strategic initiatives was undertaken. These documents provide important insights into the city’s planning priorities, regulatory frameworks, and ongoing
interventions related to transport, land use, climate resilience, and urban development. The following documents have been referred to for understanding Rourkela’s mobility context and for populating the IMP assessment framework.
Document / Plan
Relevance to Rourkela
City Development Plan (CDP), Rourkela
Primary statutory planning document for Rourkela. Sets out land use, infrastructure, and social development frameworks. Used to assess compact urban growth, service proximity, street network structure, and disaster risk management. Key reference for Pillars I and II.
Smart City Proposal (SCP), Rourkela
Outlines smart mobility, technology, and infrastructure interventions including ITS, adaptive signals, NMT infrastructure, and bus tracking. Used to assess digital integration, road safety (school safety proposals), and public transport parameters. Reference for Pillars II, VIII, and IX.
Mo Bus / Ama Bus Operational Data (CRUT)
Real-time and historical operational data from Capital Region Urban Transport on ridership, fleet performance, route coverage, headways, and digital ticketing. Primary source for Public & Shared Transport Systems assessment (Pillar II) and Digital Integration (Pillar IX).
Odisha Comprehensive Action Plan for Clean Air (Non-Attainment Cities)
State-level clean air policy covering Rourkela as a non-attainment city. Provides framework for air quality management and transport-related emission reductions. Reference for Climate & Environmental Sustainability (Pillar V).
National Urban Transport Policy (NUTP), MoHUA
Sets the overarching policy direction for sustainable urban mobility in India. Guides integration of land use and transport, promotion of public transport and NMT, and institutional strengthening. Provides normative benchmarks for all nine IMP pillars.
Comprehensive Mobility Plan (CMP) Toolkit, MoUD/MoHUA
Technical framework for city-level mobility planning. Defines assessment methodology, service level benchmarks, and data collection standards. Used as the methodological backbone for the IMP assessment framework.
ISOCARP Urban Planning Research – Rourkela
Academic and planning research on Rourkela’s urban form and land use-transport integration. Notes weaknesses in integration between land use planning and transport, particularly in emerging growth corridors. Referenced in Climate-Resilient & Compact Urban Growth (Pillar I).
Odisha State EV Policy and National EV Programmes (FAME I & II, PM E-Drive)
State and central government policies supporting electric vehicle adoption, charging infrastructure, and fleet electrification. Referenced in Climate & Environmental Sustainability (Pillar V) and Public Transport (Pillar II).
Stakeholder Consultations (CRUT, RMC, Traffic Police, Smart City, TA Dept, Civil Engineering officer (steel city) )
Primary source data collected through structured consultations with key city agencies. Provides ground-level evidence on accident-prone locations, parking problems, PT ridership, institutional capacity, and service gaps across all pillars.
The Integrated Mobility Plan for Rourkela is structured around a nine-pillar framework that reflects the full spectrum of urban mobility – from land-use integration and street design to public transport, safety, clean mobility, governance, and digital systems – ensuring that planning moves beyond isolated projects towards a cohesive, outcome-driven strategy. Each pillar is defined through a set of measurable parameters that guide assessment and decision-making. Together, these parameters establish a clear understanding of Rourkela’s current mobility performance, identify critical system gaps, and highlight areas where targeted interventions can deliver maximum impact.
Climate-Resilient & Compact Urban Growth
Assesses whether the city’s growth strategies integrate resilience principles, contain urban sprawl, align land use with transport investment, and protect ecological systems. Evaluates service proximity, street network connectivity, disaster risk integration, and climate mitigation targets.
Equity, Inclusion & Informal Sector
Evaluates access to public transport for low-income communities, availability and integration of intermediate public transport (IPT), street vending policies, and accessibility provisions for persons with disabilities.
The nine pillars of the IMP Assessment Framework are:
Governance, Financing & Monitoring Public & Shared Transport Systems
Assesses institutional structures (UMTA/SPV), sustainable revenue mechanisms, land value capture tools, data monitoring systems, stakeholder coordination platforms, and institutional capacity in transport planning.
Evaluates the quality, coverage, frequency, and reliability of the formal public transport network (bus-based, BRT, metro). Includes assessment of affordability, gender and safety measures, physical multimodal integration, real-time information, and commuter-responsive service planning.
Active Mobility (Walking & Cycling)
Assesses the continuity and connectivity of walking and cycling infrastructure, universal accessibility provisions, street lighting coverage, and personal security. Evaluates whether NMT infrastructure is adequate to support the city’s existing high modal share for non-motorised travel.
Assesses the share of lowemission vehicles in the public fleet, renewable energy integration at transport facilities, air quality management linkages, emission compliance, and climate-resilient infrastructure design.
Climate & Environmental Sustainability Road Safety
Evaluates road fatalities and serious injuries, black spot identification and treatment rates, school safety provisions, speed management, and the existence of a target-based safety framework.
Parking & Travel Demand Management
Evaluates the existence and effectiveness of demand-based parking policies, dynamic pricing mechanisms, digital enforcement systems, and fiscal or regulatory instruments to restrain private vehicle use.
Digital Integration
Assesses policy readiness for digital data sharing, the existence and adoption of unified digital platforms (MaaS), open data availability (GTFS/APIs), and digital travel behaviour among public transport users.
Each parameter within the nine pillars is scored on a scale of 1 to 5, where a score of 1 reflects limited or no policy/ infrastructure presence, 3 indicates partial implementation or moderate performance, and 5 represents full, systemically integrated, and wellmonitored delivery. Scores are
aggregated at the pillar level to produce a normalised dimension score (0–1), providing a comparative snapshot of Rourkela’s mobility system strengths and gaps. The figure below illustrates the nine pillars and their component parameters.
To translate the nine pillars into a measurable planning framework, Rourkela’s mobility system was assessed through a structured, indicator-based evaluation approach. Each pillar is defined through a set of carefully selected parameters that reflect infrastructure readiness, service quality, institutional capacity, safety performance, environmental impact, and digital maturity. These parameters were assigned appropriate weightages
based on their relevance to Rourkela’s urban form, travel behaviour, and policy priorities. The city’s performance was then evaluated against each indicator using a combination of secondary research, departmental data, field observations, and stakeholder consultations. This approach enables an objective assessment of current conditions and identifies critical gaps and strengths across the mobility ecosystem.
Rourkela’s performance under ClimateResilient; Compact Urban Growth reflects a city with a structured physical foundation but limited policy operationalisation. Developed around the Steel Plant as a planned industrial township, the city has a sector-based layout with defined residential and industrial zones. However, compact growth principles are not actively integrated into current planning frameworks. CDP proposals on watershed management and ecological
protection remain unimplemented, and there is no mechanism to manage urban sprawl as the city expands into 52 surrounding villages. While the CDP and Smart City Proposal acknowledge mobility-land use linkages, actual integration of transport planning with development controls remains weak and fragmented. Service proximity planning exists in intent but lacks quantified coverage assessments.
• Planned Sector-Based Urban Structure: Rourkela’s industrial township model provides a structured spatial foundation with defined residential sectors, reducing sprawl within the planned core.
• CDP & SCP Include Mobility Provisions: The City Development Plan and Smart City Proposal acknowledge bus routes, NMT infrastructure, adaptive signals, and ITS systems, demonstrating policy intent.
• Road Hierarchy Defined: The CDP outlines a clear arterial-sub-arterial-collector road hierarchy that provides a basis for structured network planning.
• Flood & Emergency Planning Acknowledged: The CDP integrates flood management and drainage planning with emergency access considerations as part of city-level risk planning.
• Initial EV and Clean Mobility Intent: Policy statements promote electric vehicles, NMT, and emission reduction goals as part of sustainability commitments.
• No Active Compact Growth Policy: There is no evidence of current policies actively discouraging unsustainable outward expansion or managing sprawl into peripheral villages.
• Weak Land Use-Transport Integration: ISOCARP research and field evidence indicate that land use and transport integration is not fully aligned with growth areas such as the airport development zone.
• Unquantified Service Proximity: Educational and healthcare facilities are planned within walkable distances, but there is no quantified assessment of actual population coverage within 1 km walking thresholds.
• Limited Peripheral Connectivity: Road connectivity is uneven, with gaps in peripheral areas and limited bus penetration into local and collector streets.
• Absent Transport-Climate Monitoring Framework: No transport emissions baseline, carbon budget, or measurable reduction targets have been defined for the city
Rourkela’s public transport system, operated by Capital Region Urban Transport (CRUT) under the Mo Bus/ Ama Bus framework, provides a formal backbone for urban mobility across approximately 25 routes with a fleet of around 100 buses. The system carries nearly 44,500 daily passengers and has adopted real-time tracking through the Ama Bus mobile application. CRUT undertakes regular route rationalisation based on ridership data, reflecting institutionalised commuter
responsiveness. However, the system is significantly underutilised relative to its potential. Service headways average approximately 77 minutes across the network, peripheral coverage remains uneven, and no formal affordability framework benchmarks fare costs against household income. Gendersensitive measures and physical multimodal integration are limited, and the absence of structured micro-bus or feeder services constrains last-mile connectivity.
• Formal PT Network Operational: CRUT operates approximately 25 routes with ~100 buses providing structured public transport coverage across major corridors.
• Real-Time Passenger Information Available: The Ama Bus application provides realtime bus tracking and journey planning support for commuters.
• Commuter-Responsive Planning: CRUT undertakes regular route rationalisation and service adjustments based on ridership data, operational performance, and passenger feedback.
• Digital Ticketing Integration: The system supports digital ticketing through the CRUT app, smart cards, and WhatsApp-based services, enabling cashless transit.
• Network Coverage on Major Corridors: A substantial share of the population lives within 500 m of bus stops along key Mo Bus corridors in the planned urban areas.
• Very Low Service Frequency: Average headways of approximately 77 minutes across the network are far above the acceptable threshold, severely limiting attractiveness of public transport.
• Low Ridership Relative to Demand: With ~44,500 daily passengers, formal public transport accounts for only about 5.5% of modal share despite the city’s cycling and walking culture.
• Uneven Spatial Coverage: Peripheral wards, newly urbanising areas, and low-density settlements face significant service gaps and unreliable connectivity
• No Formal Affordability Framework: There is no documented benchmarking of PT costs as a percentage of household income, particularly for the bottom 40% of earners.
• Limited Gender & Safety Measures: No comprehensive, monitored genderresponsive system is in place, with no dedicated women’s helpline, structured safety features, or disaggregated safety data.
• Weak Physical Multimodal Integration: Major nodes lack fully designed multimodal interchange facilities integrating buses, auto-rickshaws, and pedestrian access.
Rourkela exhibits one of the highest cycling modal shares among Indian cities — with cycling accounting for 35.7% of trips in Census 2011 data and 5.8% in the 2026 Peak Hour Survey — alongside a stable walking share of approximately 24.2–24.6% across both datasets. This represents a nationally significant strength in sustainable mobility culture. However, the physical infrastructure supporting these modes is critically inadequate. Where footpaths exist, they are built at approximately 230 mm above carriageway level, exceeding standard
norms, and are largely encroached upon, rendering them functionally unusable. Cycle tracks are absent on almost all corridors. No surveyed junction provides raised crossings, refuge islands, or pedestrian signal phasing. Street lighting coverage falls below 40% when assessed across the full road network, including peripheral areas, local streets, and unplanned settlements. The gap between the city’s exceptional NMT demand and the level of infrastructure support is the defining challenge of the Rourkela IMP.
• Highest Cycling Modal Share Among Indian Cities: Cycling constitutes 35.7% of trips (Census 2011), one of the highest among Indian cities, representing a strong cultural and behavioural foundation for NMT investment.
• Stable Walking Share Across Both Datasets: Walking accounts for 24.2% (Census 2011) and 24.6% (2026 Peak Hour Survey), with the CDP recording up to 45.4% when including intra-sector movement, reflecting high pedestrian activity across trip purposes.
• High Observed Cyclist Volumes at Key Junctions: Junction surveys confirm over 1,350 cyclists per peak hour at major nodes including Space Square, Birsa Munda Chowk, and Hanuman Vatika, confirming active demand even in the absence of infrastructure.
• Short Trip Distances in Core Areas: Approximately 15% of trips fall within 0–1 km and high-density areas around the Steel Plant, railway station, and central sectors are compact, making them highly suitable for NMT investment.
• Continuity & Connectivity Score (1–5): 2 — Rourkela has very low continuity of active mobility infrastructure. Footpaths, where present, are built at approximately 230 mm above carriageway level and are largely encroached, rendering them functionally unusable. Cycle tracks are absent on almost all corridors, with less than 30% network continuity.
• Universal Access Score (1–5): 1 — There is no evidence of formal universal accessibility guidelines being issued or actively implemented by road-owning agencies. No systematic provision or enforcement of barrier-free features (ramps, tactile paving, dropped kerbs) exists citywide.
• Personal Security Score (1–5): 1 — Street lighting coverage falls below 40% across the full road network when peripheral areas, local streets, and unplanned settlements are included. There is no systematic, data-based assessment of lighting continuity or personal security, particularly for women walking at night.
• No Intersection Safety Treatments for Cyclists and Pedestrians: No surveyed junction in Rourkela provides raised crossings, refuge islands, or pedestrian-priority signal phasing. Cyclists share the Ring Road with motor vehicles travelling at 40–60 km/h with no dedicated provision at any surveyed location.
• Risk of Permanent NMT Modal Loss: Mode shift analysis indicates approximately 69,562 daily cycling trips lost since 2011 relative to population growth, replaced by threewheelers and buses. Without infrastructure investment, Rourkela risks permanently losing its most significant sustainable mobility advantage.
• No Citywide NMT Network Plan: No planned, continuous cycling and walking network exists to guide prioritised corridor-level investment or connect key trip generators such as the Steel Plant, NIT Rourkela, railway station, and major residential sectors.
Rourkela demonstrates limited institutionalised progress in embedding equity across its mobility ecosystem. While IPT services — auto-rickshaws and e-rickshaws — are widely available across the city, they operate entirely informally: unregulated, non-appintegrated, and without standardised safety, service, or reliability frameworks. With approximately 12,900 registered autorickshaws, IPT fills critical last-mile gaps but remains entirely outside any formal planning or coordination structure. Formal public transport access in informal settlements is unmapped, with no
coverage assessment or service quality indicator for low-income communities. Street vending remains informal with limited designated zones and weak integration with pedestrian infrastructure, resulting in encroachments and pedestrian-vehicle conflicts. Accessibility for persons with disabilities is critically low: city buses carry no accessibility features, and while some bus queue shelters and terminals include basic ramps and tactile elements, these are not standardised across most of the bus stops citywide.
• IPT Services Widely Available: Approximately 12,900 registered auto-rickshaws and a growing fleet of e-rickshaws provide substantial last-mile connectivity across the city, serving areas not covered by formal Mo Bus routes.
• Structured Bus Services in Core Areas: The Mo Bus network connects major employment centres, commercial areas, and residential sectors along 25 routes, providing a formal PT backbone accessible to core-area residents.
• Local Knowledge of Informal Settlement Needs: Stakeholder consultations indicate awareness of transport access gaps in informal settlements, providing a basis for targeted interventions through the IMP.
• Growing E-Rickshaw Penetration: Electric rickshaws are increasingly available, providing an affordable and relatively lower-emission intermediate public transport option.
• Partial Accessibility Infrastructure at Some Stops: Some bus queue shelters and terminals include basic ramps and tactile paving elements, indicating initial intent toward accessible infrastructure.
• Low-Income Access Score (1–5): 2 — While some informal settlements have proximate access to IPT and limited bus connectivity, there is no mapped coverage, service quality assessment, or formal indicator tracking equitable transport access for low-income communities.
• Alternative Mobility Score (1–5): 1 — Auto and e-rickshaws are largely unregulated, with no app-based integration, route standardisation, or safety and service certification framework, indicating the complete absence of a structured and inclusive IPT system.
• Street Vendors & Informal Use Policy Score (1–5): 1 — There is no comprehensive street vending policy in practice. Vending remains largely informal with limited designated zones and weak integration with pedestrian infrastructure, causing encroachments and pedestrian-vehicle conflicts.
• Accessibility for Differently Abled Score (1–5): 1 — City buses are not equipped with accessibility features. While some bus queue shelters and terminals have basic ramps and tactile elements, accessibility infrastructure is absent at the majority of bus stops and is not standardised across the network.
• No Gender-Disaggregated Mobility Data: There is no systematic data collection or monitoring of mobility experiences of women, girls, or other vulnerable groups, preventing evidence-based gender-responsive planning.
• No Formal Mapping of PT Access in Informal Settlements: There is no systematic assessment of transport coverage or service quality in informal or low-income neighbourhoods, leaving these communities outside structured mobility planning.
Rourkela’s performance under Climate & Environmental Sustainability reflects a city in the very early stages of a clean mobility transition, with policy intent not yet matched by measurable implementation. The city is included in Odisha’s Comprehensive Action Plan for Clean Air for Non-Attainment Cities, and national BS VI norms apply to all newly registered vehicles from April 2020 — meaning approximately 27.26% of the total registered vehicle fleet now meets BS VI standards. However, there is no city-specific transport emissions inventory, no quantified low-emission fleet data, and no evidence of renewable energy integration at any transport depot,
station, or terminal. Climate-resilient design of transport infrastructure has not been systematically embedded, despite Odisha Cabinet approval for a 500 km state disaster-resilient roads programme. Air quality management remains at the policy framework stage with no city-level low-emission zones, pedestrianisation linked to hotspot areas, or mobility plan interventions targeting CPCB-identified non-attainment conditions. Rourkela’s high cycling and walking modal shares represent a significant latent advantage for low-emission mobility — one that requires infrastructure investment to be preserved.
• Covered Under State Clean Air Action Plan: Rourkela is included in Odisha’s Comprehensive Action Plan for Clean Air for Non-Attainment Cities, providing a statelevel policy framework for air quality improvement linked to transport.
• Progressive BS VI Fleet Compliance: National BS VI norms, effective April 2020, apply to all newly registered vehicles. Approximately 27.26% of Rourkela’s total registered vehicle fleet is now BS VI compliant, with share growing as older vehicles are retired.
• High NMT Modal Share as Inherent Low-Emission Advantage: Cycling (35.7% Census 2011) and walking (~24%) together account for nearly 60% of all trips, representing a significant inherent advantage for low-emission mobility that most Indian cities have already lost.
• State-Level Disaster Resilience Policy Signal: Odisha Cabinet approval for a 500 km disaster-resilient roads programme signals growing state-level intent to embed climate resilience into transport infrastructure investment.
• Low-Emission Public Fleet Share Score (1–5): 1 — There is no clear, quantified data on the share of low-emission vehicles in Rourkela’s public transport or municipal fleet. No electrification plan, EV procurement programme, or fleet transition target is documented in the CDP or any operational framework.
• Renewable Integration Score (1–5): 1 — There is no evidence of renewable energy integration at transport depots, bus terminals, or stations. No rooftop solar, solar carport, or storage-integrated power system has been documented at any CRUT or RMC transport facility in Rourkela.
• Air Quality Integration Score (1–5): 1 — While Rourkela is covered by the state Comprehensive Action Plan for Clean Air, mobility plans and interventions do not incorporate air quality considerations. No low-emission zones, vehicular restrictions near hotspots, or pedestrianisation linked to CPCB non-attainment areas have been implemented or proposed.
• Emission Compliance & Congestion Score (1–5): 2 — Approximately 27.26% of the registered vehicle fleet meets BS VI standards (Parivahan data), reflecting the relatively recent April 2020 rollout. The remaining ~72.74% of the fleet predates BS VI, contributing disproportionately to particulate and NOx emissions, particularly at congested intersections such as DAV Chowk, Hanuman Vatika, and Ambedkar Chowk.
• Resilient Infrastructure Score (1–5): 1 — Systematic integration of climate-resilient design across transport corridors, depots, and terminals is limited and not yet embedded in project standards. No transport infrastructure in Rourkela is documented as having been designed or retrofitted to withstand flooding, heat waves, or other climate shocks.
• No City-Level Transport Emissions Inventory: No transport GHG baseline, carbon monitoring framework, or measurable emission reduction targets have been established for Rourkela. Without this, climate progress cannot be tracked or reported.
Parking and travel demand management represent the weakest performing pillar in Rourkela’s mobility assessment. Parking issues are widely recognised, particularly along commercial stretches such as Kachehri Road, but there is no formal parking policy, no demand-based pricing, and no structured management framework. On-street parking remains largely unregulated, contributing to congestion and reduced pedestrian space. No fiscal or regulatory instruments for private vehicle restraint, such as congestion pricing or low-emission zones, have been implemented or proposed. The city lacks the institutional infrastructure to shift from supplyoriented to demand managementoriented approaches.
• Stakeholder Recognition of Parking Problems: Issues related to on-street parking and encroachments on Kachehri Road, and central commercial areas are widely acknowledged, creating a platform for action.
• Smart City Infrastructure Available: Smart City Proposal provisions provide a potential technical backbone for digital parking management and enforcement systems.
• No Formal Parking Policy: Parking remains entirely unregulated with no structured management, dynamic pricing, digital enforcement, or demand-based policy framework.
• No Private Vehicle Restraint Instruments: No congestion pricing, levy systems, low-emission zones, or regulatory tools to discourage private vehicle use have been proposed or implemented.
• On-Street Parking Reducing Road Capacity: Unmanaged on-street parking on key corridors such as Kachehri Road significantly reduces effective carriageway width and increases congestion.
• No Revenue Reinvestment Mechanism: No framework exists to reinvest parking revenues into public transport or NMT improvement.
• No Data on Parking Demand or Supply: Comprehensive parking inventory data is not available to guide evidence-based policy design.
Rourkela’s governance framework benefits from the presence of CRUT as a dedicated SPV with statutory backing and operational autonomy, providing structural clarity in public transport planning. Regular inter-institutional coordination occurs between CRUT, Rourkela Municipal Corporation (RMC), Smart City, Traffic Police, and state agencies. However, financing
mechanisms remain fragile, with no ring-fenced transport funds and limited sustainable revenue streams. Land value capture mechanisms are absent, and institutional capacity in transport planning is undocumented. A public mobility dashboard with citywide KPIs is not yet available, and multi-stakeholder coordination platforms with citizens remain informal.
• CRUT as Dedicated SPV: CRUT provides statutory backing, operational autonomy, and a clear mandate for planning and operating public transport across the region.
• Regular Inter-Agency Coordination: CRUT, RMC, Smart City, Traffic Police, and state agencies coordinate regularly on mobility and transport matters.
• ITS-Based Operational Monitoring: CRUT tracks ridership, service reliability, fleet performance, and digital ticketing through internal ITS/ITMS systems.
• Digital Ticketing Ecosystem: Ama Bus app, smart cards, and WhatsApp ticketing provide a functional digital payments and ticketing infrastructure.
• No Ring-Fenced Urban Transport Fund: Long-term financial sustainability for PT and NMT is not secured through dedicated, predictable revenue streams.
• No Land Value Capture or TOD Financing: No evidence of land-based instruments to finance mobility infrastructure investment or support TOD.
• No Public Mobility Dashboard: A transparent, citywide mobility dashboard with publicly accessible KPIs is not in place.
• Limited Institutional Capacity in Transport Planning: No documented evidence that staff possess sufficient specialised expertise in urban transport planning across responsible agencies.
• Informal Multi-Stakeholder Coordination: Periodic, structured multi-stakeholder platforms with citizens and operators are not institutionalised.
• Dependence on Project-Based and State Funding: Revenue streams are not structurally secured and rely heavily on state support and ad-hoc project grants.
Road safety remains a significant concern in Rourkela. Accident-prone locations have been identified through stakeholder consultations, with multiple critical intersections such as Bisra Chowk, Panposh Chowk, Hi-Tech Chowk, DAV Chowk, Hanuman Vatika, and Ambedkar Chowk characterised by high conflict points, mixed traffic, and inadequate geometric design. While the Odisha government identifies black spots
and undertakes corrective measures at the state level, no disaggregated, city-specific crash data or black spot treatment tracking system is publicly available. School safety interventions are at the proposal stage under the Smart City Proposal but have not been systematically implemented. Road safety planning remains reactive rather than outcome driven.
• State-Level Black Spot Identification: The Odisha government identifies road crash black spots and undertakes corrective measures, providing a framework for city-level action.
• Critical Intersections Identified: Stakeholder consultations have identified specific accident-prone intersections in Rourkela, enabling targeted safety interventions.
• Smart City Safety Proposals: School safety interventions and related proposals are included in the Smart City Proposal, indicating planning intent.
• Traffic Police Engagement: Regular coordination between CRUT, RMC, and Traffic Police provides an institutional basis for safety planning.
• No Disaggregated City-Specific Crash Data: No publicly available, disaggregated road safety data for Rourkela exists, making evidence-based safety planning difficult.
• No Black Spot Treatment Tracking: There is no clear evidence of systematic tracking of treated vs. untreated high-risk locations within the city boundary.
• No Vision Zero or Target-Based Safety Framework: No measurable, time-bound fatality reduction strategy exists for Rourkela.
• Inadequate Intersection Geometry: Multiple critical intersections lack proper channelisation, pedestrian crossings, and traffic calming measures.
• Weak Speed Management on Arterials: High operating speeds on major roads increase crash severity at intersections and along corridors.
• School Safety Measures Not Implemented: Safe Access to School interventions remain at the proposal stage with no documented implementation.
Rourkela demonstrates moderate digital integration foundations through the CRUT/Ama Bus ecosystem. The Ama Bus mobile application provides real-time bus tracking and journey planning, and CRUT has registered as a digital ticket seller on the platform. Public transport trips are undertaken using digital platforms including smart cards and WhatsApp-based ticketing. However,
a unified MaaS platform integrating multiple transport modes does not exist, open data standards (GTFS/ GTFS-RT) are not publicly available, and policy readiness for mandating open data sharing across operators remains absent. Digital adoption is presentpresent, but ecosystem-level integration is incomplete.
• Ama Bus App with Real-Time Tracking: The CRUT-integrated Ama Bus application provides real-time vehicle tracking and basic journey planning for public transport users.
• Digital Ticketing Available: Smart cards, the CRUT mobile app, and WhatsApp-based ticketing provide multi-channel digital payment access.
• Moderate Digital Adoption: Public transport users in Rourkela actively use digital platforms for ticketing and tracking, indicating reasonable user readiness.
• CRUT Registered as Digital Ticket Seller: Integration of CRUT into the Ama Bus digital ecosystem establishes a basis for wider digital mobility development.
• No Unified MaaS Platform: There is no integrated, multimodal journey planning and fare integration system covering buses, IPT, and other modes.
• No Open Data Ecosystem: GTFS/GTFS-RT feeds and open APIs are not publicly available for third-party app development or research use.
• No Enabling Policy for Digital Data Sharing: No policy or regulatory framework mandates open data standards, interoperability, or digital payment integration across operators.
• No Public Mobility Dashboard: Citizens lack access to performance metrics on reliability, ridership, or emissions for the city’s transport network.
To present a consolidated view of Rourkela’s mobility performance, the city was assessed across the nine pillars of the Integrated Mobility Framework using a weighted, indicator-based scoring methodology. Each pillar was evaluated based on policy readiness, institutional capacity, infrastructure coverage, service quality, and implementation maturity.
The resulting scores are normalised on a scale of 0 to 1, where higher values indicate stronger system readiness and delivery capability. The composite assessment provides a structured snapshot of strengths, gaps, and priority areas, forming the analytical foundation for projects under the Rourkela IMP.
Integration
& Travel Demand Management
Resilient & Compact Urban Growth
Governance, Financing & Monitoring Equity, Inclusion & Informal Sector
From the assessment, Rourkela demonstrates its strongest performance in Digital Integration (0.55), driven by the Ama Bus digital ecosystem, CRUT’s real-time tracking systems, and high digital travel behaviour among public transport users. Public & Shared Transport Systems (0.54) reflects the presence of a structured Mo Bus network under CRUT, with commuter-responsive planning, reasonable network coverage, and an affordable fare structure – though
service frequency, physical multimodal integration, and gender-safety measures remain weak. Climate-Resilient & Compact Urban Growth (0.53) benefits from the city’s planned sector-based urban structure and relative service proximity of essential services, though compact growth policies and transport-climate monitoring remain absent. Road Safety (0.40) reflects a moderate institutional base for black spot identification but no systematic
treatment tracking or target-based safety framework. Governance, Financing & Monitoring (0.33) is supported by CRUT’s SPV mandate but constrained by the absence of ring-fenced transport funds and specialised institutional capacity. However, Rourkela’s most critical structural gaps are evident in Parking & Travel Demand Management (0.20), which scores the lowest of all pillars, reflecting the complete absence of parking policy, demand management tools, and vehicle restraint mechanisms. Climate & Environmental Sustainability (0.24) reveals the lack of any transport emissions inventory, renewable energy integration at transport facilities, and nonexistent air quality management linkages in mobility planning. Active Mobility (0.27) is particularly alarming given the city’s exceptional cycling modal share – with footpath and cycle track continuity below 30%, no universal accessibility guidelines being implemented, and inadequate personal security on peripheral streets,
the absence of infrastructure puts Rourkela’s NMT heritage at serious risk. Equity, Inclusion & Informal Sector (0.25) highlights persistent gaps in accessible transport for persons with disabilities, unregulated and non-app-integrated IPT services, and the absence of street vending policy implementation.
Overall, the assessment underscores a city whose sustainable mobility culture is a significant asset that is not yet backed by commensurate infrastructure investment, policy frameworks, or institutional capacity. The IMP must prioritise translating Rourkela’s existing NMT modal share into a durable, infrastructure-supported system, while simultaneously addressing the critical gaps in public transport frequency, parking management, road safety, and environmental sustainability.
The assessment of the nine mobility pillars for Rourkela reveals a city with an exceptional sustainable mobility foundation — anchored by one of India’s highest cycling and walking modal shares — but constrained by critical gaps in infrastructure, service quality, governance, and demand management. Comparatively stronger performance is observed in Digital Integration (0.55), Public & Shared Transport Systems (0.54), and Climate-Resilient & Compact Urban Growth (0.53), reflecting CRUT’s operational backbone, the Ama Bus digital ecosystem, and the city’s planned sector-based structure.
However, critical structural gaps are concentrated in Parking & Travel Demand Management (0.20), Climate & Environmental Sustainability (0.24), Active Mobility (0.27), and Equity, Inclusion & Informal Sector (0.25). Despite existing policy intent and basic services, gaps remain in infrastructure, institutional capacity, and outcomes especially for the city’s NMT culture, environmental sustainability, and inclusive mobility.
Based on this strategic assessment, the IMP defines the following priority goals for sustainable urban mobility in Rourkela:
Goal 1: Protect and Strengthen Rourkela’s Non-Motorised Transport Culture
Maintain cycling and walking as the dominant modes of travel by providing a safe, continuous, and connected bicycle infrastructure network on the Ring Road corridor, protecting and growing Rourkela’s exceptional NMT modal share of 60%+.
Goal 2: Improve Road Safety at Critical Intersections
Redesign three priority accident-prone intersections like Panposh Chowk, DPS Square, and Birsa Munda Chowk to modern IRC-compliant roundabout standards, eliminating unprotected conflict points and providing safe pedestrian and cyclist infrastructure for the city’s most vulnerable road users.
Goal 3: Strengthen Public Transport Through Micro-Bus Integration
Develop a structured micro-bus feeder service plan connecting underserved residential sectors to the Mo Bus network and conduct a systematic route performance analysis to identify and address the root causes of low occupancy on CRUT bus routes — improving public transport attractiveness and growing modal share from 5.5% toward 13%.
Goal 4: Introduce Structured Parking and Travel Demand Management
Implement a comprehensive parking solution and management plan for Kachehri Road, including organised parallel parking bays, demand-based pricing, and enforcement — generating sustainable revenue for reinvestment in public transport and non-motorised infrastructure while restoring carriageway capacity and pedestrian safety.
Goal 5: Strengthen Public Transport Through Route Optimisation
Improve CRUT’s operational effectiveness and data-driven planning capability through systematic route performance monitoring, open data publication, and the development of a public mobility dashboard with key performance indicators — building the institutional and governance foundations required for long-term, evidence-based delivery of the Rourkela IMP.
The assessment of the nine mobility pillars for Rourkela reveals a city with a distinctive sustainable mobility foundation – characterised by exceptionally high cycling and walking modal shares – but facing systemic gaps in infrastructure, service quality, governance, and demand management. While several institutional structures are reasonably established through CRUT and existing planning frameworks, significant deficiencies persist in key areas that directly constrain the city’s ability to build on its NMT culture and transition toward a more integrated, safe, and efficient mobility system.
Rourkela demonstrates comparatively stronger performance in Digital Integration (0.55) and Public & Shared Transport Systems (0.54), driven by CRUT’s commuter-responsive planning, the Ama Bus digital ecosystem, high digital travel behaviour adoption, and reasonable network coverage. ClimateResilient & Compact Urban Growth (0.53) benefits from the city’s planned sector-based structure and service proximity. Moderate performance is observed in Road Safety (0.40) and Governance, Financing & Monitoring
(0.33). However, critical structural gaps are concentrated in Parking & Travel Demand Management (0.20), Climate & Environmental Sustainability (0.24), Active Mobility (0.27), and Equity, Inclusion & Informal Sector (0.25). Despite policy intent and basic services in several dimensions, gaps remain in infrastructure, institutional capacity, and outcomes — especially for the city’s NMT culture, environmental sustainability, and inclusive mobility.
The following gap assessment covers all nine pillars of the IMP framework. For each pillar, key indicators and their scores are presented alongside the identified gaps, current situation, consequences if unaddressed, and the specific intervention required. The gaps emerge directly from the pillar-bypillar assessment in Chapter 4 and from structured stakeholder consultations with CRUT, RMC, Traffic Police, Rourkela Smart City Limited, and RDA. Gaps are structured to address both the five priority interventions delivered under SUM-ACA as well as the broader systemic challenges requiring mediumto long-term policy reform.
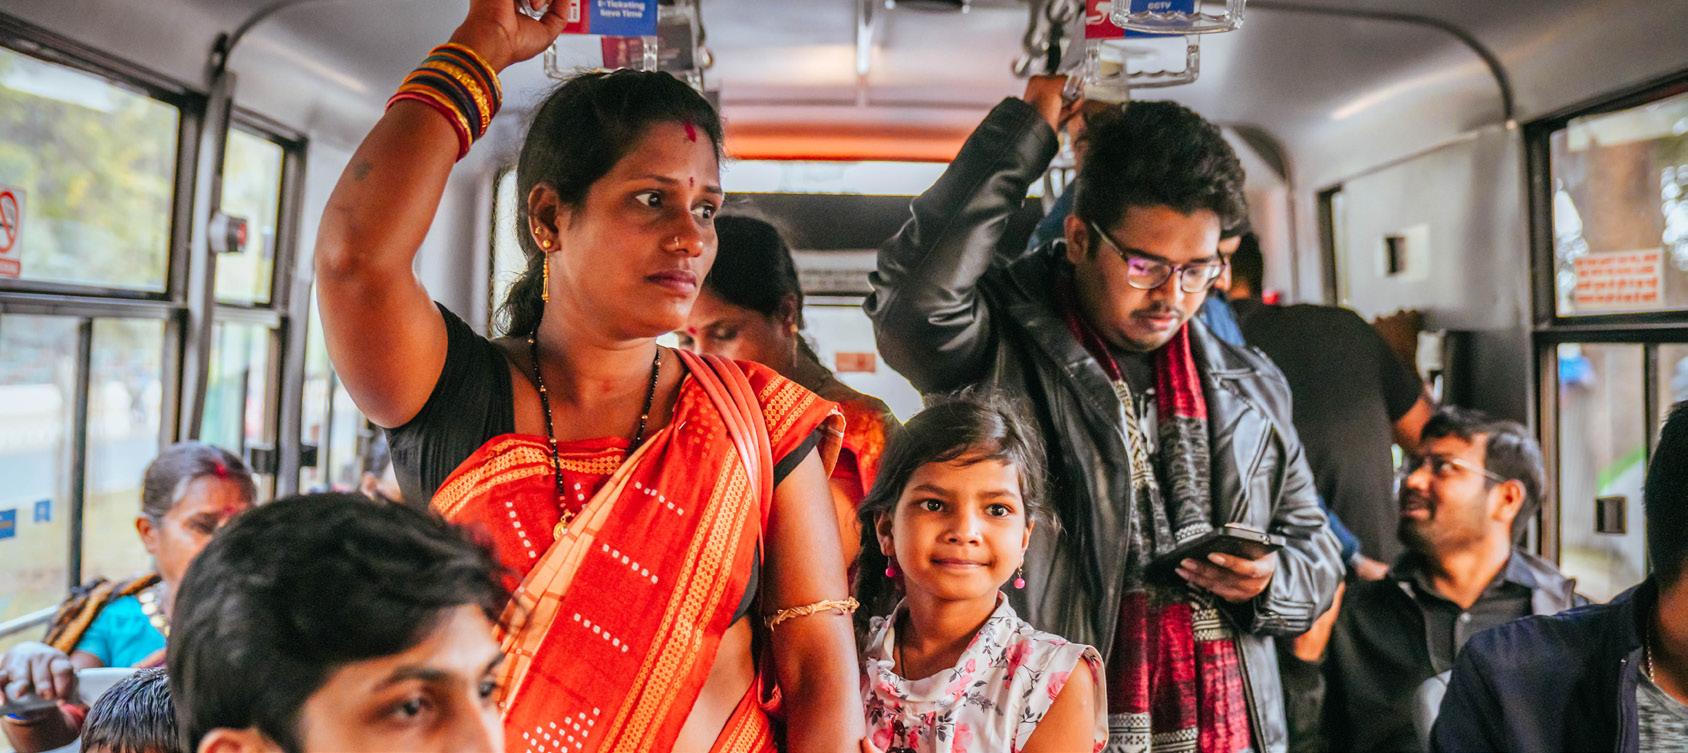
IMP Pillar: Climate-Resilient & Compact Urban Growth – Pillar I Dimension Score: 0.53
Gap Description: While Rourkela’s planned sector-based structure provides a solid physical foundation, compact growth principles are not actively operationalised. Urban expansion into 52 surrounding villages is proceeding without policy controls, and land use–
transport integration remains weak and fragmented — particularly in emerging growth areas such as the airport development zone. No transport emissions baseline or carbon monitoring framework exists.
Resilient Urban Growth Score (1–5): 2 – No active compact growth policy. CDP proposals on watershed and ecological protection remain unimplemented. No mechanisms to manage sprawl into peripheral villages.
Service Proximity Score (1–5): 4 – Educational and healthcare facilities are generally within walkable distances in the planned core, but no quantified population coverage assessment within 1 km thresholds exists.
Street Network Structure & Connectivity Score (1–5): 4 – A clear arterial-subarterial-collector hierarchy is defined, but connectivity is uneven in peripheral areas with limited bus penetration into local and collector streets.
Disaster Risk Management Score (1–5): 2 – CDP integrates flood and drainage planning with emergency access, but no evidence of integration with the transport system or mobility investment planning.
Climate Mitigation Score (1–5): 2 – Policy intent to promote EVs and NMT exists, but no transport GHG inventory, carbon budget, or measurable reduction targets have been established.
Current Situation
Compact growth principles are acknowledged in planning documents but not enforced. Urban sprawl into peripheral villages continues unchecked. Transport-climate monitoring is entirely absent.
Consequence if Unaddressed
Without land use–transport integration, growth in peripheral areas will generate longdistance motorised trips that undermine NMT culture. The absence of emissions monitoring means the city cannot demonstrate progress on climate goals.
Specific Intervention Required
Develop a transport-land use integration framework aligned with the CDP update; establish a transport emissions baseline; define measurable climate mitigation targets; strengthen connectivity planning for peripheral growth areas.
IMP Pillar: Public & Shared Transport Systems – Pillar II Dimension Score: 0.54
Gap Description: CRUT’s Mo Bus network provides a structured PT backbone with 25 routes and approximately 100 buses, but the system is significantly underutilised relative to its potential. Average headways of 77 minutes, no structured feeder or micro-bus services, weak gender-safety measures, and limited physical multimodal integration constrain ridership to only about 5.5% of modal share. Many routes operate at low occupancy due to misaligned alignments, route overlaps, and competition from informal IPT.
Network Coverage Score (1–5): 4 – A substantial share of the population lives within 500 m of bus stops along major Mo Bus corridors, but peripheral wards, newly urbanising areas, and low-density settlements face significant service gaps.
Service Frequency & Reliability Score (1–5): 2 – Average headways of approximately 77 minutes are far above acceptable thresholds, severely limiting PT attractiveness and competitiveness with informal IPT.
Real-Time Service Integration Score (1–5): 3 – The Ama Bus application provides real-time tracking and multi-channel ticketing, but no physical arrival displays exist at stops, and no GTFS feeds or fare integration across modes are available.
Affordability Score (1–5): 4 – PT fares are perceived as affordable relative to household incomes, but no formal income-benchmarking or affordability assessment exists for the bottom 40% of earners.
Gender & Safety Score (1–5): 2 – No dedicated women’s helpline, CCTV coverage, structured safety features, or disaggregated safety data are in place. Gender-responsive PT infrastructure remains absent.
Physical Integration Score (1–5): 2 – Only basic, informal modal connections exist at major nodes; no fully designed multimodal interchange facilities integrating buses, IPT, and pedestrian access.
Commuter Responsive Planning Score (1–5): 4 – CRUT undertakes regular route rationalisation based on ridership data and passenger feedback, reflecting institutionalised responsiveness, though application is not systematic citywide.
Current Situation
Mo Bus operates 25 routes with ~44,500 daily passengers but accounts for only 5.5% of modal share. Average headways of 77 min make the system unattractive. No feeder or micro-bus services exist. Multiple routes operate at low occupancy. Gender safety features are absent. Physical multimodal integration is limited to informal, undesigned connections.
Consequence if Unaddressed
Low PT modal share will persist, informal IPT will continue to fragment demand, lowoccupancy routes will undermine CRUT’s financial sustainability, and the gender gap in mobility will widen without targeted interventions.
Specific Intervention Required
Develop a micro-bus feeder service plan for 6–8 routes serving underserved sectors; conduct systematic route performance analysis across all 25 Mo Bus routes to identify root causes of low occupancy; develop gender-responsive infrastructure standards for bus stops and terminals; design multimodal interchange at key nodes.
IMP Pillar: Active Mobility (Walking & Cycling) – Pillar III Dimension Score: 0.27
Gap Description: Rourkela has one of India’s highest cycling modal shares — 35.5% of all trips — yet possesses no continuous, protected cycling network. Cyclists share the 16.2 km Ring Road with motor vehicles travelling at 40–60 km/h. Footpaths are fragmented, raised to +230 mm above carriageway level, and frequently encroached. No universal accessibility guidelines are implemented. Mode shift analysis reveals approximately 69,562 daily cycling trips lost since 2011 due to unsafe conditions, with a corresponding shift to threewheelers and buses.
Continuity & Connectivity of Active Mobility Networks Score (1–5): 2 –Rourkela has very low (<30%) continuity and connectivity of active mobility infrastructure, with isolated segments and no integrated citywide network. Footpaths are encroached and functionally unusable on most corridors.
Universal Access Score (1–5): 1 – No formal universal accessibility guidelines are issued or implemented by road-owning agencies. No systematic provision of ramps, tactile paving, or barrier-free features at crossings or along corridors.
Personal Security Score (1–5): 2 – Street lighting coverage is reasonable on primary road segments, but falls below 40% across the full network including peripheral areas. No systematic data-based security assessment exists citywide.
Current Situation
Compact growth principles are acknowledged in planning documents but not enforced. Urban sprawl into peripheral villages continues unchecked. Transport-climate monitoring is entirely absent.
Consequence if Unaddressed
Without land use–transport integration, growth in peripheral areas will generate longdistance motorised trips that undermine NMT culture. The absence of emissions monitoring means the city cannot demonstrate progress on climate goals.
Specific Intervention Required
Develop and implement a 2.2 m segregated cycle track on both sides of the full 16.2 km Ring Road within existing ROW; provide a Bus Priority Lane on the median side; design intersection treatments at 8 Ring Road junctions with raised crossings and cyclist staging areas; prepare a citywide NMT network plan for all arterial and sub-arterial corridors.
IPT, No Accessibility, No Inclusive Policy
IMP Pillar: : Equity, Inclusion & Informal Sector – Pillar IV
Dimension Score: 0.25
Gap Description: Rourkela demonstrates limited institutionalised progress in embedding equity across its mobility ecosystem. Informal settlements have no mapped PT coverage assessment. IPT services are widely available but entirely unregulated. Street vending
remains informal, causing widespread pedestrian conflicts. City buses are not accessible for persons with disabilities, and no gender-disaggregated mobility data exists.
Low-Income Access Score (1–5): 2 – While some informal settlements have proximate access to IPT and limited bus connectivity, there is no mapped coverage assessment or formal indicator tracking equitable transport access for low-income communities.
Alternative Mobility Score (1–5): 1 – Auto and e-rickshaws are widely available but largely unregulated, non-app-integrated, and lacking safety, service standardisation, or reliability frameworks. No structured and inclusive alternative mobility system exists.
Street Vendors & Informal Use Policy Score (1–5): 1 – No comprehensive street vending policy is in practice. Vending is informal with limited designated zones and weak pedestrian integration, causing encroachments on NMT infrastructure.
Accessibility for Differently Abled Score (1–5): 1 – City buses are not equipped for differently abled passengers. Universal design standards are not standardised across bus stops and terminals. Compliance with RPwD Act, 2016 is not documented.
Current Situation
No formal PT access mapping in informal settlements. ~12,900 IPT vehicles operate without regulation. Street vending causes pedestrian encroachments. Buses have no low-floor access or accessibility features. No gender-disaggregated data on mobility experience exists.
Consequence if Unaddressed
Vulnerable groups — low-income residents, persons with disabilities, women, and street vendors — will continue to face mobility barriers that limit economic participation and quality of life, reinforcing spatial inequality in the city.
Specific Intervention Required
Commission a formal transport access assessment for informal settlements; develop an IPT regulation framework with app integration and safety standards; enforce street vending policy with designated zones; conduct a universal accessibility audit of all city buses and bus stops; develop gender-responsive mobility data collection protocols.
Gap 5 (Pillar V): Climate & Environmental Sustainability — No Emissions Monitoring, No Clean Fleet Data, No Renewable Integration
IMP Pillar: Climate & Environmental Sustainability – Pillar V Dimension Score: 0.24
Gap Description: Rourkela’s performance under Climate & Environmental
Sustainability is the second-lowest of all nine pillars. Despite being designated a non-attainment city under India’s National Clean Air Programme, there is no cityspecific transport emissions inventory,
no documented low-emission fleet share, and no renewable energy integration at any transport facility. Climate-resilient design remains aspirational. Congestion at key intersections compounds air pollution in a city already struggling with industrial emissions.
Low-Emission Public Fleet Share Score (1–5): 2 – No clear, quantified data on the share of electric or low-emission vehicles in the public transport or municipal fleet. Policy intent to promote EVs exists, but no documented transition plan or fleet targets.
Renewable Integration Score (1–5): 1 – No evidence of rooftop solar, solar carports, battery storage, or green power integration at CRUT depots, bus terminals, or stations.
Air Quality Integration Score (1–5): 1 – Rourkela is covered under the state Clean Air Action Plan, but no transport-specific air quality interventions, lowemission zones, or pedestrianisation linked to air quality management have been implemented.
Emission Compliance & Congestion Score (1–5): 2 – National BS VI compliance is driving gradual fleet improvement, but city-specific fleet data is unavailable. Congestion at DAV Chowk, Hanuman Vatika, and Ambedkar Chowk increases vehicle idling and pollution.
Resilient Infrastructure Score (1–5): 1 – No systematic integration of climateresilient design (flood-resistant materials, raised platforms, drainage upgrades) across transport corridors, depots, or terminals.
Current Situation
No transport GHG inventory or baseline exists. No documented low-emission fleet targets. No renewable energy at any transport facility. Key intersections contribute to elevated urban air pollution through idling. Climate-resilient design is not mainstreamed in any transport infrastructure project.
Consequence if Unaddressed
Rourkela cannot track or demonstrate progress on clean mobility goals. Continued reliance on diesel and petrol fleets in a non-attainment city will worsen air quality. Without climateresilient infrastructure, flood and heat events will increasingly disrupt mobility
Specific Intervention Required
Commission a city-specific transport emissions inventory; develop a fleet electrification roadmap with phased targets; explore rooftop solar at CRUT depot; link intersection improvement programme to air quality co-benefits monitoring; integrate climate-resilient design standards into future transport infrastructure procurement.
IMP Pillar: Parking & Travel Demand Management – Pillar VI Dimension Score: 0.20
Gap Description: Parking and travel demand management is the lowestscoring pillar in Rourkela’s mobility assessment. Parking on commercial corridors — particularly Kachehri Road — is entirely unmanaged. No parking policy, demand-based pricing, digital enforcement, or revenue reinvestment
mechanism exists. A 2026 field survey found that total supply (503 ECS) exceeds peak demand (309.5 ECS), confirming that the problem is management and organisation rather than supply shortage. No instruments to restrain private vehicle use have been implemented or proposed.
Parking Policy Score (1–5): 1 – Parking remains entirely unregulated with no structured management framework, dynamic pricing, digital enforcement, or demand-based policy in place.
Private Vehicle Restraint Score (1–5): 1 – No congestion pricing, levy systems, low-emission zones, or regulatory tools to discourage private vehicle use have been proposed or implemented.
Current Situation
On-street parking on Kachehri Road and other commercial corridors is unmanaged and informal, reducing effective carriageway width to a single lane during peak hours. Perpendicular/random parking configurations create friction and safety hazards. No parking inventory or demand data exists to guide evidence-based policy. Peak demand is 309.5 ECS against a supply of 503 ECS — a management problem, not a supply shortage.
Consequence if Unaddressed
Growing vehicle ownership with no demand management will progressively reduce road capacity, increase peak-hour congestion, create pedestrian and cyclist conflicts, reduce commercial viability on key streets, and generate no revenues for reinvestment in sustainable mobility.
Specific Intervention Required
Develop and implement a parking solution and management plan for Kachehri Road covering all four stretches (3.81 km total), including: demarcated parallel parking bays, demand-based pricing (short-term on-street at ₹10–20/hr; long-term off-street at block rates), free overnight parking (9 PM–9 AM), single-operator area management contract, QR/app-based payment, and enforcement. Projected annual revenue: ₹3.05 Crore.
Gap 7 (Pillar VII): Governance, Financing & Monitoring — Fragile Financing, No Dashboard, Limited Capacity
IMP Pillar: Governance, Financing & Monitoring – Pillar VII Dimension Score: 0.33
Gap Description: Rourkela’s governance framework benefits from CRUT as a dedicated SPV with statutory backing, but financing mechanisms are fragile, institutional capacity in transport planning is undocumented, and a public
mobility dashboard is absent. No ringfenced transport fund, land value capture mechanism, or institutionalised multistakeholder platform exists. Dependence on project-based and state funding creates long-term financial vulnerability.
Institutional Framework Score (1–5): 3 – CRUT provides statutory backing, operational autonomy, and a defined mandate for PT planning. However, broader mobility governance is institutionally distributed across RMC, RDA, PWD, and Traffic Police without a unified coordination structure.
Funding & O&M Mechanisms Score (1–5): 1 – Public transport operations are supported by state grants, fare revenue, advertising, and project-based grants. No ring-fenced, sustainable revenue streams are institutionalised for PT or NMT.
Land Value Capture / TOD-based Financing Score (1–5): 2 – No evidence of land-based financing instruments, betterment levies, or TOD provisions being used to fund mobility infrastructure in Rourkela.
Monitoring & Data Score (1–5): 3 – CRUT tracks ridership, fleet performance, and ticketing internally through ITS/ITMS systems. However, no public-facing, citywide mobility dashboard with KPIs is available.
Institutional and Stakeholder Coordination Score (1–5): 2 – Regular interagency coordination occurs between CRUT, RMC, Smart City, Traffic Police, and state agencies, but formalised, periodic multi-stakeholder platforms with citizens and operators are not institutionalised.
Capacity Building Score (1–5): 1 – No documented evidence of structured capacity building programmes or specialised transport planning expertise within CRUT or associated agencies to plan, operate, and manage evolving urban mobility systems.
No ring-fenced urban transport fund. No land value capture mechanisms. No public mobility dashboard. No documented specialised transport planning capacity within RMC or related agencies. Multi-stakeholder coordination with citizens and operators is informal and infrequent. Revenue streams are structurally insecure.
Consequence if Unaddressed
Without sustainable financing, CRUT and RMC cannot fund the capital investments or operational improvements required to address the five priority gaps. Without a public dashboard, accountability for IMP delivery is absent. Without capacity building, institutional learning from pilot projects will not be captured or scaled.
Specific Intervention Required
Establish a dedicated Integrated Mobility Planning and Steering Cell with inter-agency representation; develop a public mobility dashboard tracking ridership, safety, emissions, and service quality KPIs; initiate structured capacity building for transport planning across CRUT, RMC, and RDA; explore parking revenue and TOD-based financing to supplement state grants.
8 (Pillar VIII):
IMP Pillar: Road Safety – Pillar VIII Dimension Score: 0.40
Gap Description: Road safety remains a significant and largely unaddressed concern in Rourkela. Multiple intersections — including Bisra Munda Chowk (16,860 PCU/hour, above standard capacity), Panposh Chowk (high highway approach speeds), and DPS Square (adjacent school zone) —
have been identified as accident-prone through stakeholder consultations and traffic police data. No disaggregated cityspecific crash data is publicly available. No Vision Zero or target-based safety framework has been established. School safety interventions remain at proposal stage.
Fatalities & Serious Injuries Score (1–5): 2 – Accident-prone locations are identified, but no disaggregated, city-specific road crash data is publicly available to enable evidence-based prioritisation of safety interventions.
Black Spot Management Score (1–5): 2 – The Odisha government identifies state-level black spots, but no tracking of treated versus untreated locations within Rourkela’s boundary exists. No city-level black spot treatment programme is operational.
School & Child Safety Score (1–5): 2 – Safe Access to School interventions are proposed under the Smart City Proposal but have not been systematically implemented at any school in the city.
Current Situation
Multiple high-risk intersections identified but not treated. Birsa Munda Chowk requires active police management at peak hours, indicating operational failure of existing rotary geometry. No pedestrian crossings, cycle tracks, or traffic calming at any surveyed junction. School safety measures not implemented. No city-level safety monitoring or data system.
Consequence if Unaddressed
Continuing fatalities and serious injuries at unaddressed black spots will intensify as traffic volumes grow. The absence of a safety framework means the city has no mechanism to set targets, monitor outcomes, or learn from incidents.
Specific Intervention Required
Redesign three priority intersections — Panposh Chowk, DPS Square, and Birsa Munda Chowk — to modern roundabout standards following IRC 65:2017, IRC 103:2022, and IRC 11:2015; provide pedestrian crossings and cycle infrastructure at all redesigned junctions; establish a city-level road crash database; develop a target-based safety framework; implement Safe Route to School pilot at DPS and adjacent schools.
IMP Pillar: Digital Integration – Pillar IX Dimension Score: 0.55
Gap Description: Rourkela demonstrates the strongest dimension score (0.55) in Digital Integration, driven by high digital travel behaviour adoption among public transport users (Score: 5) and the Ama Bus app ecosystem offering real-time tracking and multi-channel ticketing. However, a unified MaaS platform does
not exist, GTFS/GTFS-RT open data feeds are not publicly available, and no enabling policy framework mandates open data sharing or interoperability across operators. The digital foundation is present, but ecosystem-level integration remains incomplete.
Policy & Regulatory Readiness Score (1–5): 2 – No policy or regulatory framework mandates open data standards, interoperability, or digital payment integration across transport operators in Rourkela
Digital System Integration Score (1–5): 3 – CRUT has registered as a digital ticket seller on the Ama Bus platform. Real-time tracking and digital ticketing are functional. However, no unified multimodal platform covering buses, IPT, and other modes exists.
Data Infrastructure & Availability Score (1–5): 1 – No publicly available GTFS or GTFS-RT feeds, open APIs, or standardised datasets for third-party app development or MaaS integration. CRUT’s operational data is not openly published.
Digital Travel Behaviour Score (1–5): 5 – Public transport users in Rourkela actively use digital platforms including the CRUT mobile app, smart cards, and WhatsApp-based ticketing. User readiness for digital mobility is high.
Despite strong user adoption of digital tools, the system lacks platform integration, open data, and enabling policy. No unified journey planning or fare integration covers multiple modes. No public mobility dashboard exists. Citizens cannot access performance metrics on reliability, ridership, or emissions.
Consequence if Unaddressed
Without open data and platform integration, third-party innovation in mobility apps, MaaS platforms, and journey planning is blocked. The strong user readiness for digital tools cannot be leveraged without the supply-side infrastructure to match. Governance transparency will remain limited.
Specific Intervention Required
Publish GTFS and GTFS-RT data feeds for all 25 Mo Bus routes; develop an open data policy governing data licensing, update frequency, and third-party access; integrate CRUT data with national platforms (Google Maps, ONDC, OpenStreetMap); develop a public mobility dashboard with citywide KPIs on ridership, safety, emissions, and service quality; explore MaaS feasibility study as a medium-term intervention.
Project prioritisation under the Integrated Mobility Plan for Rourkela was guided by a structured and iterative stakeholder consultation process, ensuring that proposed interventions respond to the city’s institutional setting, mobility challenges, and implementation realities. Consultations were initiated early to identify key mobility concerns, validate baseline findings, and frame priority directions for the IMP in line with Rourkela’s long-term development trajectory, industrial character, and strong non-motorised transport culture. Stakeholder inputs for the Rourkela IMP were drawn through consultations with the key city and regional agencies including Rourkela Municipal Corporation (RMC), Capital Region Urban Transport (CRUT), Rourkela Smart City Limited, the Traffic Police, the Regional Transport Office, and representatives associated with the Steel Township and major institutional areas. These consultations helped validate the city’s mobility challenges, understand agency priorities, identify
implementation constraints, and shape project selection across infrastructure, public transport, active mobility, parking management, and road safety. In addition to departmental consultations, focused technical discussions and fieldlevel inputs were used to assess corridor conditions, junction performance, public transport operations, parking issues, and first- and last-mile service gaps. The prioritisation process therefore relied on a combination of baseline assessment findings, agency feedback, on-ground observations, and implementation feasibility. Priority projects were selected based on their ability to address the weakest-performing IMP pillars, respond to visible mobility problems, align with institutional responsibilities, and be taken forward in a phased manner under the SUM-ACA framework. As a result, the priority project package for Rourkela reflects both strategic citylevel needs and practical readiness for implementation.
H & UD Department, Government of Odisha
Rourkela Municipal Corporation (RMC)
Rourkela Development Authority (RDA)
Traffic Police Regional Transport Office (RTO)
Group Workshop
Review Meetings Technical Discussions
Field Validation Inter- Agency Coordination
Urgency
Fig. 18. Stakeholder Mapping
Capital Region Urban Transport
Steel Township / SAIL
Rourkela Smart City Limited
Technical Experts | Community Representatives
Bicycle Infrastructure Planning – Ring Road
Safe Junction Redesign – Panposh Chowk, DPS Square, Birsa Munda Chowk
INTEGRATED MOBILITY PLAN
Micro-Bus Feeder Service Plan
Parking Management Plan – Kachehri Road
CRUT Route Analysis and Rationalisation
Structured consultations informed immediate priority actions under SUM- ACA
The Rourkela Integrated Mobility Plan adopts a multi-tiered funding approach that combines central, state, and city-level support to ensure financial feasibility, institutional ownership, and phased implementation of the five priority interventions. This framework enables
the city to align strategic priorities with available funding streams while supporting both technical assistance projects and on-ground capital investments.
A significant share of priority projects under the Rourkela IMP are aligned with centrally sponsored schemes and national urban mobility programmes. Funding and technical assistance are leveraged through MoRTH road safety schemes for junction improvements, PM e-Bus Sewa for fleet electrification,
and the FAME programme for electric vehicle promotion. Central funding plays a catalytic role by providing technical frameworks, reducing upfront capital costs, and accelerating the implementation of priority mobility interventions.
The Government of Odisha provides strategic and policy-level support for mobility initiatives through state budget allocations and departmental programmes under the Housing & Urban Development Department. The state road safety budget and PWD capital works programme support the junction improvement projects. CRUT’s
operating grant and viability gap funding mechanism provides the financial backbone for the micro-bus service plan and Mo Bus network optimisation. State funding ensures alignment with broader Odisha urban development priorities, including the non-attainment city clean air agenda and the Odisha State EV Policy.
At the city level, funding is supported through municipal budgets, Smart City Mission allocations, and locally generated revenues. Rourkela Smart City Limited provides a critical implementation and financing channel for technology-based interventions including junction improvements and ITS systems.
The Integrated Mobility Plan for Rourkela assessed the city’s mobility system through a review of existing plans and policies, field observations, stakeholder inputs, and a nine-pillar framework covering urban growth, public and shared transport, active mobility, inclusion, environmental sustainability, parking and travel demand management, governance, road safety, and digital integration. The assessment established a clear evidence base on where Rourkela performs relatively well—particularly in digital systems, its planned urban structure, and the presence of a formal bus network—and where the most critical gaps remain, especially in cycling and walking infrastructure, parking management, public transport service quality, safety, inclusion, and environmental planning. As a result, the report translates these findings into a set of strategic goals, immediate priority projects, and mediumto long-term reforms for the city. Its key
outcome is not only the identification of mobility challenges, but the creation of a practical implementation framework that helps Rourkela move from fragmented interventions toward a more integrated, people-centred, safe, and climateresponsive mobility system.
Based on the outcomes of stakeholder consultations, the following priority projects have been defined to translate strategic goals into actionable interventions.
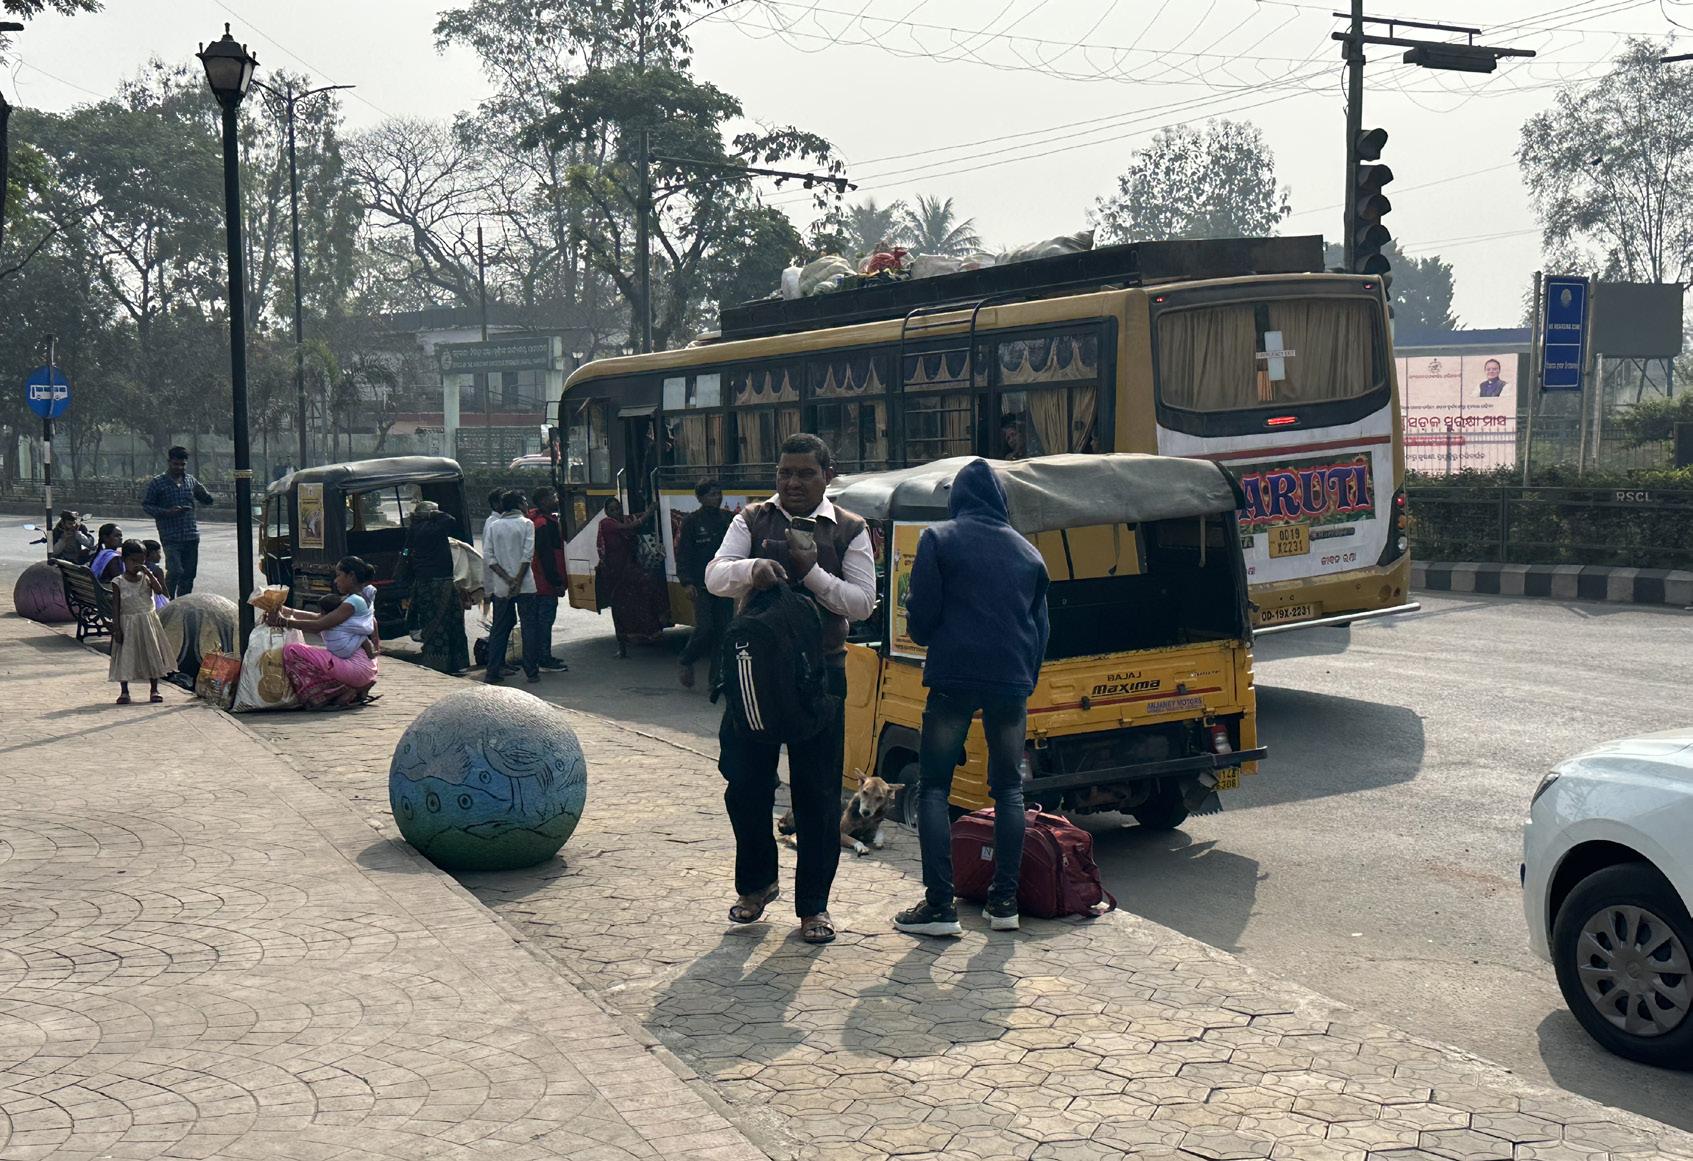
PROTECT AND STRENGTHEN ROURKELA’S NONMOTORISED TRANSPORT CULTURE GOAL 1
IMMEDIATE (1–2 YEARS)
P1.1
Develop a comprehensive bicycle infrastructure plan for the 16.2 km Ring Road corridor, including a 2.2 m segregated cycle track on both sides within the existing ROW, a Bus Priority Lane (BPL) on the median side, and intersection treatments at 8 Ring Road junctions – requiring no land acquisition or lane removal. The plan includes PCU and LOS analysis confirming no degradation in motor vehicle level of service at any surveyed junction, cycle track design specifications, signal priority for buses, and a phased implementation roadmap.
IMPROVE ROAD SAFETY AT CRITICAL INTERSECTIONS GOAL 2
IMMEDIATE (0–1 YEARS)
P2.1 Safe Junction Redesign – Panposh Chowk
Redesign the existing 3-arm rotary (6,699 PCU) to a modern roundabout with a 22.4 m central island, raised pedestrian crossings on all arms at +150 mm, revised footpath levels for improved accessibility, and adequate ramps at all road openings. No signalisation required under current volumes.
P2.2 Safe Junction Redesign – DPS Square
Redesign the 4-arm rotary (4,827 PCU) to a modern roundabout with narrowed carriageways for speed control, a 2.2 m dedicated cycle track on Ring Road arms, raised pedestrian crossings, and bus stops and IPT bays on the Ambagyan Square and Space Square approaches. Located adjacent to a school zone – junction design prioritises student and pedestrian safety.
P2.3 Safe Junction Redesign – Birsa Munda Chowk
Redesign the 6-arm rotary (16,860 PCU, above standard capacity) to a 2-lane elliptical modern roundabout with sharper entry geometry, mountable apron, flared splitter islands, part-time peak-hour signalisation, 2.2 m segregated cycle tracks on all arms, and raised pedestrian crossings – replacing the current arrangement that requires active police management at peak hours.
All projects highlighted in are identified as Priority Projects.
STRENGTHEN PUBLIC TRANSPORT THROUGH MICRO-BUS INTEGRATION GOAL 3
IMMEDIATE (1-3 YEARS)
Develop a structured micro-bus feeder service plan covering 6–8 routes connecting peripheral residential sectors, industrial areas, and key trip generators to the Mo Bus backbone network. The plan includes route design, fleet sizing (~97 buses), 10-minute headways, operating model options (contracted, PPP, or CRUT-operated), fare integration with Mo Bus, and a phased implementation roadmap – projecting approximately 20,440 additional daily passenger trips.
GOAL 4
INTRODUCE STRUCTURED PARKING AND TRAVEL DEMAND MANAGEMENT
IMMEDIATE (0–1 YEARS)
Develop and implement a comprehensive parking management plan for all four stretches of Kachehri Road (3.81 km total): P1 (1.1 km, daily needs market), P2 (0.95 km, wholesale market), P3 (0.83 km, offices and retail), and P4 (0.93 km, government offices). The plan includes organised parallel parking bays (503 ECS total capacity), conversion from unorganised perpendicular parking, demand-based pricing (short-term on-street Rs. 10–20/hr; lower long-term block rates), free overnight parking (9 PM–9 AM), a single-operator area management contract, QR and app-based payment infrastructure, and enforcement. Projected annual revenue: Rs. 3.05 Crore.
GOAL 5
STRENGTHEN PUBLIC TRANSPORT THROUGH ROUTE OPTIMISATION
IMMEDIATE (0–1 YEARS)
Conduct a systematic performance analysis of all 25 Mo Bus routes to identify root causes of low occupancy – including route overlaps, misaligned alignments, poor scheduling, inadequate stop placement, and competition from informal IPT. Develop recommendations for route rationalisation, frequency improvements, and network restructuring, supported by a digital route optimisation tool and standard operating procedures for periodic network review.
All projects highlighted in are identified as Priority Projects.
P1 Bicycle Infrastructure Planning for Rourkela Ring Road
IMP Pillar Active Mobility (Walking & Cycling) — Pillar III Classification: Immediate (SUM-ACA Supported)
Description
Scope of work
Rourkela’s cycling modal share of 35.5% is one of the highest among Indian cities, yet the 16.2 km Ring Road — the city’s primary commuter spine — has no dedicated cycling infrastructure. Cyclists share the carriageway with motor vehicles at 40–60 km/h, creating severe safety risks and contributing to an estimated loss of 69,562 daily cycling trips since 2011. This project develops a comprehensive bicycle infrastructure plan for the Ring Road corridor, along with a Bus Priority Lane (BPL), establishing the physical and operational foundation for protecting and expanding Rourkela’s exceptional NMT heritage.
Develop a 2.2 m segregated cycle track on both sides of the full 16.2 km Ring Road within the existing ROW, requiring no land acquisition or lane removal. Propose a 3.5 m Bus Priority Lane (BPL) on the median side of the Ring Road. Conduct PCU and Level of Service analysis confirming no degradation in motor vehicle LOS at any of the 8 surveyed junctions. Design intersection treatments at all 8 Ring Road junctions with raised crossings, splitter islands, and dedicated cyclist staging. Specify red-coloured pavement surface for cycle track and signal priority for buses at all Ring Road junctions. Develop implementation phasing, cost estimates, and maintenance protocols. (Refer Bicycle Infrastructure in Annexures)
Key Agencies
Rourkela Smart City Limited, Rourkela Municipal Corporation (RMC); Rourkela Steel Authority (SAIL), Rourkela Traffic Police
Implementation Mode Technical Assistance (SUM-ACA) for plan preparation → DPR by RMC/Smart City → Civil works contract by SAIL/PWD → Commissioning and monitoring by RMC/Traffic Police.
Funding Smart City Funds and Steel Authority of India
IMP Pillar Road Safety — Pillar VIII Classification: Immediate (SUM-ACA Supported)
Description
Scope of work
Multiple intersections in Rourkela are identified as accident-prone, characterised by inadequate geometry, high conflict points, and a complete absence of pedestrian and cyclist infrastructure. Three intersections — Panposh Chowk, DPS Square, and Birsa Munda Chowk — have been selected for priority redesign based on traffic volumes, crash history, and the presence of vulnerable road users. Birsa Munda Chowk, with 16,860 PCU per peak hour and 6 arms, already operates above standard capacity and requires active police management. The proposed redesigns follow IRC 65:2017, IRC 103:2022, and IRC 11:2015, converting existing rotaries to modern roundabouts with geometry-induced speed control, yield-at-entry priority, and full NMT infrastructure.
Design modern roundabout geometry for Panposh Chowk (3-arm, 6,699 PCU), DPS Square (4-arm, 4,827 PCU), and Birsa Munda Chowk (6-arm elliptical, 16,860 PCU). Provide raised pedestrian crossings (3 m wide, +150 mm) on all arms at all three junctions. Install 2.2 m segregated cycle tracks at DPS Square and Birsa Munda Chowk (Ring Road junctions). Incorporate bus stops and IPT bays at DPS Square. Propose part-time signal phasing at Birsa Munda Chowk for peak-hour management. Conduct capacity analysis confirming LOS adequacy under proposed designs. Develop construction drawings, cost estimates, and phased implementation plans. (Refer Safe Junction – Rourkela in Annexures)
Key Agencies
Implementation Mode
Rourkela Municipal Corporation (RMC); Rourkela Traffic Police; Rourkela Smart City Limited, Rourkela Steel Authority (SAIL)
Technical Assistance (SUM-ACA) for design → Construction drawings by RMC/PWD → Civil works by RMC/Smart City → Traffic management by Odisha Traffic Police.
Funding Steel Authority of India, Rourkela Municipal Corporation (RMC)
IMP Pillar Public & Shared Transport Systems — Pillar II Classification: Immediate (SUM-ACA Supported)
Description
Scope of work
Rourkela’s Mo Bus network, while providing a structured backbone along major corridors, suffers from 77-minute average headways and no feeder services connecting peripheral residential sectors, industrial areas, and key trip generators to the formal network. As a result, large segments of the population depend entirely on informal, unregulated IPT. This project develops a structured microbus feeder service plan that integrates smaller capacity vehicles on 6–8 routes across underserved sectors, creating first- and last-mile connections to the Mo Bus backbone and improving overall public transport attractiveness.
Assess PT coverage gaps and last-mile deficiencies across all 41 city wards. Design 6–8 micro-bus feeder routes with 250 m average stop spacing, 10-minute headways, and connections to key Mo Bus interchange points. Determine fleet size (7 m buses, ~97 vehicles estimated), operating speeds, and daily trip capacity (~20,440 daily passenger trips projected). Define operating model options including contracted service, PPP, and CRUT-operated variants. Develop fare integration framework with Mo Bus and IPT. Prepare a phased implementation plan with pilot on 2 routes in Year 1, scaling to full network by Year 3. Conduct financial modelling including VGF requirements and revenue projections. (Refer MICRO BUS PLAN FOR ROURKELA in Annexures)
Key Agencies
Implementation Mode
Funding
Capital Region Urban Transport (CRUT); Rourkela Municipal Corporation (RMC); Rourkela Steel Authority (SAIL), Rourkela Traffic Police, Rourkela RTO
Technical Assistance (SUM-ACA) for route design → Operating model selection (PPP/CRUT) → Fleet procurement under PM e-Bus Sewa → Phased launch with CRUT as lead operator.
Housing & Urban Development (H&UD) Department, Government of Odisha. (CRUT), Rourkela Steel Authority (SAIL)
IMP Pillar Parking & Travel Demand Management — Pillar VI Classification: Immediate (SUMACA Supported)
Description
Scope of work
Kachehri Road is Rourkela’s most commercially active corridor, generating intense parking demand across its 3.81 km length through daily needs markets, wholesale outlets, government offices, and retail establishments. On-street parking is entirely unmanaged, with perpendicular and random parking configurations reducing effective carriageway width to a single lane during peak hours. A field survey conducted in 2026 across four stretches (P1–P4) found a peak demand of 309.5 ECS against a total supply of 503 ECS — confirming that the problem is one of management and organisation, not supply shortage. This project develops a comprehensive parking management plan including organised parallel parking bays, demand-based pricing, enforcement, and revenue reinvestment.
Implement organised parallel parking bays across all four stretches: P1 (1.1 km), P2 (0.95 km), P3 (0.83 km), and P4 (0.93 km, both sides). Convert from unorganised perpendicular/random parking to demarcated 7 m parallel bays, protecting carriageway function. Introduce tiered demand-based pricing: short-term on-street (₹10–20/hr for 2W/4W) and lower long-term off-street block rates. Designate free overnight parking (9 PM–9 AM) to address residential needs. Develop single-operator area-based parking management contract covering on-street and off-street facilities. Install payment infrastructure (QR codes, mobile app, warden enforcement). Project annual revenue potential of ₹3.05 Crore (Long Term: ₹1.36 Cr + Short Term: ₹1.69 Cr), sufficient to fund operations and generate surplus for NMT reinvestment. (Refer Parking Assessment: Rourkela in Annexures)
Key Agencies
Implementation Mode
Funding
Rourkela Municipal Corporation (RMC); Rourkela Smart City Limited; Rorukela Traffic Police, Rourkela Development Authority (RDA)
Technical Assistance (SUM-ACA) for plan → Management contract tendered by RMC → Single-area operator onboarded → Enforcement by RMC/Traffic Police → Revenue reinvestment mechanism established.
Rourkela Municipal Corporation (RMC); Rourkela Smart City Limited
IMP Pillar Public & Shared Transport Systems — Pillar II / Governance, Financing & Monitoring — Pillar VII Classification: Immediate (SUM-ACA Supported)
Description
Scope of work
Despite carrying approximately 44,500 daily passengers across 25 routes, CRUT’s Mo Bus network achieves only about 5.5% modal share. Many routes suffer from low occupancy, high operational headways (average 77 min), and limited competitiveness relative to informal IPT services. Contributing factors include route overlaps, misaligned alignments, poor scheduling, inadequate stop placement, and competition from informal auto-rickshaws on the same corridors. This project conducts a systematic route performance analysis across all 25 Mo Bus routes to identify root causes of low occupancy and develop evidence-based recommendations for network rationalisation, route redesign, and service quality improvements.
Collect and analyse ridership data (Occupancy Ratio, EPKM, RL/ATL ratio) for all 25 Mo Bus routes. Identify low-performing routes (bottom 25% by OR) and highdemand corridors (top 25%). Map route overlaps, misaligned alignments, and catchment area deficiencies using GIS. Conduct origin-destination surveys and passenger load mapping on 10 priority routes. Assess competition from informal IPT on key corridors through field observations. Develop recommendations for route rationalisation, frequency improvements, and network restructuring. Design a digital route optimisation tool on pilot basis to support data-driven planning and continuous performance monitoring. Prepare standard operating procedures (SOPs) for periodic route review aligned with CRUT’s commuter-responsive planning culture. (Refer CRUT Routes – Rourkela in Annexures)
Key Agencies Rourkela Steel Authority (SAIL)
Implementation Mode Technical Assistance (SUM-ACA) for data collection and analysis → CRUT internal review → H&UD Department approval → Implementation by CRUT → Monitoring via ITS/ITMS
Funding
Housing & Urban Development (H&UD) Department, Government of Odisha. (CRUT), Rourkela Steel Authority (SAIL)
Together, these five projects address the most urgent and impactful mobility challenges in Rourkela. They span the full range of the IMP’s strategic priorities — protecting NMT, improving road safety, strengthening public transport, managing parking, and building data-driven governance — and are designed to generate visible, measurable outcomes within a 12–36-month implementation window. The detailed project briefs and annexures are presented in Chapter 9.
Gender-Responsive Public Transport Safety Infrastructure
IMP Pillar Public & Shared Transport Systems — Pillar II Classification: Medium Term (2–5 Years)
Description
Scope of work
CRUT’s Mo Bus network has no gender-responsive safety features at any bus stop or terminal. No dedicated women’s helpline, CCTV coverage, structured night-time safety protocols, or disaggregated safety data collection are in place. This absence discourages women from using public transport, directly suppressing ridership and perpetuating inequitable mobility access across the city.
Key Agencies
Conduct a gender safety audit of all 25 Mo Bus routes — assessing stop lighting, shelter design, sight lines, CCTV coverage, and reported incident data. Install CCTV cameras at the top 20 highest-ridership stops. Establish a dedicated women’s helpline number and integrate it into the Ama Bus app. Develop and publish a gender-disaggregated ridership and safety data collection protocol. Design and pilot a gender-responsive bus stop prototype at 5 high-footfall locations with adequate lighting, sheltered seating, and emergency contact display. Develop a standard safety protocol for drivers and conductors on all CRUT routes. Build in a monitoring mechanism using periodic user feedback — including quarterly in-app surveys via Ama Bus, a complaint and suggestion register at key stops, and an annual gender safety perception report — to track improvements and inform ongoing service adjustments.
Capital Region Urban Transport (CRUT); Rourkela Municipal Corporation (RMC); Rourkela Smart City Limited; Odisha Police (Women’s Safety Cell)
Implementation Mode Study by CRUT/Smart City → Infrastructure contract for CCTV and stop upgrades → App integration by CRUT IT → Monitoring via quarterly user feedback surveys.
Funding
Smart City Mission; CRUT Operational Budget; State Women and Child Development Department; MoHUA Gender-Responsive Urban Transport Guidelines
IMP Pillar
Public & Shared Transport Systems — Pillar II Classification: Medium Term (2–5 Years)
Description
Physical integration between Mo Bus services, IPT auto-rickshaws, and pedestrian access is absent at major nodes including the Bus Terminal, Railway Station, and key sector junctions. Passengers must navigate unsafe, undesigned environments for interchange, suppressing combined PT ridership and increasing reliance on private vehicles for multi-leg journeys.
Key Agencies
Identify and prioritise the top 5 Mo Bus interchange nodes based on ridership, transfer volumes, and pedestrian activity. Develop design briefs for multimodal interchange facilities at Bus Terminal, Railway Station, and 3 sector junction nodes — integrating bus bays, IPT staging areas, cycle parking, and pedestrian access. Prepare DPR-level designs for 2 priority nodes including site plans, elevations, structural assessments, and cost estimates. Define operating standards and maintenance responsibilities for interchange facilities. Coordinate with CRUT, RTO, and RMC on operational protocols for bus and IPT integration.
Rourkela Municipal Corporation (RMC); Capital Region Urban Transport (CRUT); Rourkela Development Authority (RDA); Rourkela Smart City Limited; State Transport Authority
Implementation Mode Technical study by CRUT/RMC → DPR preparation → Capital works contract → O&M responsibility shared between CRUT and RMC.
Funding
AMRUT 2.0; Smart City Mission; State Urban Transport Budget; PPP arrangements with commercial operators at terminal nodes
IMP Pillar Citywide NMT Network Plan and Universal Accessibility Program
Description
Beyond the Ring Road, Rourkela has no continuous NMT network on arterial or subarterial corridors. Footpath continuity citywide is below 30%, universal accessibility guidelines are not implemented by any road-owning agency, and personal security on peripheral streets is inadequate. This project develops a citywide NMT network plan and implements a universal accessibility upgrade program across priority corridors, with integrated provisions for persons with disabilities and structured vending zones along NMT pathways.
Prepare a citywide Master Plan including an NMT network plan identifying priority pedestrian and cycling corridors on all arterial and sub-arterial roads connecting residential sectors, the Steel Plant, NIT, markets, and educational institutions. Conduct a universal accessibility audit of the top 10 priority corridors assessing footpath levels, ramp provision, tactile paving, and crossing geometry. Develop universal accessibility design standards compliant with the Rights of Persons with Disabilities (RPwD) Act 2016 and Harmonised Guidelines for Barrier-Free Built Environment (MoHUA 2021), and disseminate to RMC, PWD, and RDA for mandatory adoption in all future street works. Prepare DPR for NMT upgrades on 3 priority corridors beyond the Ring Road, including footpath reconstruction at +150 mm carriageway level, dropped kerbs at all crossings, detectable warning surface tactile paving (blister tiles at hazard points, corduroy tiles at directional routes), guiding tactile strips along the full footpath length, audio-tactile pedestrian signals at major crossings, and cycle lane markings. Ensure all NMT infrastructure upgrades achieve full compliance with PWD accessibility norms including minimum 1.8 m clear footpath width, slip-resistant surfaces, handrails on raised sections, and barrierfree ramps at all entry and exit points. Develop a street lighting plan for peripheral corridors to improve personal security for NMT users. Designate integrated vending zones set back from NMT pathways ensuring a minimum 1.5 m unobstructed pedestrian clearance is always maintained with designated stall locations, surface markings, and utility connections to eliminate footpath encroachment by street vendors.
Key Agencies
Rourkela Municipal Corporation (RMC); Public Works Department, Odisha; Rourkela Smart City Limited; Rourkela Development Authority (RDA); Rourkela Steel Plant (SAIL) — for township corridors; Department of Social Justice and Empowerment, Odisha — for PWD compliance oversight
Implementation Mode Master plan by RMC/RDA → Accessibility audit → DPR preparation → Civil works by PWD/RMC → Compliance oversight by Department of Social Justice.
Funding
AMRUT 2.0 (NMT component); Smart City Mission; Accessible India Campaign (Sugamya Bharat); PM-SVANidhi (for vending zone infrastructure); State Road and Infrastructure Budget
IMP Pillar Public & Shared Transport Systems — Pillar II | Classification: Medium Term (2–5 Years)
Description
Approximately 12,900 autorickshaws operate in Rourkela without route regulation, fare standardization, app integration, or safety certification. IPT fills critical lastmile gaps that the formal Mo Bus network cannot cover, but it’s entirely informal character means passengers face unpredictable fares, inconsistent service, and no accountability. This project formalizes shared auto-rickshaw mobility through a defined route and fare structure, aligns IPT operations as a structured feeder to the micro-bus and Mo Bus network (P3), and develops a phased transition plan toward electric rickshaws — moving Rourkela’s shared mobility ecosystem toward a regulated, clean, and integrated public transport tier.
Map existing IPT routes, load patterns, passenger origins and destinations across all 41 city wards to identify corridors where shared autorickshaws serve as the primary or sole mobility option. Develop a formal shared mobility framework with defined route permits, standardized fare structures, and published timetables — designed to complement and feed into micro-bus routes (P3) and Mo Bus corridors rather than compete with them. Establish a corridor-level alignment between auto-rickshaw routes and the Mo Bus and micro-bus network, designating interchange points where passengers can transfer between modes under a single fare or discounted integrated fare. Develop a defined fare structure for all regulated shared auto routes — incorporating distance-based tariffs, peak and off-peak pricing, and concessionary fares for students, women, and persons with disabilities. Design an app-based IPT integration module compatible with the Ama Bus platform for route display, real-time availability, fare transparency, and passenger feedback. Define minimum vehicle safety, driver certification, and vehicle maintenance standards as conditions for permit renewal. Pilot the structured shared auto framework on 3 high-demand corridors with standardized fares, headways, and interchange with Mo Bus. Develop a phased e-rickshaw transition plan — including vehicle specifications, charging infrastructure requirements, operator financing options under FAME II, and a timeline for progressive replacement of petrol and CNG auto-rickshaws with electric variants across regulated routes.
Key Agencies
Implementation Mode
Funding
State Transport Authority (Odisha); Capital Region Urban Transport (CRUT); Rourkela Municipal Corporation (RMC); Rourkela RTO; Odisha Traffic Police; AutoRickshaw and E-Rickshaw Operators Associations; Housing & Urban Development Department, Odisha
Regulatory framework by STA/RTO → App integration by CRUT → Pilot operations with Auto-Rickshaw Associations → Phased e-rickshaw transition under FAME II.
State Transport Department; FAME II / PM e-Drive (for e-rickshaw transition); National Urban Livelihood Mission (NULM) for operator livelihood support during transition; CRUT Operational Budget (for Ama Bus integration); Smart City Mission
IMP Pillar Climate & Environmental Sustainability — Pillar V Classification: Long Term (5+ Years
Description
Scope of work
No city-specific transport emissions inventory exists for Rourkela. No renewable energy is integrated at any CRUT depot, bus terminal, or station, and no fleet electrification plan or EV transition targets have been defined for either public or private operators. This project develops a transport emissions baseline, a phased electrification roadmap for both CRUT’s public fleet and private bus operators serving the city, and a renewable energy integration plan for transport facilities — approaching fleet transition as a supply-side regulatory challenge requiring both public investment and structured private operator compliance.
Commission a city-level transport GHG inventory using vehicle registration data, traffic counts, CRUT fleet records, private operator fleet data, and mode share surveys — establishing Rourkela’s first comprehensive transport emissions baseline covering both public and private fleet. Develop a phased fleet electrification roadmap for CRUT’s Mo Bus fleet aligned with PM e-Bus Sewa and FAME II funding windows, including vehicle specifications, charging infrastructure requirements, and depot retrofit plans. Develop a parallel private operator fleet transition plan — identifying all private bus and shared transport operators active on city routes, mapping their fleet age and fuel type, and defining a phased EV transition timeline with milestones at 2027 and 2030. Design a supply-side regulatory framework for private operator fleet compliance, including minimum emission standards as a condition of route permit renewal, phased retirement of pre-BS VI vehicles, and access to subsidised EV financing under FAME II and PM e-Drive for compliant operators. Assess rooftop solar potential at CRUT Bus Depot, main Bus Terminal, and 5 major bus stops — prepare feasibility report and DPR for solar installation at CRUT depot. Develop an air quality co-benefits monitoring framework linking fleet electrification progress to CPCB non-attainment reporting. Define measurable transport emissions reduction targets for 2027 and 2030 covering both public and private fleet.
Key Agencies
Implementation Mode
Funding
Capital Region Urban Transport (CRUT); Rourkela Municipal Corporation (RMC); State Transport Authority, Odisha; Odisha State Pollution Control Board; Ministry of New and Renewable Energy (MNRE); Housing & Urban Development Department, Odisha; Private Bus Operators Association
GHG study by consultant/OSPCB → Roadmap by CRUT/H&UD → Supply-side regulatory framework by STA → Solar DPR by MNRE agency → Implementation via PM e-Bus Sewa and FAME II.
PM e-Bus Sewa; FAME II / PM e-Drive; National Clean Air Programme (NCAP); MNRE Rooftop Solar Scheme; State EV Policy incentives; Private operator cofinancing through EV loan schemes
IMP Pillar Public & Shared Transport Systems — Pillar II Classification: Medium Term (2–5 Years)
Description
Private bus operators currently run services on several corridors that overlap with CRUT’s Mo Bus routes, creating operational inefficiencies, fare fragmentation, and scheduling conflicts that reduce the overall effectiveness of the city’s public transport network. Rather than treating private operators as competition, this project brings them into a structured contractual framework aligned with CRUT’s operations — integrating scheduling, rationalising overlapping routes, and standardising fares to create a coherent, unified public transport system for Rourkela.
Map all private bus operator routes, schedules, fleet sizes, and fare structures across the city — identifying corridors of overlap with CRUT Mo Bus services and corridors where private operators serve areas not covered by Mo Bus. Develop a contractual integration framework under which private operators are formally aligned with CRUT’s operational and scheduling system — defining contract terms, performance obligations, revenue sharing arrangements, and dispute resolution mechanisms. Rationalise overlapping routes through a joint scheduling exercise combining CRUT and private operator services — eliminating duplication, filling coverage gaps, and optimising headways across the integrated network. Develop a unified fare structure covering both CRUT and aligned private operator services, with consistent pricing by distance, defined concessionary categories, and compatibility with the Ama Bus digital ticketing platform. Integrate private operator schedules and vehicle tracking into CRUT’s existing ITS/ITMS system and the Ama Bus app — enabling passengers to plan journeys across the full combined network. Define performance monitoring standards for private operators including occupancy ratio, punctuality, vehicle condition, and driver behaviour, with contractual consequences for non-compliance. Pilot the integrated framework on 3 high-overlap corridors in Year 1 before scaling to full network coverage.
Key Agencies
Implementation Mode
Funding
Capital Region Urban Transport (CRUT); State Transport Authority, Odisha; Rourkela Municipal Corporation (RMC); Rourkela RTO; Odisha Traffic Police; Private Bus Operators Association; Housing & Urban Development Department, Odisha
Route mapping study → Contract framework by H&UD/CRUT → Negotiations with Operators Association → ITS integration by CRUT IT → Phased rollout.
Housing & Urban Development Department, Government of Odisha; CRUT Operational Budget; Viability Gap Funding (VGF) for private operator transition support; Smart City Mission (for ITS integration); GIZ Technical Assistance
IMP Pillar Parking & Travel Demand Management — Pillar VI Classification: Long Term (5+ Years)
Description
Beyond Kachehri Road (addressed under P4), Rourkela has no citywide parking policy, no parking inventory, and no area-based management framework covering commercial, institutional, or residential zones. With car trips having more than doubled in modal share (3.0% to 10.1% between 2011 and 2026), unmanaged parking is increasingly compromising road capacity and pedestrian movement across the network. This project develops a citywide parking policy, an area-based management plan, and a contractual framework to onboard parking operators — translating policy into structured, revenue-generating implementation.
Key Agencies
Implementation Mode
Prepare a comprehensive city-level parking inventory covering on-street and offstreet supply across all major commercial, institutional, and residential zones. Develop a Citywide Parking Policy for Rourkela incorporating demand-based pricing principles, maximum parking standards for new developments, and parking revenue reinvestment protocols linked to NMT and PT improvement. Develop an area-based parking management plan — dividing the city into defined parking zones (building on the Kachehri Road model from P4) with zone-specific supply targets, pricing tiers, enforcement strategies, and operating standards. Develop a contractual framework to onboard private parking management contractors for each zone, including scope of work, performance KPIs, revenue sharing arrangements, and penalty clauses. Prepare a phased implementation roadmap with Year 1 focused on priority commercial zones, Year 2–3 on institutional corridors, and Year 4–5 on city-wide rollout. Develop standard operating procedures for enforcement, payment infrastructure (QR/app-based), and warden deployment across all managed zones.
Rourkela Municipal Corporation (RMC); Rourkela Development Authority (RDA); Odisha Traffic Police; Rourkela Smart City Limited; Rourkela Steel Plant (SAIL)
Policy study by RMC/RDA → Area plan preparation → Contractor onboarding via competitive tender → Enforcement by RMC/Traffic Police → Revenue protocol established.
Funding Municipal Budget; Smart City Mission; AMRUT 2.0; Parking Revenue Surplus from P4 (Kachehri Road)
IMP Pillar Governance, Financing & Monitoring — Pillar VII Classification: Medium Term (2–5 Years)
Description
No ring-fenced urban transport fund, no public mobility dashboard, and no structured multi-stakeholder coordination platform exists. Institutional capacity in transport planning across RMC, CRUT, and RDA is limited and undocumented. CRUT’s data-driven planning culture provides a strong foundation, but without formalised governance structures and transparent KPI reporting, the IMP’s long-term delivery cannot be secured.
Key Agencies
Establish an Integrated Mobility Steering Cell (IMSC) with nominated representatives from CRUT, RMC, RDA, Smart City, Traffic Police, and H&UD Department — define mandate, meeting frequency (minimum 6 per year), and decision-making protocols. Develop a public-facing Mobility Dashboard for Rourkela tracking: ridership by route, service reliability, road safety outcomes, NMT infrastructure completeness, parking revenue, and cycling volumes at Ring Road junctions. Publish CRUT route performance data (OR, EPKM, RL/ATL) quarterly. Develop a structured capacity building programme for transport planning staff across CRUT, RMC, and RDA — covering urban mobility planning, data analysis, and IMP monitoring. Explore feasibility of a ring-fenced Urban Mobility Fund drawing on parking revenues, development charges, and state budget line items. Develop an institutionalised stakeholder engagement protocol with citizens, operators, and civil society for annual IMP review.
Housing & Urban Development Department, Odisha; Capital Region Urban Transport (CRUT); Rourkela Municipal Corporation (RMC); Rourkela Smart City Limited; Rourkela Development Authority (RDA)
Implementation Mode Government order for IMSC by H&UD → Dashboard development by Smart City/ CRUT IT → Data integration → Public launch → Annual IMP Progress Report.
Funding
State Urban Development Budget; Smart City Mission; GIZ/International Technical Assistance; Parking Revenue Surplus (P4)
IMP Pillar Governance, Financing & Monitoring — Pillar VII Classification: Long Term (10 Years)
Description
No land-based financing instruments — betterment levies, development charges, or Transit Oriented Development (TOD) provisions — are used to fund mobility infrastructure in Rourkela. As the city expands toward peripheral villages and develops new institutional and commercial zones, the absence of TOD frameworks means that land value uplift from transport investment cannot be captured to fund future mobility improvements.
Key Agencies
Implementation Mode
Funding
Commission a TOD feasibility study for the Rourkela Ring Road corridor — identifying station area development potential and land value uplift scenarios linked to cycle track and bus priority lane investments. Develop a Land Value Capture (LVC) mechanism framework for RDA, including betterment levy structures for commercial developments within 500 m of major PThubs including Rourkela bus terminal, railway station. Prepare model by-law amendments for RDA enabling minimum FAR incentives for transit-accessible developments. Develop a financial model demonstrating how LVC revenue can fund O&M of NMT infrastructure on the Ring Road over a 10-year horizon. Engage H&UD Department on incorporating LVC provisions into the next CDP revision.
Rourkela Development Authority (RDA); Housing & Urban Development Department, Odisha; Rourkela Municipal Corporation (RMC); Capital Region Urban Transport (CRUT)
Technical study by RDA/consultant → H&UD engagement → By-law amendment process → Integration into CDP revision.
World Bank/ADB Urban Development Loans; State Urban Development Budget; GIZ Technical Assistance; CDP revision process
IMP Pillar Road Safety — Pillar VIII Classification: Medium Term (2–5 Years)
Description
No disaggregated, city-specific road crash database exists for Rourkela. No Vision Zero or target-based safety framework has been established. Black spot identification is done at state level with no city-level tracking of treated versus untreated locations. School safety measures remain at the proposal stage. This project establishes the data infrastructure and policy framework needed to make road safety planning evidence-based and outcome-driven.
Key Agencies
Establish a city-level road crash database in collaboration with Odisha Traffic Police, and iRAD data base capturing location, severity, vehicle type, and road user type for all crashes within Rourkela Municipal Corporation and planning area boundaries. Develop a Black Spot Management System tracking all identified locations(there should be a budgeted framework to support targeted intervention for addressing targeted black spots), treatment status, and post-treatment performance. Implement Safe Route to School pilots at DPS and 2 additional schools in the vicinity of high-risk junctions. Develop a speed management policy for arterial roads including automated enforcement feasibility assessment. Publish an annual Road Safety Report for Rourkela.
Odisha Traffic Police; Rourkela Municipal Corporation (RMC); Rourkela Smart City Limited; Public Works Department, Odisha; Ministry of Road Transport and Highways (MoRTH)
Implementation Mode Database setup with Traffic Police/iRAD → Budgeted black spot framework by RMC/ PWD → School safety contracts → Annual reporting by RMC/Traffic Police.
Funding
MoRTH Road Safety Schemes; National Road Safety Fund; Smart City Mission; State Road Safety Budget
IMP Pillar Digital Integration — Pillar IX / Governance, Financing & Monitoring — Pillar VII Classification: Medium Term (2–5 Years)
Description
No public-facing mobility dashboard exists for Rourkela. Citizens and decisionmakers cannot access transparent data on bus reliability, ridership trends, road safety outcomes, cycling volumes, parking revenue, or air quality co-benefits from mobility investments. Without a KPI monitoring system, the delivery of the Rourkela IMP cannot be tracked or publicly reported, undermining accountability and institutional learning.
Key Agencies
Define a comprehensive KPI framework for the Rourkela IMP covering all nine pillars — including metrics for ridership, service frequency, NMT infrastructure completeness, road safety, parking revenue, emissions, equity access, and digital adoption. Develop a public-facing online dashboard — hosted on the CRUT or Smart City website — displaying live and historical KPI data with ward-level breakdowns where available. Integrate data feeds from CRUT ITS/ITMS, RMC infrastructure database, Traffic Police crash data, Kachehri Road parking revenue system (P4), and Ring Road junction cyclist counters (P1). Establish data governance protocols covering update frequency, data quality standards, and inter-agency data sharing agreements. Publish an annual IMP Progress Report based on dashboard data for public accountability.
Capital Region Urban Transport (CRUT); Rourkela Smart City Limited; Rourkela Municipal Corporation (RMC); Odisha Traffic Police; Housing & Urban Development Department, Odisha
Implementation Mode KPI framework by CRUT/Smart City/GIZ → Dashboard development contract → Data governance agreements → Public launch → Annual reporting cycle.
Funding Smart City Mission; CRUT IT Budget; State Urban Governance Budget; GIZ Technical Assistance
The Rourkela Integrated Mobility Plan represents a structured, evidencebased response to a city at a mobility crossroads. Rourkela enters this planning process with a rare and defining asset a cycling and walking modal share of nearly 30.4%, yet faces deepening pressures from rising motorisation, inadequate infrastructure, and a formal public transport system that falls far short of its potential. The IMP addresses these pressures across all nine dimensions of sustainable urban mobility, from active infrastructure and public transport to road safety, parking, governance, and digital integration.
Across the nine-pillar assessment, the IMP has identified a consistent pattern: strong intent and a functional institutional backbone in several areas, but a persistent gap between policy and on-ground delivery. Dimension scores ranging from 0.20 for Parking and Travel Demand Management to 0.55 for Digital Integration reveal a city that has established the foundations of a modern mobility system through CRUT’s commuter-responsive planning, the Ama Bus digital ecosystem, and the Steel Township’s compact spatial structure but has not yet translated these foundations into the infrastructure, financial frameworks, and governance structures that would make them durable and equitable.
The five priority projects under SUMACA are designed to deliver visible, measurable outcomes within a 12–36-month window. A continuous, segregated cycle track on the 16.2 km Ring Road will protect and grow Rourkela’s exceptional cycling culture — arresting the loss of an estimated 69,562 daily cycling trips since 2011 and restoring the Ring Road as a safe commuter route for over 1,350 cyclists counted at peak hour
at each surveyed junction. The redesign of Panposh Chowk, DPS Square, and Birsa Munda Chowk to IRC-compliant modern roundabouts will eliminate the most critical uncontrolled conflict points in the city, providing pedestrian crossings and cyclist infrastructure at junctions that currently operate above design capacity. A structured microbus feeder service across 6–8 routes will generate approximately 20,440 additional daily passenger trips and close the last-mile gaps that have made Mo Bus uncompetitive with informal IPT across peripheral wards. The Kachehri Road parking management plan will convert the city’s most chaotic commercial corridor into an organised, revenue-generating system — producing ₹3.05 Crore annually while restoring carriageway capacity and pedestrian safety. And a systematic analysis of all 25 Mo Bus routes will provide CRUT with the evidence base to rationalise its network, reduce operational waste, and build toward a public transport system capable of growing its 5.5% modal share toward 13%.
Beyond the immediate priority projects, the fourteen additional interventions address the systemic and institutional dimensions that determine whether these improvements endure. Formalising and electrifying IPT, integrating private bus operators into CRUT’s scheduling and fare framework, developing a citywide NMT network plan with universal accessibility, establishing a public mobility dashboard and Integrated Mobility Steering Cell, building a Vision Zero road safety framework, and publishing open transit data are not peripheral additions they are the governance and policy infrastructure that converts individual projects into a sustainable, self-improving urban mobility system.
If fully implemented over the 2025–2030 horizon, the Rourkela IMP is expected to sustain and grow the city’s NMT modal share, bring formal public transport ridership from 44,500 to over 70,000 daily passengers, make three of the city’s most dangerous intersections safe for all road users, generate local parking revenues sufficient to fund NMT operations, and establish Rourkela as a replicable model for data-driven, equity-conscious, and climate-responsive mobility planning in Tier-2 Indian cities. Most fundamentally, it is designed to ensure that Rourkela’s exceptional cycling culture built over decades and sustained despite the absence of any dedicated infrastructure is finally given the physical, institutional, and financial foundations it deserves.
FORMAL PUBLIC TRANSPORT RIDERSHIP
IMP OUTCOMES AND IMPACT
MICRO-BUS FEEDER TRIPS ADDED
~20.440 daily passenger trips
DAILY CYCLE TRIPS
+69,562 RECOVERED arrest loss since 2011
44.500-70,000 Daily passengers
SEGERATED CYCLE TRACK BUILT
16.2 KM continuous, on ring road
30.4% SUSTAINED protect and grow from baseline ACTIVE MOBILITY MODAL SHARE
FORMAL PUBLIC TRANSPORT RIDERSHIP
5.5% - 13% share of all trips
HIGH CONFLICT JUNCTIONS MADE SAFE
3 OF 3 share of all trips
PARKING REVENUE GRNERATED
3.05 CRORE/YEAR kachehri road corridor
The Integrated Mobility Plan for Rourkela presents a comprehensive roadmap that extends beyond the immediate priority projects identified under the SUM-ACA program and establishes a long-term framework for sustainable, inclusive, and climate-responsive mobility development. While the five priority projects— development of bicycle infrastructure along the Ring Road corridor, redesign of critical junctions for improved road safety, introduction of a micro-bus feeder network, implementation of structured parking management on Kacheri Road, and rationalization of low-occupancy CRUT routes—provide immediate opportunities to address critical mobility gaps, their long-term success will depend upon complementary policy reforms, institutional strengthening, fleet modernization, and supporting infrastructure investments across the city.
The first phase of implementation should focus on delivering the identified SUMACA priority projects while simultaneously establishing the policy and governance framework necessary for city-wide mobility transformation. Dedicated cycling and pedestrian infrastructure should be expanded beyond the Ring Road to create a connected active mobility network linking residential areas, industrial zones, educational institutions, commercial centers, and public transport nodes. The proposed micro-bus system should be integrated with the existing Mo Bus network to improve first- and last-mile connectivity, increase public transport accessibility in underserved areas, and reduce dependence on informal transport modes. Simultaneously, the parking management framework developed for Kacheri Road should be scaled to other commercial corridors through demand-based pricing, digital
enforcement, and parking supply management measures. The redesign of accident-prone intersections should serve as a model for a broader city-wide road safety program incorporating safe crossings, traffic calming measures, universal accessibility features, and improved junction geometry. Route optimization of CRUT services should be accompanied by regular service reviews, performance monitoring, and demand-responsive planning to improve ridership, operational efficiency, and financial sustainability.
Beyond the SUM-ACA interventions, Rourkela should pursue a second generation of mobility reforms focused on strengthening public transport, climate action, inclusivity, and integrated mobility governance. Priority attention should be given to the introduction of gender-responsive public transport measures, development of multimodal interchange facilities, implementation of a city-wide universal accessibility program, formalization and regulation of intermediate public transport services, and progressive electrification of public and shared transport fleets. The city should also invest in charging infrastructure, renewable energy integration at transport facilities, intelligent transport systems, and digital passenger information services to support a transition towards low-emission mobility. At the policy level, adoption of a Sustainable Urban Mobility Policy, Transit-Oriented Development framework, parking policy, and open-data mobility platform will be critical for institutionalizing sustainable mobility principles within future urban development decisions.
Implementation of these measures will require sustained financial support through a combination of central and state government programs, public-
private partnerships, land value capture mechanisms, parking revenues, climate finance instruments, and green infrastructure funding. To coordinate delivery across multiple agencies, an Integrated Mobility Steering Committee should be established comprising Rourkela Municipal Corporation, Rourkela Development Authority, CRUT, Traffic Police, Smart City Limited, SAIL, and other key stakeholders. This body should be responsible for project prioritization, funding coordination, monitoring, and annual mobility performance reviews. Supported by a dedicated mobility observatory and data-driven monitoring framework, the city should regularly track indicators related to public transport usage, active mobility, road safety, accessibility, emissions reduction, and service quality to ensure that investments are delivering measurable outcomes.
Through the combined implementation of the immediate SUM-ACA priority projects and the broader program of reforms and investments proposed under the Integrated Mobility Plan, Rourkela can preserve its strong nonmotorized transport culture, strengthen public transport effectiveness, improve safety and accessibility, manage growing motorization pressures, and transition towards a resilient, low-carbon, and people-centered mobility system capable of supporting the city’s long-term economic and urban growth aspirations.
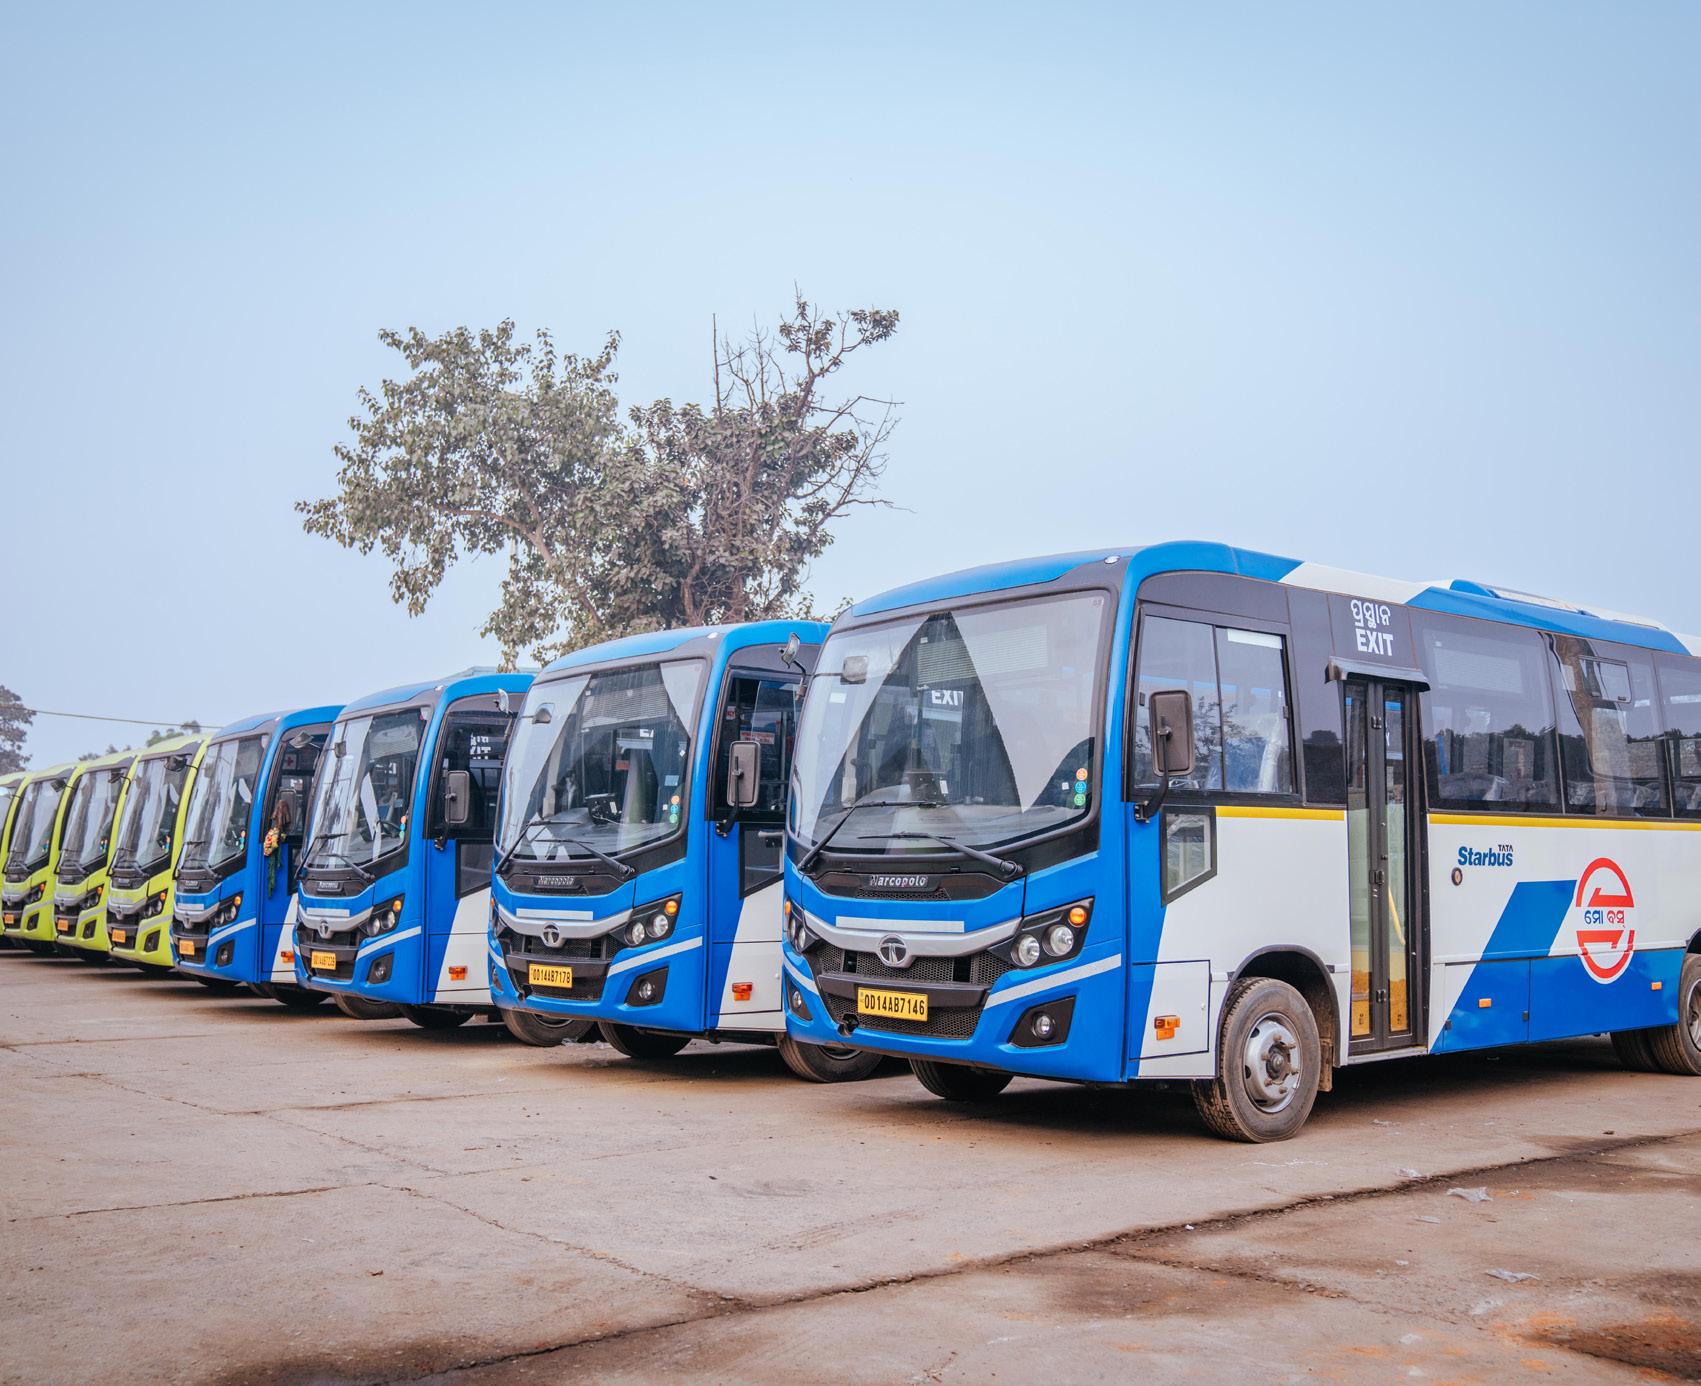
A Diagnostic and Strategy-Enabling Tool for Indian Cities
Developed under: GIZ SUM-ACA Project
India’s cities face compounding mobility challenges: rapid urbanisation, worsening air quality, rising motorisation, and deepening inequities in access to transport. Planning instruments such as Comprehensive Mobility Plans (CMPs) are extensively prepared, yet implementation has frequently been constrained by an over-reliance on travel demand forecasting and infrastructure-led approaches that do not adequately address systemic inefficiencies, institutional fragmentation, or emerging climate imperatives.
National-level policies have progressively widened the mandate for urban mobility planning. The National Clean Air Programme (NCAP, 2019) requires 122 nonattainment cities to prepare action plans linking mobility interventions to air quality targets. The Indo-German Green Urban Mobility Partnership (GUMP), signed in 2019 is a collaboration between the Ministry of Housing & Urban Affairs (MoHUA) and the German Federal Ministry for Economic Cooperation and Development (BMZ) to support and encourage environment friendly sustainable urban transport projects — supported by EUR 1 billion in concessional KfW lending for sustainable mobility infrastructure. It is in this context that the Integrated Mobility Plan (IMP) Evaluation Framework has been developed under the GIZ’s SUM-ACA project (Sustainable Urban Mobility – Air Quality, Climate Action and Accessibility), implemented in partnership with MoHUA. The framework is a diagnostic and strategy-enabling tool designed to shift city planning from predicting future demand to understanding current system performance and enabling cities to identify targeted, implementable interventions that serve equity, climate, and air quality objectives simultaneously.
This chapter documents the methodological basis of the IMP Evaluation Framework — the principles that shaped its design, the structured process through which it was developed, and the logic by which its nine dimensions and forty parameters were derived. Transparency of methodology is central to the credibility of the framework as a comparative assessment instrument.
The development of the IMP Framework is anchored in four core principles that define its scope, structure, and applicability:
The framework was constructed through a seven-step process that moves from a review of global and national frameworks through to validation against real city conditions. Each step produced a discrete methodological output that informed the next stage of development.
Table 2.1 Guiding Principles of the IMP Evaluation Framework conditions. Each step produced a discrete methodological output that informed the next stage of development.
Guiding Principle
City-Scale Measurability
Outcome-Oriented Structure
Systems-Based Approach
Alignment with Policy and Practice
Description
Indicators are designed to be measurable using secondary datasets — CMPs, Smart City systems, ITMS data, GIS layers, and administrative rds — ensuring applicability across cities without requiring primary data collection.
The framework focuses on mobility outcomes — accessibility, safety, inclusion, and emissions reduction — rather than isolated infrastructure provision.
Urban mobility is evaluated as an integrated system linking land use and urban form, public and informal transport systems, active mobility networks, digital ecosystems, and governance and financing structures.
Indicators and scoring logic are derived from the CMP Toolkit and Service Level Benchmarks (MoHUA), SUMP Guidelines (EU), ITDP, WRI, and World Bank toolkits, and the GIZ MaaS Readiness Framework.
Table 2.2 Methodological Flow for Development of the IMP Evaluation Framework
Step 1 Review of global and national frameworks (SUMP, CMP, SLB, ITDP, WRI, World Bank, GIZ)
Step 2 Translation of outcomes into system-level dimensions
Identification of core mobility outcomes
Definition of 9 functional mobility pillars
Step 3 Identification of parameters within each dimension Distinct performance areas and intervention levers
Step 4 Development of measurable indicators for each parameter City-scale, coverage-based metrics
Step 5 Integration of cross-cutting themes (climate, inclusion, digital) Mainstreamed across all parameters
Step 6 Development of scoring system (1–5 maturity scale) Standardised evaluation framework
Step 7 Validation and iteration using real city data Refinement for applicability and robustness
The review encompassed the EU Sustainable Urban Mobility Plan (SUMP) Guidelines (2nd ed., 2019); MoHUA’s Comprehensive Mobility Plan (CMP) Toolkit (2014) and Service Level Benchmarks (2012); ITDP’s Complete Streets Workbook and Women & Transport toolkit; World Bank Urban Transport Benchmarking; WRI India Low Emission Zones toolkit; GIZ MaaS Readiness Level for India (MRLI, 2021); and India’s National Clean Air Programme (2019), ClimateSmart Cities Assessment Framework 2.0 (2020), and National Disaster Management Authority guidelines. This breadth of review ensures that the framework captures global best practice while remaining grounded in India’s regulatory and institutional context.
The nine dimensions (pillars) of the IMP Framework are derived through a structured translation of SUMP thematic areas, CMP Toolkit guidance, and complementary practitioner frameworks into operational system components relevant to the Indian city context. Each dimension represents a distinct system lever — a domain where targeted interventions can produce measurable improvements in mobility outcomes. Together, the nine dimensions ensure that the framework captures both physical and institutional aspects of urban mobility.
The table below summarises how each dimension was derived, the source frameworks it draws on, its conceptual basis, and how it was adapted for the Indian context.
Table 2.3 Derivation of the Nine IMP Framework Dimensions and Their Adaptation to the Indian Context
IMP Dimension
Climate-Resilient & Compact Urban Growth
Public & Shared Transport Systems
Active Mobility (Walking & Cycling)
Equity, Inclusion & Informal Systems
Derived From Conceptual Basis Adaptation for Indian Context
SUMP (Accessibility, Environment), CMP Toolkit, TOD Policy
SLBs, CMP Toolkit, SUMP (Efficiency)
SUMP (Accessibility, Quality of Life), ITDP
SUMP (Inclusion), World Bank, ITDP
Integration of land use and mobility to enable accessibility
Service performance, accessibility, and reliability of PT systems
Walking and cycling as core modes
Inclusive mobility across all user groups
Expanded to include climate resilience and ecological continuity
Includes fare integration, MaaS, and multimodal performance
Includes universal access, child safety, and gender-sensitive design
Explicit inclusion of IPT and the informal sector
Climate & Environmental Sustainability
Parking & Travel Demand Management
Governance, Financing & Monitoring
Road Safety
Digital Integration
SUMP (Environment), NCAP, CSCAF
SUMP measure packages, ITDP, WRI
SUMP implementation steps, NUTP
SUMP (Safety), MoRTH, IRC
Emissions reduction and environmental performance
Demand management and behaviour change
Institutional and financial capacity
Reduction of fatalities and injuries
GIZ MaaS, DMAF, NCMC Digital enablement of mobility systems
Includes EV transition, air quality zones, and resilience
Focus on parking pricing and vehicle restraint mechanisms
Includes UMTA, funding mechanisms, and data systems
Includes school safety and gender safety perception
Elevated as standalone dimension for Indian Smart City context
Three cross-cutting themes — gender and social inclusion, climate and air quality, and digital integration — are mainstreamed across dimensions rather than isolated as standalone topics. Gender and inclusion considerations appear within Pillars II, III, IV, and VII. Climate and air quality objectives are embedded in Pillars I, V, and VI. Digital integration is both elevated as a standalone dimension (Pillar IX) and referenced within governance and monitoring parameters (Pillar VII).
For each of the nine dimensions, parameters were selected on the basis of three criteria: city-scale measurability using secondary datasets; conceptual alignment with the dimension’s mobility outcomes; and policy grounding in at least one national or international reference standard. This section documents the derivation logic and source frameworks for each parameter set, providing a traceable audit trail from source frameworks to adopted metrics.
This dimension was designed to assess the scale, intensity, and pattern of urban development, and the extent to which these dynamics are aligned with sustainable mobility and climate resilience objectives across six parameters. The selected parameters examine three interrelated concerns: (i) urban form and its interface with mobility systems, (ii) the accessibility outcomes of that urban form, and (iii) the resilience of the city’s development and mobility systems to climate and disaster risks. The parameter set was intentionally limited to aspects assessable at city scale using statutory plans, GIS-based land use and network data, CMPs, and state policy documents.
Resilient Urban Growth
Integration of Mobility with City Planning
Service Proximity
SUMP (Accessibility, Environment); NDMA; CSCAF; CMP Toolkit
CMP Toolkit; SUMP; TOD Policy
SUMP; CMP Toolkit; accessibility planning approaches
Street Network Structure & Connectivity
Disaster Risk Management
Climate Mitigation
ITDP Complete Streets; CMP Toolkit; walkability and permeability principles
NDMA; CSCAF; SUMP environment/resilience logic
NCAP; FAME; climate action and low-carbon mobility frameworks
Whether urban growth is being contained and directed toward existing serviced areas, while safeguarding ecological systems and reducing unsustainable outward expansion
Extent to which statutory land use planning and mobility planning are mutually reinforcing
Degree to which populated areas have essential services (schools, markets, healthcare) within walking distance, reducing motorised trip dependence
Whether the city has a coherent street hierarchy and interconnected network that supports walkability, permeability, and bus penetration
Whether mobility infrastructure planning is aligned with flood, heat, and emergency access considerations
Whether the city has adopted targets and measures for transport-related GHG reduction through modal shift, electrification, and low-carbon strategies
Policy intent and evidence of contained growth
Policy alignment
Coverage (%) –services within 15 min / 1 km walk
Composite –policy presence + % coverage indicators
Policy / coverage
Policy / coverage – GHG targets, EV, modal shift
This dimension was designed to assess the scale, intensity, and pattern of urban development, and the extent to which these dynamics are aligned with sustainable mobility and climate resilience objectives across six parameters. The selected parameters examine three interrelated concerns: (i) urban form and its interface with mobility systems, (ii) the accessibility outcomes of that urban form, and (iii) the resilience of the city’s development and mobility systems to climate and disaster risks. The parameter set was intentionally limited to aspects assessable at city scale using statutory plans, GIS-based land use and network data, CMPs, and state policy documents. Parameter
Network Coverage
Service Frequency & Reliability
Real-Time Service Integration
Service Level Benchmarks (MoUD, 2012); CMP Toolkit (2014)
SLBs (2012); Urban Bus Specifications UBS-II, MoUD (2013)
AIS-140 ITS Standard, MoRTH (2018); GIZ MaaS Readiness Level for India (2021)
Affordability
SLBs (2012); World Bank Urban Transport Benchmarking (2014–16)
Gender & Safety World Bank Gender Responsive Urban Mobility Toolkit (2022); ITDP Women & Transport (2017)
Physical Integration
Commuter Responsive Planning
National TOD Policy, MoHUA (2017); UMI Multimodal Integration resources (2016–18)
World Bank Urban Bus Toolkit; CMP Toolkit (2014)
Accessibility to public transport – ensuring spatial equity of coverage
Service quality as a primary driver of ridership – frequency and on-time performance
Seamless and informed journeys through real-time passenger information and fare integration
Economic access – ensuring public transport is financially accessible to lower-income households
Inclusive mobility – creating environments where women feel safe and can travel independently
Seamless multimodal transfers – ensuring stations function as connected mobility hubs
Adaptive service planning – routing and scheduling adjusted to actual ridership and equity needs rather than fixed forecasts
% population within 500m bus stop / 1km rail station
Average headway; % on-time; buses per lakh population
% fleet with RTPI; fare / service integration presence
Monthly pass as % of bottom-40% household income
Policy presence + user perception of safety
% major transit stations with multimodal access planning
Policy / process presence – route review mechanisms
This dimension assesses the extent to which cities support walking and cycling as primary modes for short-distance travel, recognising their critical role in improving accessibility, reducing emissions, and enhancing public health. Parameters focus on network continuity, inclusivity, and safety rather than isolated infrastructure provision. The emphasis on universal access and personal security reflects the need to create environments usable by all user groups, including children, elderly persons, and women. Together, these parameters evaluate whether active mobility is treated as a systematic, network-level priority.
Table 2.6 Parameter Derivation Framework for Pillar III: Active Mobility (Walking and Cycling)
Continuity & Connectivity of NMT Networks
ITDP Complete
Streets Workbook (2016)
Universal Access
Personal Security
Harmonised Accessibility Guidelines, MoHUA (2021); World Bank Gender Toolkit (2022)
World Bank Gender Responsive Urban Mobility Toolkit (2022)
Network continuity –walking and cycling infrastructure must be uninterrupted to be usable, especially for commuting and school trips
Inclusive design – streets must be usable by children, elderly, and differently abled persons
Safety and comfort – lighting and active frontages are essential for women, children, and vulnerable groups to use streets at all hours
% arterial corridors with continuous footpath / cycle lane ≥1 km
Programme existence / coverage of barrier-free infrastructure
% streets with adequate lighting + eyes-on-street proxy
This dimension recognises that urban mobility in Indian cities is deeply shaped by socio-economic disparities and the prevalence of informal systems. Parameters were selected to assess whether mobility systems are inclusive of low-income populations, informal settlements, and non-formal transport services such as intermediate public transport (IPT). The inclusion of street vending policy and universal accessibility reflects the need to balance mobility efficiency with livelihoods and equitable access to public space. These parameters evaluate whether cities are moving towards a mobility system that is socially inclusive and reflective of ground realities.
Table 2.7 Parameter Derivation Framework for Pillar IV: Equity, Inclusion and Informal Systems
Low-Income
Access
CMP Toolkit (2014); World Bank Accessibility & Inclusion (2015–22)
Alternative Mobility (IPT)
Street Vendors & Informal Use Policy
National TOD Policy (2017); UMI Multimodal Integration (2016–18)
Street Vendors Act (2014); National Policy on Urban Street Vendors (2009)
Accessibility for Differently Abled Harmonised Accessibility Guidelines (2021); World Bank Toolkit (2022)
Spatial equity – ensuring informal settlements and low-income areas are not mobility-excluded
First / last mile access – IPT fills the gap where formal PT does not penetrate
Livelihood inclusion –vending around transit hubs must be regulated to coexist with pedestrian and NMT flows
Universal mobility – fleet and stations must be compliant with accessibility standards
% informal settlements linked to public transport services
Availability –safe, affordable, app-accessible IPT services
Policy presence / enforcement and designated vending zones
% compliant fleet and stations
Across five parameters this dimension evaluates the extent to which urban mobility systems contribute to climate mitigation, air quality improvement, and environmental sustainability. Parameters focus on measurable transitions such as fleet electrification, renewable energy integration, and emission control, while capturing broader policy responses such as low-emission zones and congestion management. The inclusion of resilient infrastructure ensures that environmental sustainability encompasses not only mitigation but adaptation to climate risks such as flooding and extreme heat. Parameters collectively reflect the dual objective of reducing environmental impact while ensuring system continuity.
Table 2.8 Parameter Derivation Framework for Pillar V: Climate and Environmental Sustainability
Low-Emission Fleet Share
Renewable Integration
FAME II (2019); EV Charging Guidelines, MoP (2022)
CSCAF 2.0 (2020); EV Charging Guidelines (2022)
Air Quality Integration
Emission Compliance & Congestion
Resilient Infrastructure
NCAP (2019); WRI Low Emission Zones Toolkit (2021)
NCAP (2019); WRI LEZ Toolkit (2021)
NDMA Urban Flooding Guidelines (2010); CSCAF 2.0 (2020)
Clean mobility transition – fleet electrification is the primary lever for transport-related air quality improvement
Energy sustainability – depots and stations powered by renewables reduce the life-cycle carbon of transit assets
AQ improvement – mobility plans must explicitly target hotspot areas with clean mode priorities and vehicular restrictions
Emission compliance and traffic performance as joint indicators of fleet quality and network efficiency
Climate resilience – transport infrastructure must be designed / retrofitted to withstand flooding, heat, and storms
% fleet on low-emission technology (e-bus, CNG, hybrid)
% depots and stations powered by renewable energy
Policy / coverage – LEZ, pedestrianisation, vehicular restrictions
BS-VI compliance (%) + peak V/C ratio on arterial corridors
% corridors, depots, and terminals with climate-resilient design
This dimension addresses the need to manage travel demand rather than continuously expand road capacity. Parameters were selected to evaluate whether cities are adopting policy instruments that discourage excessive private vehicle use and promote sustainable modes. Parking management is treated as a primary lever given its direct influence on travel behaviour. Broader vehicle restraint measures capture regulatory and fiscal interventions such as congestion pricing and lowemission zones. Together, these parameters assess whether cities are treating demand management as a core mobility strategy rather than an optional add-on.
Parking Policy ITDP On-Street Parking Management Toolkit (2016); GIZ Parking Management for Small & Medium Towns (2023)
Private Vehicle Restraint ITDP Taming Traffic (2021); WRI
India Low Emission Zones Toolkit (2021)
Demand management –parking supply and pricing directly shape private vehicle use decisions
Policy presence / demand-based pricing enforcement
Behaviour change – fiscal and regulatory instruments must disincentivise car use alongside PT improvement
Policy presence / coverage – congestion pricing, LEZ, levies
This dimension evaluates the institutional and financial foundations required to deliver sustainable mobility systems across six dimensions. Parameters were selected to assess whether cities have the institutional structures, funding mechanisms, and monitoring systems necessary for effective planning and implementation. Given the fragmented governance landscape in Indian cities, particular emphasis is placed on the presence of coordinated authorities such as UMTAs or SPVs. The inclusion of financing tools and data systems reflects the importance of long-term financial sustainability and evidence-based decision-making.
Table 2.10 Parameter Derivation Framework for Pillar VII: Governance, Financing and Monitoring
Institutional Framework (UMTA / SPV)
Funding & O&M Mechanisms
NUTP (2014); Metro Rail Policy (2017)
Value Capture Finance Policy (2017); NUTP (2014)
Land Value Capture / TOD Financing
Monitoring & Data
TOD Policy (2017); Value Capture Finance Policy (2017)
DMAF 2.0 (2020); SUMP Guidelines (2019)
Coordination capacity –empowered, cross-agency authority is the prerequisite for integrated planning
Financial sustainability – dedicated revenue streams ensure longterm operation without annual budget uncertainty
Financing integration – land-based instruments recover mobility investment costs from development that transit enables
Evidence-based planning – a mobility dashboard with KPIs enables adaptive management and performance accountability
Policy presence –statutory authority with financial autonomy
Finance mechanism presence –dedicated revenue streams
Finance mechanism presence –LVC instruments in use
Monitoring system and dashboard presence
Institutional & Stakeholder Coordination
SUMP Guidelines (2019)
Capacity Building SUMP Guidelines (2019)
Multi-agency coordination – regular forums with PT agencies, civic bodies, and civil society are necessary for integrated planning
Institutional capacity – staff competency in transport planning directly affects quality of plan preparation and implementation
Process / outcome – number of inter-institutional meetings per year
Process / outcome – proportion of staff with transport planning competency
This dimension treats road safety as a core outcome of urban mobility systems rather than a standalone sectoral issue. Parameters focus on measurable safety outcomes — fatalities and serious injuries — as well as proactive measures such as black spot treatment and school safety programmes. The inclusion of both outcome and intervention-based indicators ensures that cities are evaluated on their current safety performance as well as their efforts to improve it. This approach aligns with global Vision Zero frameworks while remaining grounded in Indian data availability and institutional practice.
Fatalities & Serious Injuries
Road Accidents in India, MoRTH (2023); IRC SP:88 (2010)
Black Spot Management
School & Child Safety
MoRTH Circular (2015 / 2019); IRC 131 (2022)
WRI India Safe Access to Schools (2016–21); World Bank Gender Toolkit (2022)
Safety outcomes – the ultimate measure of a city’s road safety performance is the rate of death and serious injury among road users
Risk reduction – targeted treatment of identified crash hotspots is the most cost-effective safety intervention
Child safety – school zones require dedicated measures because children are among the most vulnerable road users
Annual fatalities per 100,000 population, disaggregated by mode
% identified black spots treated through infrastructure or enforcement
% schools with Safe Access to School plans implemented
This dimension captures the growing role of digital systems in enabling integrated, user-centric mobility services. Parameters were selected to evaluate not only the availability of digital infrastructure but its integration, governance, and adoption by users. This includes policy readiness for data sharing, platform integration through MaaS and NCMC, and the availability of open data systems such as GTFS. Digital Integration is elevated as a standalone dimension — rather than embedded within governance — to reflect the central role of ITS and MaaS platforms in India’s Smart Cities Mission context and the GIZ MaaS Readiness framework.
Parameter Derived From Conceptual Basis Adopted Metric
Policy & Regulatory Readiness
Digital System Integration (MaaS)
NDSAP (2012); NCMC Guidelines (2019–20)
Data Infrastructure & Availability
GIZ MaaS Readiness Level for India (2021); NCMC (2019–20)
DMAF 2.0 (2020); NDSAP (2012)
Digital governance –enabling policies on open data, interoperability, and secure payments are prerequisites for MaaS and ITS at scale
Platform integration – a unified MaaS platform aggregating modes for trip planning, booking, payment, and feedback
Data availability – open, standardised datasets (GTFS, GTFS-RT, open APIs) are the foundation of third-party and MaaS platform access
Policy presence – open data mandates, interoperability frameworks, digital payment standards
Platform existence and rate of adoption by users
% transport operators providing open, standardised data feeds
Digital Travel Behaviour
GIZ MaaS Readiness Level for India (2021); ITDP Transport4All (2023)
User adoption – digital infrastructure is only effective if users actively use it for trip planning and ticketing
% PT riders using digital tools (apps, smart cards) at least weekly
The IMP Evaluation Framework comprises nine thematic pillars and forty parameters. Each pillar captures a distinct system lever required to achieve sustainable mobility outcomes, collectively encompassing both physical and institutional dimensions of urban mobility. The table below provides a summary view; detailed parameter derivation is presented in Section 2.4.
The 40 parameters span infrastructure coverage, service performance, policy adoption, institutional mechanisms, financing arrangements, and digital maturity — ensuring that no critical system component is overlooked. Each parameter is assessed on a standardised 1–5 maturity scale documented in Section 4.
The IMP Evaluation Framework adopts a five-point maturity scale (1–5) to assess each parameter in a consistent and comparable manner across all dimensions. The scoring system is designed to capture the progression from intent to fullscale implementation, recognising that cities may be at different stages of policy development, pilot implementation, and system-wide adoption.
1 No Intent
2 Only Intent
3 Progressing
4 Partly Achieved
5 Achieved
The parameter is absent from policy, planning documents, or implementation. There is no evidence of consideration in the city’s mobility framework.
The parameter is acknowledged in plans, policies, or strategies, but there is no evidence of implementation or operationalisation.
Initial implementation has begun through pilots or limited interventions, typically covering ≤30% of the city or system. Efforts are fragmented or not yet institutionalised.
The parameter is institutionalised and implemented across a significant portion of the city (~30–70% coverage), but gaps remain in consistency, quality, or system integration.
The parameter is fully implemented and mainstreamed across the city (≥70% coverage or system-wide adoption), supported by robust institutional, operational, and monitoring mechanisms.
While the scoring scale is standardised, assessment thresholds are calibrated to the type of metric used for each parameter:
• Coverage-based parameters: Evaluated using percentage thresholds — population coverage, network extent, or fleet share. The score 3 / Progressing threshold corresponds to ≤30% coverage; score 5 / Achieved requires ≥70%.
• Policy-based parameters: Evaluated based on the existence, statutory integration, and enforcement of policies. Score 2 reflects a drafted or notified policy with no evidence of implementation; score 5 requires policy fully embedded in regulatory and planning systems.
• Performance-based parameters: Evaluated using benchmarks — headways, on-time performance, affordability ratios, or fatality rates — derived from Service Level Benchmarks, SUMP Guidelines, and sector-specific standards.
• Process-based parameters: Evaluated based on institutional mechanisms, frequency of stakeholder engagement, and evidence of decision-making structures. Score 5 requires regular, institutionalised forums with demonstrated outcomes.
Each pillar score is calculated as the sum of its constituent parameter scores expressed as a proportion of the maximum possible score for that pillar. This produces a normalised pillar score (0–1) that enables cross-pillar comparison and radar chart visualisation:
Pillar Score = Σ (Parameter Scores) / (Number of Parameters × 5)
Pillar scores above 0.70 indicate broad achievement of that dimension’s objectives. Scores between 0.40 and 0.70 indicate partial achievement. Scores below 0.40 signal significant system gaps requiring priority attention in the city’s Integrated Mobility Plan.
Each score must be supported by evidence from secondary data sources. The ‘Comments / Notes of Evidence’ column in the framework spreadsheet captures the specific data source, document reference, or contextual note underpinning each score. Typical sources include:
• Statutory plans — Development Plans, Master Plans, zoning regulations, notified mobility policies
• Public transport authority records — service data, fleet registers, ridership, operational performance
• GIS and spatial data — accessibility analysis, network coverage, land use patterns
• Government reports — air quality data (CPCB / SPCB), accident records (MoRTH), disaster management plans
• ITS and digital systems — GPS tracking data, GTFS feeds, ticketing systems, RTPI platforms
• User surveys and studies — perception of safety, affordability assessment, gender-disaggregated travel data
Detailed scoring examples for each parameter — translating the generic 1–5 scale into context-specific thresholds and source references — are provided in the Scoring Examples sheet accompanying the IMP Evaluation Framework spreadsheet tool.
The IMP Evaluation Framework departs from conventional transport planning approaches in five important respects, each of which directly addresses a documented gap in the current practice of urban mobility planning in Indian cities.
Innovation
Supply-Led Diagnostic Approach
Mainstreaming of Climate and Air Quality Objectives
Description
Rather than forecasting future demand and sizing infrastructure accordingly, the framework diagnoses existing system performance and identifies where current supply falls short of equitable, sustainable service delivery. This enables faster and more targeted interventions without requiring years of primary data collection.
Air quality improvement and climate resilience are integrated as core planning objectives across multiple pillars, directly linking mobility interventions to NCAP targets, GHG reduction commitments, and climate adaptation requirements. This makes the framework uniquely suited to cities preparing Clean Air Action Plans alongside Comprehensive Mobility Plans.
Recognition of Informal Mobility Systems
Gender and Accessibility as Structural Requirements
The framework explicitly incorporates intermediate public transport (IPT), street vending, and informal sector workers as integral components of the mobility ecosystem rather than peripheral elements. This reflects the operational reality of Indian cities and ensures that planning responses are grounded in existing travel patterns.
Gender-sensitive design, safety measures, and accessibility for differently abled users are embedded across multiple pillars rather than treated as add-on considerations. This reflects the SUM-ACA project’s commitment to socially balanced mobility planning and aligns with GUMP’s equity objectives.
Scalable, Comparable Assessment
The standardised 1–5 scoring system enables comparison of mobility system maturity across cities and over time. This supports evidence-based prioritisation, benchmarking against peer cities, and monitoring of progress towards national and GUMP targets.
The IMP Evaluation Framework draws on the following primary policy, technical, and practitioner references:
1. MoHUA (2014) National Urban Transport Policy. Government of India.
2. MoUD (2012) Service Level Benchmarks for Urban Transport – Methodology & Manual. Government of India.
3. MoHUA (2014) Comprehensive Mobility Plan (CMP) Toolkit. Government of India.
4. MoHUA (2017) National TOD Policy. Government of India.
5. MoEFCC / CPCB (2019) National Clean Air Programme (NCAP). Government of India.
6. MoHUA (2021) Harmonised Guidelines and Standards for Universal Accessibility in India. Government of India.
7. MoHUA (2020) ClimateSmart Cities Assessment Framework 2.0. Government of India.
8. MoRTH (2018) AIS-140 Intelligent Transport Systems (Vehicle Tracking). Government of India.
9. MoRTH (2023) Road Accidents in India. Government of India.
10. EU / Rupprecht Consult (2019) Guidelines for Developing and Implementing a Sustainable Urban Mobility Plan, 2nd Edition. ELTIS.
11. ITDP (2016) Complete Streets: Planning & Design Workbook. ITDP India.
12. ITDP (2017) Women and Transport in Indian Cities. ITDP India.
13. WRI India (2021) Creating Low-Emission Zones in Indian Cities. WRI India.
14. World Bank (2022) Toolkit for Enabling Gender Responsive Urban Mobility and Public Spaces in India. World Bank.
15. GIZ (2021) MaaS Readiness Level for India (MRLI). Deutsche Gesellschaft für Internationale Zusammenarbeit (GIZ) GmbH.
16. GIZ (2023) On-Street Parking Management for Small and Medium Towns. GIZ GmbH.
17. NDMA (2010) National Guidelines on Urban Flooding. National Disaster Management Authority.
18. MoHUA (2017) Metro Rail Policy. Government of India.
19. MoUD (2017) Value Capture Finance Policy Framework. Government of India.
20. Street Vendors (Protection of Livelihood and Regulation of Street Vending) Act (2014). Government of India.
21. MoRTH Circular: Protocol for Black Spot Identification and Rectification (2015 / 2019). Government of India.
22. IRC 131 (2022) Guidelines for Identifying and Treating Blackspots. Indian Roads Congress.
23. WRI India (2016–2021) Safe Access to Schools. WRI India.
24. NPCI (2019–2020) National Common Mobility Card (NCMC) Specifications. National Payments Corporation of India.
Rourkela is an industrial city built around the Rourkela Steel Plant (SAIL). Its structure - a steel plant at the core, a workers’ township, a civil township, and 52 peripheral villages, generates concentrated daily commuter travel, making cycling a naturally dominant mode. The Ring Road links all these zones and is the primary corridor for intervention.
The planning area covers 259.18 sq. km. The Ring Road loops through the steel plant, both townships and surrounding villages, serving as the spine of daily commuter movement for tens of thousands of workers and residents
Planning Zone Administrative Body Key Feature Area/ count
Rourkela Steel Plant SAIL Major employer; primary trip generator Core Zone
Steel Township SAIL Residential colony for plant workers Northern sector
Civil Township Rourkela Municipal Corporation Commercial, institutional and residential Central Sector
Surrounding Villages Rural/ Panchayat Peripheral settlements; commuter source areas 52 villages
Total Planning Area Rourkela Development Planning Area 259.18 sq.km
Table. 5. State Parking Policy Alignment and Implementation
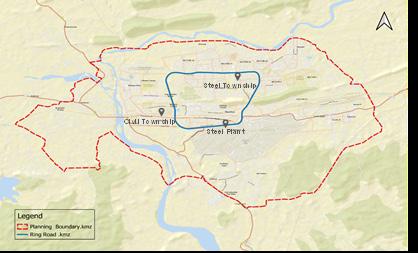
The 2011 Census recorded cycling at 35.7% the single largest mode in Rourkela. By 2026, the Peak Hour Survey shows this has collapsed to just 5.8%, a loss of nearly 30 percentage points. The cause is not sprawl or longer trips, it is unsafe conditions on the Ring
Road, where motor vehicle speeds of 40–60 km/h have progressively pushed cyclists off the carriageway. In their place, 3-wheelers and buses absorbed the lost cycling trips, adding directly to congestion and emissions.
Table. 6. Mode Share Comparison – 2011 Census vs. 2026 Peak Hour Survey
Note: Survey was conducted during peak hour and is treated as representative of work trips. Per capita trip rate: 1.2; total work trip factor: 0.3846
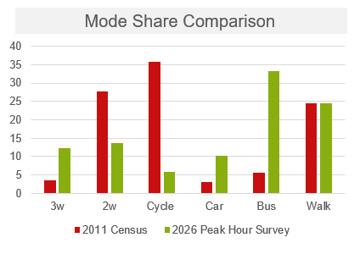
22. Mode Share Comparison Bar Charts – 2011 vs. 2026
Despite the overall mode share decline, junction surveys show the Ring Road remains heavily used by cyclists over 1,350 cyclists per hour at major nodes. This concentration along the central and eastern corridor (driven by steel plant commuters) makes the Ring Road the highest-priority location for dedicated infrastructure. A lower-volume peripheral zone (450–900 cyclists per hour) exists in outer areas, suitable for secondary interventions.
Rourkela Steel Plant SAIL Major employer; primary trip generator Core Zone
Steel Township SAIL Residential colony for plant workers Northern sector
Civil Township Rourkela Municipal Corporation Commercial, institutional and residential Central Sector
Surrounding Villages Rural/ Panchayat Peripheral settlements; commuter source areas
Total Planning Area -- Rourkela Development Planning Area
52 villages
259.18 sq.km
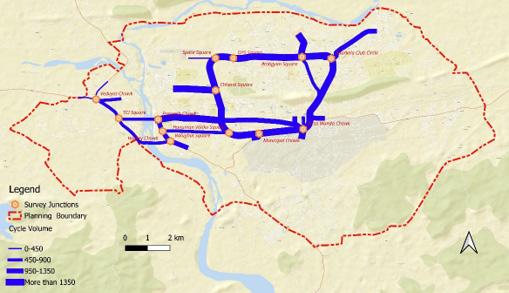
23. Cyclist Activity Pattern Map (cyclists per hour)– Ring Road Corridor
Eight junctions along the Ring Road were selected for detailed traffic and cycling surveys, covering a complete circuit of the 16.2 km corridor. Junctions were prioritised because they are where cycling conflicts are most severe and where infrastructure interventions have the greatest impact. Survey data from these eight points forms the basis for all PCU and LOS calculations in this report.
1 Space Square Northern section 2 DPS Square Northern section 3 Ambgyan Square North-eastern section 4 Rourkela Club Circle Eastern section
5 Birsa Munda Chowk South-eastern section
6 Municipal Chowk Southern section
7 Hanuman Vatika Square South-western section
8 Chhend Square Western section
Table. 8. Cyclist Activity Pattern by Zone – High vs. Lower Cycling Share Areas
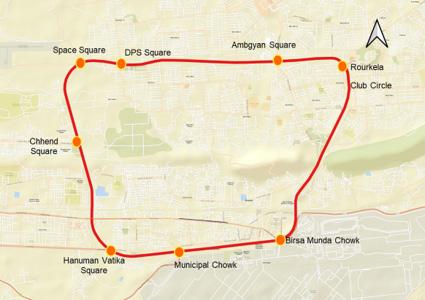
Cyclists currently have no dedicated space on the 16.2 km Ring Road. They share a carriageway where motor vehicles travel at 40–60 km/h. This creates a dual failure: it is unsafe for cyclists, and the slow-moving cyclists create friction that reduces motor vehicle throughput. The table below documents field observations at six key junctions.
Hanuman Vatika
Rourkela Club Circle
Space Chowk
Birsa Munda Chowk
Ambhgyan Square
Cyclists share carriageway with high-speed buses and trucks; no physical separation
Cyclists navigate roundabout in mixed traffic stream; inner-lane cycling common
Cyclists forced to weave through intersection without dedicated crossing or staging area
Bus–cycle conflict at high approach speeds
Merging conflicts; encirclement by motor vehicles
Right-turning vehicle conflict; pedestrian overlap
Very high motorised volume; cyclists squeezed to road edge; no refuge space Highest
Cyclists periodically mount footpath to avoid fastmoving traffic
Footpath encroachment; conflict with pedestrians
Moderate- High
Junction Name Position on Ring Road
DPS Square School pick-up traffic creates surge conditions; cyclists trapped between parked and moving vehicles
Primary
Peak-hour gridlock; cyclist entrapment High
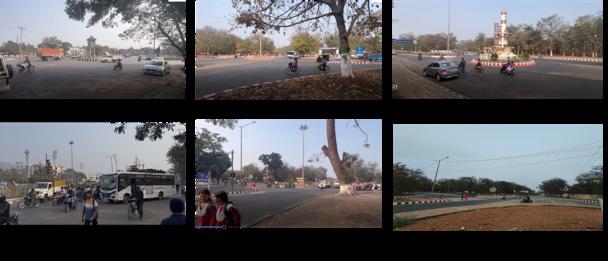
Fig. 25. Field Photographs – Existing Cyclist Conditions at Junctions
The Ring Road consists of two geometric types: a 4-lane divided carriageway (Part A, 10.53 km, 65%) and a 6-lane divided carriageway (Part B, 5.67 km, 35%). Both are median-divided with footpaths. A 2.2 m cycle track can be accommodated
on each side within the existing ROW by using the underused buffer between the footpath and carriageway edge — no land acquisition or lane removal is required.
Road
Divided (Part A)
Divided (Part B)
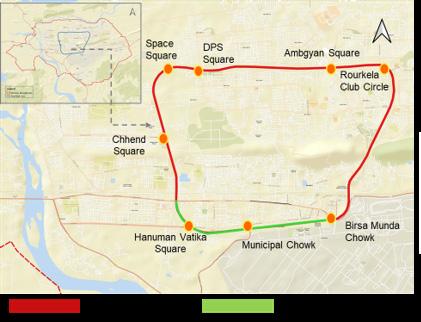
The cross-section breakdown below confirms that a 2.2 m cycle track fits within the existing ROW on both road types. Footpath width is maintained at 2.0 m and no motor vehicle lanes are removed. Cross-Section Element
No. of Lanes (each direction) 2 Lanes 3 lanes
per lane
Carriageway width (one-way)
m per lane
Median Landscaped green median 1.0 m narrow median
Footpath (each side) 2.0m 2.0 m
Available for cycle track 2.2m (within existing ROW) 2.2 m ((within existing ROW)
Cycle track location Between footpath and green belt Between footpath and green belt
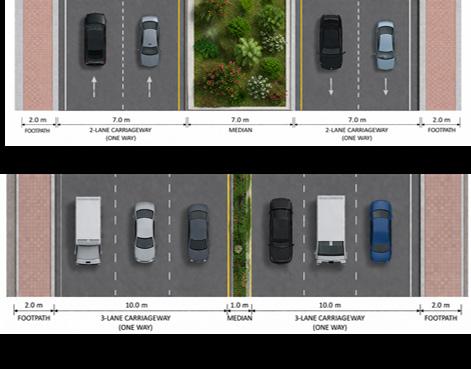
The case for dedicated cycling infrastructure rests on four reinforcing lines of evidence emission impact, traffic safety, untapped student demand, and the persistence of high cycling volumes despite unsafe conditions.
Between 2011 and 2026, approximately 42,000 daily trips shifted from cycling/ walking to motorised modes driven primarily by unsafe road conditions. This single shift adds 5.3 tonnes of CO2 per day to Rourkela. A sub-case: 20,000 trips moving from 2-wheelers to cars adds a further 11 tonnes per day. These are direct, quantifiable costs of the infrastructure gap.
Table. 10. No. of Work Trips by Mode – 2011 Actual vs. 2026 Projected (NBRR Basis)
Case Trigger Scale of Shift Emission Impact
1 NMT → Motorised (2011–2026)
1b 2-Wheeler → Car (sub-case of Case 1)
~42,000 trips shifted; 20% due to steel plant job losses, 80% due to voluntary mode shift
~20,000 trips shifted from 2-wheelers to cars
5.3 tonnes of additional CO2 added to Rourkela daily from this shift alone
~11 additional tonnes of CO2 per day from this shift alone
Table. 11. Emission Impact of NMT-to-Motorised Mode Shift – Cases 1 and 1b
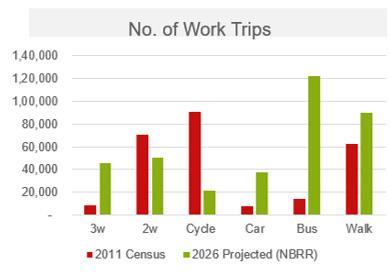
28. Work Trip Volume Comparison Bar Charts – 2011 vs. 2026 (by Mode)
The Ring Road carries traffic at 40–60 km/h. Without a dedicated cycle track, cyclists share this carriageway with buses and trucks, creating friction that reduces effective road capacity and raises accident risk. Providing a segregated track simultaneously improves cyclist safety and restores motor vehicle throughput at no loss of carriageway lanes, as the PCU and LOS analysis confirms the same
The student population grew from 1,15,000 to 1,75,000 between 2011 and 2026, adding 60,000 potential new cyclists. Three-quarters are school-going students with short travel distances ideal for cycling, many of whose schools are directly on the Ring Road corridor. Unsafe conditions currently suppress this demand; a safe cycle track would unlock it, shifting school trips away from peak-hour auto and 2-wheeler traffic.
College students (25% of
Moderate cycling potential; trips up to 5 km
Schools on Ring Road corridor Multiple Multiple Concentrated demand; direct beneficiaries of cycle track
Table. 12. Student Population Growth & Cycling Potential – Rourkela (2011–2026)
Cycling volumes on the Ring Road exceed 950–1,350+ cyclists per hour at major junctions despite the absence of infrastructure. This persistence under
hostile conditions is the strongest evidence of genuine demand. Existing volumes are the floor not the ceiling of what safe infrastructure would generate.
PCU (Passenger Car Unit) analysis converts mixed-vehicle traffic into a standardised measure. This section compares two scenarios existing (cyclists sharing the carriageway) and proposed (cyclists on a dedicated
segregated track) to quantify the traffic efficiency impact of the cycle track. The highest directional PCU at each junction is used for LOS assessment, consistent with standard practice.
PCU values are consistently higher when cyclists share the carriageway, confirming that mixed cycling imposes a friction cost on motor vehicle flow.
However, the magnitude (100–400 PCU reduction per arm) is too small to alter Level of Service on a road with 2,200 PCU/lane capacity.
Note: Two directional PCU readings reported per junction (each row = one approach direction). Maximum capacity per lane = 2,200 PCU/hr. V/C = Volume-to-Capacity Ratio.
Finding With Cyclists (Mixed Traffic) Without Cyclists (Segregated Track)
V/C Ratio Range 0.14 – 0.39
Level of Service (all junctions)
Highest PCU junction
LOS A–B (free flow conditions)
Birsa Munda Chowk (2563.8 PCU)
LOS change with cycle track N/A (baseline)
Traffic efficiency impact
Mixed cycling reduces effective capacity
0.16 – 0.50
LOS A–B (free flow conditions; unchanged)
Birsa Munda Chowk (2182.8 PCU)
No change — LOS remains the same
Removing cyclists improves flow marginally but LOS unchanged
Table. 13. Summary of PCU and LOS Findings – Impact of Cycle Track on Ring Road Traffic Flow
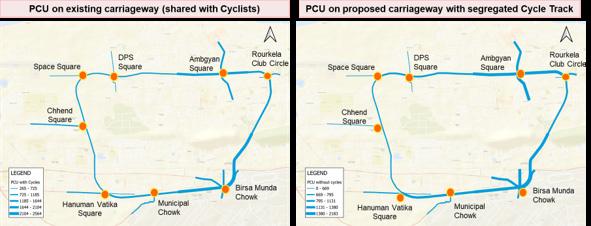
Level of Service (LOS) grades traffic flow quality from A (free flow) to F (breakdown). LOS is calculated from the V/C ratio derived .The key finding: adding a 2.2 m cycle track on both sides of the carriageway leaves LOS unchanged at every junction. All current V/C ratios are well below 0.5, meaning the road operates at under half its capacity. The cycle track does not remove motor vehicle lanes; it formalises space currently used informally by cyclists.
A 0.00- 0.60 Free flow; minimal delay Most arms under existing conditions Traffic moves freely; ample reserve capacity; cycle track addition has no impact
B 0.61- 0.70 Stable flow; acceptable delay A few arms at peak hour Some platooning; cyclists on carriageway may contribute here; track addition maintains LOS B
C 0.71- 0.80 Stable but restricted flow
D >0.80 Approaching or at capacity
All Ring Road junctions operate at LOS A or B under existing conditions. This headroom is sufficient to absorb the minor PCU changes associated with the
A Bus Priority Lane (BPL) is proposed alongside the cycle track on the Ring Road. Bus share has risen to 33.4% by 2026, making it the dominant motorised mode. The BPL ensures buses move
None recorded on Ring Road No Ring Road arms currently in this range; cycle track keeps them out of C
None recorded No junction on Ring Road is near capacity; confirms ample headroom for cycle track
cycle track there is no scenario in which the proposal creates LOS C or worse at any surveyed junction.
predictably and efficiently, strengthening public transport as a genuine alternative to private vehicles. It is proposed exclusively on the Ring Road due to high bus frequency and strategic connectivity.
Design Aspect
Corridor
Lane Position
Lane Width
Pavement Marking
Intersection Treatment
Signal Priority
Specification
Ring Road only
Left side of the median (median-side operation)
3.5 m standard width
Red-coloured pavement surface; “BUS ONLY” markings; overhead signage
BPL ends 250 m before each intersection; merges with general traffic lanes with taper markings
Dedicated bus signal phases at all 8 junctions; advance stop lines for buses
Rationale
High bus movement and strategic connectivity; dedicated lane most effective on high-frequency corridor
Reduces conflicts with curbside activities (hawkers, parked vehicles, pedestrians crossing); improves bus predictability
Accommodates city buses (2.5 m wide) safely with lateral clearance; standard BPL specification
High visibility for compliance and enforcement; distinguishes BPL from general traffic lanes
Avoids weaving conflicts at junctions; allows smooth reentry; taper markings ensure advance warning
Ensures priority movement for buses; reduces dwell time at signals; key to making BPL effective in practice
Table. 14. Bus Priority Lane Design – Specifications and Rationale
The BPL (median-side) and cycle track (footpath-side) occupy different lateral positions within the cross-section and do not conflict physically. Motor vehicle lanes between them are unchanged.
The proposed cycle track is a 2.2 m segregated lane on each side of the Ring Road carriageway, continuous across the full 16.2 km loop. It addresses all
four cases, fits entirely within the existing ROW, requires no land acquisition, and produces no change in motor vehicle LOS at any surveyed junction.
Design Aspect Specification Rationale
Cycle Track Width
2.2 m on each side of carriageway
Green Belt / Buffer 0.8 m separating cycle track from carriageway
Placement
Capacity
Impact on Motor LOS
Both sides of the carriageway (bi-directional)
4,000–4,500 cyclists per hour per direction
No change in motor vehicle Level of Service
Pavement Surface Red-coloured surface recommended
Continuity
Uninterrupted 16.2 km loop
High bus movement and strategic connectivity; dedicated lane most effective on high-frequency corridor
Reduces conflicts with curbside activities (hawkers, parked vehicles, pedestrians crossing); improves bus predictability
Accommodates city buses (2.5 m wide) safely with lateral clearance; standard BPL specification
High visibility for compliance and enforcement; distinguishes BPL from general traffic lanes
Avoids weaving conflicts at junctions; allows smooth reentry; taper markings ensure advance warning
Ensures priority movement for buses; reduces dwell time at signals; key to making BPL effective in practice consistent with national NMT guidelines
No breaks or gaps in the cycle track; continuous protection from motor traffic throughout
Table. 15. Proposed Cycle Track – Design Elements, Specifications and Notes
The cycle track uses the space between the existing footpath and carriageway edge currently an unpaved buffer or grass verge re-engineered as a 2.2
m cycle track with an 0.8 m green belt buffer. Footpath and carriageway widths are unchanged. Cycle track elements are highlighted in green below.
Element
Footpath 2.0 m
Cycle Track 2.2 m
Green Belt / Buffer 0.8 m
2-Lane Carriageway (oneway) 7.0 m
Median 1.5 m
2-Lane Carriageway (oneway) 7.0 m
Green Belt / Buffer 0.8 m
Cycle Track 2.2 m
Footpath 2.0 m
Pedestrian movement; maintained at existing width
Dedicated segregated cycle lane (one direction per side)
Physical separation between cycle track and carriageway
Motor vehicle lanes — unchanged from existing; 2 lanes × 3.5 m
Central divider; separates opposing traffic directions
Motor vehicle lanes — mirrored on opposite side
Same as opposite side
Dedicated cycle lane — opposite direction of travel
Pedestrian movement — maintained at existing width
Table. 16. Proposed Carriageway Cross-Section Elements – Ring Road with 2.2m Cycle Track (4-Lane Section)
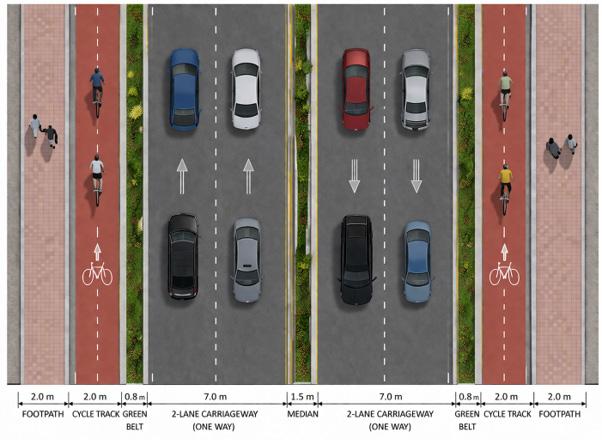
31. Proposed Carriageway Cross-Section – Top View with Cycle Track
[Cross-section showing:
|
|
Kacheri Road is one of the most commercially active corridors in Rourkela, running through the heart of the civil township. The road serves a dense mix of daily needs shops, wholesale markets, retail outlets, and government offices,
|
generating significant parking demand across all times of the day. This annexure defines the four study stretches that form the basis of the parking assessment and documents the known problems, prior proposals, and their limitations.
The study corridor has been divided into four stretches (P1 through P4) for survey and analysis purposes. Stretches P1, P2, and P3 have a similar Right-ofWay (ROW) of 12–15 m, making them relatively narrow for a busy mixed-use
corridor. Stretch P4 is distinctly wider at 20–23 m, with a median, which fundamentally changes the feasible parking arrangement. Together, the four stretches span a total corridor length of approximately 3.81 km.
Stretch
P1 1.10 km 12–15 m
P2 0.95 km 12–15 m
P3 0.83 km 12–15 m
P4 0.93 km 20–23 m
Daily needs & wholesale market
Wholesale market & SCOs
Offices & retail market
Government offices & retail
Narrow carriageway; heavy footfall; mix of retail and hawker activity
Service-commercial overlay; moderate turning movements; delivery vehicles frequent
Officegoers generate longterm parking demand; retail adds short-term demand
Widest stretch; mediandivided; parking feasible on both sides; smoother traffic flow
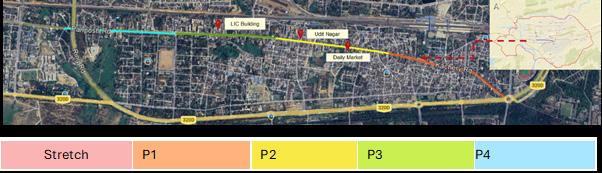
Prior to this study, the parking situation along Kacheri Road had been acknowledged in stakeholder discussions involving the Rourkela Development Authority (RDA), the Smart City office, and the Steel Authority of India (SAIL). Two key problems were identified: high and unmanaged parking
demand in the existing market areas, and a complete absence of planning for emerging demand near new commercial zones such as the LIC Building area and Udit Nagar. The table below summarises the problem, the existing policy response, and its limitations.
Problem Identified Existing Proposals Limitations of Existing Proposals
High parking demand in market areas along Panposh / Kacheri Road and Daily Market
No parking planned in upcoming market areas near LIC Office and Udit Nagar
Multi-Level Car Parking (MLCP) proposed at Mehtab Road; one-way traffic and pedestrianisation of some stretches
Provision to plan parking in these new demand zones
Existing on-street parking is unlikely to shift to MLCP due to accessibility issues. Risk of MLCP underutilisation and displacement of parking to adjacent streets if restrictions are imposed without alternative supply.
No clear capacity or design parameters have been defined for these proposed facilities.
Table. 18. Parking Problems, Existing Proposals and Their Limitations – Kacheri Road Corridor
The core gap in the existing approach is the reliance on a single large-format MLCP solution without adequately assessing user willingness to walk, the actual demand profile by duration, or the
capacity shortfall in specific stretches. This study addresses those gaps through field surveys and structured demand analysis.
Before proposing any changes, the existing condition of parking along Kacheri Road was documented through field observation and measurement. This annexure presents the crosssectional geometry of each stretch and the observed parking behaviour. Understanding the existing physical constraints is essential for determining what is feasible within the available ROW without major road widening
Stretches P1, P2, and P3 are characterised by a narrow ROW of 12–15 m. Within this envelope, a oneway carriageway of approximately 7 m is accommodated, with slim footpaths of about 1 m on either side. In practice, much of the footpath space is encroached by hawkers and parked two-wheelers, further reducing pedestrian and vehicular movement. Parking in these stretches is unorganised and predominantly perpendicular or random, which leads
to significant traffic friction as vehicles manoeuvre in and out of parking spaces within the main traffic lane.
Stretch P4 is significantly wider at 20–23 m and is divided by a median. It accommodates two-way traffic across its two carriageways and allows parking on both sides. The physical condition in P4 is comparatively better, with wider footpaths and less severe congestion from parking manoeuvres.
P1 12–15 m ~7 m (one-way) ~1 m each side
P2 12–15 m ~7 m (one-way) ~1 m each side
P3 12–15 m ~7 m (one-way) ~1 m each side
P4 20–23 m 2 × 7 m + median ~2 m each side
One side; unorganised; perpendicular/random
One side; unorganised
One side; unorganised; footpath often encroached
Both sides; wider; relatively organised
Table. 19. Existing Road Cross-Section and Parking Configuration by Stretch

The photographs below illustrate the stark difference in road character between Stretches P1–P3 and Stretch P4. Stretches P1–P3 show a narrow, cluttered streetscape with vehicles parked informally on one side,
significantly reducing the effective carriageway width. In contrast, Stretch P4 presents a wider, more ordered environment with a visible median and better pedestrian infrastructure.
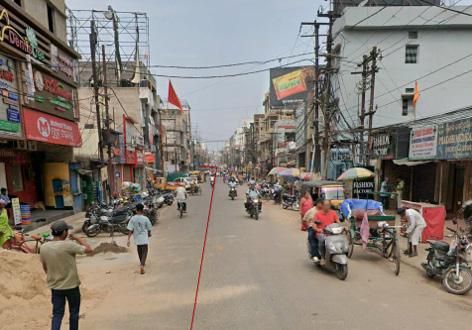
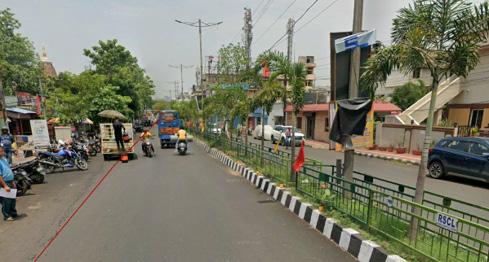
A parking accumulation and duration survey was conducted along a 125-metre sample stretch of Kacheri Road on a weekend (Saturday), which represents peak demand conditions. Observations were recorded at six-time intervals from 7:00 to 21:00 hours. The data captures the number of parked vehicles by type at each interval, providing the basis for calculating parking demand in Equivalent Car Space (ECS) units.
The table below shows the number of vehicles of each type observed parked at each survey time. Two-wheelers dominate the parking demand, accounting for 485 out of 708 total observations (68% of all parked vehicles). Four-wheelers account for 101 observations (14%), followed by cycles (78, or 11%) and handcarts (23, or 3%). LCV demand is minimal at 2
observations across the day. Peak parking demand occurs between 14:00 and 18:00 hours, with the highest single observation at 18:00 (155 vehicles), driven primarily by 2-wheelers. The early morning slot (7:00) shows the lowest activity, consistent with market areas that open later in the day.
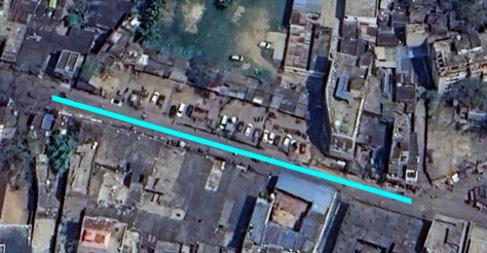
Beyond the count of parked vehicles, the survey also captured how long each vehicle was parked. This duration data is fundamental to distinguishing short-term demand (visitors, shoppers) from longterm demand (workers, office-goers) and overnight parking (residents, vendors).
The duration categories used are: Short Term (≤2 hrs and 2–4 hrs), Long Term (>4–<8 hrs and 8–10 hrs), and Overnight (>10 hrs and night parking).
For 2-wheelers, the dominant share
falls in the 2–4 hour bracket (51%), indicating that most two-wheeler users are shoppers or visitors. A significant overnight component (4%) is also noted. For 4-wheelers, the distribution is more spread, with 40% in the 2–4 hour range and a notable overnight/night share (~34–38%). 3-wheelers show a predominantly short-to-medium stay pattern. LCV parking is entirely shortterm.
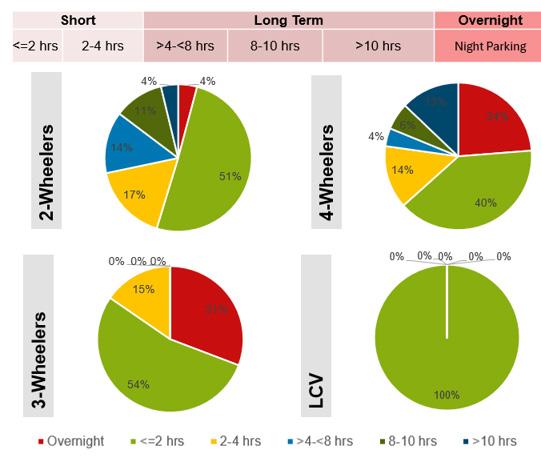
Demand by Duration Category and Vehicle Type (Sample Stretch, Weekend)
Parking Demand by Duration Category and Vehicle Type (Sample Stretch, Weekend)
The raw vehicle counts from the survey are converted into Equivalent Car Space (ECS) units to arrive at a standardised measure of parking demand. ECS normalises demand across different vehicle types by expressing everything relative to a standard 4-wheeler car space. This conversion is essential because 2-wheelers, cycles, and handcarts require very different amounts of physical space per unit.
The ECS demand derived from the 125 m sample stretch is then scaled proportionally to estimate corridorwide demand for all four stretches. The analysis distinguishes between shortterm, long-term, and overnight demand , each of which calls for a different management and pricing approach.
The table below shows the number of individual vehicle spaces required by type across short-term, long-term, and overnight categories, along with the average duration of stay. Long-term
4-Wheeler demand (9.67 vehicles, avg stay 9.66 hrs) is notably high. Twowheelers have the highest count in both short and long-term categories.
Table. 22. Number of Vehicle Spaces Required by Type & Duration Category – Sample Stretch (125
Converting vehicle spaces to ECS reveals the true space requirement. Handcarts, despite low vehicle numbers, consume significant ECS due to their larger footprint. The split between short-term (43%) and long-term (57%) ECS demand has direct implications for parking strategy: a majority of the physical space requirement is driven by long-stay users, suggesting that structured off-street parking (with lower tariffs) is needed to absorb long-term demand, while on-street space should
be reserved and priced for high-turnover short-term users.
Key finding: Night-time parking demand (20.55 ECS) represents 56% of the combined short- and long-term daytime ECS demand (36.75 ECS). This is substantial and must be factored into any on-street management scheme, as free overnight parking may serve residential needs.
Note: ECS conversion factors: 2-Wheeler = 0.25; 3-Wheeler/Auto = 1.20; 4-Wheeler = 1.00 (base); LCV = 2.00; Handcart = 2.00; Cycle = 0.50. Short Term = 43% of total ECS; Long Term = 57% of total ECS.
The demand survey methodology applied to the 125 m sample stretch was extended proportionally to estimate demand across all four stretches of Kacheri Road. This corridor-wide analysis compares the actual peak-hour demand with the
available parking supply, identifies where surplus or deficit exists, and provides the basis for the parking management and pricing strategy.
The demand survey methodology applied to the 125 m sample stretch was extended proportionally to estimate demand across all four stretches of Kacheri Road. This corridor-wide
analysis compares the actual peak-hour demand with the available parking supply, identifies where surplus or deficit exists, and provides the basis for the parking management and pricing strategy.
The peak observed demand across the four stretches was measured at 5:30 PM on a Saturday, representing the highest demand scenario. P3 records the highest total demand at 164 vehicles (115 ECS), while P4 has the lowest vehicle count at 107 (67 ECS), partly because its wider road allows for more dispersed parking.
Handcarts are a particularly significant demand category in ECS terms — despite relatively low vehicle numbers, their larger space requirement (ECS factor of 2.0) means they account for the single largest ECS component (150.5 ECS out of 309.5 total).
5:30 PM, Saturday
The capacity analysis compares the available parallel on-street parking supply (after accounting for no-parking zones, junctions, bus stops, and other restrictions) against the observed peak demand. At the corridor level, total supply (503 ECS) comfortably exceeds total demand (309 ECS), giving an overall Capacity-to-Demand Ratio of 1.6.
However, this aggregate picture masks a localised deficit in Stretch P3 (ratio 0.7), where demand exceeds supply. The analysis shows that this excess demand can be redirected to adjacent stretches P2 (ratio 1.3) and P4 (ratio 3.3) with proper signage and management — without requiring additional physical infrastructure.
The introduction of managed, paid parking along Kacheri Road has significant revenue generation potential. This annexure presents the proposed tariff structure and the estimated annual revenues from both short-term (on-street) and long-term parking across all four stretches. Revenue from parking fees
can fund enforcement and management operations, cross-subsidise lower longterm tariffs, and support broader urban mobility improvements.
The tariff structure is designed around the principle of demand management: on-street short-term parking is priced at a premium to discourage long stays and ensure high turnover, while longterm parking (proposed off-street or in
2- Wheeler
4- Wheeler
3-Wheeler
10 per hour
20 per hour
20 per hour
less-demand corridors) carries a lower block-rate tariff. Night-time parking (9:00 PM to 9:00 AM) is proposed to remain free to accommodate residential needs and reduce social resistance to the paid parking scheme.
10 per 4 hours Hourly / Block
20 per 4 hours Hourly / Block
20 per 4 hours Hourly / Block LCV
20 per hour
Night Parking (9 PM–9 AM) Free (residential need)
20 per 4 hours Hourly / Block
Social consideration
Revenue projections are computed by applying the tariff rates to the estimated long-term and short-term ECS demand for each stretch, factored across 365 operating days per year. Stretch P3 generates the highest revenue potential at ₹ 1.047 Crore per year, driven by its significant 4-wheeler long-term demand from adjacent offices. At the corridor level, the total annual revenue potential is estimated at approximately ₹ 3.05 Crore
— with long-term parking contributing ₹ 1.36 Crore and short-term contributing ₹ 1.69 Crore.
This revenue stream is substantial enough to cover the cost of a parking management operator contract, enforcement, signage, and technology (ticketing/app), while still returning a net surplus to the municipal authority or concessionaire.
Table. 28. Annual Revenue Projection from Paid Parking by Stretch – Long Term & Short Term
Note: Revenue calculations assume 365 operating days. Tariff rates: 2W – ₹10/hr (ST) and ₹10/4 hrs (LT); 4W/3W/ LCV – ₹20/hr (ST) and ₹20/4 hrs (LT). Night parking (9 PM–9 AM) is excluded from revenue estimates.
The parking planning strategy for Kacheri Road is based on a clear understanding of the demand profile, the physical constraints of the corridor, and the behavioural characteristics of different user groups. The overarching approach is to organise what currently exists in an unmanaged state, differentiate between user types, and use pricing as a tool to balance demand and supply rather than simply adding more supply.
The strategy is guided by evidence from the demand survey and international best practices in on-street parking management for mixed-use commercial corridors. It recognises that simply restricting parking without providing alternatives will displace demand — not eliminate it. Accordingly, it proposes a layered response: short-term on-street, long-term off-street, and free overnight, each targeted at a specific user segment.
On-street for short-term users
Off-street for long-term users
Short-term revenue subsidises long-term
Single operator model
Price on-street parking at a premium to prioritise shortstay, high-turnover users
Accommodate long-term demand in structured offstreet facilities at lower block-rate tariffs
Revenue from premium on-street parking used to subsidise lower off-street tariffs
Both on-street and off-street facilities managed under a single area-based parking management contract
Discourages long stays; improves space availability for shoppers and visitors
Long-term users are more willing to walk; off-street absorbs bulk of space demand
Makes system equitable; reduces resistance from daily workers and commuters
Operational efficiency; uniform enforcement; better demand tracking and reporting
Parallel parking over perpendicular
Free night-time parking
Long-term in low-demand corridors
Demand management through pricing Paid parking discourages unchecked growth in vehicle parking demand over time
Convert existing unorganised perpendicular/ random parking to organised parallel parking bays (7 m per bay)
On-street parking free from 9:00 PM to 9:00 AM to meet residential and vendor overnight needs
Redirect long-term parking demand to less-congested stretches or off the main corridor
Paid parking discourages unchecked growth in vehicle parking demand over time
Table. 29. Proposed On-Street Parallel Parking Plan
This annexure presents the proposed onstreet parallel parking layout for Kacheri Road, covering all four stretches. The proposal retains the existing ROW without requiring any land acquisition or structural changes. The key design decision is to convert from the current unorganised,
Reduces turning manoeuvres in traffic lane; lowers friction; improves traffic flow
Accounts for 56% of daytime demand equivalent; reduces social opposition to paid scheme
Frees up premium P3 frontage; reduces peakhour congestion in busiest stretches
Signals to users that parking is a priced resource; promotes modal shift over time
often perpendicular parking to a clearly marked parallel parking system. The proposed cross-sections are designed to balance parking provision, carriageway function, and pedestrian safety within the available ROW.
The tariff structure is designed around the principle of demand management: on-street short-term parking is priced at a premium to discourage long stays and ensure high turnover, while longterm parking (proposed off-street or in
less-demand corridors) carries a lower block-rate tariff. Night-time parking (9:00 PM to 9:00 AM) is proposed to remain free to accommodate residential needs and reduce social resistance to the paid parking scheme.
P3
P4
Table. 30. Proposed Cross-Section Elements by Stretch – Kacheri Road Parallel Parking Layout Aspect
Parking orientation
Parking on P1, P2, P3
Parking on P4
Footpath
Carriageway
Management
Unorganised; perpendicular/ random
Informal on one side, no dedicated bay markings
Informal on both sides
~1 m (often encroached)
~7 m but reduced by parking manoeuvres
Unmanaged; free; no enforcement
Table. 31. Comparison: Existing vs. Proposed Conditions
Organised parallel parking bays (7 m per bay)
Formal parallel bays on one side; markings and signage
Formal parallel bays on both sides; median separates directions
1.5 m (P1–P3) and 2.0 m (P4); cleared of encroachment
7 m protected; parallel parking does not reduce effective width
Paid parking; managed by operator; enforcement via warden staff
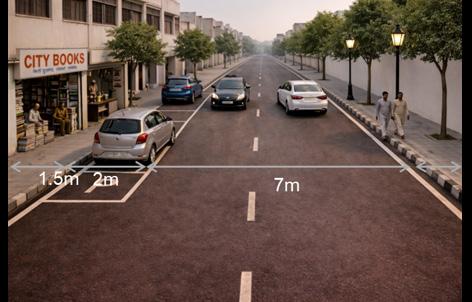
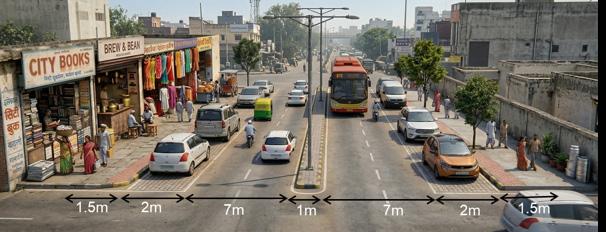
Three high-crash rotary intersections in Rourkela Panposh Chowk, DPS Square, and Birsa Munda Chowk have been identified for redesign as modern roundabouts. The existing rotaries were adequate when traffic volumes and speeds were lower, but rising motorisation has made them unsafe and operationally inefficient. The proposed
redesign follows Indian Roads Congress (IRC) standards, specifically IRC 65:2017 (roundabout design), IRC 103:2022 (pedestrian facilities), and IRC 11:2015 (traffic calming). This annexure sets out the five design principles that govern all three junction proposals and the specific reason each junction has been selected for intervention.
The five principles below form the design framework for all three junctions. Each principle addresses a specific failure mode of the existing rotary geometry — from the absence of pedestrian crossings to the lack of speed control. Together,
they shift the design philosophy from one that accommodates motor vehicles at the expense of safety to one that enforces safe behaviour through physical geometry rather than relying on driver compliance.
1 Safety & Conflict Reduction Minimise conflict points; segregate pedestrians, cyclists, and vehicles; ensure adequate sight distance; use refuge islands/medians
2 Pedestrian Safe Crossing Design Crossings on natural desire lines; short and direct crossings; refuge islands for wide roads; raised crossings on all roundabout arms
3 Accessibility & Universal Design
4 Traffic Calming at Junctions
5 Speed Control by Geometry
Barrier-free continuous footpaths; kerb ramps at all crossings; tactile paving for visually impaired; adequate width for wheelchair access
Reduce vehicle speeds using raised intersections; rumble strips; speed tables; tight corner radii to control turning speeds
Horizontal deflection at entries to force speed reduction; small entry radii; avoid long straight approaches; use roundabout or staggered intersection geometry
Roundabout geometry reduces crossing points from 32 (signalised cross) to 8; splitter islands create physical separation between modes
Raised crossings (3m wide, +150mm) on every arm; 1:10 cobblestone ramps; splitter islands provide two-stage crossing refuge for pedestrians
Footpath level revised to +150mm (from +230mm existing) for easier ramp gradients; tactile paving and kerb cuts at all road openings
Cobblestone finish on conflictprone entries acts as natural speed deterrent; raised crossing platforms physically slow turning vehicles
IRC 65:2017 compliant entry geometry with sharper radii enforces ~30 km/h approach speeds; different entry and exit radii control deceleration/ acceleration separately
Table. 32. IRC-Based Safe Junction Design Principles – Requirements and Design Responses
Note: References: IRC 65:2017 (Roundabout design); IRC 103:2022 (Pedestrian facilities); IRC 11:2015 (Traffic calming). All three proposed junctions are designed to comply with these standards.
The three junctions below were selected on the basis of documented high crash rates, known operational failures (police control, signal proposals), and
Junction
Panposh Chowk
DPS Square
Birsa Munda Chowk
the presence of vulnerable road users (pedestrians, cyclists, school children) who are currently unprotected by the existing geometry.
High highway traffic volume Regional highway traffic from Sambalpur converges with urban traffic; high approach speeds; inadequate NMT provision on a busy multi-modal corridor
School zone with high student and pedestrian activity
6-arm junction with complex vehicle movements and very high traffic load
Located adjacent to a major school (DPS); morning and afternoon peak hours see surge in student pedestrians and parent vehicles; current geometry offers no safe crossing or pedestrian refuge
Six arms, small central island (20.5m diameter), and ~8,000–9,000 PCU (above standard capacity); currently requires active police management and is planned for signalisation by Smart City Limited; weaving conflicts are severe
Table. 33. Junctions Identified for Redesign – Primary Reason and Current Operational Problems
A modern roundabout is fundamentally different from the older rotary intersections it replaces — not just in appearance, but in the physical mechanism by which it achieves safety. An old-style rotary relies on driver behaviour (speed choice, gap acceptance, courtesy) to manage conflict. A modern roundabout, by contrast, uses geometry itself to enforce safe speeds and orderly yield
behaviour: it is impossible to travel at high speed through a properly designed roundabout because the road layout physically prevents it. This section explains the five design features that make modern roundabouts work, and directly compares them against the existing rotary conditions at the three proposed junctions.
Each of the five features below directly addresses a specific failure mode of the existing Rourkela rotaries. The table should be read as a cause-and-effect
document: the existing problem is the cause; the roundabout feature is the design response.
1 Geometry-Induced Speed Control
Compact inscribed diameter, entry curvature and deflection, different entry and exit radii, traversable apron — all physically enforce approach speeds of ~30 km/h
Existing rotaries have same entry/exit radii and over-wide circulatory roads that allow vehicles to maintain high speeds through the junction. Modern roundabout removes this option by design.
2 Yield-Controlled Priority & Conflict Reduction
3 Legibility, Visibility & User Guidance
Circulating traffic has right-of-way; entering vehicles must yield. This eliminates weaving within the circulatory roadway and reduces conflict points from ~32 (signalised) to ~8
Clear entry geometry guides driver behaviour; advance direction signage; yield signs and pavement markings reinforce priority; consistent design aids user understanding
4 Efficient & Resilient Operations Handles varying and unbalanced traffic flows; reduces delay compared to signals at medium volumes; avoids gridlock under peak surges; operates without continuous signal control
5 Integrated Multimodal Safety
Pedestrian crossings on all arms set back from circulatory road; splitter islands as refuges; segregated cycle tracks; continuous footpaths; bus stops within 30–50m
Existing rotaries prioritise entering traffic, forcing circulating vehicles to weave and negotiate. With 6 arms and a small island (Birsa Munda), this creates constant conflict and gridlock risk under uneven flows.
Existing rotaries offer no entry deflection, minimal signage, and inconsistent geometry. Drivers approach at speed without clear visual cues to decelerate or yield, increasing crash risk.
At Birsa Munda (~8,000–9,000 PCU), the existing rotary has failed — it requires active police control and is being planned for signalisation. A properly designed 2-lane roundabout can handle this volume with part-time signals only at peaks.
Existing rotaries have no pedestrian crossings, no cycle tracks, no bus stop integration, and no footpath continuity through or around the intersection. All three proposed junctions provide full NMT infrastructure.
Table. 34. Modern Roundabout Design Features – Mechanism and Improvement over Existing Rotaries
The table below compresses the key differences into a direct head-to-head comparison across eight parameters. This comparison is particularly important for Birsa Munda Chowk, which already operates above standard capacity (~8,000–9,000 PCU vs. the 6,000 PCU/
Speed control
Traffic priority
Conflict points
Pedestrian crossings
Cycle infrastructure
Bus stop integration
hr threshold for unsignalised operation) and requires police management. The proposed 2-lane elliptical roundabout with part-time signals is projected to handle the existing and near-future volumes without continuous police intervention.
None by design; relies on driver compliance
Entering traffic has priority; causes weaving
Multiple (weaving + entry + exit simultaneous)
None provided
None provided
None
Signalisation need Birsa Munda already needs police + signals
Capacity threshold
No clear capacity; fails under high volume
Enforced by entry geometry (~30 km/h)
Circulating traffic has priority; yield at entry
Reduced to ~8 one-at-atime conflict points
Raised 3m crossings on all arms at +150mm
2.2m segregated cycle track (DPS and Birsa Munda)
Bus stops within 30–50m; IPT bays at DPS Chowk
Part-time signals at peak only (Birsa Munda); no signals needed at Panposh and DPS under current volumes
~6,000 PCU/hr (2-lane); Birsa Munda: part-time signals above this
Fig. 41. Existing Rotary vs. Modern Roundabout – Head-to-Head Comparison (All Three Junctions)
Panposh Chowk is a 3-arm (T-junction) rotary at the confluence of the Sambalpur–Rourkela highway approach and two urban roads (Panposh Road and Hockey Chowk). Its primary problem is the high-speed highway traffic that enters the junction from the Sambalpur side, creating a speed differential between regional highway vehicles and urban traffic that makes the junction unsafe,
particularly for the significant cyclist and pedestrian population that crosses here. Cyclist share at this junction ranges from 7–12%, unusually high for a highway interchange. The proposed 2-lane modern roundabout redesign maintains all existing carriageway widths, reduces approach speeds through geometric deflection, and introduces full pedestrian crossing infrastructure for the first time.
Traffic volume counts were conducted at peak hour, recording all vehicle movements between the three arms (A = Sambalpur approach, B = Panposh Road, C = Hockey Chowk). The total PCU of 6,699 is below the standard 6,000 PCU/hr capacity of a 2-lane
modern roundabout when considered per arm — the highest single arm (B) carries 2,394.3 PCU, leaving significant headroom. The cyclist share of 7–12% across all movements confirms the need for dedicated cycle infrastructure at this junction.
A = Sambalpur–Rourkela highway approach
= Panposh Road approach
Fig. 42. Traffic Volume Count – Panposh Chowk (Peak Hour, All Movements)
3-arm (T) junction
Note: Arm A = Towards Sambalpur–Rourkela; Arm B = Towards Panposh Road; Arm C = Towards Hockey Chowk. Total PCU = 6,699; per-arm capacity of 2-lane roundabout = 6,000 PCU/hr. Junction is below capacity.
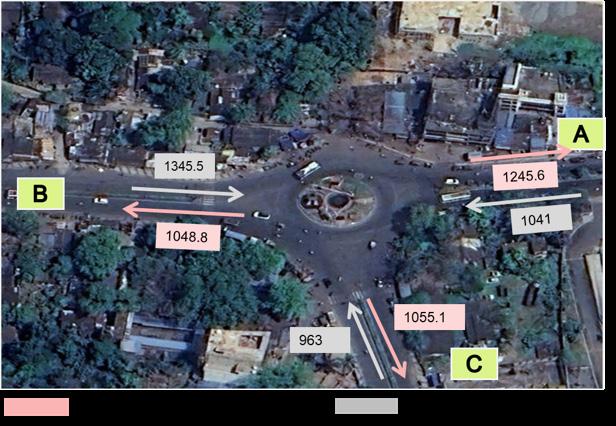
The geometry comparison below shows the changes between the existing rotary and the proposed roundabout. The most significant changes are the introduction of pedestrian crossings (none currently exist) and the revision of footpath level from +230mm to +150mm, which
reduces the ramp gradient required to be accessible and improves compliance with universal design standards. Carriageway widths are largely unchanged, confirming that the redesign can be implemented without road widening or land acquisition.
Carriageway – Sambalpur arm
m (one-way)
Carriageway – Panposh & Hockey 7.5 m (one-way each)
Median – Sambalpur arm
Median – Panposh & Hockey arms
m
m
m (slightly reduced for better geometry)
m (unchanged)
m (unchanged)
m (widened)
m (Panposh); 1.4 m (Hockey Chowk)
Footpath width 2.0 m (all arms) 2.0–3.0 m (widened at key pedestrian zones)
Footpath level
+230 mm above carriageway
+150 mm (revised for improved accessibility and gentler ramps)
Pedestrian crossings
Ramps at road openings
Signalisation
None provided Raised 3 m wide crossings on all arms; +150 mm level; 1:10 ramps in cobblestone
Not provided Adequate ramps at all openings; 1:10 gradient
Unsignalised rotary Not required; 3,350 PCU is well below 6,000 PCU/hr roundabout capacity
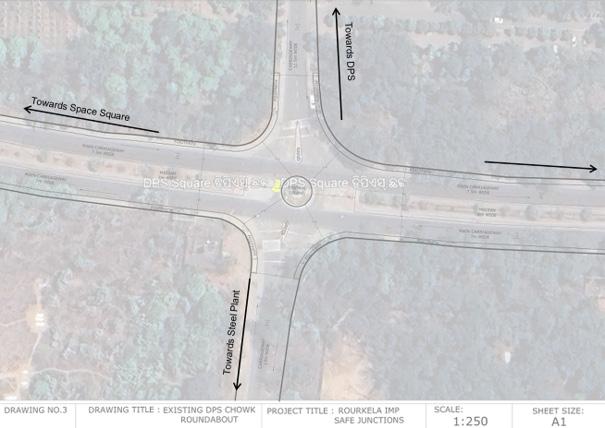
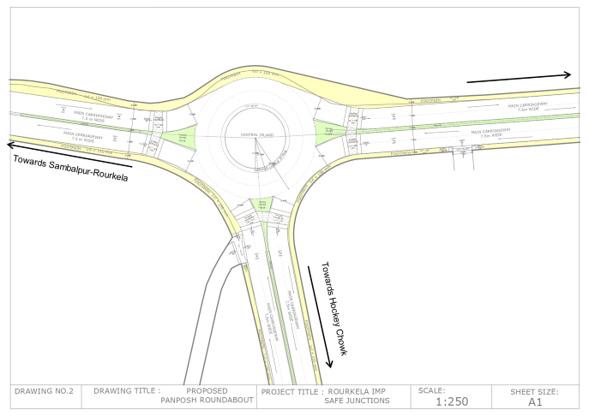
Fig. 45. Panposh Chowk – Proposed Modern Roundabout Layout Drawing
DPS Chowk: Traffic Data & Roundabout Design
DPS Chowk is a 4-arm junction on the Ring Road corridor, where two major 4-lane divided roads (towards Space Square and Ambagyan Square) cross two narrower local roads (towards DPS School and the Steel Plant). The junction’s primary safety problem is the adjacent school zone: DPS (Delhi Public School) generates intense pedestrian activity — particularly from students — during the morning drop-off and afternoon pick-up peaks. Currently, no
pedestrian crossing infrastructure exists at this junction. The very high cyclist share on the minor arms (up to 22.8% on Arm D, the Steel Plant approach) further confirms the need for segregated NMT infrastructure. The proposed roundabout is the only junction in the three studied to include a dedicated 2.2m cycle track, reflecting the Ring Road cycling context described in the Bicycle Infrastructure Planning report.
DPS Chowk handles a total of 4,826.8 PCU across all arms. The dominant flows are on the Ring Road axis (Arm A to C: 840 PCU; Arm C to A: 655 PCU), confirming that the Ring Road is the primary motorised movement. The minor arms (B and D) carry lower vehicle volumes but significantly higher cyclist
shares Arm D (Steel Plant approach) records 24.29% cyclists on some movements, the highest of any arm across all three junctions studied. This pattern reflects the cycle commuter flows from residential sectors to the Steel Plant that run through DPS Square.
Table. 36. Traffic Volume Count – DPS Chowk (Peak Hour, All Movements) Note:
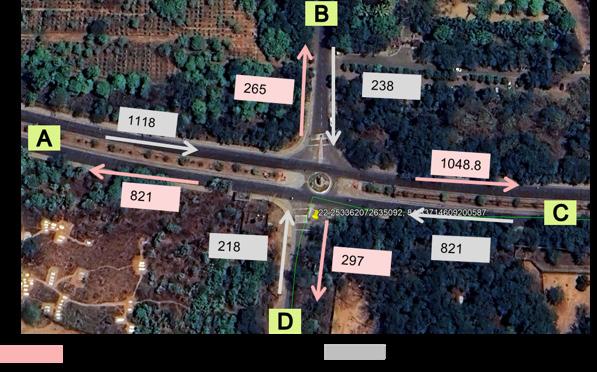
DPS Chowk has the most significant geometry changes of the three junctions. The very wide medians on the Ring Road arms (7.0–8.0m in existing condition) and the wide 2-lane carriageways on the minor arms (13.0m and 11.5m) currently allow vehicles to approach and circulate at high speeds exactly the opposite of what is needed adjacent to a school zone. The proposed design aggressively narrows these widths (minor arm carriageways reduced to 7.5m; medians reduced to ~1.0m) while using the recovered space to provide a 2.2m cycle track on the Ring Road arms, widen footpaths, and install bus stops and IPT bays. This is a comprehensive reallocation of road space from motor vehicle priority to multimodal safety.
m (very wide)
m (narrowed to control speed; excess width converted to footpath/cycle track) Medians – Space Sq & Ambagyan Sq arms
Medians – Steel Plant & DPS arms
None (2-lane undivided)
~1.0 m (reduced significantly; wide medians at current rotary allow highspeed swept paths)
~1.0 m (introduced to separate opposing flows and act as pedestrian refuge)
Central island diameter 10.4 m (very small) 10.5 m (marginally increased; geometry improvements to deflection matter more than diameter)
Footpath width
1.5–2.0 m (all arms) 1.5–3.0 m (widened where possible)
Footpath level +230 mm above carriageway +150 mm (revised for accessibility)
Cycle track
Pedestrian crossings
Bus stops & IPT bays
None
None
None at junction
2.2 m segregated cycle track at +75 mm above carriageway level (both Ring Road arms)
Raised 3 m wide crossings on all arms; +150mm; 1:10 cobblestone ramps
2 bus stops + 3–5 IPT bays on Ambagyan Square and Space Square arms
Signalisation Unsignalised rotary Not required; 2,395 PCU is well below 6,000 PCU/hr capacity
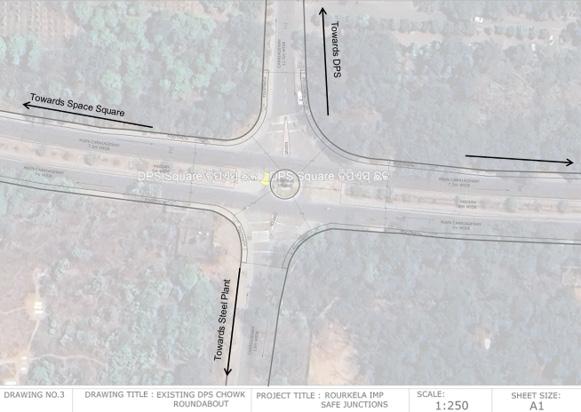
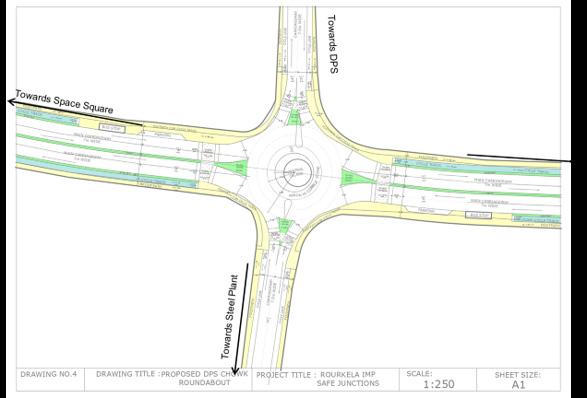
48. DPS Chowk – Proposed Modern Roundabout Layout Drawing
Birsa Munda Chowk is by far the most complex and highest-volume junction in this study. It is a 6-arm rotary at the intersection of the Ring Road (two arms), Kacheri Road, the road towards the Steel Plant, Rourkela Road, and the CISF Grounds access road. With a total PCU of 16,860.5 across all arms and an existing central island of only 20.5m diameter, the junction has completely outgrown its current geometry. It currently operates above its standard capacity (~8,000–9,000 PCU vs. the
6,000 PCU/hr threshold), requires active police management during peak hours, and has already been identified by Rourkela Smart City Limited for signalisation. However, signalisation alone will not resolve the underlying geometric failures — inadequate weaving length, no pedestrian crossings, no cycle infrastructure, and poor speed control. The proposed 2-lane elliptical roundabout with part-time peakhour signals addresses all of these simultaneously.
The scale of traffic at Birsa Munda Chowk is in a different category from Panposh and DPS. With a total PCU of 16,860.5 and five arms each carrying over 2,000 PCU, this is one of the busiest intersections in Rourkela. What makes the data particularly striking is the cyclist share: several movements
record 30–40% cyclists, confirming that Birsa Munda Chowk is a critical node on the primary cycling network described in the Bicycle Infrastructure Planning study. These cyclists currently have no protection whatsoever at this highspeed, high-volume intersection.
A – Towards Kacheri Road
B – Towards Rourkela Club Circle (Ring Road)
4,301.1 A→D: 813.9
2,674.6
D – Towards Municipal Chowk (Ring Road) 4,499.2
E – Towards Rourkela Road
F – Towards CISF Grounds
312.3
40% cyclists on A→C movement; 17.25% on A→B — highest cyclist shares from any arm at this junction
31.7% cyclists on B→C; 19.9% on B→E — very high cyclist share on Ring Road arm
734.1 30.3% cyclists on D→C; highest absolute PCU arm at the junction
2,506.5 E→D: 472.5 40% cyclists on E→C movement — extraordinarily high; indicates unprotected cycling on a high-speed road
2,879.1 F→D: 719.4 28.5% on F→C; primarily local residential access roads
Total (all arms) 16,860.5 PCU
Cyclist share ranges from 5.31% to 40% depending on movement — critical NMT safety issue at all arms
Note: Total PCU = 16,860.5 across all 5 measured arms (Arm C data not listed separately in source; movements from all arms to C are recorded). Cyclist share of 30–40% on several movements is extremely high for an unprotected junction of this volume.
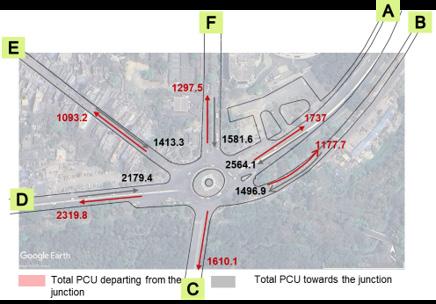
The proposed design for Birsa Munda Chowk is an elliptical 2-lane roundabout — elliptical rather than circular because the 6 arms arrive at unequal angles, and an elliptical geometry can better accommodate this while maintaining adequate weaving lengths between all arm pairs. The key design interventions are: sharper entries with entry deflection (to force deceleration); gentler exits (to control acceleration); flared splitter
islands (to provide pedestrian refuge and guide vehicle movements); a mountable apron (to allow large vehicles to navigate the central island without overly enlarging it); and part-time peak-hour signals (to manage the periods when volume exceeds the unsignalised roundabout threshold). For the first time, pedestrians and cyclists will have safe, dedicated infrastructure at this critical junction. Geometry
Junction type
Central island
Carriageway – Ring Road arms
Footpath width
Footpath level
Cycle track
6-arm rotary (existing)
Circular, 20.5 m diameter
7.5–13.5 m (varies widely)
7.5–12.0 m
1.5–2.5 m
+230 mm above carriageway
Pedestrian crossings None
Median widths
Signalisation
Design feature
1.0–3.0 m (3.0 m on Birsa Munda road)
Currently: police control needed; Smart City signalisation planned
Over-wide circulatory road; same entry/exit radii; no apron
6-arm 2-lane elliptical roundabout (proposed)
Elliptical; improved for 6-arm geometry; sharper entries, gentler exits
Standardised; carriageway widths adjusted for tighter entry geometry
Adjusted to enforce yield and reduce approach speeds
Revised (as per accessibility standards)
2.2 m dedicated cycle track on all arms
Raised crossings on all arms; cobblestone finish at conflict points
Adjusted with flared splitter islands for clear pedestrian refuge
Part-time signalisation at peak hours proposed; improved LoS expected across all arms
Sharper entries, gentler exits; flared splitter islands; mountable apron
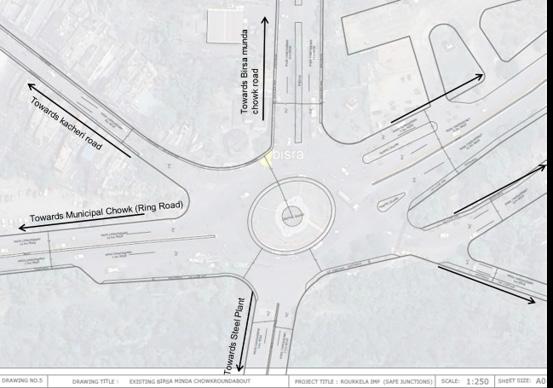
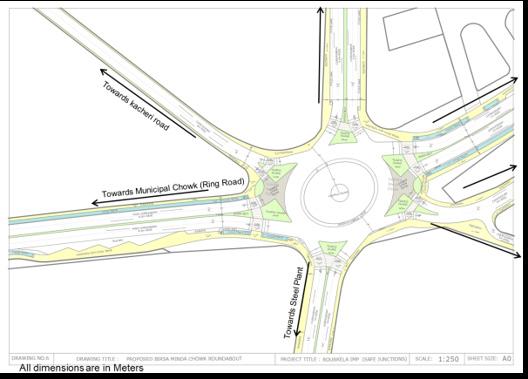
Rourkela is a major industrial and commercial hub of Odisha, anchored by the Rourkela Steel Plant (SAIL). Key transport and education nodes include NIT Rourkela, Rourkela Airport, the Railway Station, and the Central Bus Terminal. The Rourkela Development Planning
Area spans 259.18 sq. km, comprising the Steel Plant, Steel Township and Civil Township, and 52 surrounding villages. Major transport nodes align closely with high-density clusters, indicating the key travel demand corridors.
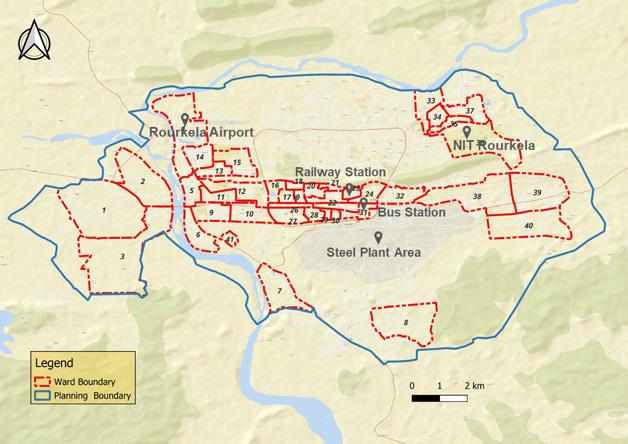
Fig. 52. Rourkela City Map – Ward Boundaries & Key Landmarks
Rourkela’s population is projected to cross 10 lakh by 2037. Using a Per Capita Trip Rate (PCTR) of 1.2 trips/ person/day, the estimated daily trips for 2026 are approximately 9.5 lakh. Major transport nodes align closely with high-
density clusters, indicating key travel demand corridors. High-density wards are concentrated around the central area near the Railway Station and Steel Plant Area, forming the primary trip production and attraction zones.
CDP estimate
2026 7,94,572 9,53,486 (~9.5 lakh) Study year
2037 >10,00,000 (Projected) >12,00,000 Long-term planning horizon
PCTR = 1.2 trips/person/day applied to all years. Sources: Census 2011; CDP Rourkela 2015; NBRR Projection.
Table. 38. Rourkela Population Growth & Estimated Daily Trip Generation (2011–2037)
Ward Category
High Density Wards (>15,000 persons/sq km)
Medium Density Wards (7,500–15,000 persons/sq km)
Low Density Wards (<7,500 persons/sq km)
Description Mobility Implication
Concentrated around central area, especially near Steel Plant, Railway Station
Higher walking & cycling potential; strong demand for affordable short-distance transit
Transition belt around core urban area Mix of IPT and private vehicle use; moderate PT demand
Peripheral edges of the city; outer villages and industrial pockets
Higher IPT dependence; poor PT access; prime targets for micro bus coverage
Table. 39. Ward Density Categories and Mobility Implications – Rourkela
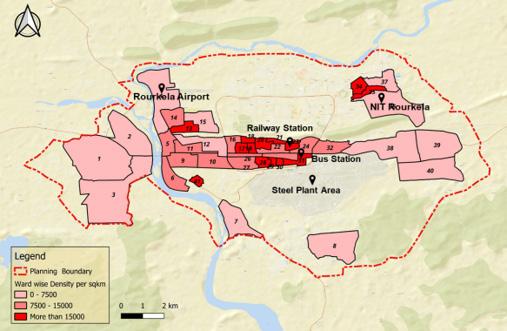
53. Population Density Ward Map – Rourkela
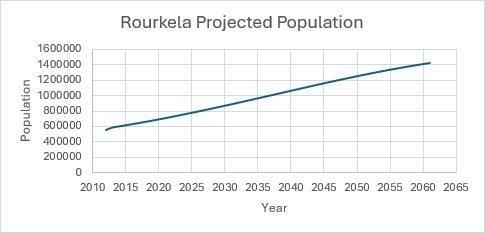
Rourkela’s road network is anchored by a historic wide Ring Road connecting major sectors. Regional highways support freight and intercity movement. Congestion is observed in market areas and near the railway station, and parking spillover reduces effective road capacity. The trip length distribution from Census 2011 and CDP 2015 shows that a significant share of trips are short-tomedium distance (1–5 km), which is ideal for micro bus services.
hops; ideal micro bus catchment
micro bus routes (e.g. Route 2 at 18.4 km)
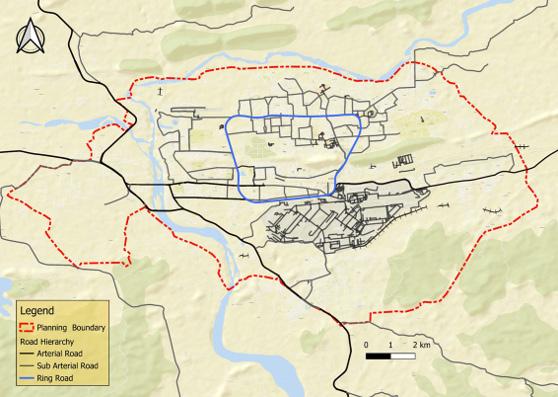
55. Road Network Map – Rourkela
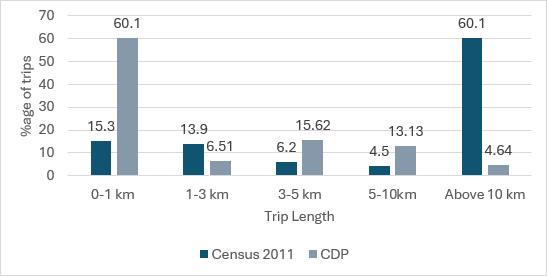
Fig. 56. Trip Length Distribution Bar Chart
Grouped bar chart showing trip length distribution by band (0–1km, 1–3km, 3–5km, 5–10km, Above 10km). Two data series: Census 2011 (dark red) and CDP (light pink). Y-axis: % age of trips.
Four data sources capture mode share across different geographic extents and time periods. The consistent finding across all sources: formal public transport is severely underused (8–20% depending on source), NMT modes (walk, cycle) dominate in the planning area (up to 45%), and IPT (para transit) is the primary motorised mode in the urban core at 40% (Smart City 2016). The ISOCARP research paper estimates PT potential at 20% in the planning area, indicating significant untapped demand for organised public transport.
Large gap between current PT and potential
Dominant mode in urban core; high fares
Primary private mode; high in outer areas
Growing share; congestion driver
Dominant in planning area; target for micro bus modal shift
41. Mode Share in Rourkela – Comparison Across Four Data Sources
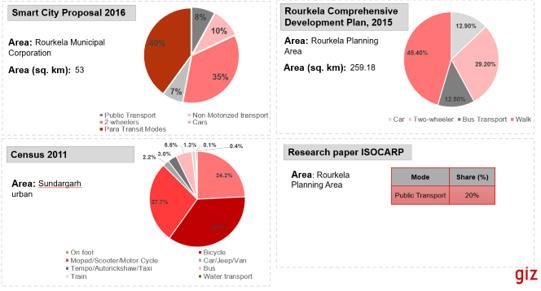
Trip producers are residential sectors, peripheral villages, and working house clusters. Trip attractors are the Steel Plant, Education Zones (NIT, colleges), Commercial Hubs (markets, Kacheri Road), and Transport Terminals (Railway Station, Bus Stand, Airport). Key attractors include the Steel Plant Area,
NIT Rourkela, Railway Station, Bus Station, and Rourkela Airport. Industrial and working-class residential parcels act as strong daily trip generation zones. Trip patterns are concentrated along the central east–west and southern industrial belt.
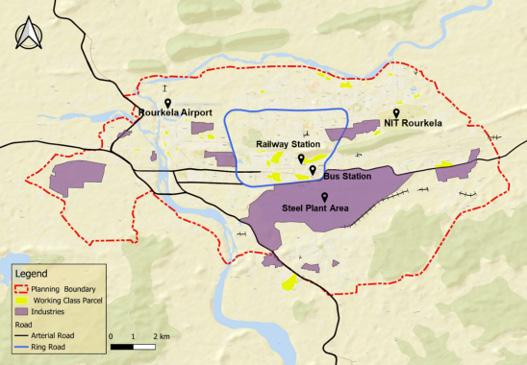
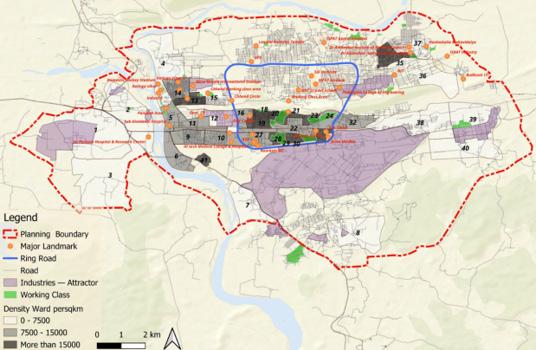
Rourkela’s formal public transport operates under two categories: Mo Bus / Ama Buses (operated by CRUT) and private buses. Together they cover 127 routes with a combined daily ridership of approximately 1,23,956 passengers, representing about 13% mode share. Coverage is concentrated on urban core routes and arterials.
Parameter Mo Bus / Ama Buses (CRUT)
Operating entity
Total fleet
Capital Region Urban Transport (CRUT)
100 buses
Operational routes 25 routes within and around Rourkela
Focus Urban mobility and highfrequency transit services
Average daily ridership 44,581 passengers (Source: CRUT)
Private bus operators
178 buses
103 routes
Wider area; some periurban coverage
79,637 passengers (at 85% fleet utilisation)
Table. 42. Auto Rickshaw (IPT) Fleet & Operating Characteristics – Rourkela
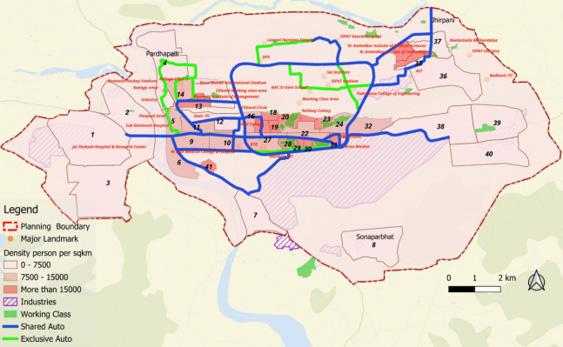
Auto-rickshaws are the primary intermediate public transport mode in Rourkela. With 12,965 registered 3-wheelers (and only 50 e-rickshaws), they form an extensive informal sharedroute network. High-occupancy routes (4 passengers) operate on internal roads connecting to the Ring Road.
2025)
High occupancy roads (internal)
Lower occupancy roads (Ring Road, Panposh, Chhend)
Lower occupancy (3 passengers) is observed on Ring Road, Panposh Road, and Chhend Road due to existing PT services. Major IPT stands are located at key intersections connecting the Ring Road and landmarks like NIT, Charitable Hospital, and Jhirpani.
4 passengers (average)
3 passengers (average) — due to existing PT services
Major IPT stands Jhirpani Stand, NIT Stand, Charitable Hospital, major Ring Road intersections
Usage pattern
Need-based; not regular; not used as feeder to bus; end-toend trips; primarily serves Civil Township
Nascent; very limited penetration
The overlay of bus routes and shared auto routes reveals three key observations: 1. The Shared Auto network is largely concentrated in the central and eastern parts of Rourkela, covering major activity zones such as Chhend Circle, Railway Station, Bus Stand, Birsa Maidan, and key educational & medical institutions, while the high density and working-class areas remain poorly served. 2. There is a clear overlap between Shared Auto routes
and Mo Bus routes in the core city area, indicating direct competition between the two public transport modes rather than complementarity. 3. A significant portion of the planning boundary, especially the western, southern, and northern outskirts (including Sonaparbat, Pardhapalli, and industrial zones), shows very limited or no Shared Auto coverage, highlighting a strong dependence on private modes (2W) and walking in the outer zones.
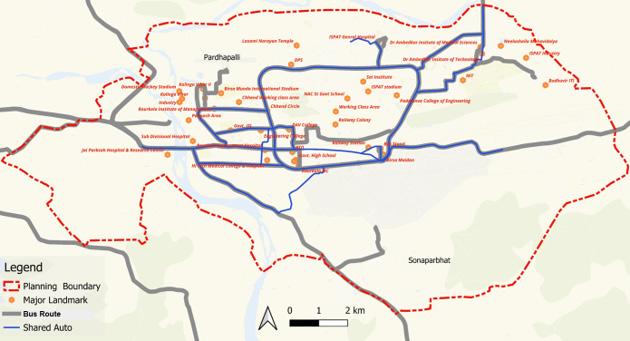
High 3W Usage (>600 vehicles, 4 passengers)
Moderate 3W Usage (3 passengers)
Lower 3W Usage (0–2 passengers)
Space Square → Ambagan Square → Rourkela Club Circle → Chhend Square; Hanuman Vatika, Balughat, Birsa Munda Chowk, Municipal Chowk, Panposh, TCI Square
Connecting corridors: Chhend Square to Hockey Chowk and surrounding sectors
Peripheral areas: Vedvyas Chowk, Hockey Chowk, outer sector roads
Dominant along central & connecting arterial corridors; 3Ws are primary intra-city mode in dense core areas
Link corridors between residential sectors and the main commercial spine; reduced by existing PT on Ring Road
Outer zones dominated by 2-wheelers & private vehicles; IPT usage is need-based, not regular
High Passenger Volume (>2,100 passengers/both directions)
Birsa Munda Chowk, Municipal Chowk, Hanuman Vatika Square, Panposh Chowk
High fares make IPT less affordable for daily commuters; not used as feeder to bus; mostly end-to-end direct trips; generally serves Civil Township
Table. 44. IPT (Auto Rickshaw) Pattern – Vehicle Volume, Passenger Occupancy & Total Passenger Summary
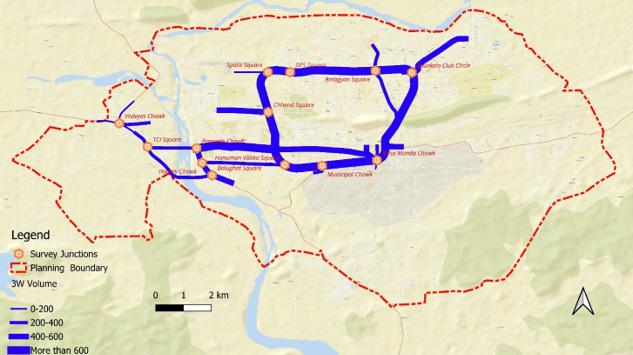
Fig. 63. IPT Vehicle Volume in peak hour Map – Auto-Rickshaws, Both Directions, Peak Hour
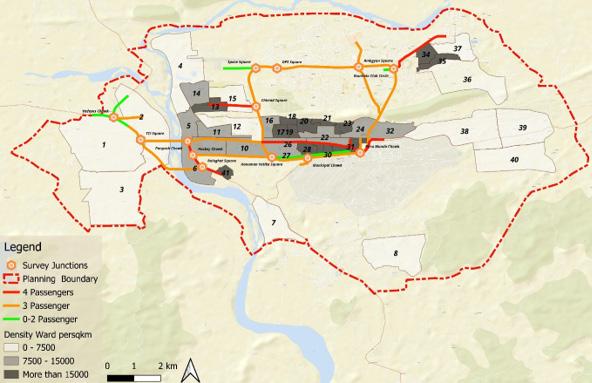
Fig. 64. IPT Passenger Occupancy Map – Both Directions, Peak Hour
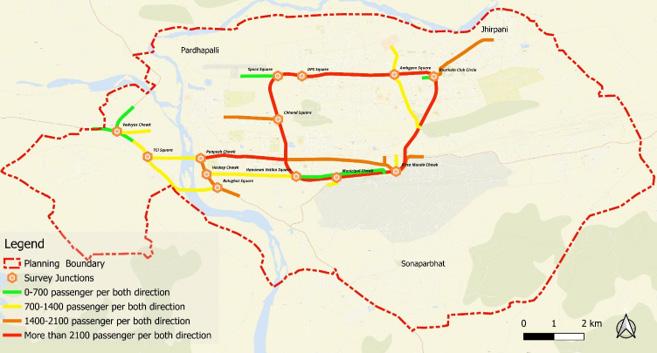
Fig. 65. IPT Total Passenger Volume Map – Both Directions, Peak Hour
The rationale for E-Micro Buses is driven by four key factors:
Limited Public Transport Coverage: Current Mo Bus and Shared Auto services are concentrated only in the central core, leaving large parts of the planning area including the steel township and peripheral zones/villages poorly connected.
High Dependence on Private Modes: A major share of trips in outer areas is still being made by two-wheelers, cycles, and walking, resulting in poor accessibility to major parts of the city.
Micro buses can efficiently serve narrow roads, high-density residential colonies, and industrial pockets where standard buses cannot operate, thereby bridging the gap between high-capacity Mo Bus routes and unserved areas.
Promote Modal Shift: They offer an affordable, comfortable, and frequent intermediate public transport option that can gradually shift passengers from 2-wheelers and walking to organised public transport.
Considerations for E-Micro Buses include:
Strategic Coverage: Connecting major landmarks such as HI Tech Medical College & Hospital, ISPAT General Hospital, NIT, Birsa Munda Stadium, Bus Stand, and main industrial zones through currently unserved zones/corridors.
Strong Demand: Serving highdensity wards (>15,000 persons/sq km), working-population zones, and industrial attractors to tap into existing concentrated short-to-medium distance travel demand.
Ideal for Maxi Cabs: Landmarks and destinations not served by shared autos (served only by booking auto) offer excellent potential for shared micro bus service to replace multiple autos/tempos, reducing travel cost for commuters and emissions for the city.
Six data inputs were used to design the micro bus route network. Each input layer was overlaid to identify corridors where multiple conditions favour micro bus service.
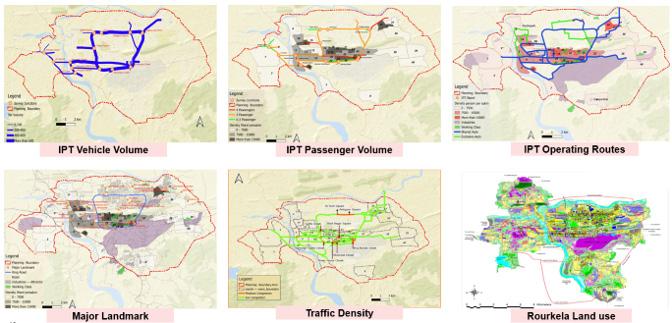
66. Micro Bus Route Planning Considerations – 6 Input Maps
A total of 97 Tata Magic EV (10-seater) micro buses are proposed across 6 routes. Key specifications: Model = Tata Magic EV; Total = 97 micro buses; Deployed on 6 routes; 10-seater capacity each; NCC contract; Permit fee = ₹2,500 per bus per annum basis; Fixed fare structure: 0–5 km = ₹10, Above 5 km = ₹20.
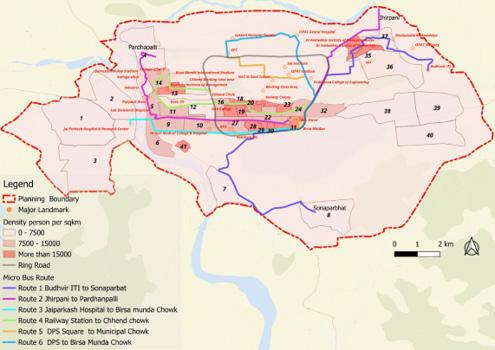
67. Proposed E-Micro Bus Routes Network Map.
The table below gives the full route details for all 6 proposed routes. Bus stop spacing is standardised at 250 m, headway at 10 minutes, and seating capacity at 10 seats per bus.
Budhuvir ITI, ISPAT Industry, Jabaghat, Dr Ambedkar Medical Sciences & IT Management Mahavidyalaya, NIT, Indira Gandhi Park, Birsa Munda Chowk Traffic Chowk, ISPAT Chowk, Municipal Chowk, Rourkela Deogarh Road, Gandhi Mahavidyalaya, Deogarh Jaganath Temple, E-Block Fertilizer Township, Sonaparbhat
Jhirpani Koel Nagar, Rourkela Club Circle, Indira Gandhi Park, Birsa Munda Chowk, Railway Station, Bus Stand, Kachery Road, Udit Nagar, RTO, Rourkela Government Hospital, Panposh Road/ Chowk, Sub Divisional Hospital, Panposh, Industry, Kalinga Vihar, District Hockey Stadium, Pardhanpalli
3 Jaiprakash Hospital to Birsa Munda Chowk
4 Birsa Munda Chowk to Chhend chowk
5 DPS to Railway Station
Birsa Munda Chowk, Sail Road, Mehtab Road, Rourkela Municipal College, Rourkela Municipal Corporation, Hanuman Vatika Chowk, Hi Tech Medical College & Hospital, Hockey Chowk, Panposh Chowk, Jai Parkash Hospital
Birsa Munda Chowk, Rourkela Railway Station Gate II, Railway Colony, Basanti Nagar, DAV College, Engineering College, Govt ITI, Madhusudan Nagar Phase II, RDA Colony, Chhend Biju Patnaik Chowk, Birsa Munda International Hockey Stadium, Rourkela Institute of Management, Madhusudan Nagar Phase I, Chhend Chowk
Deer Park, Sector 8, Sector 7, Contractor Colony, Govt High School, Sai Institute, ISPAT Stadium, Sector 5, Padmavat Engineering College, Indira Gandhi Park, Birsa Munda Chowk, Bus Stand, Railway Station
6 DPS to Birsa Munda Chowk
Major Trip Generators & Attractors Served
10 12 DPS, Laxami Narayan Temple, Sector 18 Market, Sector 15, ISPAT General Hospital, ISPAT Nehru Park, Ambgyan Square, Sector 3, Sector 5, Padmavat College of Engineering College, Indira Gandhi Park, Birsa Munda Chowk
Note: Fare structure: ₹10 for 0–5 km; ₹20 for above 5 km. Model: Tata Magic EV. Permit fee: ₹2,500 per bus per annum (NCC basis).
Mode Share & Catchment Area
The 300m buffer catchment area of all 6 micro bus routes covers 29.34 sq km, which is 19.05% of the planning boundary area of 154 sq km. At 70% occupancy, the micro bus network generates 20,440 daily passenger trips, achieving 7.9%
mode share within the catchment and 2.24% overall mode share. The micro bus service is projected to draw trips primarily from walking, two-wheelers, and cycles, with almost no impact on existing IPT ridership. Sr. No
1 Planning Boundary 154 sq km 2 Catchment Area (300m buffer of all routes) 29.34 sq km (19.05%)
Table. 45. Mode Share & Catchment Area – Micro Bus vs. Existing PT Modes
Micro Bus (10 min headway, 70% occupancy, 10 capacity)
Buses (CRUT + Privates) (24 CRUT routes + 103 Private routes)
IPT (Shared Auto Rickshaw)
passenger trips/day
Mode share in catchment area at 70% occupancy = 7.9%
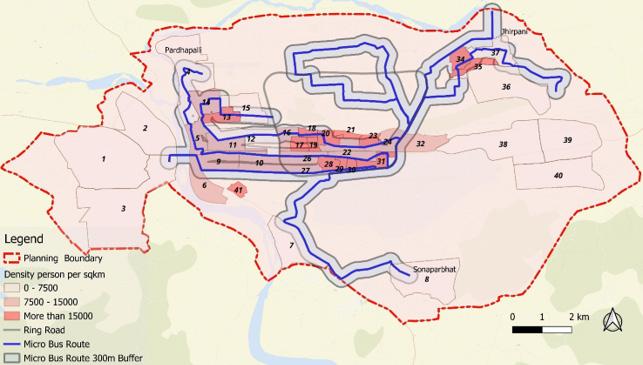
Fig. 68. Catchment Area Map – 300m Buffer Around All 6 Micro Bus Routes
Map showing all 6 micro bus routes (blue lines) with 300m buffer (grey shaded area). Density shading background (>15,000 dark red, 7,500–15,000 pink, 0–7,500 white). Ring Road (grey), planning boundary (red dashed). Planning Boundary = 154 sq km; Catchment = 29.34 sq km (19.05%).
As per the 2011 Census, the mode share of buses in Rourkela was only around 5%, which is due to non-availability of CRUT buses. With the subsequent expansion of city bus services, the current combined public transport mode share (buses) has increased to 13%, while Intermediate Public Transport (IPT)
accounts for about 7%. The proposed electric micro-bus service is projected to capture only 2.24% mode share, primarily by shifting trips from walking, two-wheelers, and cycles, with almost no impact on existing IPT ridership. It will function as a supplementary public transport mode.
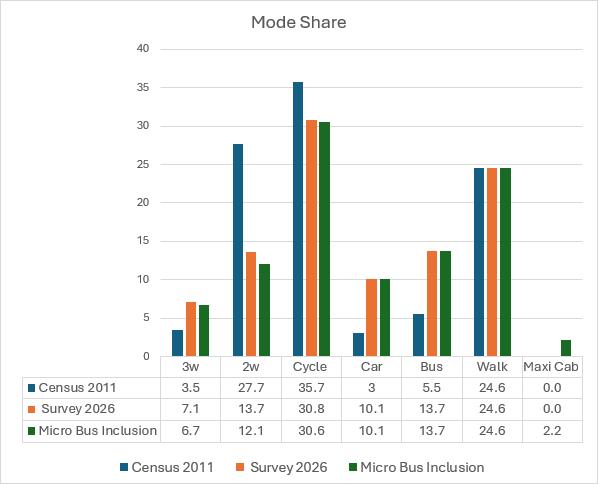
Fig. 69. Mode Share Bar Chart – Census 2011, Survey 2026 & Micro Bus Inclusion
Comparison – Micro Bus & PT Routes Overlap
Table. 46. Micro Bus Route Overlap with Existing PT Routes
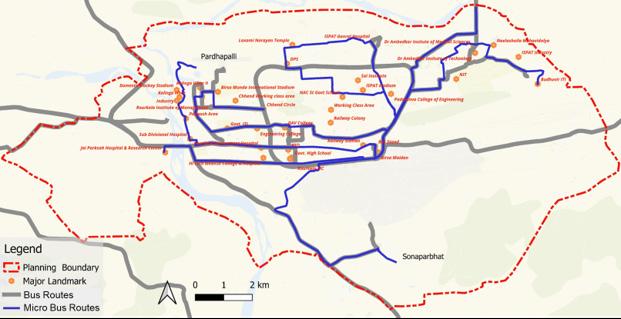
The 6 routes are proposed in two phases.
Phase I (Immediate Implementation – High Impact) consists of Routes 2, 5 & 6 with overlap with existing Public Transport routes <40%, focusing on high demand & unserved areas. Phase
II (Subsequent Implementation – Lower Demand) consists of Routes 1, 3 & 4 serving medium to low population density areas with lower overall demand and overlap with PT & IPT >50% in each route.
with existing PT routes <40%; Focus on high demand & unserved areas; specially selected for working class and unserved areas like Panposh and Pardhanpalli & High population density wards
Phase II – Subsequent Implementation (Lower Demand)
II Route 1: Budhuvir ITI to Sonarparbhat
II Route 3: Jaiprakash Hospital to Birsa Munda Chowk
II
Birsa Munda Chowk to Chhend chowk
47. Phase Proposal of 6 Micro Bus Routes – Phase I & Phase II
to low population density areas; Lower overall demand; Overlap with PT & IPT >50%
to low population density areas; Lower overall demand; Overlap with PT & IPT >50%
to low population density areas; Lower overall demand; Overlap with PT & IPT >50%
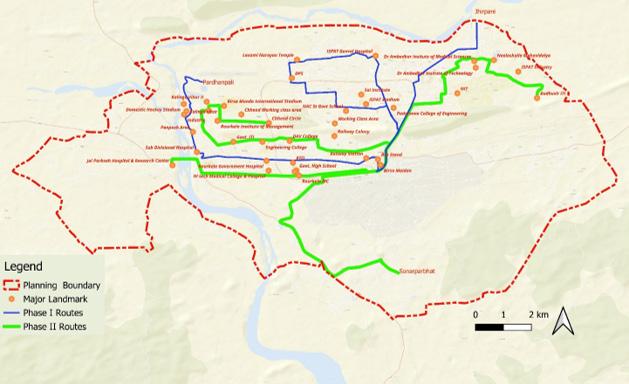
Proposed
Service planning data is presented by route and phase. All routes operate at 10-minute headway. The earning per km (₹23.33) is compared against cost per km (₹23.75), showing a near-breakeven
operational model under the NCC framework. Phase I total fleet = 48 buses (9,694 passenger trips/day); Phase II total fleet = 49 buses (10,746 passenger trips/day).
Note: Phase II Total passenger trips per day = 10,746. Grand Total = 20,440 trips/day across 97 buses.
The Micro Bus Network for Rourkela can be implemented under the NCC (Net Cost Contract) Business Model.
Implementing Agencies: Rourkela
Municipal Corporation & SAIL – Rourkela Steel Plant
Net Cost Contract (NCC) – Sale/Lease Model Concept:
If the capital cost of buses is high for private operators, the government (or authority) can take on the responsibility of investing in and procuring them. These can then be provided to operators on a lease basis. This reduces the upfront financial burden on operators and encourages wider participation. The authority recovers its capital investment through lease payments over time. Operators can then focus on efficient service delivery rather than heavy capital expenditure.
This section provides the individual alignment maps for all six proposed micro bus routes. Each map overlays the proposed micro bus route against the existing CRUT and private PT routes that run along similar corridors,
Route No.
enabling a visual assessment of route complementarity vs. overlap. The table below summarises the PT routes shown as comparison on each individual route map.
Route Detail & Length CRUT/PT Routes
Shown as Comparison on Map
Route 1 (Phase II) Budhuvir ITI to Sonarparbhat 20.4 km 101 (Airport), 103 (Panposh), 104 (Jhirpani), 105 (Rajgangpur), 108 (Nuagaon), 111 (Bonaigarh), 116 (Loram), R121 (Kanatajhor to DAV Pond), R122 (Fertilizer to OSRTC Bus Stand)
Route 2 (Phase I) Jhirpani to Pardhanpalli 18.4 km 100 (Airport), 102 (Ved Vyas – Jhirpani), 105 (Rajgangpur), 104 (Jhirpani), 106 (Biramitrapur), 108 (Nuagaon), 113 (Ushra Village), R118 (Salangabahal), R121 (Kanatajhor to DAV Pond), R122 (Fertilizer to OSRTC Bus Stand)
Route 3 (Phase II) Jaiprakash Hospital to Birsa Munda Chowk 8 km 105 (Rajgangpur), 109 (Lathikata), R112 (Lahunipara)
Route 4 (Phase II) Birsa Munda Chowk to Chhend chowk 12 km 100 (Airport), 104 (Jhirpani), 106 (Biramitrapur), 108 (Nuagaon), 116 (Loram), 124 (Igh)
Route 5 (Phase I) DPS to Railway Station 8.26 km 100 (Airport), 104 (Jhirpani), 106 (Biramitrapur), 108 (Nuagaon), 116 (Loram), 124 (Igh)
Route 6 (Phase I) DPS to Birsa Munda Chowk 8.9 km 100 (Airport), 104 (Jhirpani), 106 (Biramitrapur), 108 (Nuagaon), 116 (Loram), 124 (Igh), R121 (Kanatajhor to DAV Pond), R122 (Fertilizer to OSRTC Bus Stand)
Table. 49. Individual Micro Bus Routes – Details and Overlapping PT Routes Shown on Maps
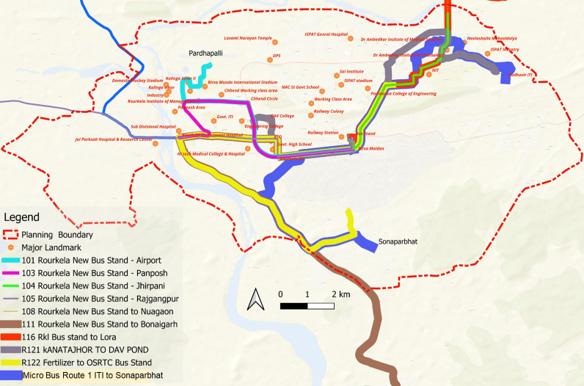
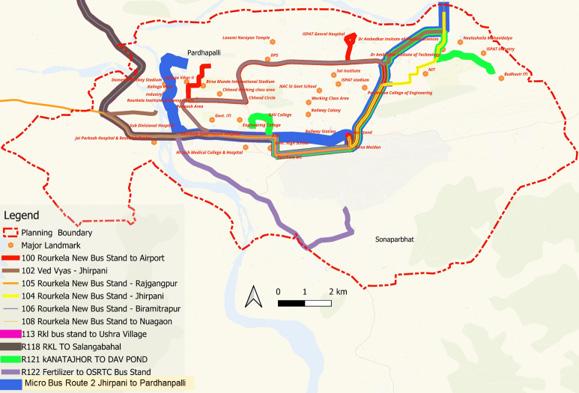
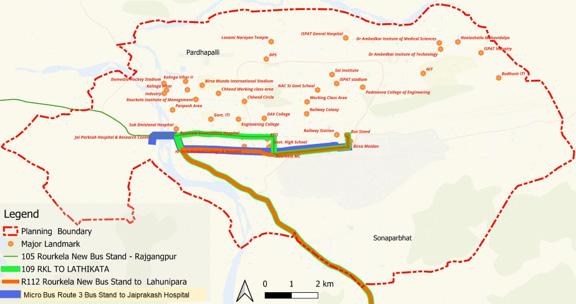
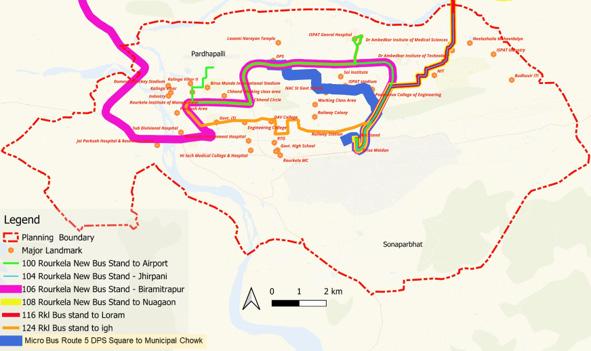
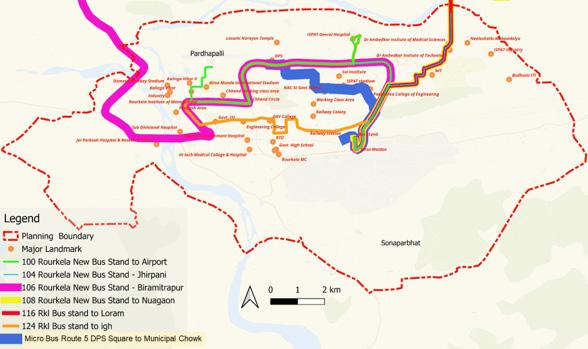
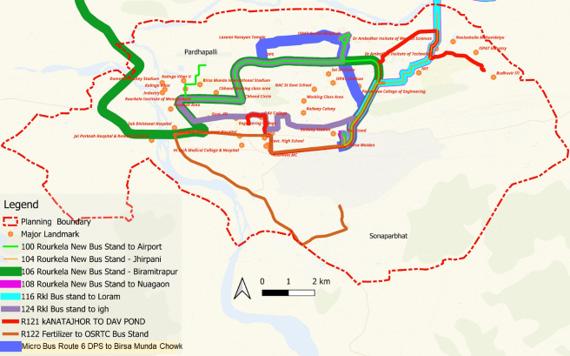
CRUT (Capital Region Urban Transport) operates 25 bus routes under the Mo Bus / Ama Bus brand in Rourkela. These routes serve destinations ranging from the city core to regional towns up to 65 km away. The table below lists all routes with their length, headway, and average occupancy. Occupancy is the average percentage of seats filled across the
route in both directions.
Routes highlighted in pink are the 8 lowto-moderate occupancy routes (below ~65%) selected for detailed boardingalighting analysis. Green-shaded routes operate above 100% capacity (standing passengers). Routes in grey are performing at acceptable occupancy levels.
Table. 50. CRUT Route Inventory – All 25 Routes with Length, Headway and Occupancy
Note: Pink = 8 low occupancy routes selected for analysis (<65%). Green = very high occupancy (>100%). Grey/ white = acceptable occupancy (65–100%).
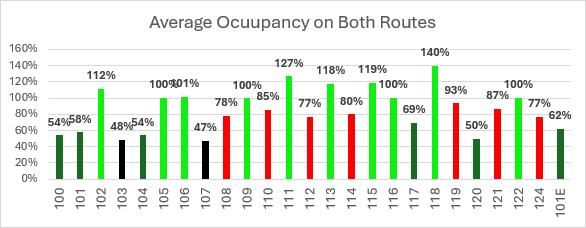
Fig. 78. Average Occupancy Bar Chart – All 25 CRUT Routes (Both Directions)
Bar chart showing average occupancy % for all 25 CRUT routes. Bars colour-coded: Black = Very Low (<50%), Yellow/Orange = Low to Moderate (50–70%), Red = High (70–100%), Green = Very High (>100%). Headway values shown as pink number labels above each bar. Y-axis: 0–160%. Routes 100, 101, 103, 104, 107, 117 in black/ yellow; Routes 102, 111, 113, 115, 118 in green.
The map below shows the average occupancy of all CRUT routes plotted spatially on the Rourkela road network. Each route is colour-coded by its occupancy category, allowing a spatial reading of where the network is overperforming (green/very high), performing adequately (red/fair to high), and underperforming (yellow/low to moderate and black/very low).
Very Low Occupancy
Low to Moderate Occupancy
Fair to High Occupancy
Two routes have very low occupancy (below 50%) while six routes have low to moderate occupancy (50–70%). These 8 routes together form the group selected for detailed boarding-alighting analysis. The spatial pattern is revealing: the underperforming routes are concentrated on the western and outer corridors, while the high-occupancy routes run along the primary east–west arterials and the Ring Road.
2 routes (103, 107) Black
6 routes (100, 101, 101E, 104, 117, 120)
Yellow / Orange
12 routes Red Very High Occupancy
5 routes (102, 111, 113, 115, 118) Green
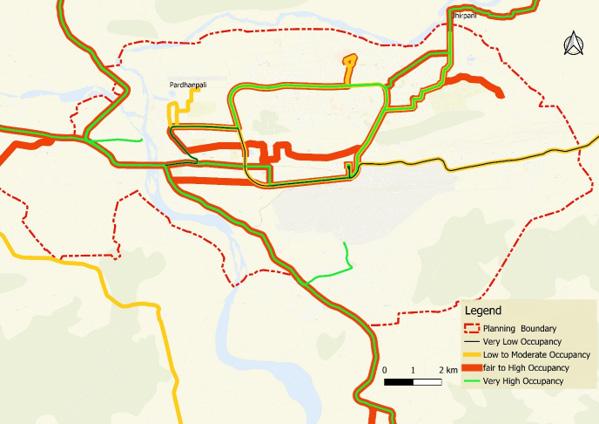
Route overlap is one of the two primary causes of low bus occupancy in Rourkela’s CRUT network. Overlap occurs when multiple CRUT routes run along the same road stretch, spreading the available passenger demand thinly across competing buses. Each individual bus shows low occupancy not because the corridor is empty, but because the combined supply far exceeds the demand present at any given time.
The overlap analysis identifies five stretches where the concentration of overlapping routes is highest. These are the same corridors that generate the bulk of the city’s daily travel demand. The problem is not that these corridors are wrong choices for bus routing — it is that too many individual routes have been layered onto them without demandbased rationalisation.
Ring Road
Birsa Chowk → Udit Nagar Chowk
Udit Nagar Chowk → Panposh Chowk
Chhend Chowk → BSNL Chowk
Panposh Chowk → Vedvyas Chowk
Primary circular corridor linking all major sectors and the steel plant
Central east–west arterial; highest concentration of routes
Central to western core; major passenger interchange
Northern Ring Road section; connecting Steel Township zones
Western arterial leading to Vedvyas / Jhirpani terminus
Table. 52. Stretches with High Degree of Route Overlap – All 24 CRUT Routes
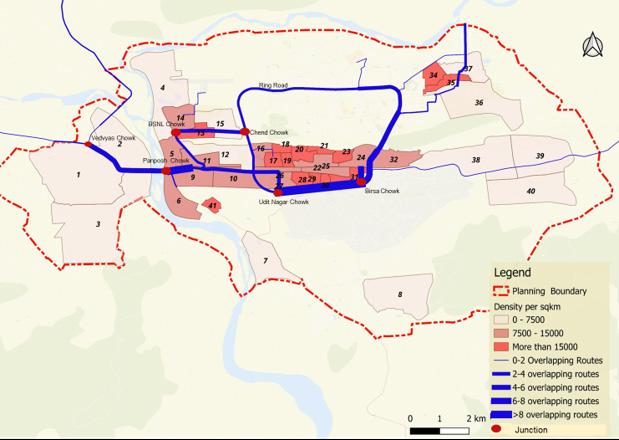
From the full network of 25 CRUT routes, 8 routes with low to moderate average occupancy were selected for detailed boarding-alighting data analysis. These are routes where the average occupancy across both up and down directions falls below approximately 65%, indicating that the buses are running significantly under capacity on a consistent basis.
The selection of these 8 routes for deeper analysis is important because
low average occupancy alone does not tell us where along the route the problem lies, or what is causing it. A route may have one or two very busy stops and long stretches of near-empty running. The boarding-alighting analysis is specifically designed to diagnose this stop-by-stop pattern so that targeted, stretch-level interventions can be recommended rather than blanket route cancellations.
Table. 53. Occupancy CRUT Routes Selected for Boarding-Alighting Analysis
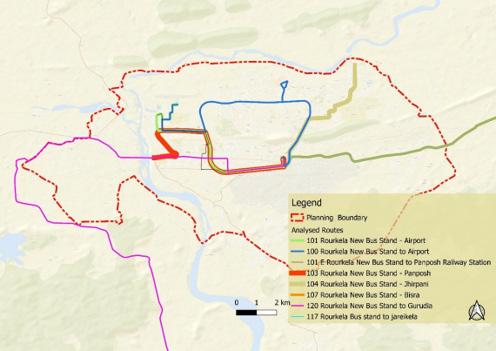
Fig. 81. Low Occupancy Routes Map – Spatial Extent of Analysed Routes
Boarding and alighting (B/A) data was collected for all 8 low-occupancy routes at individual stop level, covering both up (outbound) and down (return) directions on a typical operating day. The data is expressed as total daily boardings + alighting’s at each stop combined across both directions.
The analysis is used to identify specific route stretches with low catchment, that is, where the bus is consistently picking up and dropping off very few passengers across consecutive stops. These ‘low B/A stretches’ are shown as highlighted sections on the line charts (marked with a blue dashed rectangle).
Route No. Route Detail
100 Rourkela New Bus Stand → Rourkela Airport
Low B/A stretch identified
Sector 9 → Birsa Munda Stadium Gate 2 (Sector 9, Space Chowk, Sector 20, JJ Market, Ispt General Hospital, 100 Million Ton Chowk, Mahila Police Station, Birsa Munda Stadium Gate 4, Birsa Munda Stadium Gate 2)
101 Rourkela New Bus Stand → Luakera Rourkela Airport Chowk → Nandgaon Ghoshala (Rourkela Airport Chowk, Space Chowk, Sector 13, Sector 9, Sector 4, Delhi Public School Gate No 4, Gangadhar Meher Chowk, Sector 15 Shiva Temple, Sarma Temple Chowk, Livelihood Incubation Centre, Sector 15 A Bock, Ispat College, Nandgaon Ghoshala)
101E Rourkela New Bus Stand → Panposh Colony / Jaganath Colony
103 Rourkela New Bus Stand → Panposh Chowk
104 Rourkela New Bus Stand → Jhirpani
107
117
Rourkela New Bus Stand → Daraikela
Rourkela New Bus Stand → Jaraikela
Entire route – Rourkela New Bus Stand → Panposh / Jaganath Colony (all stops uniformly low: Rourkela New, Birsa Chowk, Traffic Chowk, Sail Chowk, Ispat Chowk, Power House, Sarana Chowk, Municipal, Udit Nagar, Hanuman, Hanuman Vatika, Hi Tech Chowk, STI Flyover, Basanti Chowk, Fd Chowk, Chend Bus, Vss Market, JJ Market, Madhusudan, Chinmaya, Rims Chowk, Bsnl Chowk, Kalinga Vihar, Kalinga Vihar, Friday Market, Kv Housing, Pearl Height, Jaganath Colony, Panposh)
STI Flyover → Chinmaya School (approx. 9 stops: STI Flyover, Fd Chowk, Basanti Chowk, Chend Bus Stand, Chend Chowk, Vss Market, JJ Market, Madhusudan Bhawan, Chinmaya School)
Old Nit Gate → Nit Main Gate (Old Nit Gate, Nit Main Gate, Nit Back Post)
Tilak Nagar → Santoshpurolony (Tilak Nagar, Tilak Nagar Uphc, Sssy Gate, Diesel Chowk, Sital Nagar, Kv Bondamunda, Bndm Sec-a, Bndm Sec-b, Bndm Sec-c, Bndm Sec-c Market, Bndm Sec-d, Bndm Junction, Santoshpur Gp, Santoshpur)
Koila Gate → Jodabandha (Koila Gate, Tilak Nagar, Tilak Nagar Uphc, Sssy Gate, Diesel Chowk, Sital Nagar, Kv Bondamunda, Bndm Sec-a, Bndm Sec-b, Bndm Sec-c, Bndm Sec-d, Bndm Junction, Santoshpur Gp, Asiana Colony, Bisra, Bisra Block Office, Bisra Tahasil, Electric, Daraikela, Bisra High School, Evengillin Mission, Jodabandha)
Route
120 Rourkela New Bus Stand → Gurundia Bus Stand
Three zones: (1) Rourkela New Bus Stand → Judicial Court (Traffic Chowk, Ispat Chowk, Sarana Chowk, Udit Nagar Chowk, Ambedkar Chowk, Stl Bus Stop, Civil Township, Tarini Temple, Govt College Chowk, Maharshi Dayananda Chowk, Tci Chowk, Judicial Court); (2) Kalunga Bus Stand → Balanda High School (Jia Bahal, Aamlola, Gutidhara Chowk, Tumran, Dahi Tola, Kharibandh, Disco Chowk, Naka Khadi, Tainser Chowk, Birda); (3) Prem Nagar → Gurundia Bus Stand (Soldega, Baneikala, Nuanipali School, Gurundia Market, Gurundia Bus Stand)
Table. 54. Low B/A Stretch Summary – All 8 Routes
Note: B/A = total daily boarding + alighting (both up and down directions combined per stop). Low B/A stretches = consecutive stops with consistently very low combined activity.
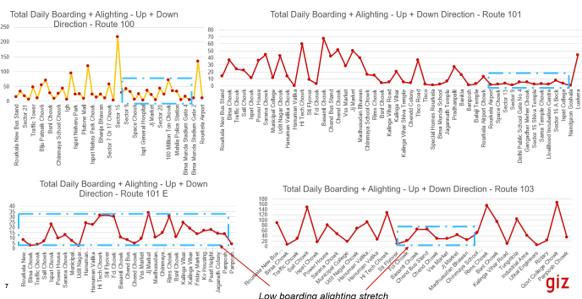
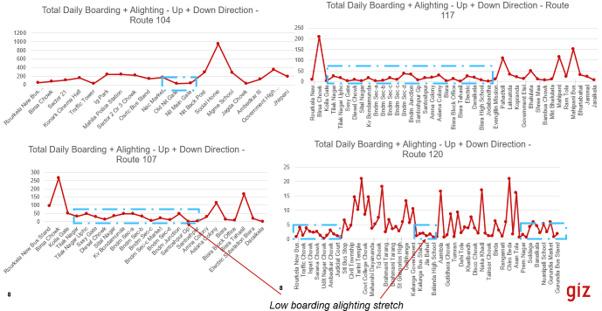
This annexure brings together the route characteristics of the 8 low-occupancy routes into a single consolidated table. For each route, the table shows the headway, the number of bus stops with low boarding-alighting, the name of the low-performing stretch, the overlapping CRUT routes (and their combined fleet size), and the number and fleet size of overlapping private bus routes. Together these columns reveal whether each route’s underperformance is primarily a demand problem (low overlap, low B/A, long headway) or a supply fragmentation problem (high overlap, many competing
buses on the same corridor).
This distinction is critical for selecting the right intervention. Routes 107 and 117 have only one overlapping CRUT route each, the problem there is insufficient frequency on a low-demand corridor. Routes 103, 104, and 100 face a completely different problem: their corridors are already saturated with competing services, so adding more buses or retaining the current service simply divides a limited ridership pool further.
120 176 31+48 Bus stand to Judicial Court Kalunga bus stand to Balanda High School Prem Nagar to Gurudia bus stand
105,109,121,119, 113,122,110,118, 111,115,114 (No overlapping outside city)
39 7 16
Table. 55. Low Average Occupancy Route Characteristics – Headway, Low B/A Stretches, Overlap and Combined Fleet
Note: Combined Fleet = total number of CRUT + private buses operating on the identified low B/A stretch. B/A = Boarding + Alighting.
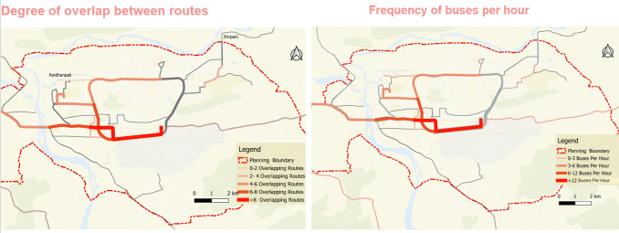
Fig. 83. Low B/A Stretches: Degree of Overlap Map (8 Low Occupancy Routes)
Left panel: Map showing low B/A stretches of the 8 routes colour-coded by degree of overlap: grey (0–2 routes), light pink (2–4), medium orange (4–6), dark orange (6–8), dark red/crimson (>8 routes). Right panel: Same stretches colour-coded by frequency of buses per hour: light pink (0–3 buses/hr), orange (3–6), red (6–12), dark red (>12). Planning boundary shown as red dashed line.
The boarding-alighting analysis and overlap data produce three distinct diagnostic groups, each defined by a combination of route overlap and combined bus frequency on the low-performing stretches and each requires a different type of intervention.
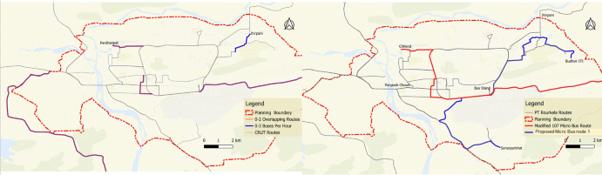
Fig. 84. Existing and Proposed Condition Map for stretches with 1-3 Buses per hour
Issue: These stretches have low route overlapping (0-2 routes), except for a small section near Jhirpani and NIT, which has 3 overlapping routes. The stretches experience low occupancy, low boarding and alighting, and very high headways (low combined bus frequency). This results in low patronage primarily due to excessive waiting time for passengers.
Solution: Introduce 10-seater micro buses with headways of 10–15 minutes (high frequency) on these routes. Route 107 (15km length) with 47% average occupancy and 101 E (12.3km length) with 62% occupancy can be replaced by single modified 107 Micro bus route (connecting both routes). Route 104 has low occupancy of 54%. This can be replaced by proposed Micro Bus Route No. 1
Stretches with Low occupancy, boarding alighting with 3-6 buses per hour
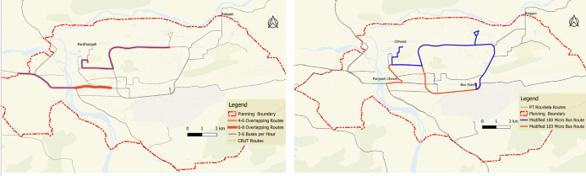
85. Existing and Proposed Condition Map for stretches with >6 Buses per hour
Issue: For these stretches the overlapping of routes is high (6-8 routes). These stretches have low occupancy and low boarding alighting, but acceptable headway of 10-20 minutes (combined frequency of 3-6 buses per hour). This points to low demand on these stretches.
Solution: Selected routes with relatively shorter route length and relatively lower occupancy can be converted to Micro bus routes with a headway of 10—15 minutes. Route no. 103 and 100 have lower occupancy of 58% and 54% and short length of 9.7km and 18.7km respectively. These are proposed to be converted to Micro Bus routes. Others remain same.
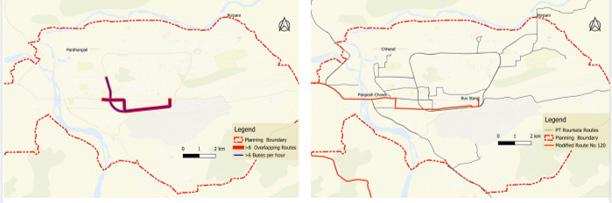
Fig. 86. Existing and Proposed Condition Map for stretches with >6 Buses per hour
Issue: For these stretches the overlapping of routes is high (>8 routes). These stretches have low occupancy and low boarding alighting, coupled with very high combined frequency, i.e. >6 buses per hour (or an average headway of <10 minutes). This points to low patronage because of high degree overlap between routes — demand is not enough to fill all buses.
Solution: Low occupancy routes 120, 103, 101 and 101E overlap on this
stretch. Routes/services on 103, 101 and 101E have been proposed to be modified above. Route no. 120 is a regional connector with a length of 51.5 km with an average occupancy of 50%. There is no overlap on this route outside the city limits. The part of the route within city limits is suggested to be modified to cover routes not covered by CRUT network. This should balance ridership on these overlapping routes.
103, 101, 101E
Modified above
Modify in-city section to cover routes not covered by CRUT network; retain regional section outside city limits unchanged
Already proposed to be modified under Bands 1 & 2 above; their modification reduces overlap on this stretch automatically
Table. 56. Band 3 Routes – High Frequency / High Overlap: Proposed Intervention
Sustainable Urban Mobility - Air quality, Climate Action, Accessibility (SUM-ACA) is a project jointly implemented by Deutsche Gesellschaft für Internationale Zusammenarbeit (GIZ) GmbH and the Ministry of Housing and Urban Affairs (MoHUA), Government of India, commissioned by the German Federal Ministry for Economic Cooperation and Development (BMZ). The project objective is to enable national, state and municipal institutions to promote climate and environmentally friendly, low emission and socially balanced urban mobility systems. The project is part of the Green Urban Mobility Partnership between Germany and India.
Deutsche Gesellschaft für Internationale Zusammenarbeit GmbH
A-2/18, Safdarjung Enclave
New Delhi, 110029, India
T: + 91 11 49495353
E: info@giz.de
W: www.giz.de/India