Introduction
THE ICHTHYOFAUNA OF SUFFOLK: THE CURIOUS CASE OF THE EELPOUT ZOARCES VIVIPARUS
JIM R. ELLIS AND GARY J. BURT
Eelpout, or viviparous blenny, Zoarces viviparus (L., 1758) (Order Perciformes; Family Zoarcidae; Fig. 1) is an inshore fish that is often reported from estuaries, harbours, shorelines and shallow seas to depths of about 40 m (Poll, 1947; Andriashev, 1986). It usually attains a maximum length of about 35 cm total length (LT), but it has been suggested that it can grow to 52 cm LT (Andriashev, 1986). The biogeographical range of eelpout extends from the English Channel through the North Sea to the Barents Sea and White Sea, including the Baltic Sea (Andriashev, 1986), but it appears to be more frequent along the coasts of continental Europe than the British Isles (Heessen, 2015).
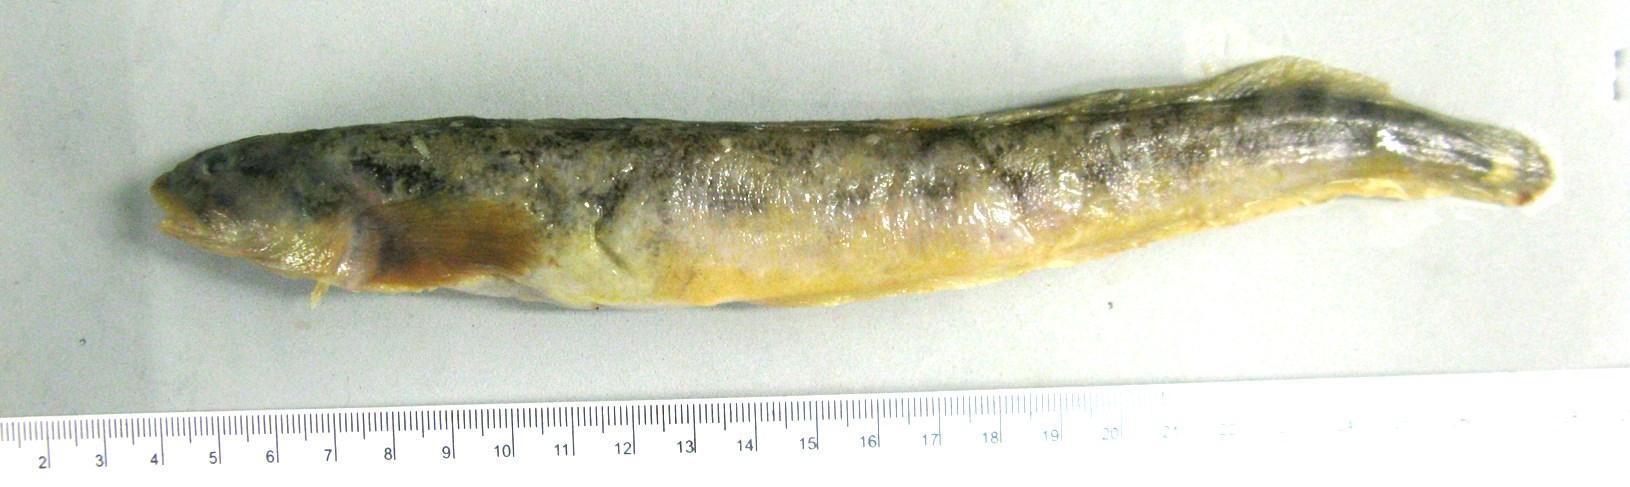
Figure 1: Specimen of Eelpout Zoarces viviparous. Photograph: J. Ellis (CEFAS).
Along the south-eastern coasts of the United Kingdom, eelpout was purportedly common off the Hampshire coast, and also common off the coasts of Norfolk and Yorkshire (Yarrell, 1859). Along the intervening section of coastline, it has been reported from the Thames area, ranging from the Medway and Swale (Kent) to Leighon-Sea, Southend, and the entrances to the Rivers Blackwater and Crouch in Essex (Murie, 1903; Wheeler, 1979). Along the coasts of Suffolk and eastern Norfolk, it has been reported from Lowestoft beach (including Claremont Pier), with young specimens in the inner harbour (Lowe, 1874; Patterson, 1910), as well as Martlesham Creek, Orford, Aldeburgh, River Blyth, River Waveney (to St Olaves), and Breydon water (Patterson, 1910; Collings, 1933).
The historical abundance of eelpout in some of these areas is unclear, although Murie (1903) noted that “at certain spots in the winter season it simply swarms”, and Patterson (1910) considered it to be common off eastern Suffolk. Whilst Laver (1898) considered that it was not rare in the waters of Essex, Wheeler (1979) later reported that it was not common in the entrance to the Thames. Inshore surveys along the south-eastern coast of the UK (1981–1997) indicated that eelpout was observed most commonly off the Lowestoft and Great Yarmouth areas, as well as in various estuarine ecosystems, such as the Swale (Kent), Southend (Essex), The Wash, Humber, and Bridlington Bay (Rogers et al., 1998). Eelpout was also observed to more prevalent in The Wash and, across the wider survey area, was generally found in waters 3–14 m deep (Rogers et al., 1998).
Eelpout is ovoviviparous, and gives birth to live young. Females are ready for fertilization in the summer (July-August), embryos appear during September, and the young are born in the period December to February, after a developmental period of ca. 4 to 5 months (Götting, 1976; Hedman et al., 2011). The adult females give birth to young that are about 3.5–5.0 cm long, with the early free-living stages (fry) approximately 4.0–6.7 cm long (Svedäng et al., 1997; Mendez, 2014). Fecundity increases with age and length, usually ranging from 24 to 300 young, but up to 405 young have been reported in a female of 38 cm LT (Stuhlmann, 1887; Götting, 1976; Pörtner et al., 2001).
Early studies analysing meristic information (e.g. the numbers of fin rays and vertebrae) indicated that eelpout displayed strong regional variation in such features (Schmidt, 1917, 1918), and so it has long been supposed that this species forms localised populations. This would be related to the life-history of the species, as its reproductive strategy means that there is no longer-distance dispersal of early egg and larval stages in the plankton.
Given the sedentary nature of eelpout, their inshore and estuarine habitat, and their reproductive mode, this species has been used as a biological indicator, especially in the Baltic Sea and Kattegat (Voigt, 2007; Hedman et al., 2011), but also for North Sea coasts (Essink, 1985; Stentiford et al., 2003; Lyons et al., 2004). For example, pollution and reduced water quality may be associated with an increased proportion of females with malformed larvae (Strand et al., 2004; Gercken et al., 2006; Napierska & Podolska, 2006), an increased prevalence of intersexual fish (where the gonads contain both male and female tissues; Matthiessen & Law, 2002; Lyons et al., 2004), an increase in the numbers of females that are not pregnant (Simonsen & Syrand, 2010), and endocrine disruptors are thought to affect the sex ratio in broods of larvae, including a smaller proportion of females (Larsson et al., 2000).
In addition to water quality, eelpout may be susceptible to increasing water temperatures. It is a boreal (northern) species, and it has been suggested that the optimum water temperature for growth of eelpout is 12–14°C, with water temperatures of 18°C leading to avoidance behaviours and some mortality, and 22–23°C being the upper lethal temperature limit (Zakhartsev et al., 2003; Hedman et al., 2011).
Given that the southern British Isles is the southern distributional limit of eelpout, its population status in the south-western North Sea may also be affected by increasing water temperature. Furthermore, noting that several studies have suggested that pollutants may impair the reproductive success of eelpout (Hedman et al., 2011), poor water quality may impact further on the reproductive output and population dynamics of local stocks. Consequently, eelpout may be a useful sentinel species for understanding the ecological status of coastal and estuarine waters along North Sea coasts.
The aim of the present paper was to summarise available data for eelpout from trawl surveys conducted in the North Sea, in order to gauge the recent temporal
trends in their occurrence and relative abundance. These data are discussed in relation to those factors that may affect eelpout populations, with particular emphasis on the southern coasts of the North Sea, including East Anglia.
Methods
A range of trawl surveys are undertaken across the North Sea, with these data providing information on the distribution and relative abundance of many fish species. These surveys are often used in the stock assessments for the main commercial fish species, and of the wider fish assemblage. The data analysed here were from the (a) CEFAS Young Fish Survey (YFS, 1981–2010) in the western North Sea, (b) inshore Demersal Young Fish Survey (DYFS) of the eastern North Sea, (c) North Sea International Bottom Trawl Survey (NS-IBTS), and (d) Beam Trawl Survey (BTS; North Sea data only). The three latter surveys are all international surveys that are coordinated under the auspices of the International Council for the Exploration of the Sea (ICES). Data for the YFS were downloaded from CEFAS’ Fishing Survey System (FSS) on 29 July 2024, the NS-IBTS and BTS data were downloaded from ICES’ Database of Trawl Surveys (DATRAS) on 17 September 2024 (with analyses for both these surveys limited to the years 2000–2024), and DYFS data were downloaded from DATRAS on 3 October 2024. For the DYFS, BTS and the NS-IBTS, unaggregated trawl data were downloaded for eelpout (Aphia ID 127123). Given that some trawl catches may be subsampled, the number of eelpout for some hauls may be raised, and thus given as decimal numbers.
Young Fish Survey: Data from the YFS were collected by 2 m beam trawl (1981–2010) and 1.5 m push net (1981–1999). The methods and survey area for this survey were described by Rogers et al. (1998). Specimens of eelpout were usually measured to the 0.5 cm below, but only the number of individuals was reported in some hauls at the start of the time-series. Analyses of length-frequency data and the distribution by depth used haul-based data that were not standardised to a consistent sampling effort over time.
Table 1: Summary of data from the internationally-coordinated demersal young fish survey (DYFS; valid hauls only). Data accessed from DATRAS on 03/10/2024.
Given that the current paper has a greater regional focus on the south-western North Sea, data from the YFS were analysed in greater detail. Catches were standardised to the numbers caught per 10 minutes tow duration for 2 m beam trawl stations, and the mean catch rates and frequency of occurrence were calculated for the two sampling areas where eelpout was most common (the Winterton to Orford area, and The Wash). This analysis was limited to include only those trawl stations where the water depth at the time of trawl deployment was <20 m. The number of stations included in this analysis ranged from 31–34 per year in The Wash, and 27–49 per year in the Winterton to Orford area.
Demersal Young Fish Survey: Data from the DYFS were from three nations (Belgium, Netherlands, and Germany), with samples collected with either 3 m or 6 m beam trawl (Table 1). The Belgian survey operates along the coast of Belgium, the Dutch 3 m beam trawl survey is undertaken primarily in the Scheldt Estuary (southern Netherlands) and Dutch Wadden Sea, and the German survey operates inside and outside the East and North Frisian Islands (including the Lower Saxon Wadden Sea, Elbe Estuary, and the Schleswig-Holstein Wadden Sea). The Dutch 6 m beam trawl survey has a broader spatial coverage that extends from the southern parts of the Netherlands to Denmark.
These data (raised to the haul level) were not standardised to a consistent haul duration or survey effort (which can change annually), and are shown here as the total numbers reported. These data were used for analyses of length-frequency, the distribution by depth, and for the total numbers of eelpout caught annually. Given the amount of data that were available for the DYFS, the frequency of occurrence at valid trawl station was also examined, although potential impacts of temporal changes in survey effort and coverage were not considered in these initial analyses.
North Sea International Bottom Trawl Survey: Analyses of length-frequency data and the distribution by depth for the NS-IBTS used haul-based data that were not standardised to a consistent sampling effort over the time-series. Given the lower incidence of eelpout in this survey, only the total numbers per year were considered, with no consideration of survey effort. Three nominal records of eelpout in the NSIBTS dataset were excluded, as these were from depths of 72–174 m, and so likely to have been misidentified.
Beam Trawl Survey: Data analyses for the BTS were as described for the NS-IBTS. Two nominal records of eelpout in the wider BTS dataset were also excluded, as these were from the western seaboard of the United Kingdom, and may also have been misidentified.
Results
Young Fish Survey: In total, 991.1 specimens of eelpout were recorded in the YFS, of which 930.1 were measured (n = 881.1 and n = 49 for 2 m beam trawl and push net, respectively) and 61 were counted (n = 50 and n = 11 for 2 m beam trawl and push net, respectively). The overall length range was 3.5–28.0 cm LT (Fig. 2; n = 930.1), with the main peak in the length-frequency distribution being 10.0–13.5 cm LT (70.9% of
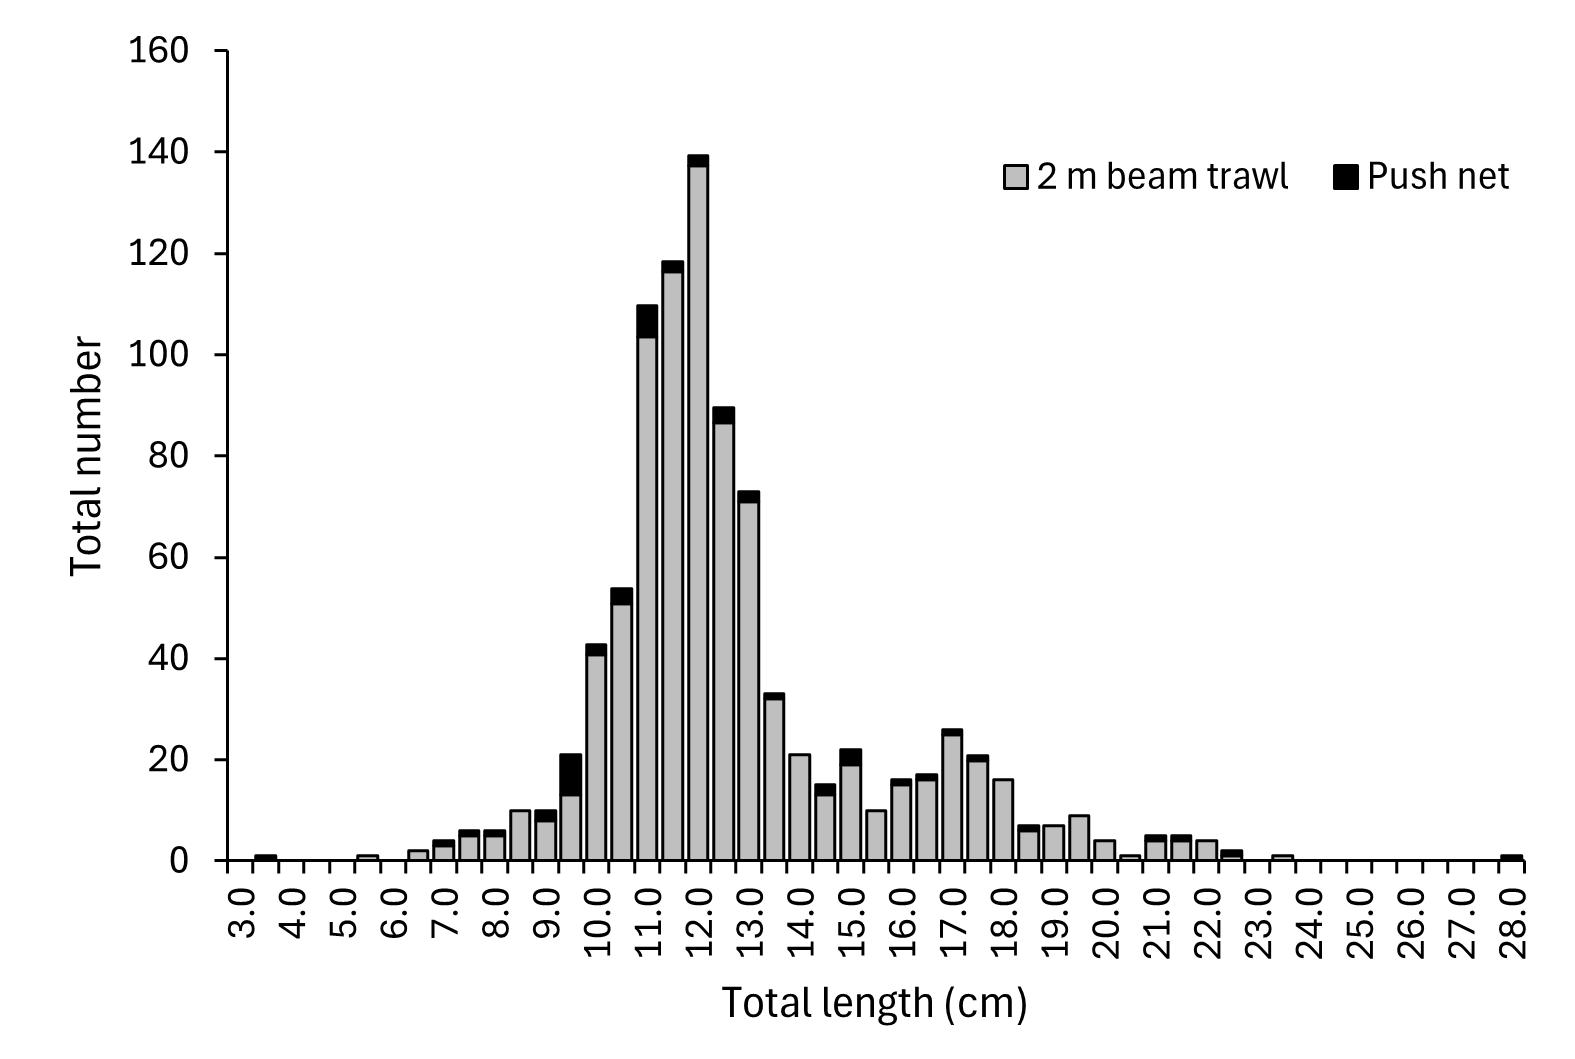
Figure 2: Length-frequency distribution of eelpout (measured to the 0.5 cm below) sampled in the Young Fish Survey (YFS; 1981–2010) in the western North Sea. Haul-based data (not raised to standardised sampling time by gear) from 2 m beam trawl (n = 881.1) and push net (n = 49).
specimens). For those specimens caught by 2 m beam trawl (n = 931.1), the observed depth range extended to depths of 18.2 m, with 91.0% of specimens caught at depths of <15 m (Fig. 3).
Eelpout was caught by 2 m beam trawl over much of the wider survey area along the North Sea coastline, but the main sectors (see Rogers et al., 1998) where it was encountered were the Winterton to Orford area (n = 562.1; 60.4% of all specimens recorded), The Wash (n = 285; 30.6%) and Lincolnshire coast (n = 46; 4.9%). Eelpout was found in lower numbers elsewhere: Flamborough Head to mid-Humber (n = 2; 0.2%), Humber (n = 12; 1.3%), Winterton to The Wash (n = 4; 0.4%), northern Thames (n = 8; 0.9%), River Thames (n = 10; 1.1%) and southern Thames (n = 2; 0.2%).
Catches of eelpout in The Wash area (1981–2010) declined over the time-series (Fig. 4), with eelpout also observed in a lower proportion of hauls. Eelpout was found in >20% of hauls for several years at the start of the time-series (based on those hauls <20 m deep), but declined to 0–3% of hauls at the end of the time-series. Data for the Winterton to Orford area were restricted to the years 1981–1999, and showed variable trends (Fig. 4). Eelpout declined over the first part of the time-series, being absent in the years 1993–1995, before increasing in the years 1996–1999.
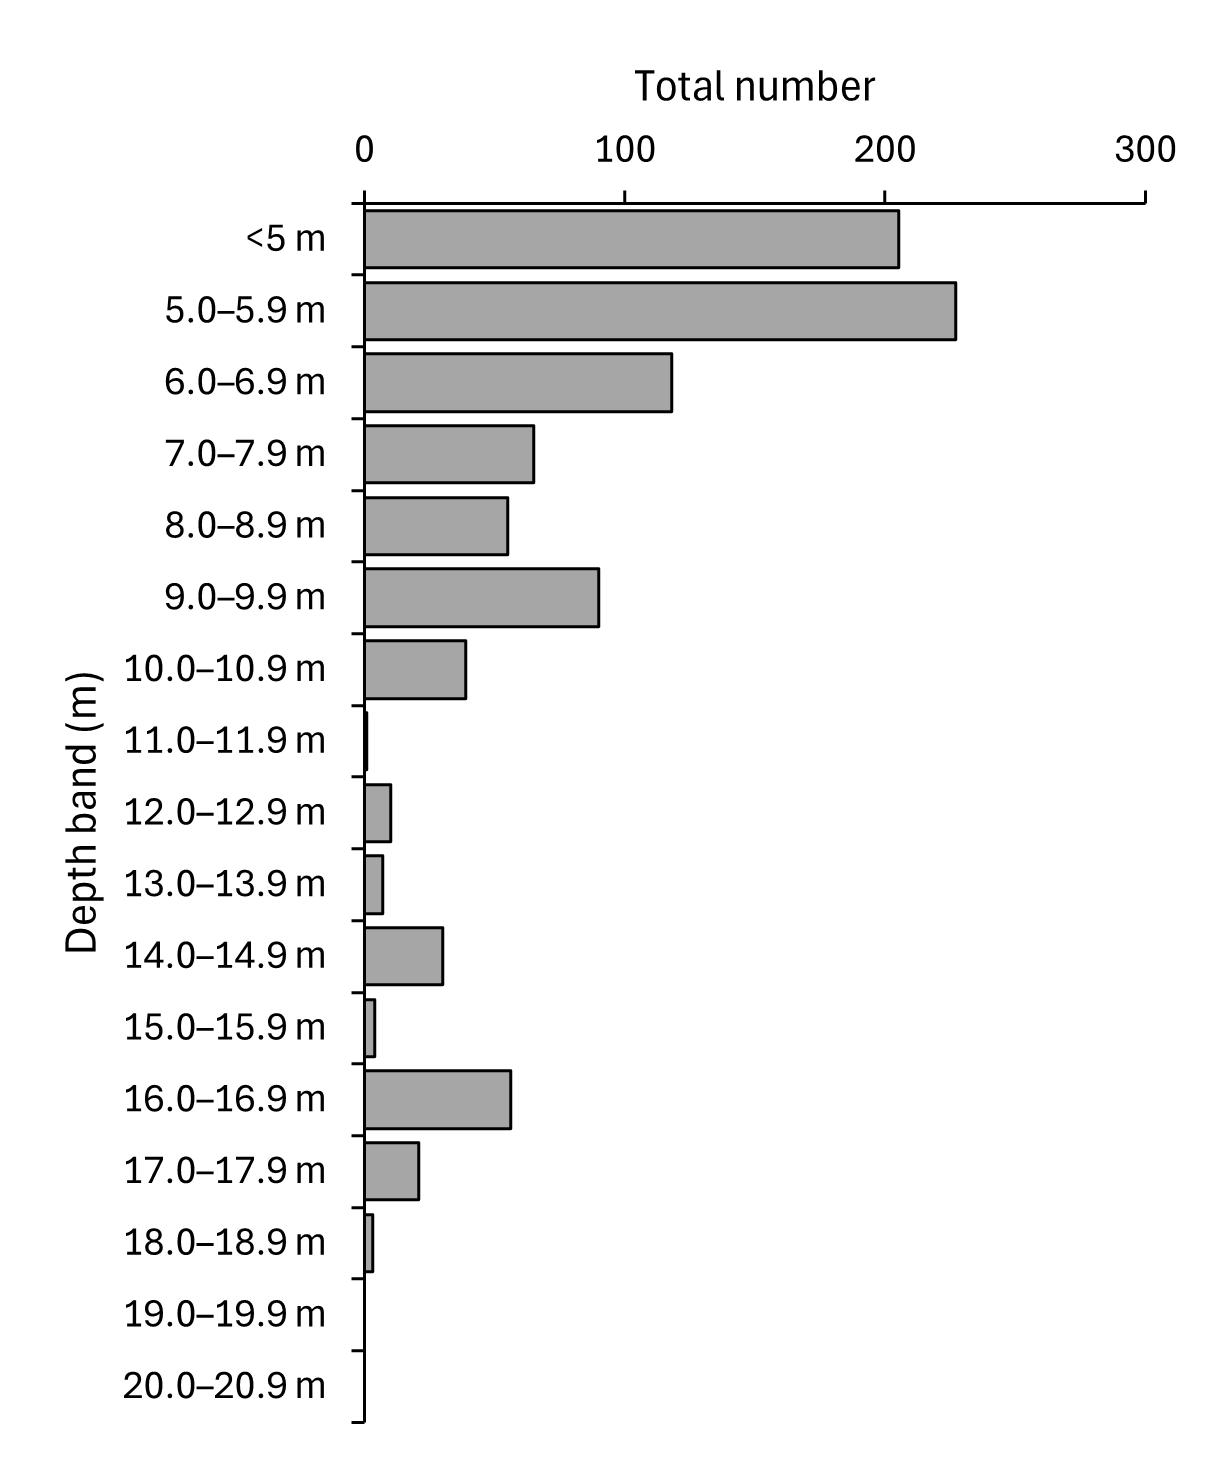
Figure 3: Occurrence of eelpout by depth as observed in the YFS (1981–2010; 2 m beam trawl only) in the western North Sea. Haul-based data not raised to standardised time (n = 931.1).
Demersal Young Fish Survey: Three nations undertake surveys in the inshore waters of the eastern North Sea, although the Belgian survey did not report any records of eelpout (Table 1). The length range of eelpout caught in the Dutch and German DYFS was 4–34 cm LT (although there was a single record of a 1 cm specimen, which is less than the size at hatching), with >95% of specimens being 9–21 cm LT (Fig. 5). Eelpout were observed in waters of 2–42 m during the DYFS, but the majority of specimens were from sites <15 m deep (Fig. 5).
Whilst the frequency of occurrence of eelpout at trawl stations showed high interannual variability, all surveys showed a marked decline in the frequency of occurrence over the longer-term (Fig. 6). Comparisons of the frequency of occurrence for the most recent 5-year period (2019–2023) to the first 5-year period in the time-series indicated declines in all three surveys. The frequency of occurrence in the Dutch 3 m beam trawl survey declined from an average of 53.5% (range =43.5–62.0%; 1985–1989) to an average of 23.2% (15.8.5–38.3%). Similarly, the frequency of occurrence in the Dutch 6 m beam trawl survey declined from an average of 20.9% (range = 15.0–25.5%; 1985–1989) to an average of 2.2% (0.0–4.9%). The German survey had a shorter time-series, but still showed a decline from an average of 26.0% (range = 15.4 –37.5%) for the years 1999–2003 to an average of 12.0% (8.3–18.6%) for the years 2019–2023 (Fig. 6).
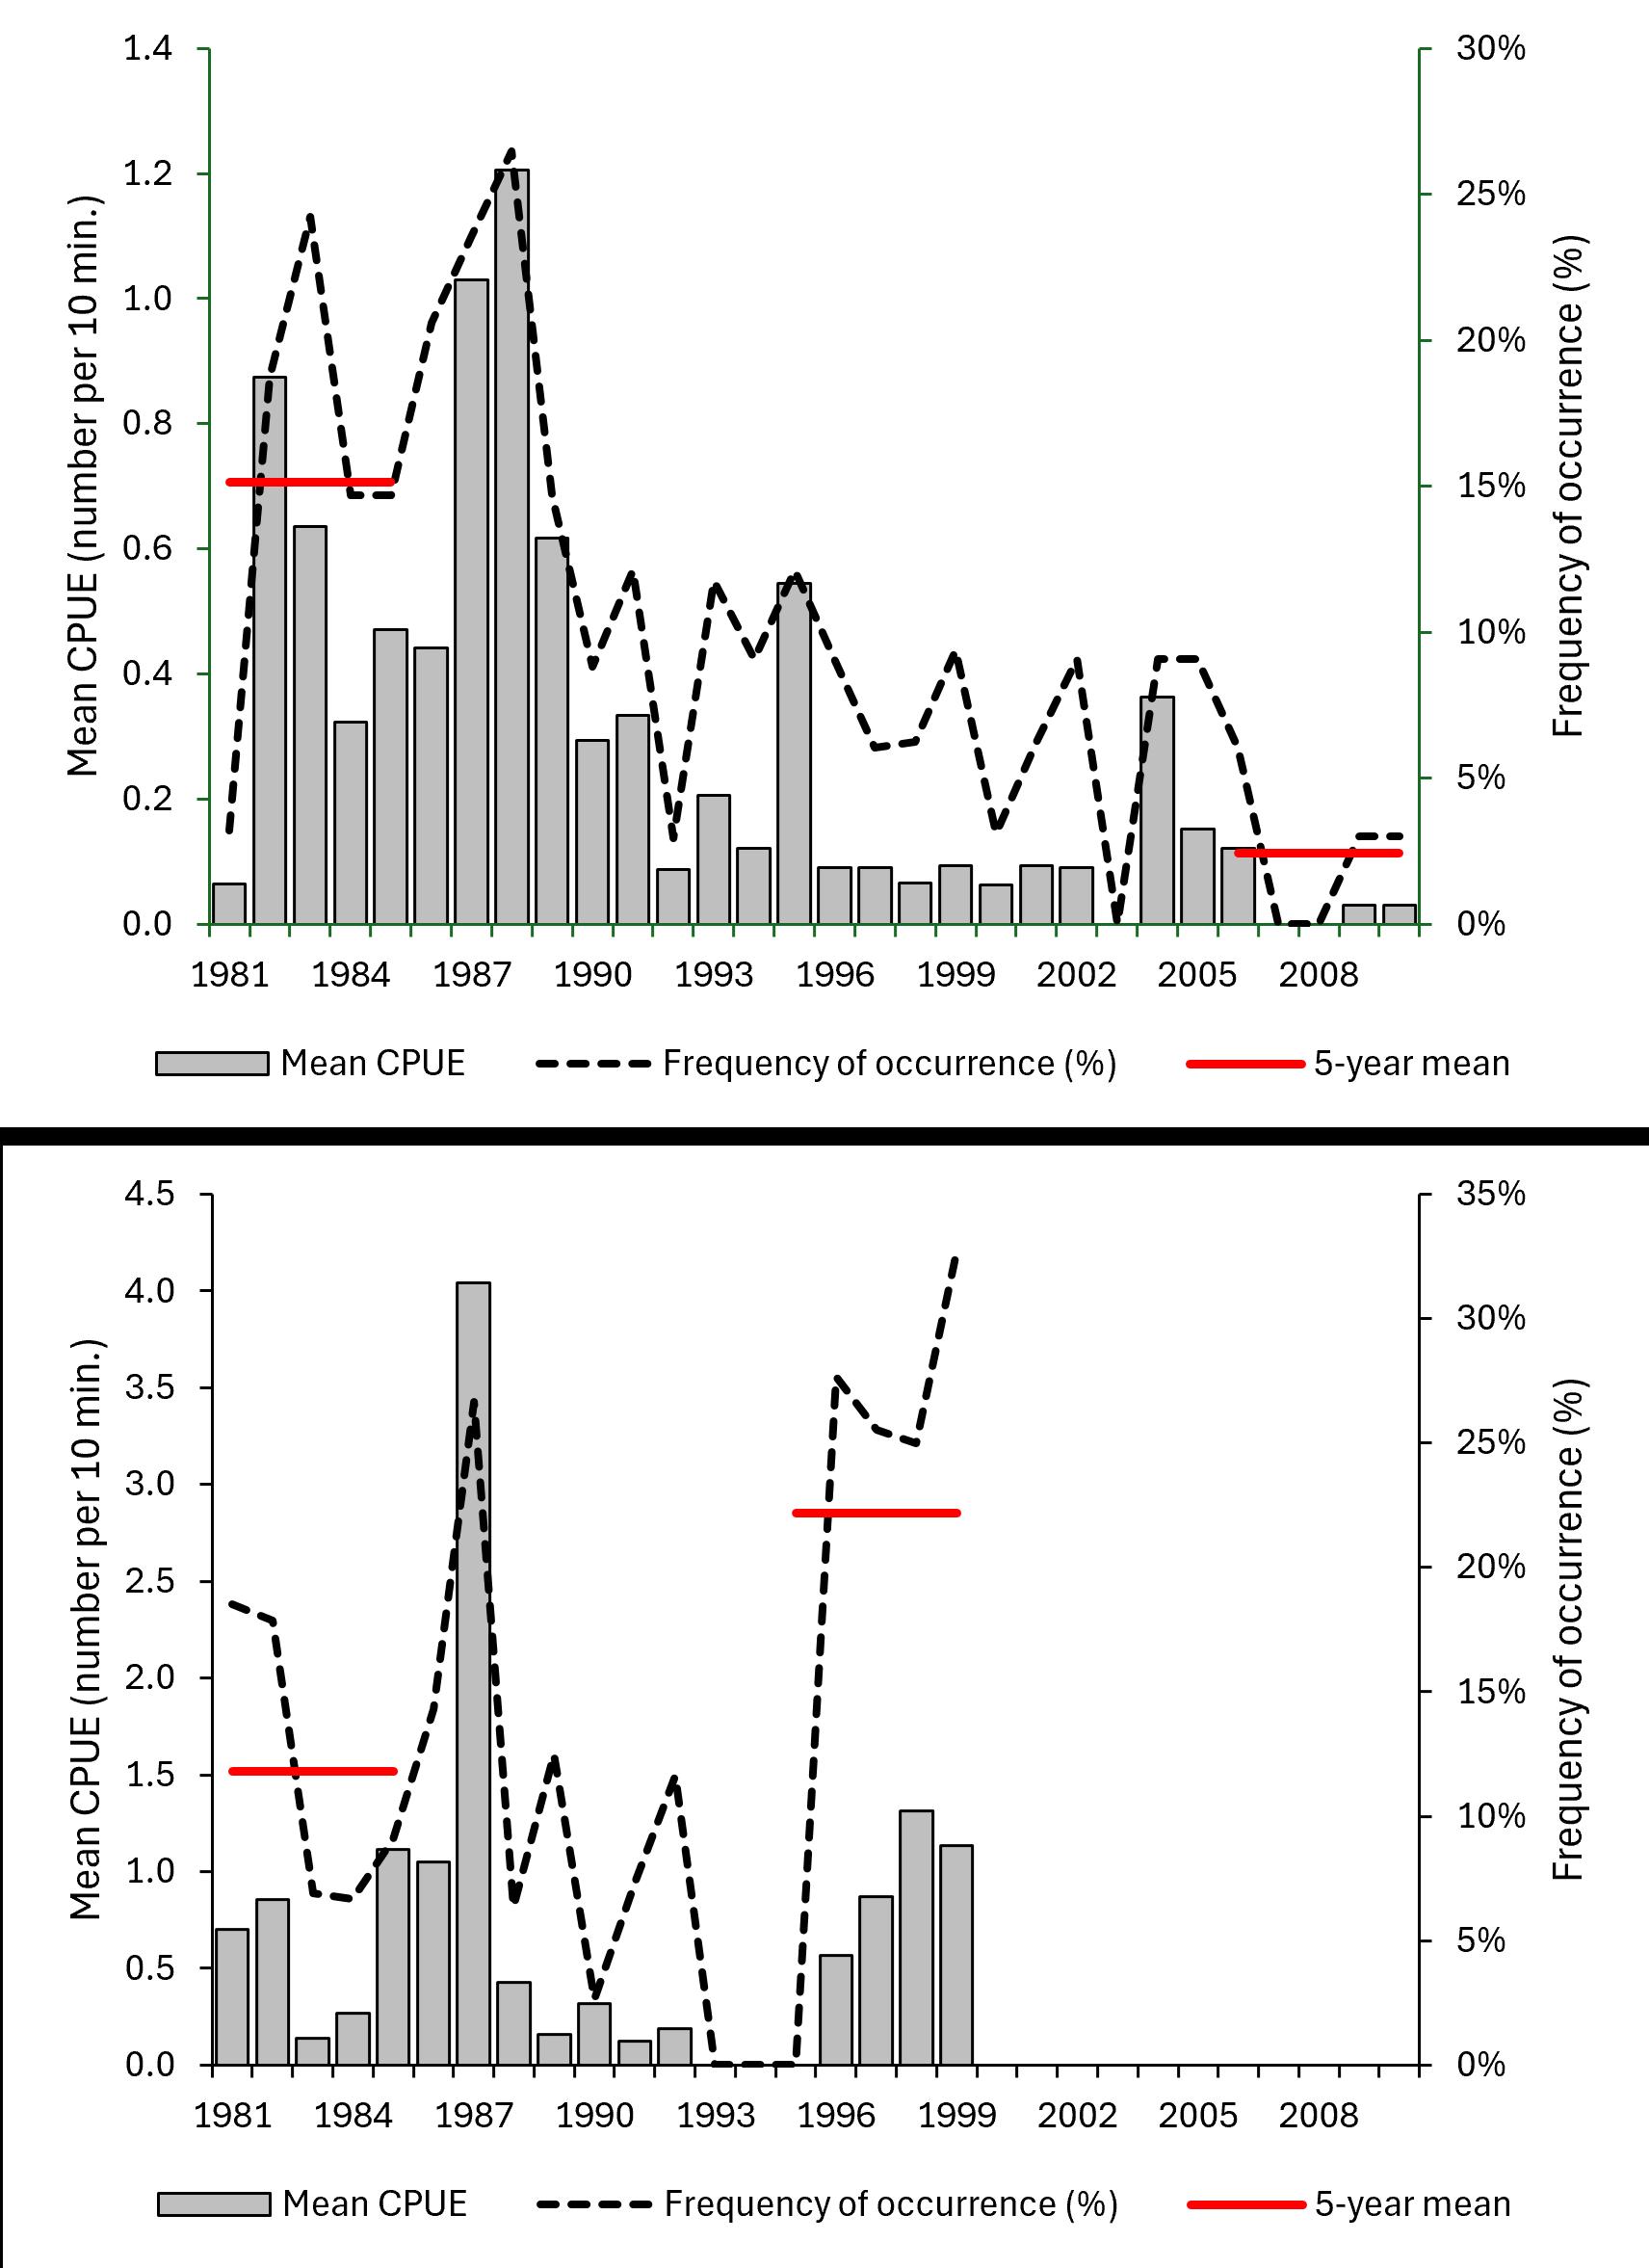
Figure 4: Mean catch per unit effort (CPUE) of eelpout (columns) and the frequency of occurrence in survey hauls (dashed line) for sampling areas in The Wash (1981–2010; top) and Winterton to Orford (1981–1999; bottom) as recorded in the YFS. Only data from 2 m beam trawl sampling in waters <20 m were included. The red horizontal lines indicate the average frequency of occurrence for the first and last 5-years of each time-series.
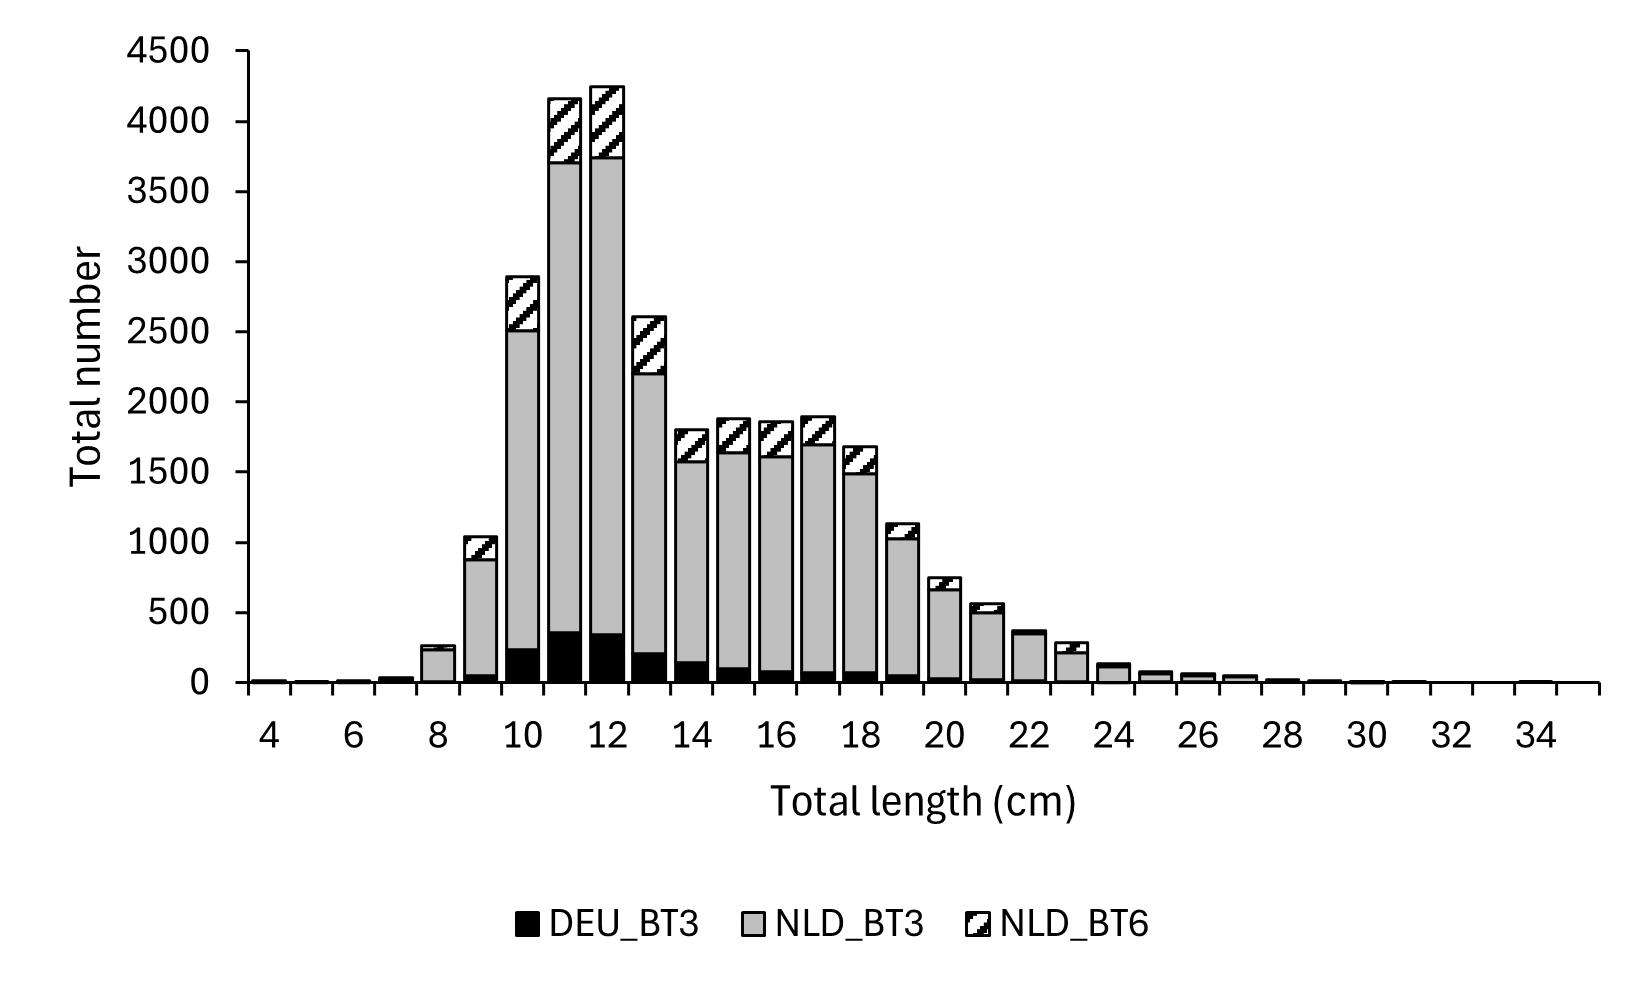
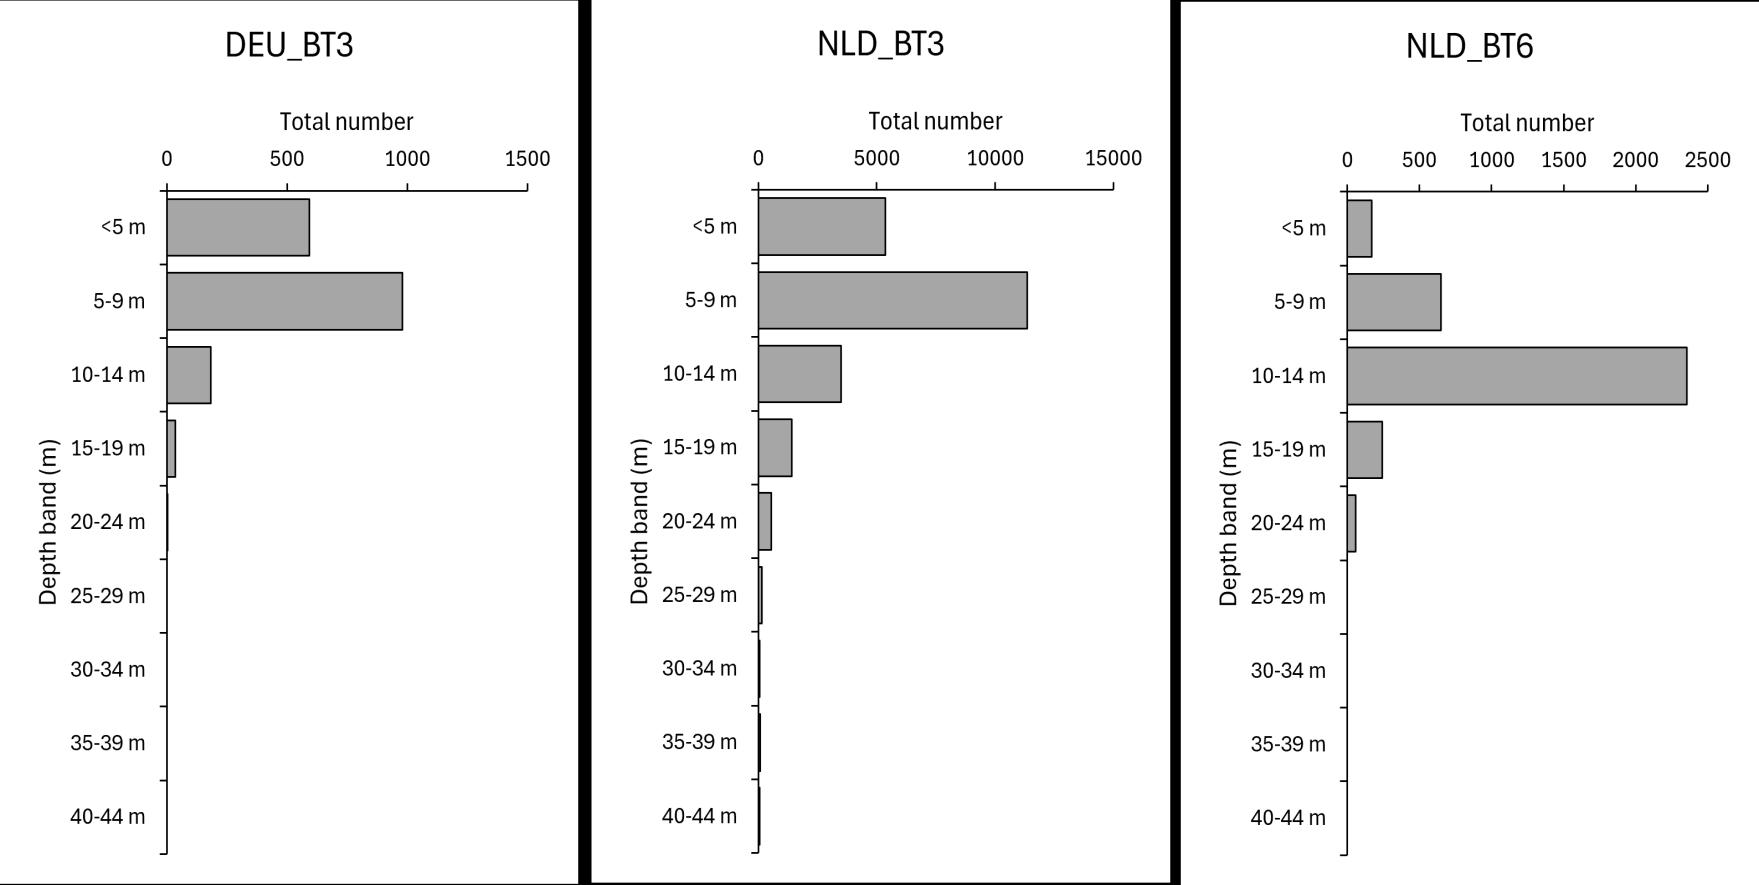
Figure 5: Summary data from the Demersal Young Fish Survey (DYFS), showing the length-frequency distribution (top) of eelpout caught in the German 3 m beam trawl survey (DEU_BT3; n = 1 796), Dutch 3 m beam trawl survey (NLD_BT3; n = 22 556), and Dutch 6 m beam trawl survey (NLD_BT6; n = 3 475), and the observed bathymetric distributions (bottom) of eelpout in DEU_BT3 (n = 1 794), NLD_BT3 (n = 22 479) and NLD_BT6 (n = 3 471).
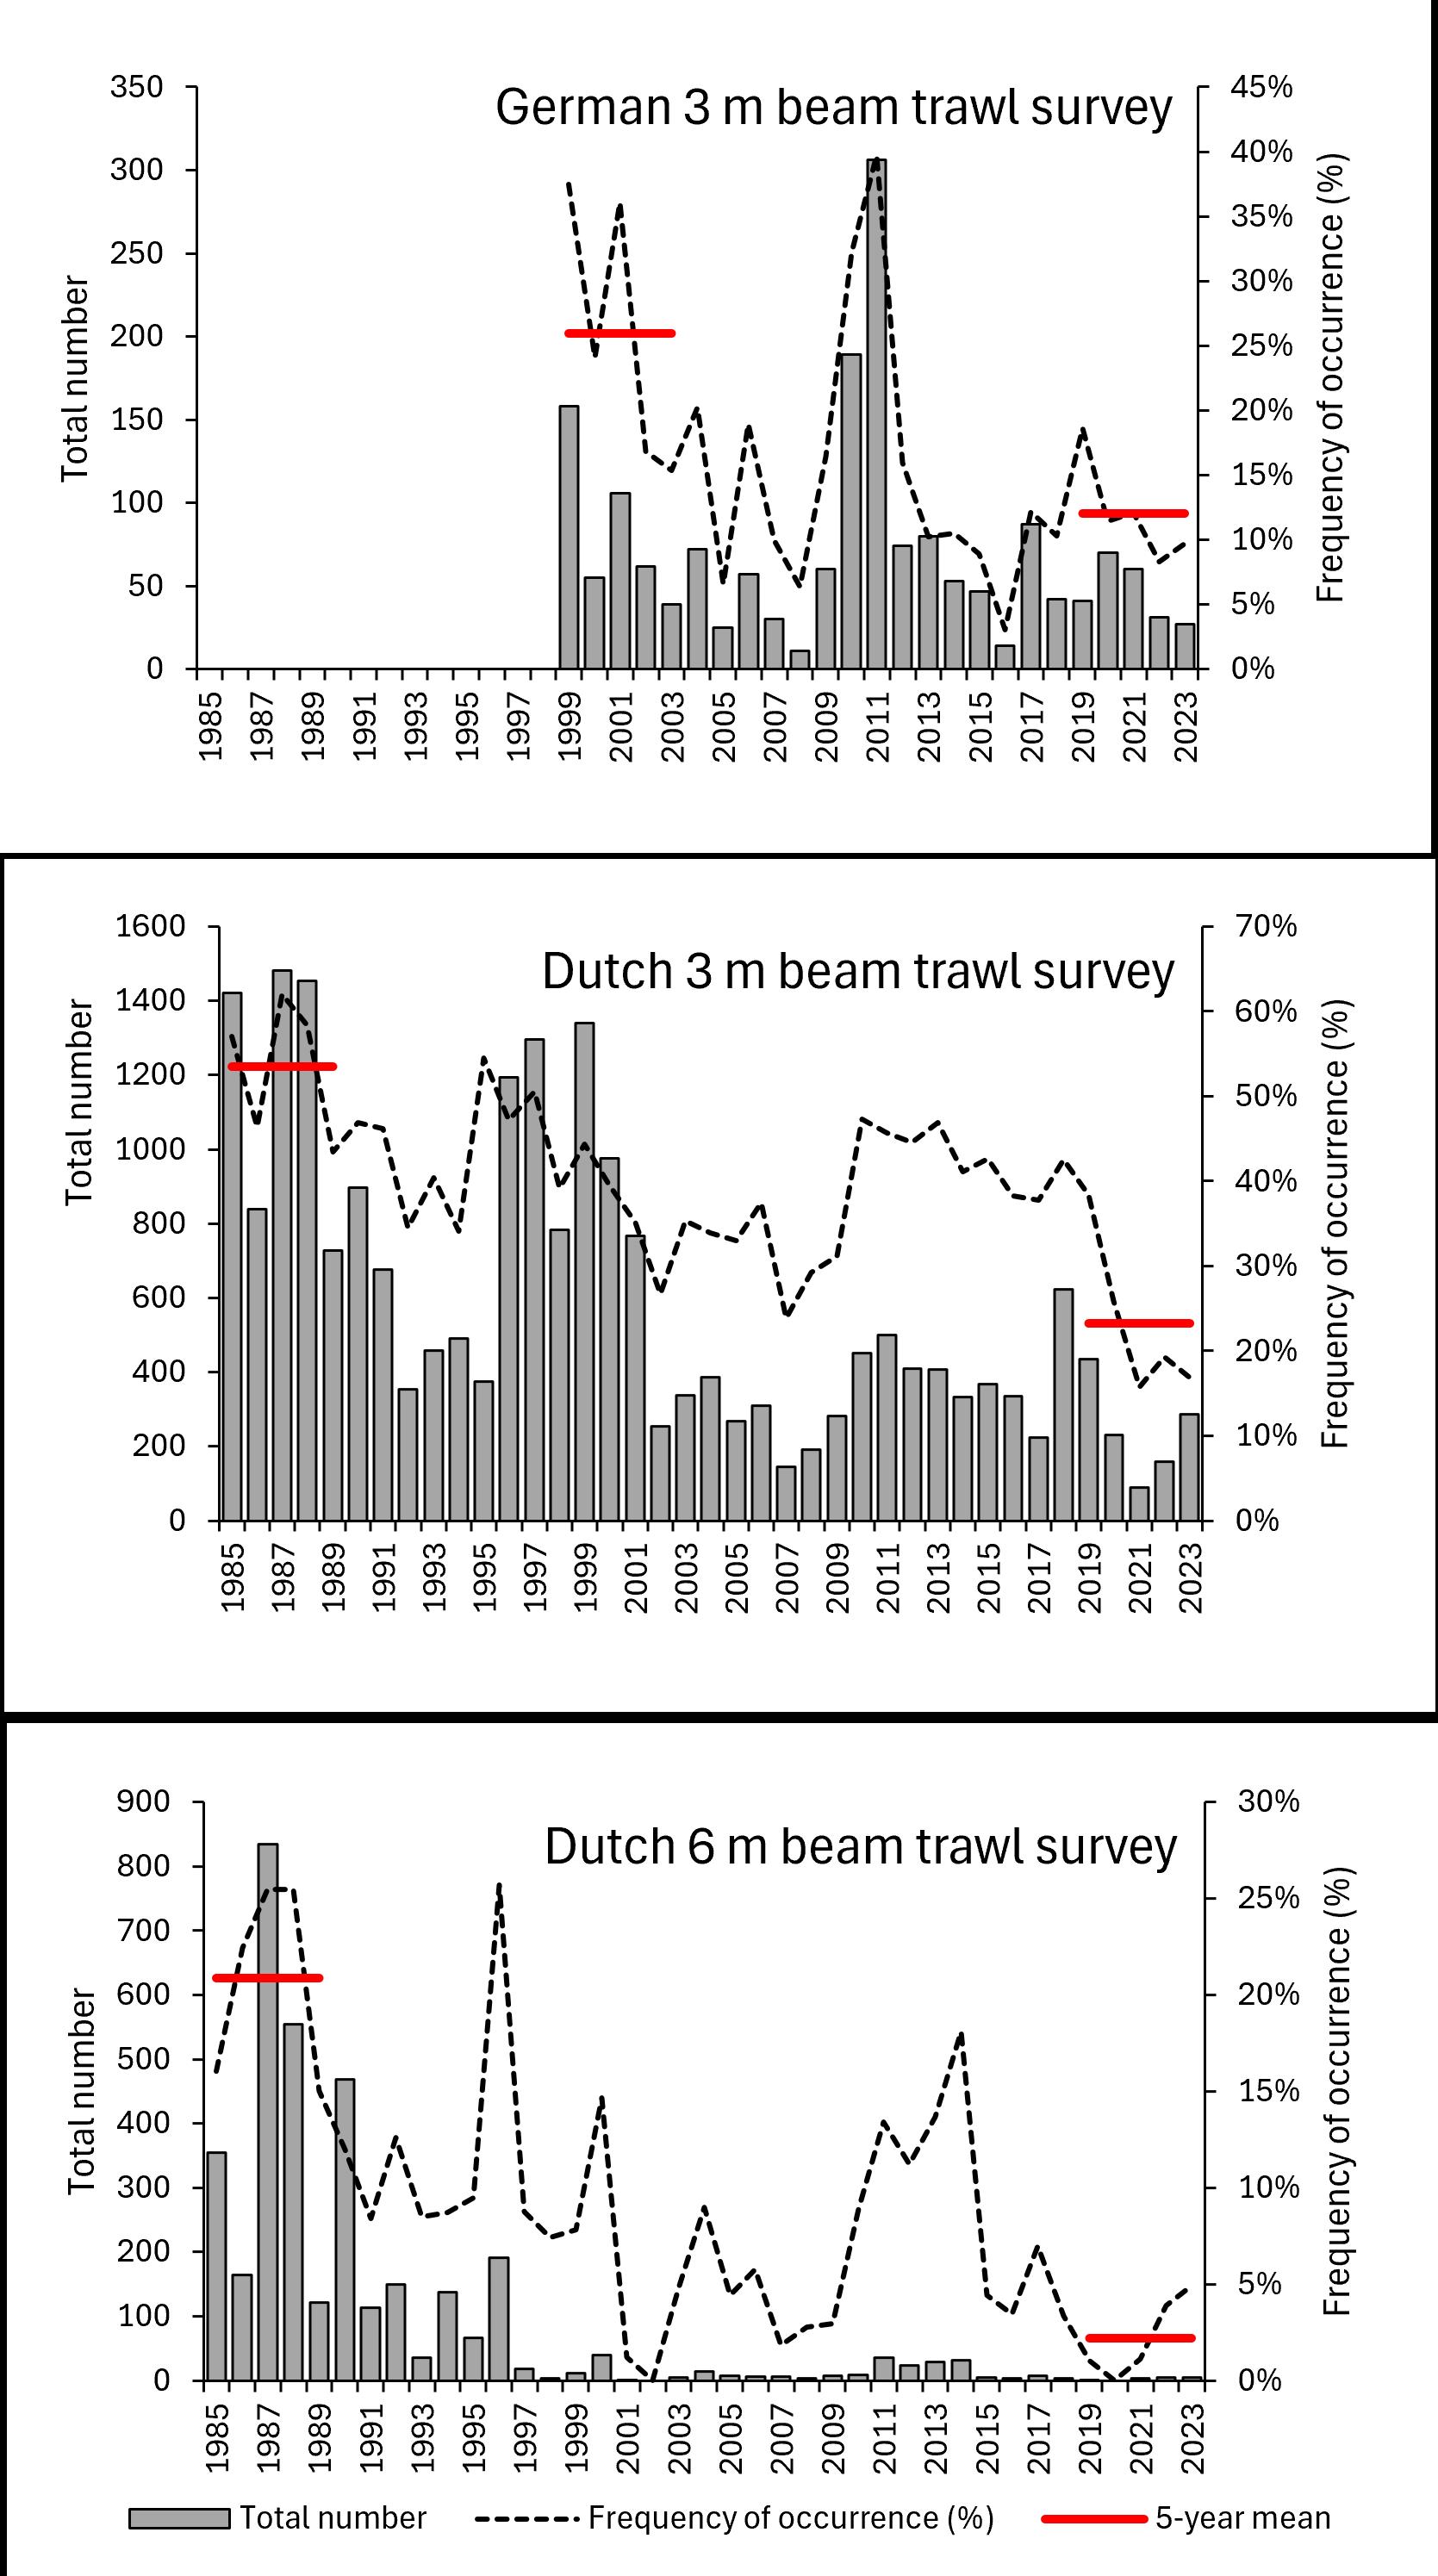
differences in survey effort across the time series), and the percentage of valid trawl stations at which eelpout was recorded for the German and Dutch beam trawl surveys using 3 m or 6 m beam trawl. The red horizontal lines indicate the average frequency of occurrence for the first and last 5-years of each time-series.
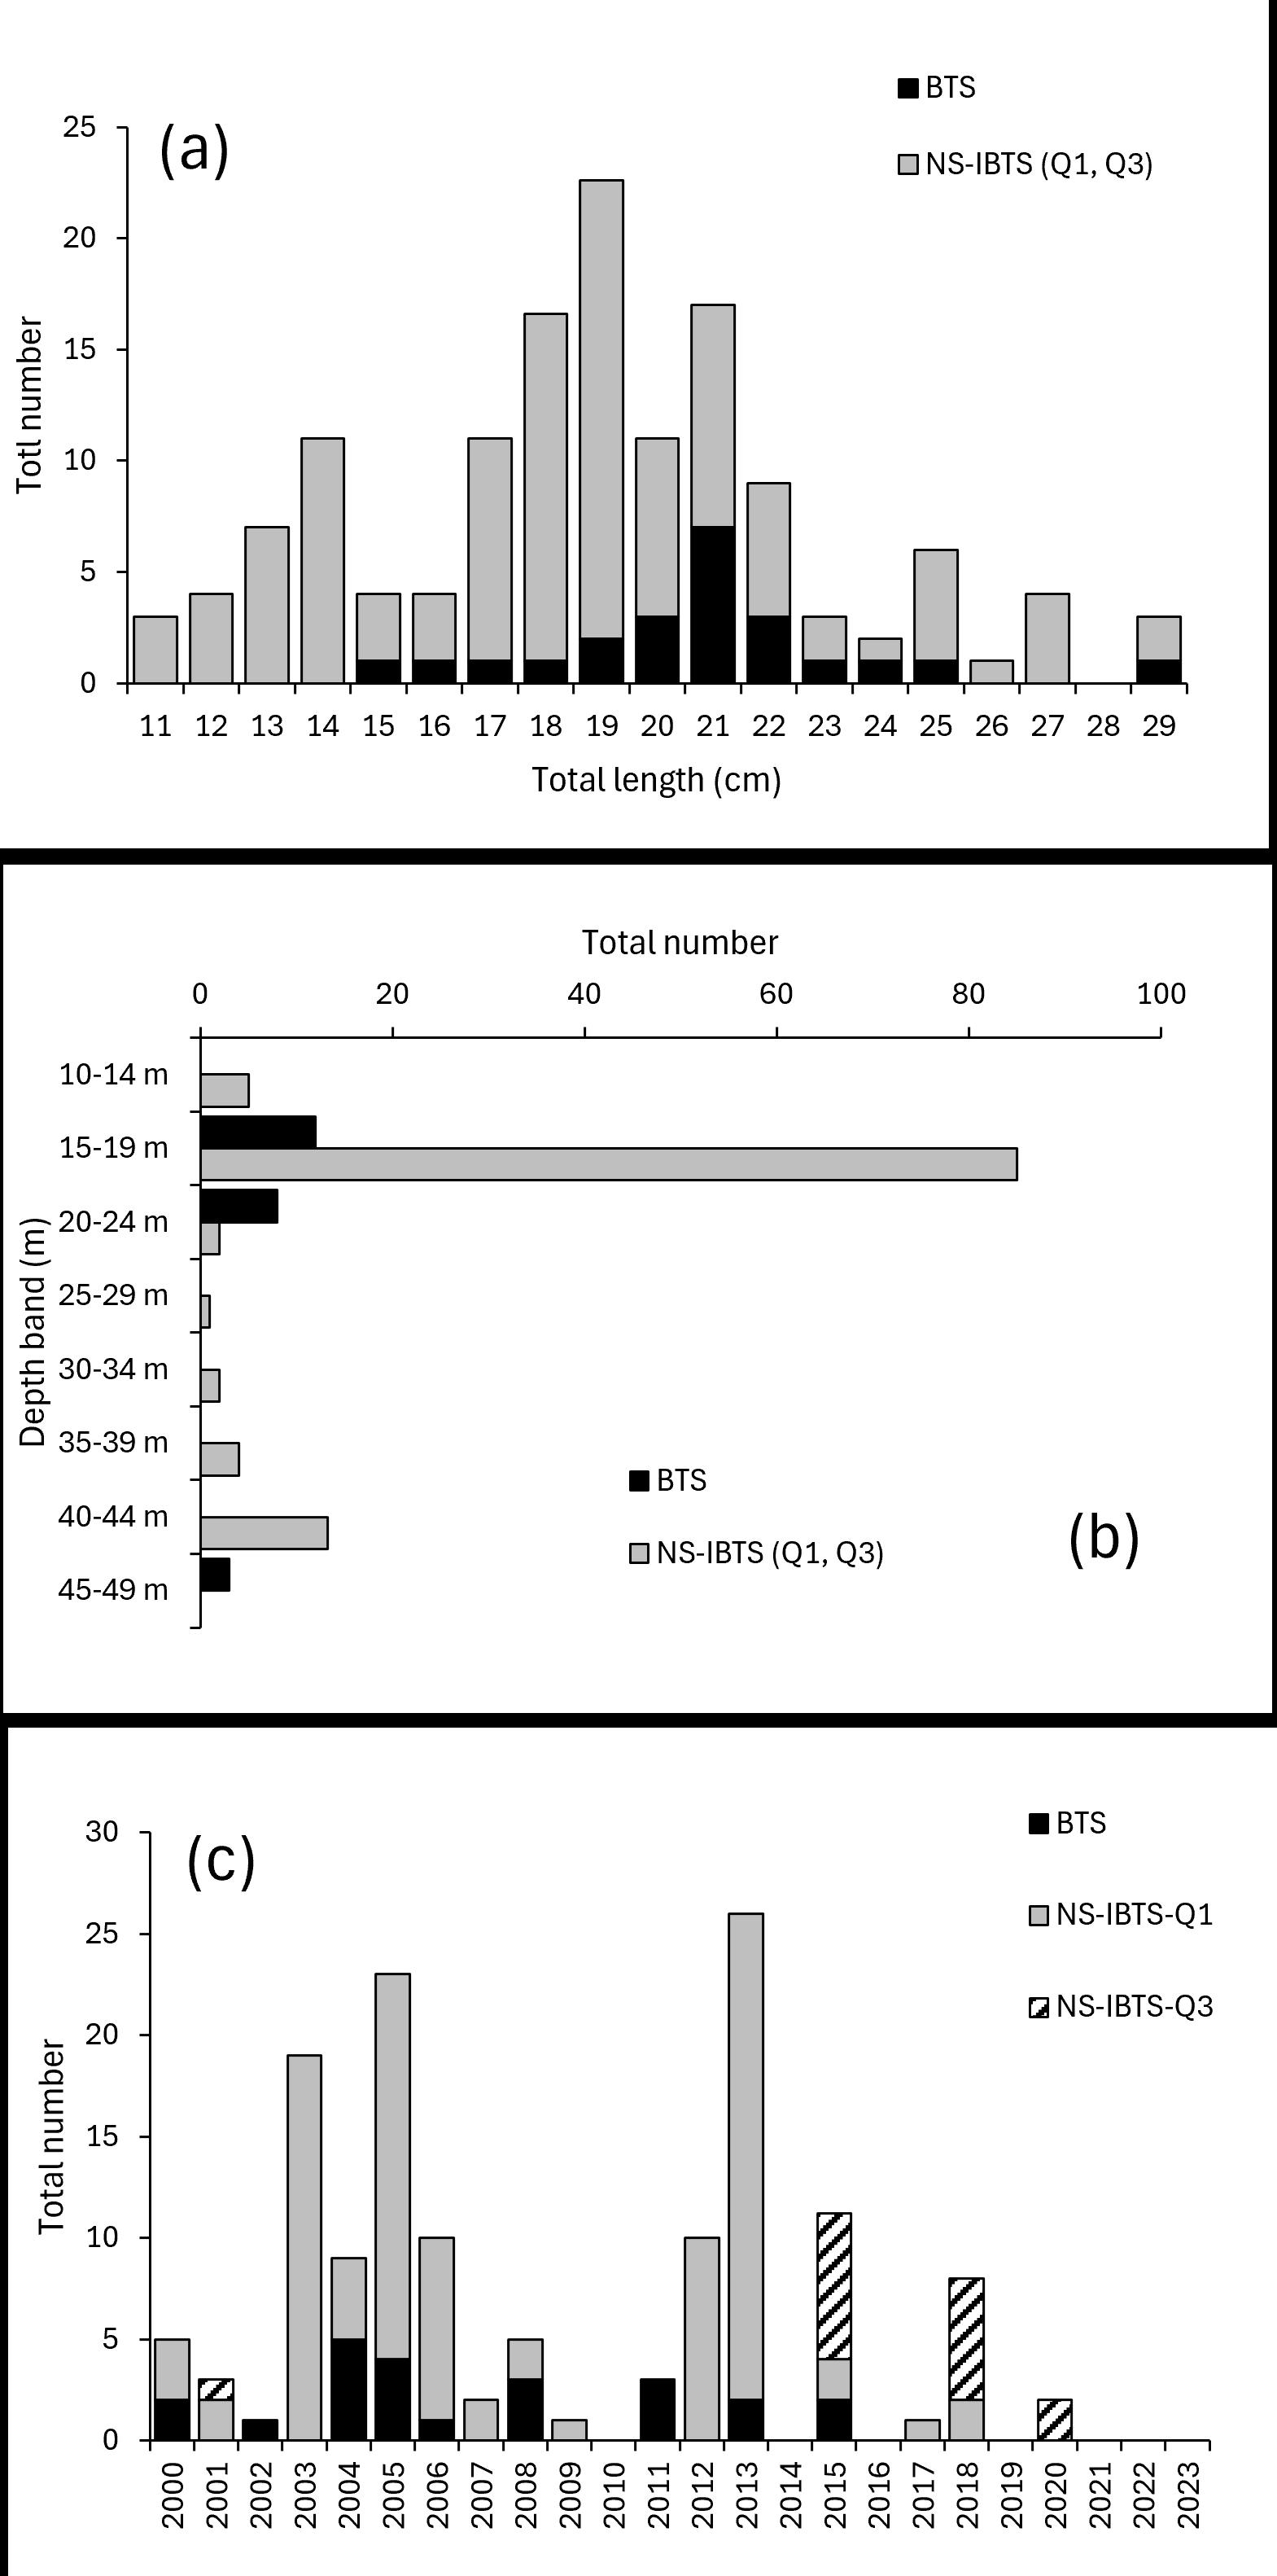
Figure 7: Summarised data for eelpout caught in the BTS and NS-IBTS (2000–2023) showing the (a) length-frequency distribution, (b) bathymetric distribution, and (c) total numbers caught (numbers raised to haul level, but total numbers each year were not standardised for any differences in survey effort across the time-series). Data for the NS-IBTS shown by Q1 and Q3 separately. Eelpout was also absent in the NS-IBTS-Q1 in 2024.
North Sea International Bottom Trawl Survey: In the years 2000–2024 (Q1) and 2000–2023 (Q3), the NS-IBTS reported 116.2 specimens of eelpout (11–29 cm LT; Fig. 7) which were caught at depths of 14–43 m (noting that three questionable records from deeper water were excluded). These specimens were captured across 25 individual trawl stations. Overall, 100 individuals were captured in Q1 and 16.2 in Q3. During Q1, the majority of specimens (n = 96) were from the western seaboard of Germany and Denmark, and the remaining specimens (n = 4), from the northern Kattegat. During Q3, the majority of specimens (n = 15.2; 93.8%) were from the northern Kattegat, with a single specimen from the western coast of Denmark. During the time-series analysed, there were no records of eelpout from either the southern or western North Sea.
Eelpout was observed sporadically in the Q3 survey (which has a similar spatial coverage of the North Sea to the Q1 survey), being recorded in only four years in the time-series. In contrast, eelpout was observed in 14 different years in the time-series analysed for Q1, although it was not reported during the last six years of the timeseries analysed (2019–2024; Fig. 7).
Beam Trawl Survey: In the years 2000–2023, the BTS reported 23 specimens of eelpout (15–29 cm LT) in the North Sea, which were caught at depths of 17–48 m (Fig. 7). These specimens were captured across 11 individual trawl stations, with all records from the German Bight and western Denmark. Eelpout was observed in nine different years in the time-series, but was not reported during the last part of the time-series analysed (2016–2023; Fig. 7).
Discussion
The YFS data analysed here ranged from 1981 to either 1999 or 2010 (depending on area), and so provided a longer time-series than that analysed previously by Rogers et al. (1998). Contemporary survey data for shallow coastal waters of the UK are limited, and much of the available data for the North Sea are now from internationallycoordinated surveys. The inshore surveys along the seaboard of continental Europe have also shown a decline in both Dutch and German waters. Both the BTS and NSIBTS, which are undertaken on larger research vessels that are not able to sample shallower areas, also saw a decline in eelpout.
The primary rationale for the surveys analysed here was to provide fisheryindependent data on the distribution and relative abundance of commercial fish stocks, including indices of recruitment. The YFS and DYFS were designed to inform on recruitment of key flatfish species, such as European plaice Pleuronectes platessa and common sole Solea solea. As such, it should be recognised that the surveys were not designed to sample eelpout, and so any inter-annual changes in survey coverage may affect the preliminary results shown here. Nevertheless, some consistent patterns were also observed. For example, the YFS showed peak catch rates in The Wash in 1987–1988, with a comparable peak also apparent in that part of the YFS undertaken in the Winterton to Orford area (1987; Fig. 4), and such a peak was also observed in both the Dutch 3 m and 6 m beam trawl surveys in 1987–1988 (Fig. 6). This peak then declined with lower catch rates and frequency of occurrence in the early 1990s.
Similarly, both the German and Dutch 3 m beam trawl surveys saw a small peak in eelpout in 1999, and also the proportion of hauls containing eelpout also increased in 2011, following a period of below average catches in the 2007/2008 period (Fig.6).
Overall, the data presented here showed a decline in eelpout in The Wash, as observed in the YFS, a decline in the DYFS, and apparent absence from both the NSIBTS and BTS in recent years. It should be highlighted that the latter surveys do not sample the main inshore areas that would be inhabited by eelpout, but may indicate that the population no longer extends as far from shore. Whilst accurate data on the current population trends of eelpout for UK waters are lacking, available information is suggestive that the populations around the North Sea may have declined, and such a decline would be in accordance with a range of other studies.
For example, Turnpenny et al. (1988) reported small numbers of eelpout from the intake screens of Sizewell ‘A’ power station (Suffolk) during October and November, with just three specimens recorded during 41 sampling events across the year 1981/1982. Henderson (2017) also noted that eelpout was observed occasionally on the intake screens at Sizewell, based on samples collected from the intake screens (2009–2012). Whilst the numbers were not given in the latter study, it was flagged that the numbers taken were in contrast to the abundance reported by Collings (1933). Indeed, eelpout were reportedly caught in large numbers in the River Blyth (Collings, 1933), a site ca. 12 km away from Sizewell, although occasional surveys (2022–2023) of the intertidal and shallow sublittoral zones at Walberswick, adjacent to the River Blyth, have not reported eelpout to date (Ellis, 2023).
Further north, eelpout has been reported as an occasional catch on the intake screens at Longannet Power Station (Forth Estuary, Scotland), where 31 specimens were caught over the period 1999–2000, and it occurred in 15.7% of samples processed (Greenwood, 2008). In contrast, Greenwood et al. (2002) reported that eelpout was the second most common fish species taken in Agassiz trawl sampling in the Forth Estuary (aggregated data for 1982–2001). The latter study, however, also observed a decline across the time-series, which correlated with increasing water temperature. Greenwood & Maitland (2009) provided further evidence of the decline in eelpout in the Forth Estuary, based on data collected from the intake screens of the power stations at Kincardine (1961–1962 and 1979) and Longannet in (1979) compared to subsequent data from Longannet (1994, 1999, 2000).
A decline in eelpout has also been reported in the Wadden Sea (Netherlands), with peak catches during the 1960s, followed by a sharp decline, a period of low abundance and, in more recent years, either low abundance in, or absence from, the survey (Mendez, 2014; van der Veer et al., 2015). The decline of eelpout in the Wadden Sea was also evident in another dataset from inshore beam trawl surveys (Tulp et al., 2008), although comparable data showed a slight increase in the Westerschelde.
Eelpout was noted as a common species in Belgian coastal waters by Poll (1947), although it was not reported in the Belgian DYFS, and so further studies to gauge its current status in that area could usefully be undertaken. Olsen et al. (2002), comparing data from 1969–1977 and 1998 also indicated a decline in eelpout in the
Table 2: Reported length range (LT) of eelpout in various studies (see Table 1 for additional data). Approximate values given in square brackets.
Area
North Sea
Hafrsfjord (Norway)
55’N Harpoon gun 21.0–31.8 Lajus et al. (2003)
Forth estuary (UK) 58° 02’N 2 m Agassiz trawl 8.5–28.2 Mathieson et al. (1996)
Wadden Sea (Netherlands) [54° 44’N] Trawl 14.1–27.0 Lajus et al (2003)
Wadden Sea (Netherlands)
06’N Various 6.5–31.5 Mendez (2014)
Wadden Sea (Netherlands) [53° 15’N] Unspecified [11–30 ] Essink (1985)
Western North Sea
–28.0 YFS (present study) Eastern North Sea
6–30 DYFS (Netherlands) Eastern North Sea
N 3 m
trawl 4–34 [2] DYFS (Netherlands)
Eastern North Sea 53° 40.4’–v 55° 1.3’N 3 m beam trawl 4–30 DYFS (Germany)
North Sea 54° 4.8’ –57° 40.8’N GOV trawl [3] 11–29 NS-IBTS (present study)
North Sea
Other areas
White Sea (Russia)
Holmöarna (Sweden)
Gävlebukten (Sweden)
Gulf of Finland (Finland)
Fjällbacka (Sweden)
Kvädöfjärden (Sweden)
Marsö (Sweden)
Kladdenabb (Sweden)
Torhamn (Sweden)
Gulf of Gdansk (Poland)
26.4’ –
° 35.4’N Beam trawl 15–29 BTS (present study)
66° 28’N Trap 17.4–33.7 Lajus et al (2003)
63° 43’N Fyke nets 14.0–29.1
60° 43’N Fyke nets 18.0–30.8
Vetemaa et al (2006)
Vetemaa et al. (2006)
60° 10’N Hook and line 13.5–21.7 Lajus et al. (2003)
58° 36’N Fyke nets 19.0–34.2
58° 3’N Fyke nets 15.9–32.2
57° 39’N Fyke nets 15.2–32.0
55° 59’N Fyke nets 17.0–30.4
56° 5’N Fyke nets 16.2–28.2
Vetemaa et al. (2006)
Vetemaa et al (2006)
Vetemaa et al (2006)
Vetemaa et al. (2006)
Vetemaa et al. (2006)
54° 35’N Trawl 21.6–34.8 Lajus et al. (2003)
Notes: [1] values in square brackets are approximate values; [2] Excluding one specimen reported at 1 cm, which is smaller than the length at birth. [3] chalut à Grande Ouverture Verticale, a high headline bottom trawl.
Mariager Fjord (north-eastern Denmark). It should be noted, however, that Tiews (1990) observed an increase in bycaught eelpout in a shrimp trawl fishery in German coastal waters over the period 1954 and 1988. This increase, however, may need to be viewed in context of the elevated catches of eelpout observed elsewhere in the southern North Sea in the late 1980s.
A range of factors may affect the abundance and distribution of eelpout. Tulp et al. (2008) considered various abiotic parameters (water temperature, salinity, river runoff, and concentrations of phosphate and nitrate), biotic parameters (density of piscivorous fish, numbers of cormorants and seals, and density of the shrimp Crangon) and metrics of fishing pressure (fishing effort for the beam trawl and shrimp trawl fleets). Interestingly, the decline of eelpout in the Wadden Sea showed a significant correlation with the numbers of seals (Tulp et al., 2008), although this does not indicate whether there was a causal relationship. Indeed, although eelpout has been found to be a relatively frequent prey item of seals in the Baltic Sea (ScharffOsen et al., 2019), it has been reported as being only an occasional prey species for seals in UK waters (Pierce et al., 1989; Hall et al., 1998). In terms of potential avian predators, eelpout has been shown to be an important prey species for cormorant Phalacrocorax carbo along the east coast of Sweden (Boström et al., 2012), but of minor importance elsewhere (Leopold et al., 1998), although this may also reflect spatial differences in the abundance of eelpout.
Overall, eelpout populations may be impacted by a range of factors, including increasing water temperature, habitat degradation and pollution, as well as multispecies interactions. Eelpouts are thought to form local populations, and so may be susceptible to localised depletions. Eelpout usually reach 35 cm LT, but studies on British shores have generally indicated that they are slightly smaller, typically <30 cm LT (Table 2), which might be related to spatial variations in growth and demographic parameters.
The inshore nature of eelpout means that they may be impacted less by commercial fisheries. In early accounts, eelpout was reported as being captured in a range of estuarine and inshore fisheries, such as those targeting European sprat Sprattus sprattus, European eel Anguilla anguilla, and European smelt Osmerus eperlanus (Laver, 1898; Collings, 1933). Eelpout would be expected to be discarded if caught nowadays, although, historically, it was landed for bait or food in some areas along the eastern coast of the UK (Yarrell, 1859; Murie, 1903).
The current status of eelpout in the waters of Suffolk is uncertain, and so further studies could usefully be considered to determine their current distribution, including analyses of other potential datasets and contemporary sampling of suitable habitats. In terms of field sampling, eelpout can be caught in a variety of sampling gears, including Agassiz trawl, small beam trawl, push net, hook and line, eel traps, and fyke nets (Rogers et al., 1998; Greenwood & Hill, 2003; Lajus et al., 2003; van der Veer et al., 2015). It should also be noted that there can also be seasonal differences in the distribution and behaviour of eelpout, with Greenwood & Hill (2003) finding them to be more abundant in the Forth Estuary during the summer.
Given the potential for localised declines of eelpout in some areas, the appropriateness of using eelpout as a biological indicator could usefully be considered with due caution for some regions, depending on local population status. Nevertheless, given that eelpout is known to be influenced by water temperature and water quality, surveys of former and potential habitat (including non-lethal sampling of eelpout) may provide information on this species in relation to wider ecosystem health.
Acknowledgements
Many thanks to Stuart Reeves and Gen Broad for commenting on the manuscript. This study used data held on the ICES Database on Trawl Surveys (DATRAS), and those institutes and their sea-going scientists who contribute to this database are gratefully acknowledged.
References
Andriashev, A. P. (1986). Zoarcidae. In Fishes of the North-eastern Atlantic and the Mediterranean (Whitehead, P. J. P., Bauchot, M.-L., Hureau, J.-C., Nielsen, J. and Tortonese, E., Eds.). Volume III. Paris: UNESCO; 1130–1150.
Boström, M. K., Östman, Ö., Bergenius, M. A. & Lunneryd, S. G. (2012). Cormorant diet in relation to temporal changes in fish communities. ICES Journal of Marine Science, 69: 175–183.
Collings, D. W. (1933). The fishes of Suffolk. Trans. Suffolk Nat. Soc., 2: 104–133. Ellis, J. R. (2023). Intertidal and shallow sublittoral fish at Walberswick, Suffolk. Trans. Suffolk Nat. Soc., 59: 69–79.
Essink, K. (1985). Monitoring of mercury pollution in Dutch coastal waters by means of the teleostean fish Zoarces viviparus. Netherlands Journal of Sea Research, 19: 177–182.
Gercken, J., Förlin, L. & Andersson, J. (2006). Developmental disorders in larvae of eelpout (Zoarces viviparus) from German and Swedish Baltic coastal waters. Marine Pollution Bulletin, 53: 497–507.
Götting, K. J. (1976). Fortpflanzung und Oocyten-Entwicklung bei der Aalmutter (Zoarces viviparus) (Pisces, Osteichthyses). Helgoländer Meeresuntersuchungen, 28: 71–89.
Greenwood, M. F. D. (2008). Fish mortality by impingement on the cooling-water intake screens of Britain’s largest direct-cooled power station. Marine Pollution Bulletin, 56: 723–739.
Greenwood, M. F. D. & Hill, A. S. (2003). Temporal, spatial and tidal influences on benthic and demersal fish abundance in the Forth estuary. Estuarine, Coastal and Shelf Science, 58: 211–225.
Greenwood, M. F. D. & Maitland, P. S. (2009). Long-term changes in fish-assemblage composition from cooling-water intake screens in the Forth Estuary, Scotland, UK. Marine Biodiversity Records, 2, p.e8.
Greenwood, M. F. D., Hill, A. S. & McLusky, D. S. (2002). Trends in abundance of benthic and demersal fish populations of the lower Forth Estuary, East Scotland, from 1982–2001. Journal of Fish Biology, 61: 90–104.
Hall, A. J., Watkins, J. & Hammond, P. S. (1998). Seasonal variation in the diet of harbour seals in the south-western North Sea. Marine Ecology Progress Series, 170: 269–281.
Hedman, J. E., Rüdel, H., Gercken, J., Bergek, S., Strand, J., Quack, M., Appelberg, M., Förlin, L., Tuvikene, A. & Bignert, A. (2011). Eelpout (Zoarces viviparus) in marine environmental monitoring. Marine Pollution Bulletin, 62: 2015–2029.
Heessen, H. J. L. (2015). Eelpouts (Zoarcidae). In ‘Fish atlas of the Celtic Sea, North Sea, and Baltic Sea’ (Heessen, H. J. L., Daan, N. and Ellis, J. R., Eds.). Wageningen Academic Publishers / KNNV Publishing, 358–419.
Henderson, P. A. (2017). Long-term temporal and spatial changes in the richness and relative abundance of the inshore fish community of the British North Sea Coast. Journal of Sea Research, 127: 212–226.
Lajus, D., Knust, R. & Brix, O. (2003). Fluctuating asymmetry and other parameters of morphological variation of eelpout Zoarces viviparus (Zoarcidae, Teleostei) from different parts of its distributional range. Sarsia, 88: 247–260.
Larsson, D. G. J., Hällman, H. & Förlin, L. (2000). Skewed embryonic sex ratios in a viviparous fish: a result of endocrine disruption? Marine Environmental Research, 50: 191–192.
Laver, H. (1898). The mammals, reptiles and fishes of Essex. Essex Field Club Special Memoirs, 3: 138 pp.
Leopold, M. F., van Damme, C. J. & van der Veer, H. W. (1998). Diet of cormorants and the impact of cormorant predation on juvenile flatfish in the Dutch Wadden Sea. Journal of Sea Research, 40: 93–107.
Lowe, J. (1874). Fauna and flora of Norfolk. Part IV: Fishes. Transactions of the Norfolk and Norwich Naturalists’ Society, 1(5):21–56.
Lyons, B. P., Bignell, J., Stentiford, G. D. & Feist, S. W. (2004). The viviparous blenny (Zoarces viviparus) as a bioindicator of contaminant exposure: application of biomarkers of apoptosis and DNA damage. Marine Environmental Research, 58: 757–761.
Mathieson, S., George, S. G. & McLusky, D. S. (1996). Temporal variation of total mercury concentrations and burdens in the liver of eelpout Zoarces viviparus from the Forth Estuary, Scotland: Implications for mercury biomonitoring. Marine Ecology Progress Series, 138: 41–49.
Matthiessen, P. & Law, R. J. (2002). Contaminants and their effects on estuarine and coastal organisms in the United Kingdom in the late twentieth century. Environmental Pollution, 120: 739–757.
Mendez, N. (2014). Dynamics and growth of the eelpout Zoarces viviparus in the western Dutch Wadden Sea. NIOZ, Royal Netherlands Institute for Sea Research. Murie, J. (1903). Report on the sea fisheries and fishing industries on the Thames Estuary. Kent and Essex Sea Fisheries Committee. London: Waterlow Bros. & Layton, 250 pp.
Napierska, D. & Podolska, M. (2006). Field studies of eelpout (Zoarces viviparus L.) from Polish coastal waters (southern Baltic Sea). Science of the Total Environment, 371: 144–155.
Olsen, R. B., Richardson, K. & Simonsen, V. (2002). Population differentiation of eelpout Zoarces viviparus in a Danish fjord. Marine Ecology Progress Series, 227: 97–107.
Patterson, A. H. (1910). Rough notes on the fish and fisheries of East Suffolk. Great Yarmouth: John Buckle; 55 pp.
Pierce, G. J., Diack, J. S. W. & Boyle, P. R. (1989). Digestive tract contents of seals in the Moray Firth area of Scotland. Journal of Fish Biology, 35 (Suppl. A): 341–343.
Poll, M. (1947). Faune de Belgique. Poissons Marins. Musée royal d'histoire naturelle de Belgique; 452 pp.
Pörtner, H. O., Berdal, B., Blust, R., Brix, O., Colosimo, A., De Wachter, B., Giuliani, A., Johansen, T., Fischer, T., Knust, R. & Lannig, G. (2001). Climate induced temperature effects on growth performance, fecundity and recruitment in marine fish: developing a hypothesis for cause and effect relationships in Atlantic cod (Gadus morhua) and common eelpout (Zoarces viviparus). Continental Shelf Research, 21: 1975–1997.
Rogers, S. I., Millner, R. S. & Mead, T. A. (1998). The distribution and abundance of young fish on the east and south coast of England (1981 to 1997). Science Series Technical Report (CEFAS), 108: 130 pp.
Scharff-Olsen, C. H., Galatius, A., Teilmann, J., Dietz, R., Andersen, S. M., Jarnit, S., Kroner, A. M., Botnen, A. B., Lundström, K., Møller, P. R. & Olsen, M. T. (2019). Diet of seals in the Baltic Sea region: a synthesis of published and new data from 1968 to 2013. ICES Journal of Marine Science, 76: 284–297.
Schmidt, J. (1917). Zoarces viviparus L. and local races of the same. Comptes Rendus des travaux de Laboratoire de Carlsberg, 13: 277–397.
Schmidt, J. (1918). Racial studies in fishes: I. Statistical investigations with Zoarces viviparus L. Journal of Genetics, 7: 105–118.
Simonsen, V. & Strand, J. (2010). Genetic variation of Zoarces viviparus: six populations revisited after about 35 years. Hereditas, 147: 250–255.
Stentiford, G. D., Longshaw, M., Lyons, B. P., Jones, G., Green, M. & Feist, S. W. (2003). Histopathological biomarkers in estuarine fish species for the assessment of biological effects of contaminants. Marine Environmental Research, 55: 137–159.
Strand, J., Andersen, L., Dahllöf, I. & Korsgaard, B. (2004). Impaired larval development in broods of eelpout (Zoarces viviparus) in Danish coastal waters. Fish Physiology and Biochemistry, 30: 37–46.
Stuhlmann, F. (1887). Zur Kenntnis des Ovariums der Aalmutter (Zoarces viviparus Cuv.). Abhandlungen aus dem Gebiete der Naturwissenschaften (Hamburg), 10: 1–48.
Svedäng, H., Ojaveer, H. & Urtans, E. (1997). Interpretation of the otolith structures in viviparous blenny Zoarces viviparus. Journal of Applied Ichthyology, 13: 137–142.
Tiews, K. (1990). 35-Jahres-Trend (1954–88) der Haufigkeit von 25 Fisch-und. Krebstierbestanden an der deutschen Nord-seekuste. Archiv für Fischereiwissenschaft, 40: 39–48.
Tulp, I., Bolle, L. J. & Rijnsdorp, A. D. (2008). Signals from the shallows: in search of common patterns in long-term trends in Dutch estuarine and coastal fish. Journal of Sea Research, 60: 54–73.
Turnpenny, A. W. H., Utting, N. J., Millner, R. S. & Riley, J. D. (1988). The effect of fish impingement at Sizewell 'A' power station, Suffolk, on North Sea fish stocks. (No. CEGB-). Central Electricity Research Laboratories Report No. TPRD/L 3270/R88; iii + 27 pp. + Figures and Tables.
van der Veer, H. W., Dapper, R., Henderson, P. A., Jung, A. S., Philippart, C. J., Witte, J. I. & Zuur, A. F. (2015). Changes over 50 years in fish fauna of a temperate coastal sea: Degradation of trophic structure and nursery function. Estuarine, Coastal and Shelf Science, 155: 156–166.
Vetemaa, M., Neuman, E., Thoresson, G. & Pihlak, M. (2006). Trade-off between number and intraovarian growth rate of offspring in Zoarces viviparus. Annales
Zoologici Fennici, 43: 303–309.
Voigt, H. (2007). Heavy metal (Hg, Cd, Zn) concentrations and condition of eelpout (Zoarces viviparus L.), around Baltic Sea. Polish Journal of Environmental Studies, 16: 909–917.
Wheeler, A. (1979). The tidal Thames: the history of a river and its fishes. London: Routledge & Kegan Paul Books, 228 pp.
Yarrell, W. (1859). A history of British fishes. Third edition. Two volumes. London: John Van Voorst, 675 + 670 pp.
Zakhartsev, M. V., De Wachter, B., Sartoris, F. J., Pörtner, H. O. & Blust, R. (2003). Thermal physiology of the common eelpout (Zoarces viviparus). Journal of Comparative Physiology B, 173: 365–378.
J.R. Ellis
CEFAS, Pakefield Road, Lowestoft, Suffolk, NR33 0HT