Speak Week March 2026 Results


You told us about…
➢ Your SUBU
➢ Your personal growth
➢ Your campus experience



You told us about…
➢ Your SUBU
➢ Your personal growth
➢ Your campus experience
• Your SUBU
• Awareness of SUBU and how well our brand is recognised
• How relevant SUBU is and our impact on the student experience
• Your Personal Growth
• Personal fulfilment
• Personal development
• Your Campus Experience
• Campus engagement
• Student experience

Speak Week March 2026 received 1,085 responses. That’s an increase of 42% from March 2025!
This represents ~8% of BU’s total student population!*
and study
Speak Week respondents by academic year Autumn Term Spring Term

When compared with BU demographics*, Speak Week responses show:
Overrepresentation of:
▪ Media, Science and Technology students
▪ Talbot-based students
▪ Level 4 students
Underrepresentation of:
▪ Health, Environment and Medical Sciences students
▪ Lansdowne-based students
▪ Students who were 18yrs old



Brand recognition and awareness
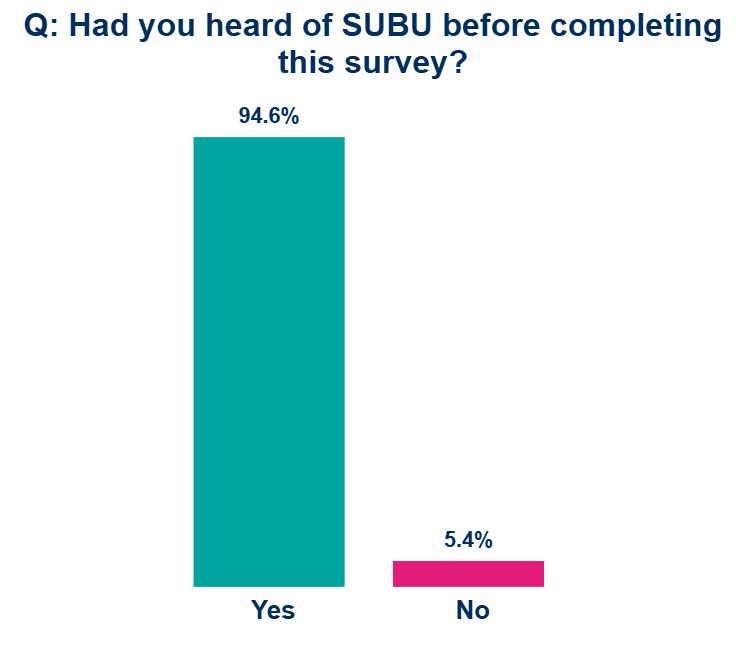
Are students aware of SUBU?
94.6% of respondents had heard of SUBU prior to completing the Speak Week survey.
There was no significant variation in response across any demographic groups.
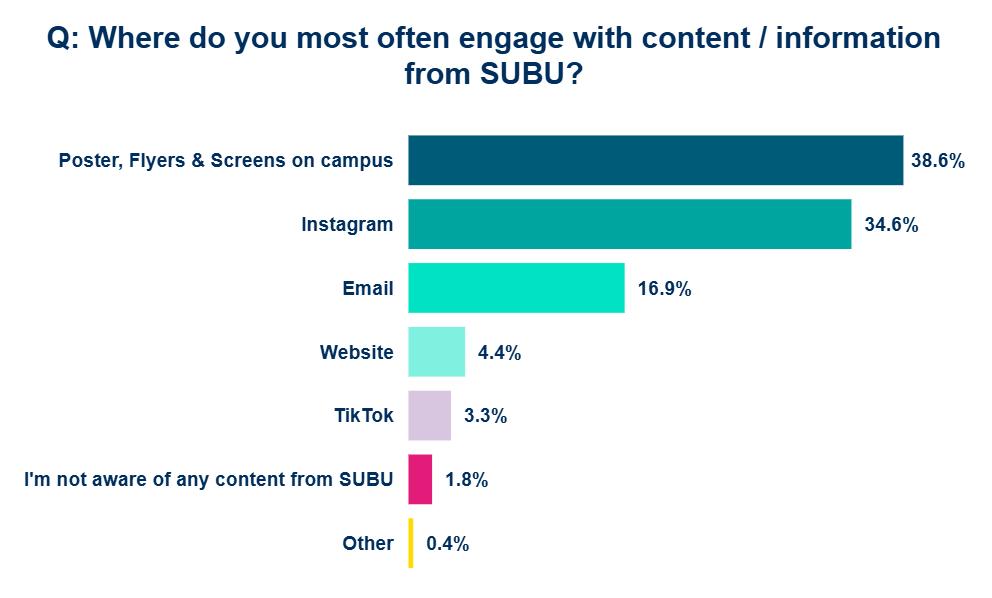
The most common ways respondents reported engaging with content / media from SUBU were through Physical media on campus (38.6%) and Instagram (34.6%).
Overseas, Level 8 and Lansdowne based students were more likely to cite the SUBU website than other groups (z>2)
Respondents who selected ‘Other’ predominantly cited WhatsApp as their primary method of engaging with SUBU.
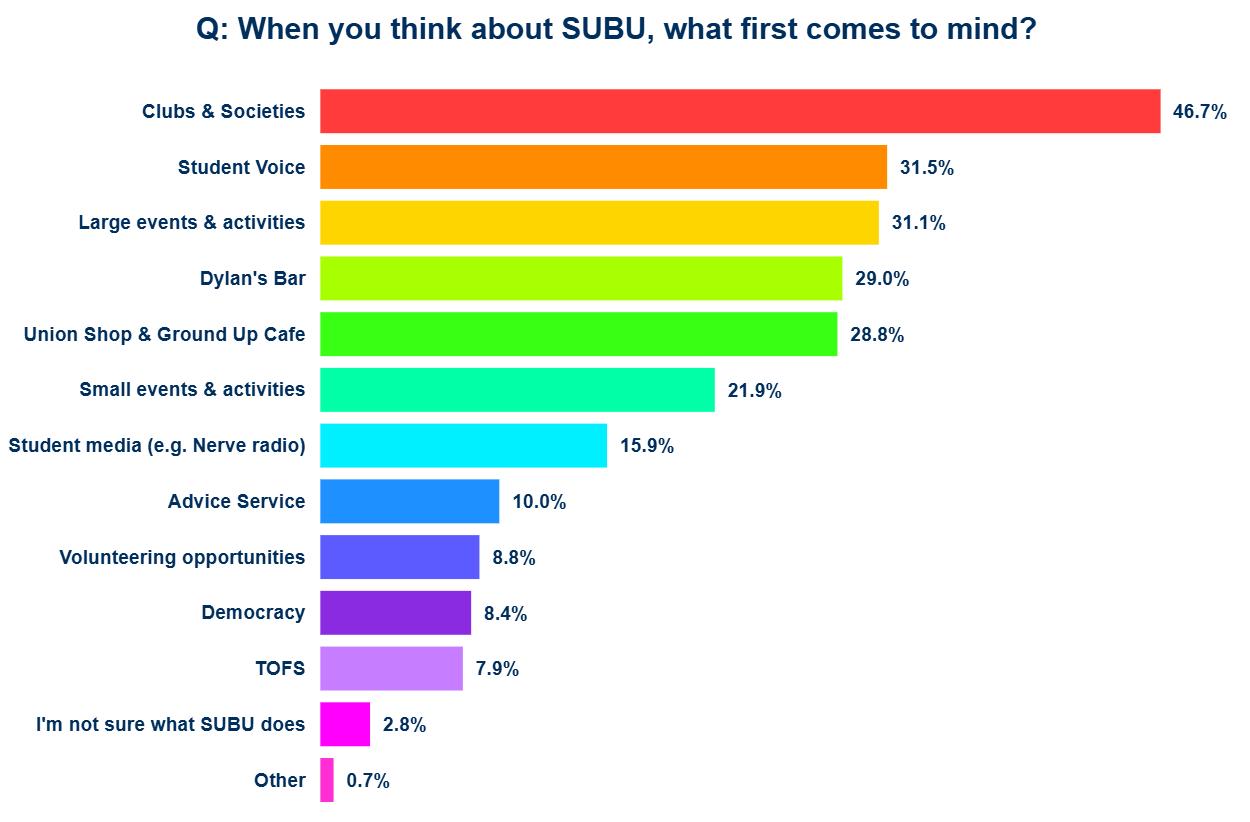
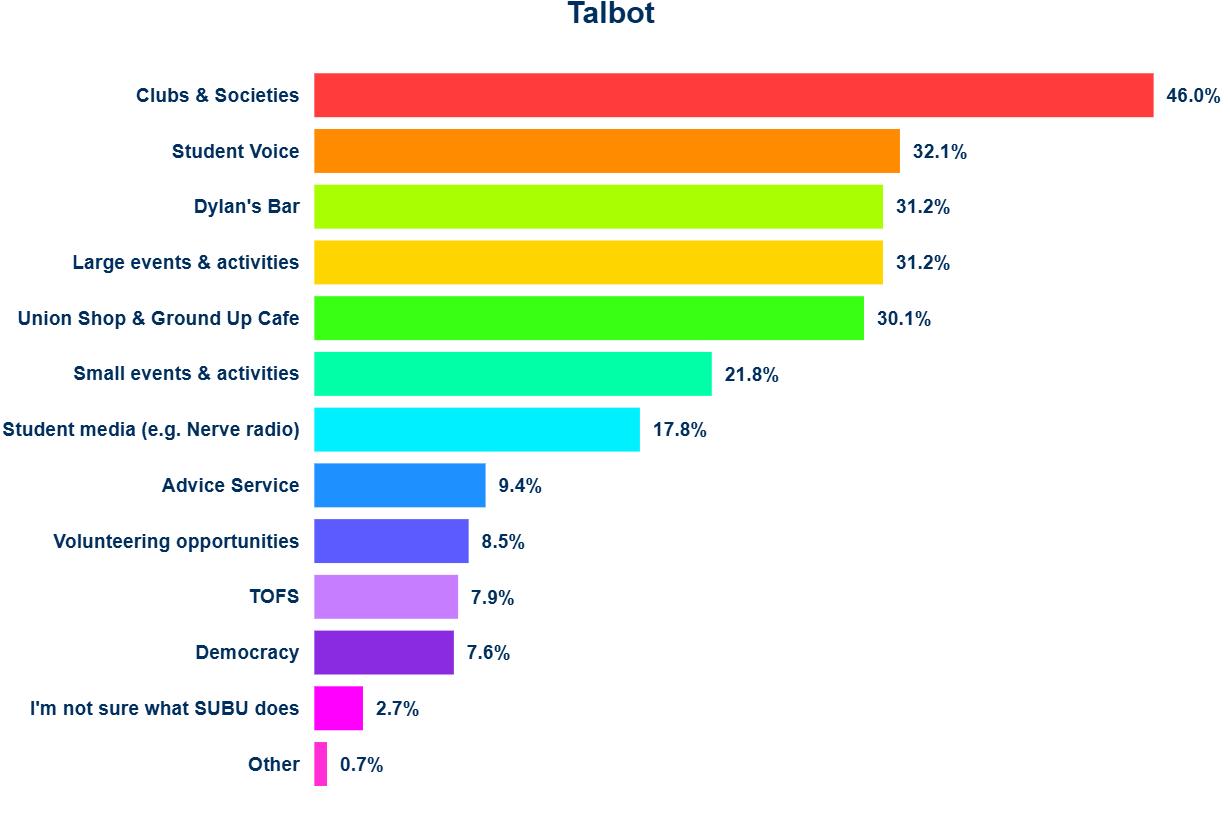
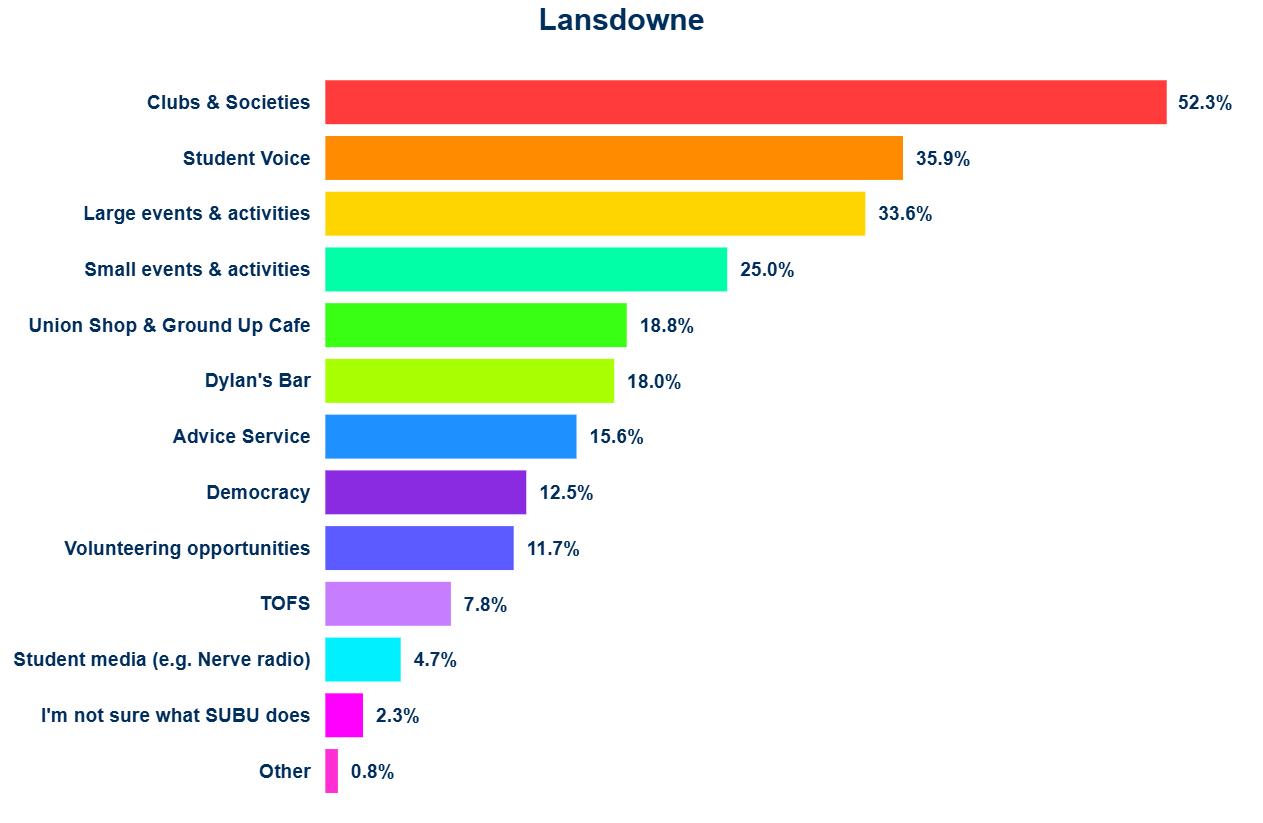
Respondents were asked to select the 3 services that first come to mind when thinking of SUBU.
The most popular answers were Clubs & Societies (selected by 48.7% of students), Student Voice (31.5%) and Large events and activities such as summer ball and freshers fair (31.1%).
‘Other’ answers included SUBU spaces such as the Student Centre and Lansdowne room, and communications such as social media and emails.
Response varied significantly between campuses (p>0.05)…
Lansdowne based students were less likely than Talbot students to associate SUBU with Student Media (-13.1%, z =- 3.1)
Dylans bar (-13.2%, z = -2.3) and Union Shop & Ground up Café (-11.3%, z = -2.0) and more likely to associate SUBU with Advice service (+6.2%, z = 2.1).
What do students think of SUBU?
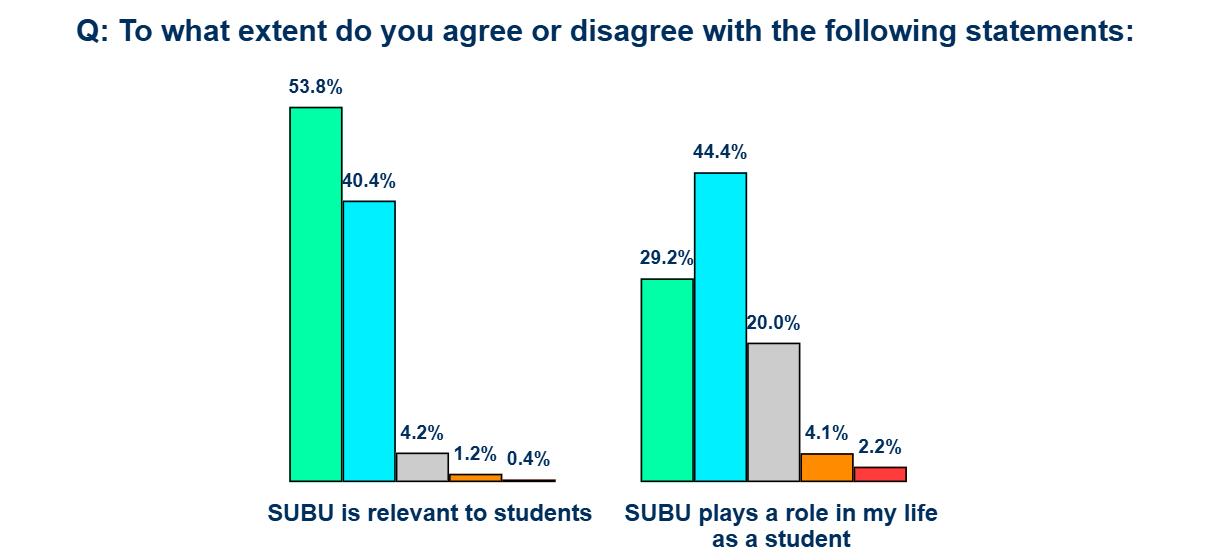
94.2% of respondents agree or strongly agree that SUBU is relevant to students.
• Business and Law students were most likely to agree (96.5%).
• Health, Environment and Medical Sciences students were least likely to agree (91.1%)
73.6% agree or strongly agree that SUBU plays a role in their life as a student.
• Overseas students were significantly more likely to Agree or Strongly agree than UK / Home based students(82.5%, 72.4%) (p<0.05)
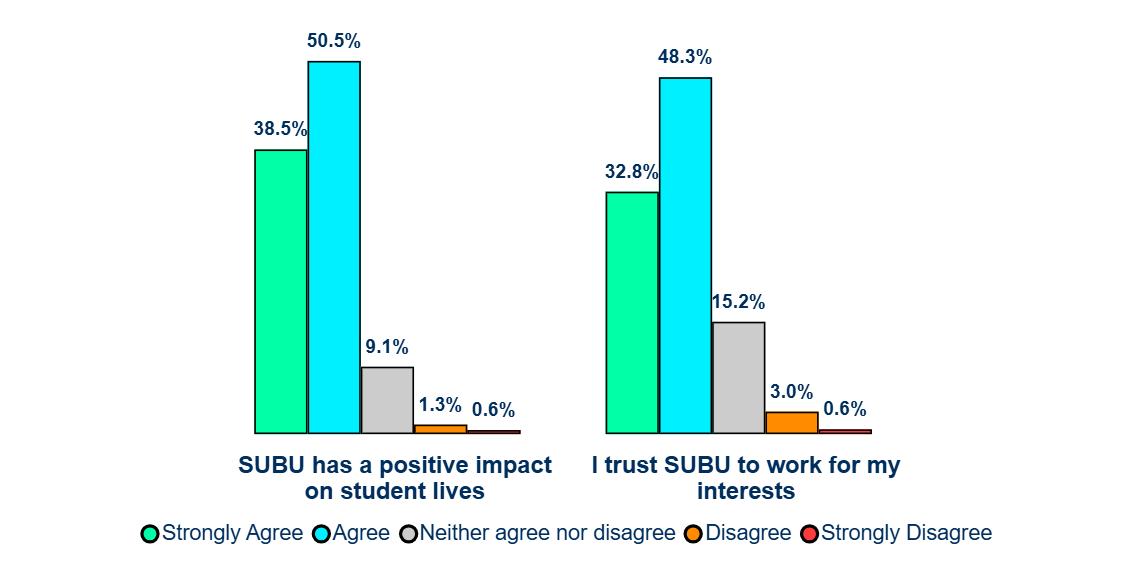
89.0% agree or strongly agree that SUBU has a positive impact on student lives.
• Placement year and PGR Level 8 students were significantly less likely to Agree or StronglyAgree than all other Levels of study (50.0%, 68.8%) (p>0.05)
81.1% Trust SUBU to work for their interests.

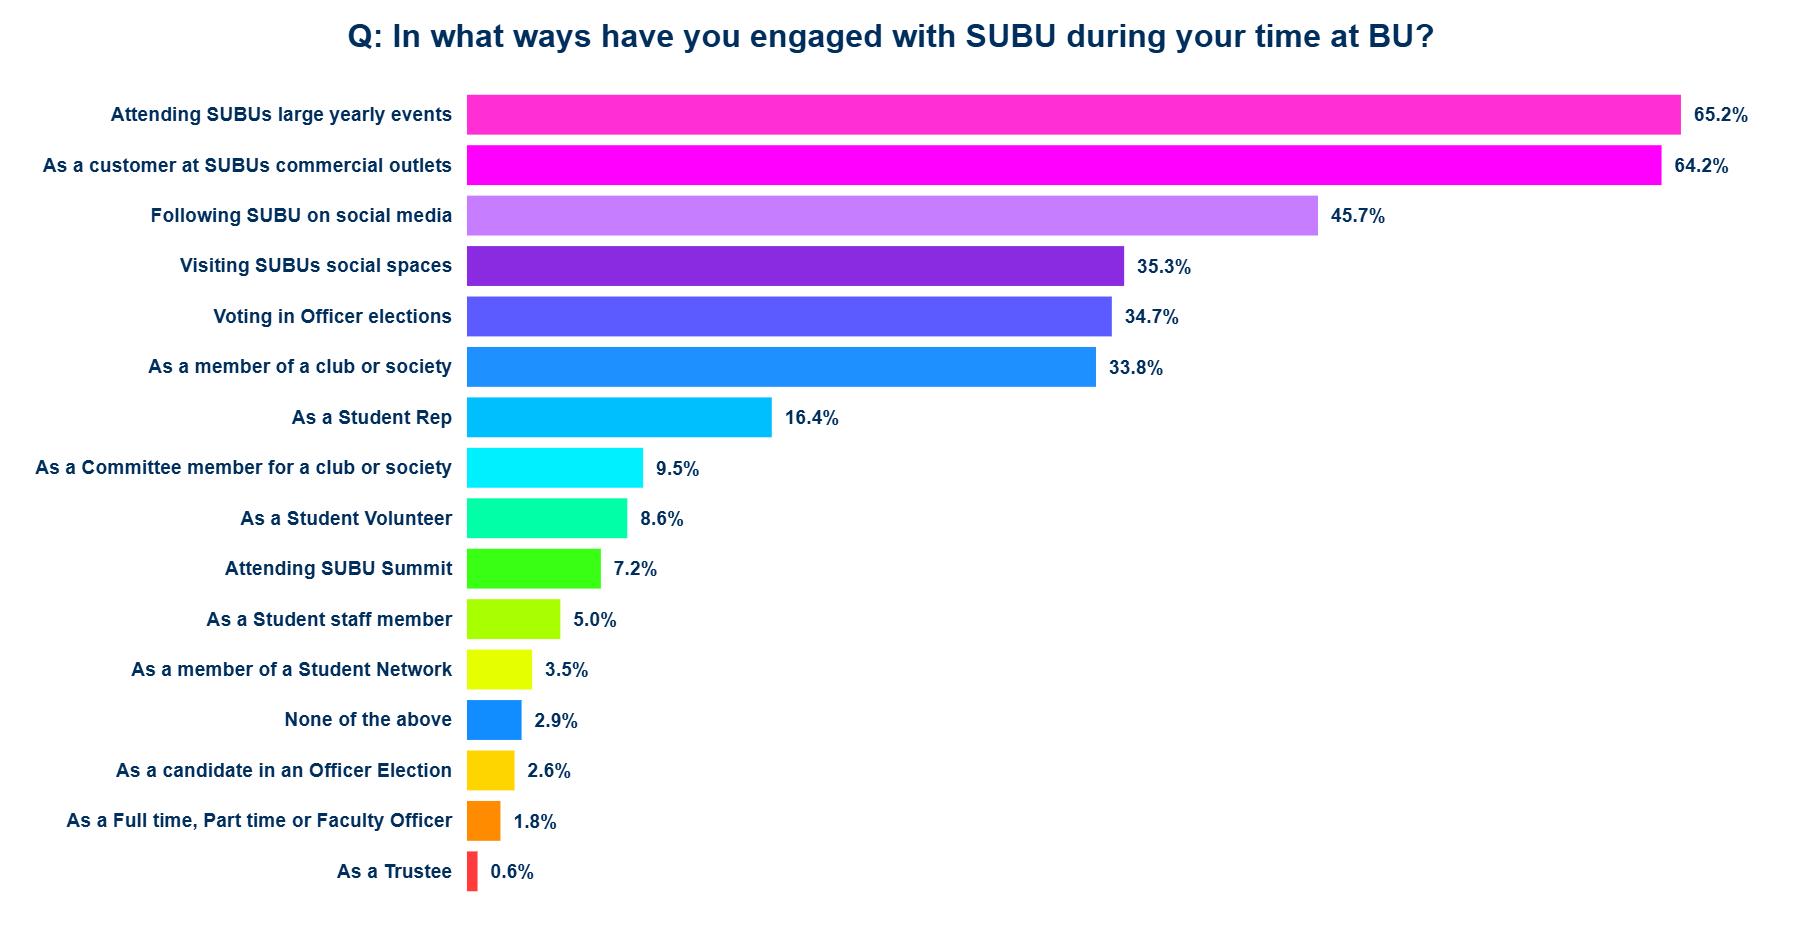
Respondents were asked to select all the ways in which they had interacted with SUBU during their time at BU from a provided list.
The most selected answers were Attending large yearly events such as Summer ball and Freshers Fair (65.2% of respondents), As a customer SUBU commercial outlets (Dylans, Ground Up Café, TOFS and Union Shop) (64.2%), and Following SUBU on social media (45.7%).
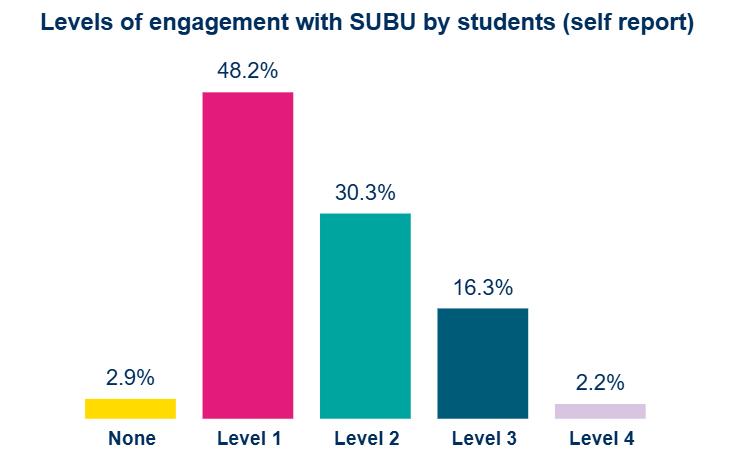
Types of engagement with SUBU were categorised into Engagement Levels, and respondents were categorised based on their highest level of engagement.
e.g. a student who only followed SUBU on social media would be Level 1, a student who follows SUBU on social media and attended a SUBU summit would be Level 3.
Mean engagement levels did not vary significantly across any demographic groups (p>0.05)
Level 4
• Full time, Part time or Faculty Officer
• Trustee
Level 3
• Club/Society committee member
• Student staff
• Been a candidate in an officer election
• Attended a SUBU summit
Level 2
• Club/Society member
• Student Rep
• Student Volunteer
• Member of a Student Network
Level 1
• Attended SUBUs large yearly events
• Customer at SUBU commercial outlets
• Follows SUBU on social media
• Visited SUBU social spaces
• Voted in Officer elections
Do students feel fulfilled at University?
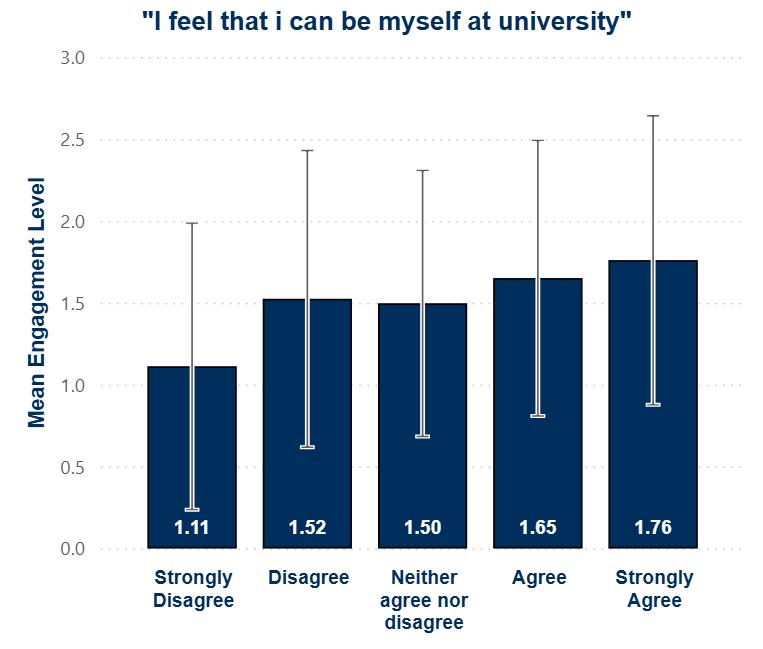
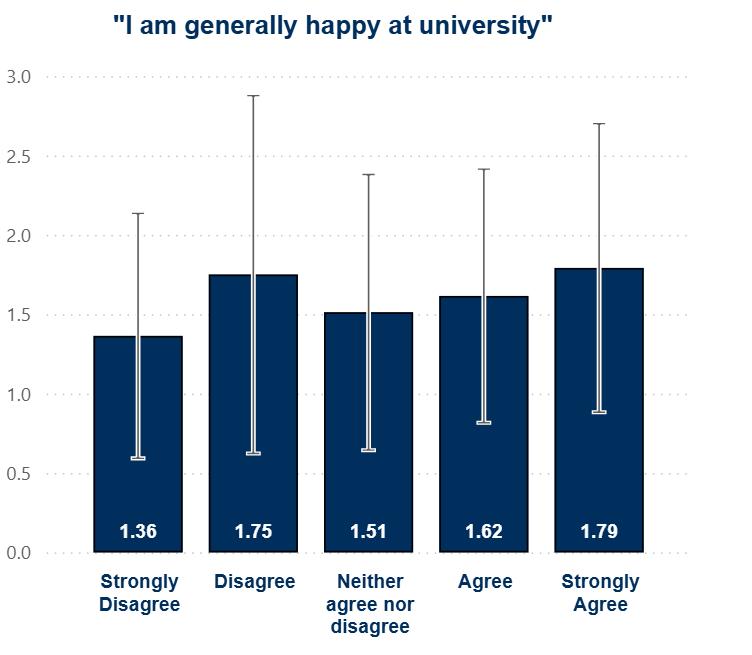
86% of respondents feel that they can be themselves at university. 85% generally feel happy at university.
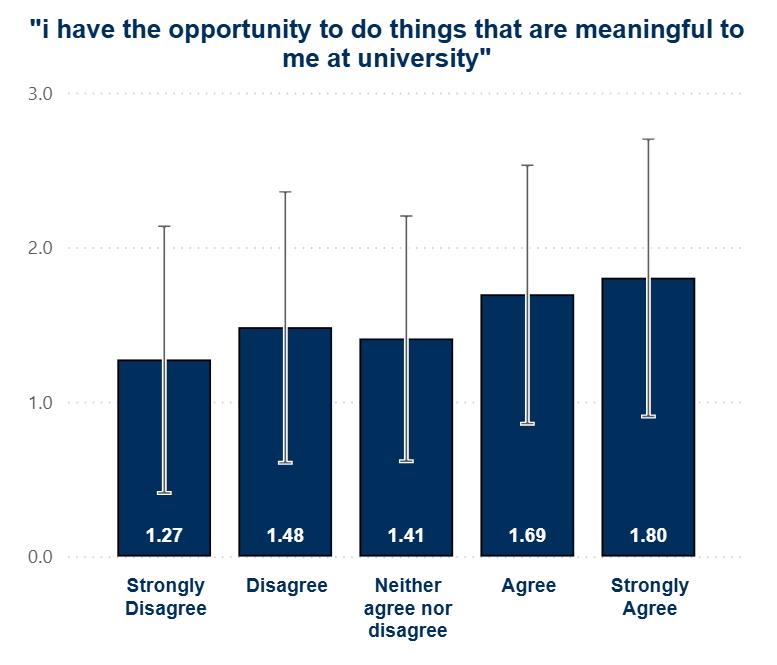
78.3% feel that they get to do things that are meaningful to them at university.
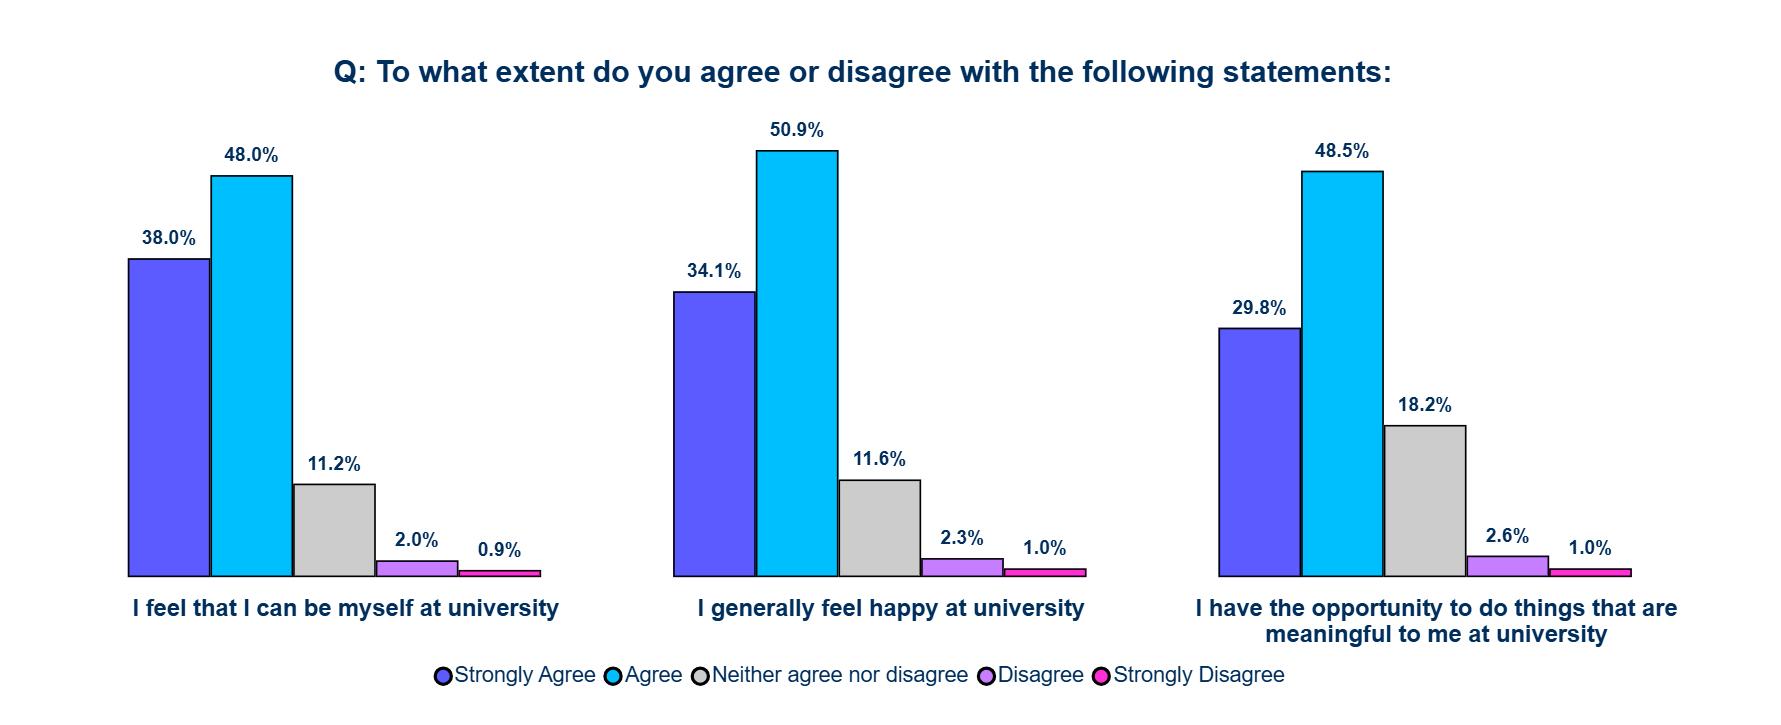
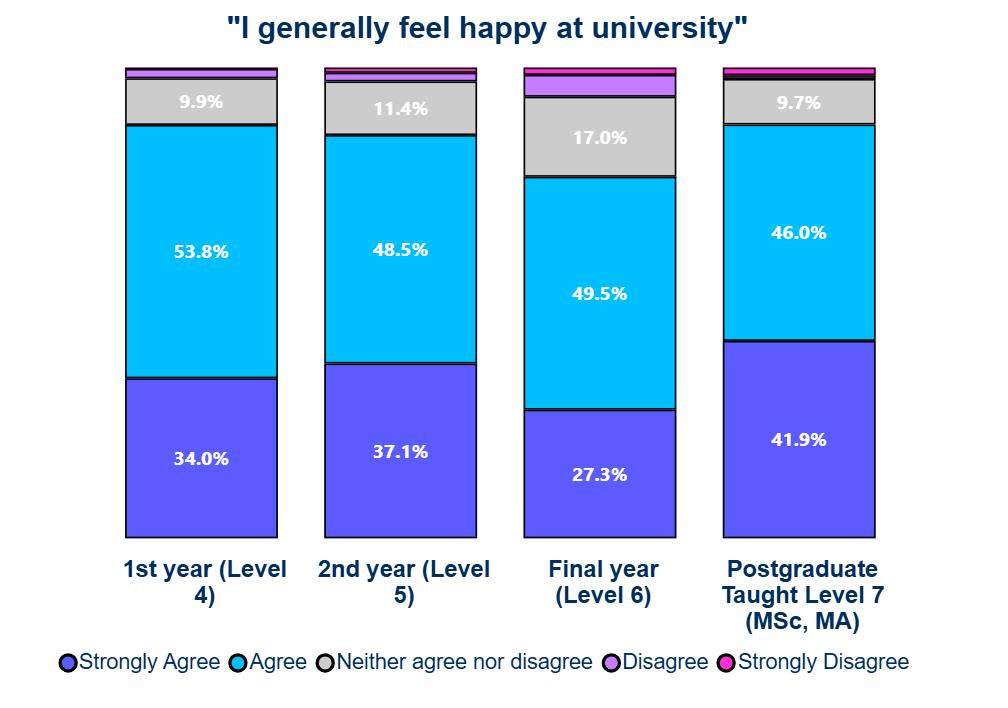
Responses varied significantly across Study level (p<0.05)…
…with Level 6 students less likely to Agree or Strongly agree than Level 4, 5 and PGT level 7 students (76.3%, 87.8%, 85.6%, 87.5%).
For all 3 statements, level of agreement (strongly disagree = 1 and strongly agree = 5) showed weak but significant correlation with engagement levels (ρ<0.2) (p<0.05).
Do students think SUBU is beneficial to their personal development?
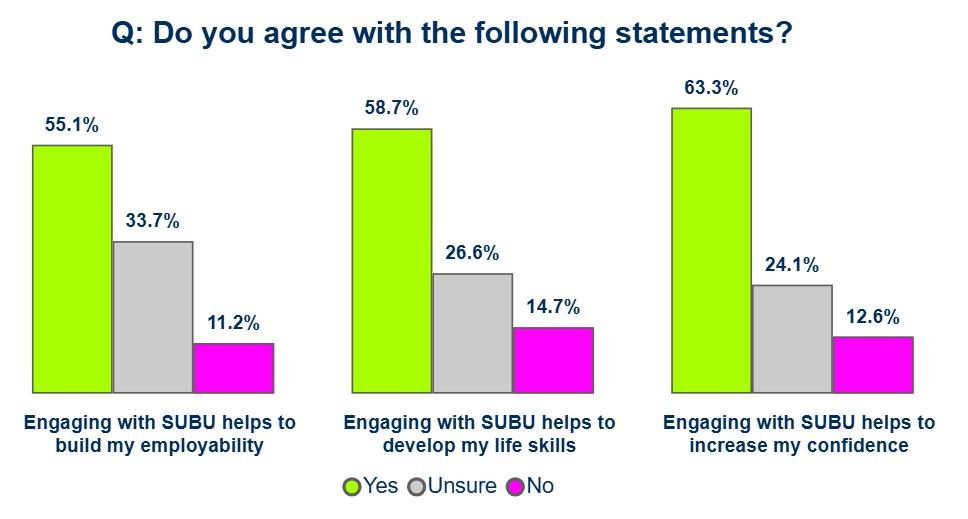
55.1% of respondents say engaging with SUBU helps to build their employability.
• Response varied by fee status (p<0.05), with Overseas students less likely to answer “no” (5.6%) thank Home / UK students (12.0%) (z=2.0).
58.7% of respondents say that engaging with SUBU helps to develop their life skills.
• Response varied by faculty (p<0.05) with Health, Environment and Medical Sciences students were significantly more likely to answer ‘unsure’ than Media, Science and Technology or Business and Law students (33.8%, 24.1%, 23.1%).
63.3% of respondents say that engaging with SUBU helps to increase their confidence.


engagement
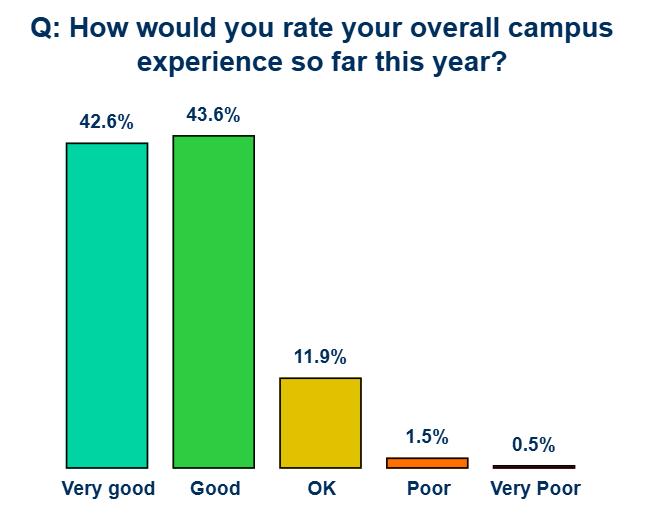
How do students rate their campus experience?
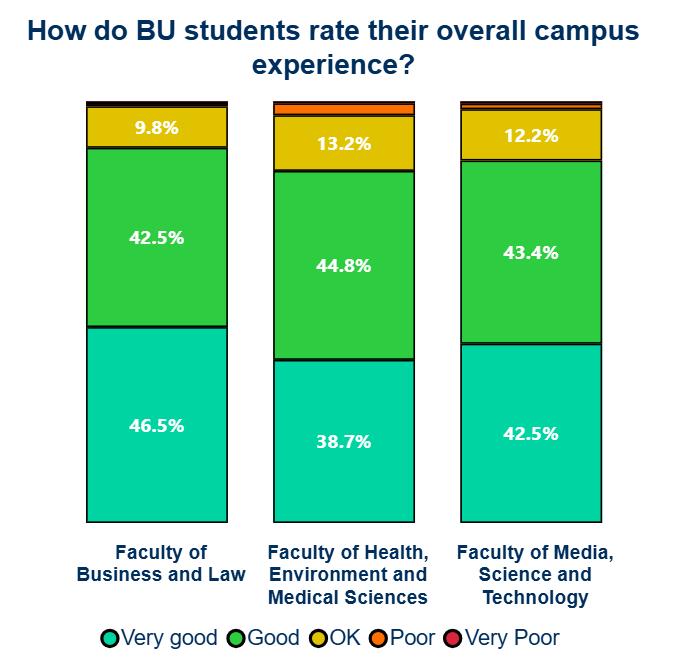
86.2% of respondents rate their campus experience as Good or Very good.
Response varied significantly across faculties (p<0.05), with Business and Law students more likely to Agree or Strongly agree than Health, Environment and Medical Sciences and Media, Science and Technology students (89.0%, 83.5%, 85.9%).
Campus engagement
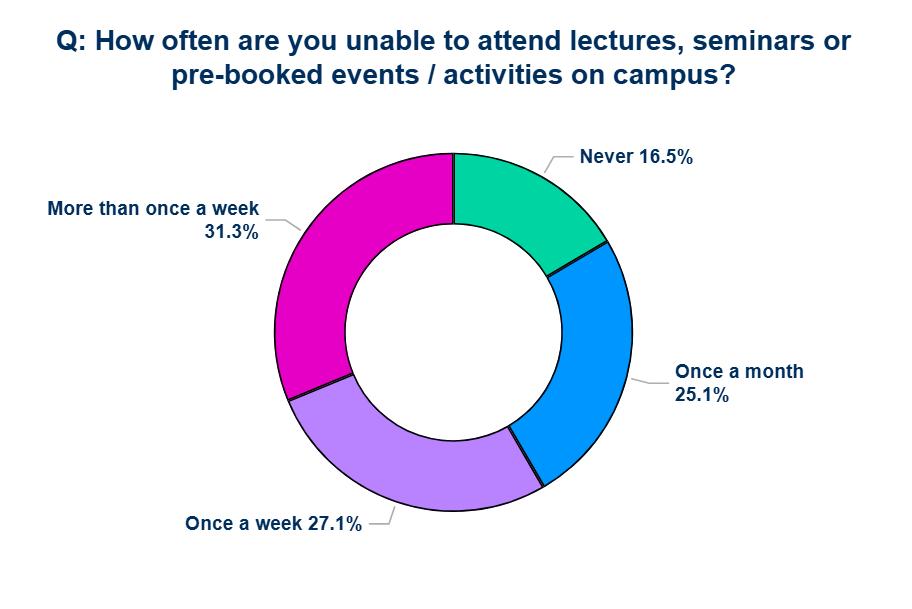
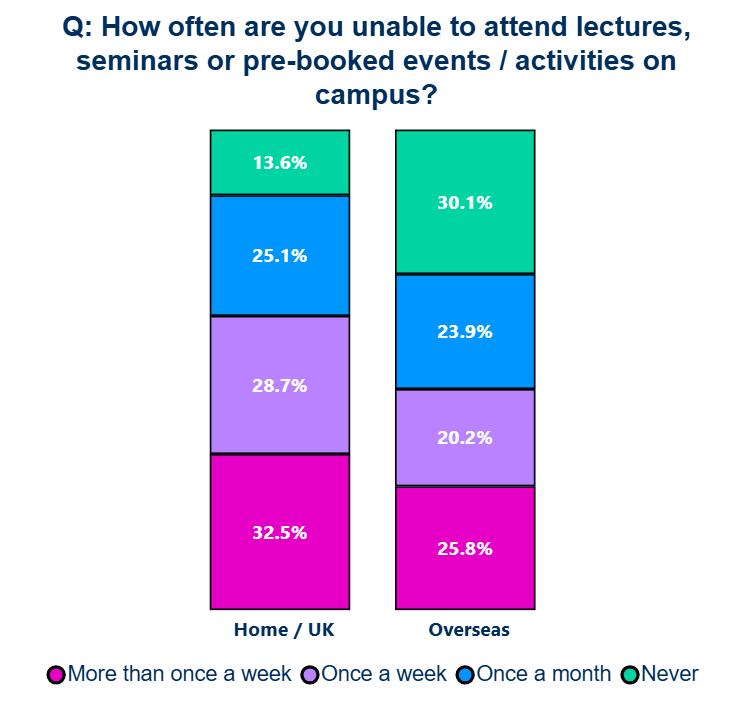
83.5% of respondents say they are unable to come to campus at least once a month.
58.4% of respondents say they are unable to come to campus at least once a week.
engagement
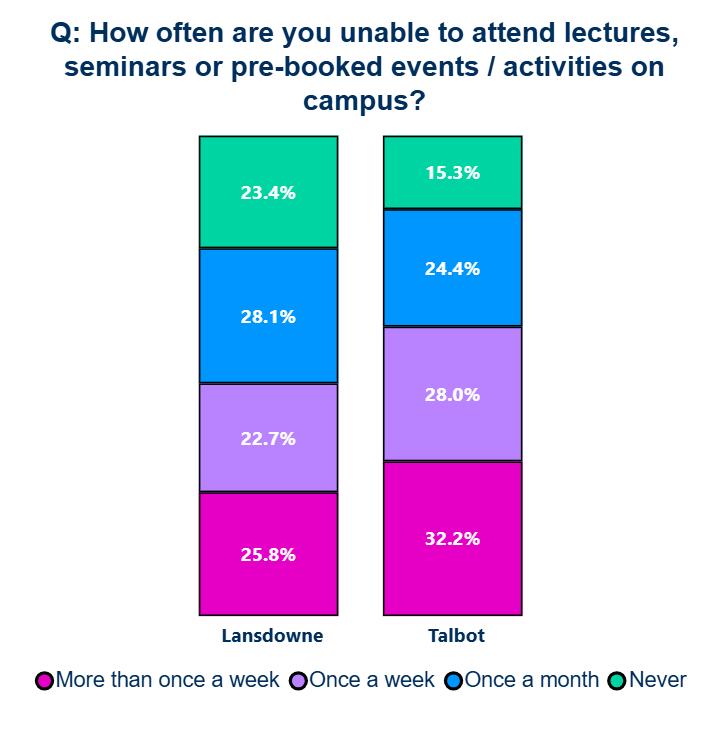
Response also varied significantly by age range (p<0.05)…
…With Talbot and Home / UK students more frequently unable to come to campus (62.2%, 60.5% at least once a week).
engagement
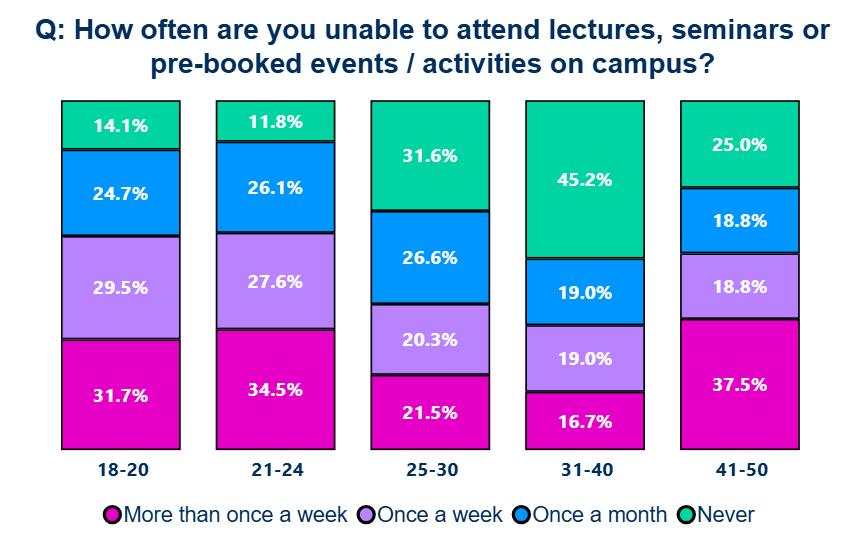
Response also varied significantly by Age range (p<0.05)…
…With the 18-20 yrs and 21-24 yrs respondents most frequently unable to come to campus (61.7%, 62.1% at least once a week).
Campus engagement
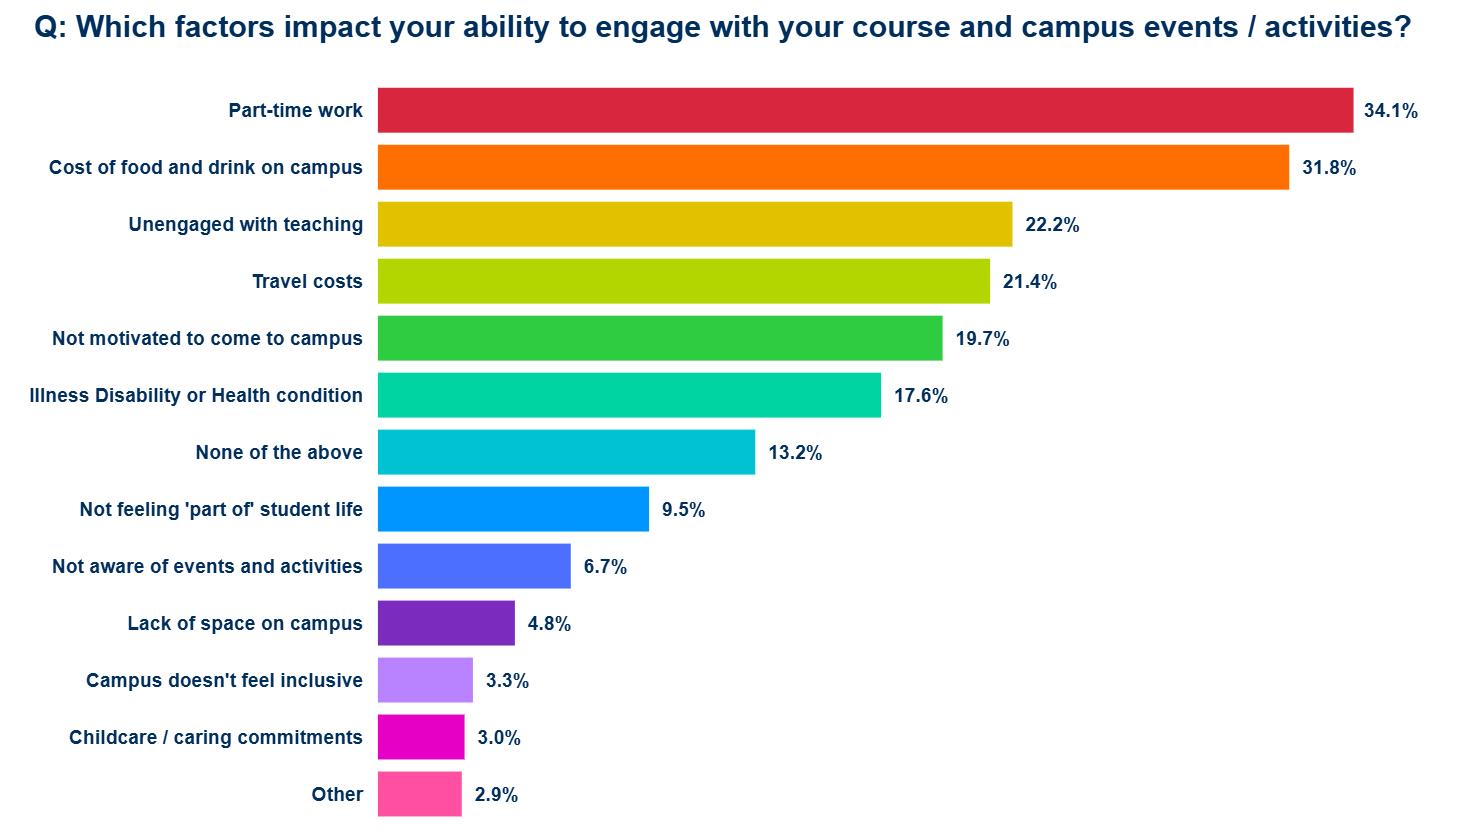
The most common reasons students cited preventing them from engaging on campus were Part-time work (34.1% of respondents) and Cost of food and drink on campus (31.8%).
‘Other’ responses included Schedule conflicts between academics and clubs/society activities, Access to/cost of parking, Commuting distance, Full time work commitments, and unsuitable bus schedules.
Campus engagement
Responses varied significantly across Study levels (p<0.05)…
PGT level 7 students were more likely to cite Not feeling part of student life (z = 2.7) and Part time work commitments (z = 2.0)
PGR Level 8 students were more likely to cite Caring / family commitments (z = 3.7) and travel costs (z = 2).
Level 4 Students were least likely to cite Part-time work commitments (z = -2.6)
Campus engagement
Responses also varied significantly across Age groups and Student origin (p<0.05)…
The 31-40 and 41-50 age groups were most likely to cite Caring / family commitments (z = 6.6, 6.8)
The 41-50 age group were most likely to cite Not feeling part of student life yet (z = 2.8)
Overseas students were less likely than Home / UK students to cite Lack of motivation (z = -2.5) or Illness / disability / Health conditions (z = -2.4)
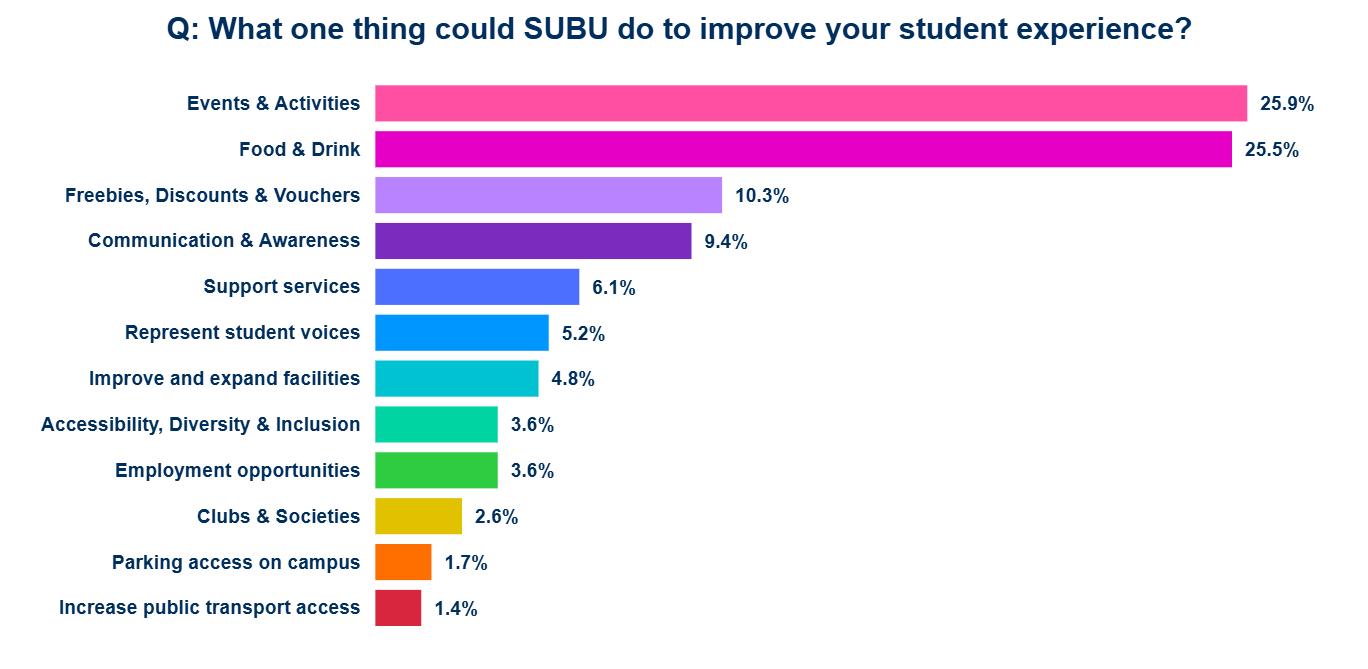
Increase in volume / frequency of events and activities. Community building and events, with opportunities to make friends and meet peers. Requests for specific events (e.g. networking events, food fairs, alcohol-free events).
Discounted, cheaper or free food & drink. Greater variety and inclusivity of food options on campus (e.g. Vegan, allergen friendly).
Greater volume / visibility of advertising for events, services and opportunities within SUBU. Reciprocal communication to show that feedback is being heard. Initiatives to bring awareness to SUBU prior to students start dates(e.g. welcome packs, emails).
Represent the best interests of students. Both though raising student issues to BU and internal goals & culture.
Create more social & study spaces on campus, with a variety of atmospheres (e.g. quite & focused, cosy & relaxed). Better quality, comfortable furniture.
Offer more part time working opportunities to students within SUBU.