

Annual review of St Patrick’s Mental Health Services’ Outcomes
2.2.12
4.2.3
4.2.7.3
4.3
4.3.1
4.5.2
4.8
4.10.2
5.3.2
5.4.1
5.4.2
5.4.2.1
5.4.3
5.5
5.5.1
5.6.2
5.6.3
5.6.4
5.6.5
5.6.5.1
5.7.3
5.7.4
5.7.5
5.7.6
This report presents outcomes relating to clinical care, clinical governance processes, clinical programmes, and service user experiences within St Patrick’s Mental Health Services (SPMHS). It is the fifteenth year that an outcomes report has been produced by SPMHS, and this report is central to the organisation’s promotion of excellence in mental healthcare. By measuring and publishing outcomes of the services we provide, we continually strive to understand what we do well and what we need to continue to improve. Wherever possible validated tools are utilised throughout this report and the choice of clinical outcome measures used is consistently reviewed to ensure we are attaining the best possible standards of service delivery. The completion and publication of this report demonstrate the commitment of all SPMHS staff to continuously measure and improve our services.
Leading healthcare providers around the world capture outcome measures related to care and treatment and make the results publicly available to enable service users, referrers, and commissioners to make informed choices about what services they choose. Transparency informs staff of the outcomes of services they provide and advances a culture of accountability for the services being delivered. It prompts debate about what care and treatment should be provided and crucially, how best to measure their efficacy. Sharing treatment outcome results is also consistent with the standards of the Mental Health Commission in Ireland (Mental Health Commission, 2023).
Since 2020, some of SPMHS services have been available through remote participation via audio-visual technology. Remote delivery of care is offered across a range of SPMHS services, based on a service user’s assessment of needs. Technology-enabled care has not replaced inpatient admission, or other in-person care delivery where needed. For this report the term ‘in-person’ admission is used when referring to our inpatient services where the service user is physically present in the hospital. This is to distinguish it from our Homecare service, which offers
all the elements of inpatient services, but provided remotely in the service users’ own home. This involves the highest levels of one-to-one mental health support, delivered remotely through daily or more frequent contact over videocall and other technological channels.
The 2025 report is divided into seven sections. Section one provides an introduction and summary of the report’s contents.
Section two outlines information regarding how SPMHS services are structured and how community clinics, day programme, homecare and inpatient services were accessed in 2025. SPMHS provides community care through its Dean Clinic community mental health clinics and day programme services through its Wellness and Recovery Centre (WRC). It provides in-person inpatient care through its three approved centres: St Patrick’s University Hospital (SPUH), St Patrick’s Lucan (SPL) and Willow Grove Adolescent Unit (WGAU).
Section three summarises the measures and outcomes of the organisation’s clinical governance processes. Section four provides an analysis of clinical outcomes for a range of clinical programmes and services. This information provides practice-based evidence of the efficacy of interventions and programmes delivered to service users during 2025 reflecting the use and measurement of evidence-based mental health practice across SPMHS.
SPMHS considers service user participation and consultation to be an essential and integral aspect of clinical service development. Section five summarises the outcomes from several service user experience surveys which assist the organisation in continually improving services so that more people have a positive experience of care, treatment and support at SPMHS. In addition, these service user evaluations provide a method of involving and empowering service users to improve mental health service standards.
Section six summarises the report’s conclusions regarding the process and findings of outcome measurement within the organisation.
Section seven provides a reference list.
SPMHS is the largest independent, not-for-profit mental health service provider in Ireland. Our services are accessed in a number of ways, including community care accessed through our Dean Clinic network, day programme care accessed through our Wellness and Recovery Centre, our inpatient care accessed through three approved centres and our Homecare service accessed remotely in the service users’ own home. In addition, a Prompt Assessment of Needs (PAON) service is provided through the Referral and Assessment service (R&A) improving access for service users. The PAON service is delivered through technology e.g., telephone/audio visual technology, which ensures that the assessment is delivered at a time that suits the service user in their own home, greatly increasing accessibility. This subsection provides information about how services were accessed through these services in 2025.
People may be referred to SPMHS for a Dean Clinic assessment. Referrals received for Dean Clinic assessment are transferred into SPMHS’s Referral and Assessment service (R&A) and, where appropriate, a person who has been referred will be provided with an assessment by an experienced mental health nurse. This allows for more prompt and efficient mental health assessments and onward referral to the most appropriate service. Service users can access this assessment from their own home, without the need to travel to a clinic. A range of communications technologies including telephone and audiovisual technologies are used to provide the assessment. The choice of communication with the R&A is based on the preference of the service user.
The table 2.1 provides the number and percentages of adult PAON assessments completed and the outcome of each PAON in 2024 and 2025. These results identify the immediate outcome of the PAON assessment.
Table 2.1 Outcomes of PAON Assessments 2024-2025
*A discharge occurred when the service user did not receive further services from SPMHS because the service user declined an offer of service or SPMHS did not have appropriate services to offer the service user at that time.
The SPMHS strategy, “The Future in Mind” (2023 – 2027) reinforces the organisation’s commitment to further refine and improve our community-based mental health clinics. The Dean Clinic network is an essential component of the services provided by SPMHS. These community mental health clinics allow SPMHS to provide appropriate follow up to service users who have had periods of inpatient care and treatment and are now progressing on their recovery pathway. The obligation to provide adequate post-inpatient follow up care and treatment is a regulatory requirement, and this requirement is monitored by the mental health inspectorate (MHC, 2024).
The four adult Dean Clinics provide multidisciplinary mental health assessments and treatment for those who can best be supported and helped within a community-based setting and provision of continued care for those leaving the hospital’s inpatient services and day-patient services. The Dean Clinics seek to provide a seamless link between primary care, community-based mental health services, day services,
and inpatient care. The clinics encourage and facilitate early intervention which improves outcomes. In 2025, a total of 1,456 adult Dean Clinic referrals were received from the SPMHS centralised Referral and Assessment Service (R&A). This presents an increase of 24.6% comparing with 1,169 referrals received in 2024. This increase is probably due to increased capacity in the Dean Clinics through availability of Assessment Homecare Admissions (AHAs) in Cork and Galway and the Dean Clinic Cork adolescent referrals to the adult clinics. The Dean Clinics also have access to consultants in private practice – called Associate Dean Clinic consultants - who complete assessments on behalf of SPMHS. Capacity for assessments was also increased through the introduction of an additional Associate Dean Clinic in Cork.
Table 2.2 illustrates the geographical spread of Dean Clinic referrals by province from 2023 to 2025. The highest referral volumes continued to be from Leinster in 2025 with 1,006 referrals, with referrals from Munster increasing by 43.4%. The increase of referrals from Munster is most likely due to the introduction of a new Associate Dean Clinic consultant in Cork.
The female to male ratio of Dean Clinic Adult referrals for 2025 was 1:0.75. Male referrals decreased by 2% in comparison to 2024.
Figure 2.3 shows the reasons for referral to the Dean Clinics in 2025, as identified by the referrer. The primary reasons for referrals as reported by the referrers showed anxiety, eating disorders, and depression as the most common reasons for referral.
Figure 2.3 Adult Dean Clinic Referrals by Clinical Reason for Referral in 2025
2.2.5 Adult Dean Clinic Activities
Table 2.4 below summarises the number of referrals and mental health assessments provided across the Dean Clinics since 2023. In 2025, 11.1% of referrals proceeded to have a mental health assessment – a 9.9% decrease from 2024. The decrease is primarily attributable to a higher volume of referred service users opting for an AHA—a three-day comprehensive Homecare assessment admission. Additionally, some service users have a more immediate need and are assessed for possible admission to inpatient care or are referred for a Homecare service admission. This is evidenced in the 3.1% increase of first-time admissions. In some cases, a decision is made not to progress with an assessment as the service user is already under the care of another service and others do not attend appointments. 38.6% of referrals suitable for assessment were declined in 2025 - 8.6% less than 2024. This includes 21% referrals that did not proceed to assessment due to the fact that no response was received from the service user when they were offered assessment. Despite their initial engagement during the referral management process, services offered were declined by the service users; additional referral information required by SPMHS was not received; or the service user did not respond at all to attempts to contact them following receipt of their referral. Table 2.4 summarises the number of referrals and mental health assessments provided across the Dean Clinics since 2023.
Table 2.4 A summary of the number of referrals and mental health assessments provided in the adult Dean clinics from 2023 - 2025.
A mental health assessment involves a comprehensive evaluation of the referred person’s mental healthcarried out by a Consultant Psychiatrist
and members of the multidisciplinary team (MDT). An individual care plan is agreed with the referred person following assessment which may involve follow-on community-based therapy, a referral to a day-patient programme, admission to inpatient care and treatment or referral back to the GP with recommendations for treatment. The assessment process is collaborative and focused on assisting the person to make a full recovery through the most appropriate treatment and care.
Table 2.5 summarises the total number of outpatient appointments that were offered across Dean Clinics nationwide from 2023 to 2025. Appointments include Consultant Reviews, Clinical Nurse Manager II Reviews, Clinical Nurse Specialist reviews, Cognitive Behavioural Therapy, Occupational Therapy, Social Work and Psychology. There was a 0.19% decrease in adult Dean Clinic appointments in 2025. The “Did not Attend” (DNA) rate was 4.8% - a slight decrease of 0.2% in comparison to 2024. This is 9.2% below the national DNA rate of 14% for outpatient appointments in the Health Service Executive (HSE) in 2025.
Table 2.5 Adult Dean Clinic appointments from 2023 - 2025.
Table 2.6 summarises the number of first-time inpatient admissions to SPMHS from an initial Dean Clinic referral or following a Dean Clinic assessment for the period 2023 to 2025. There was an increase of 3% in first time admissions from the Dean Clinics in 2025. This increase was potentially due to improvements made to the triaging process of referrals and the introduction of Assessment Homecare Admissions in the Dean clinics. The ability to transition to a Homecare service admission provided an acceptable alternative for service users who otherwise may have declined an in-person inpatient admission.
Table 2.6 First time inpatient admissions from an initial Dean Clinic referral.
2.2.6
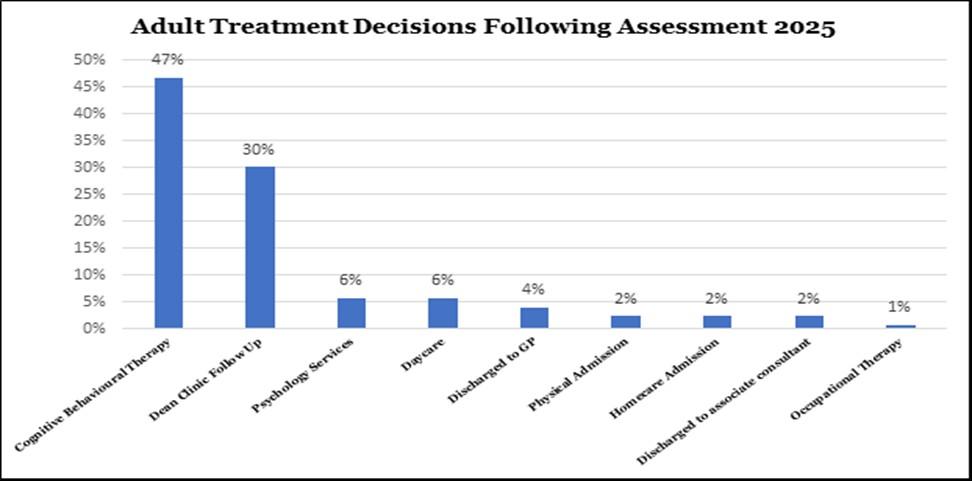
Figure 2.7 summarises and compares the treatment decisions recorded in individual care plans following initial assessment in Dean Clinics in 2025. It shows that the highest number of service users were referred for Cognitive Behaviour Psychotherapy, follow-up in the Dean clinics and psychological services by the assessment team.
Figure 2.7 Adult Dean Clinic Treatment Decisions following Dean Clinic assessments
The two Adolescent Dean Clinics are based in Dublin and Cork. In 2025, there were a total of 879 referrals received for the adolescent aervice –a decrease of 8.2% from 2024. This reduction is potentially due to an increase of private ADHD services available in the community. A total of 251 Adolescent Prompt Assessment of Needs (PAONs) were completed in 2025 which was an 8.2% increase from 2024.
Referrals to the Adolescent Service are centrally received and reviewed by the Willow Grove Adolescent Unit (WGAU) clinical team. All referrals (n=879) were assessed to determine if inpatient admission, the Homecare service, or the Dean Clinics would be the best service to meet their needs.
In 2025, 633 (72%) of the 879 referrals received by the adolescent service were declined or discharged prior to admission or Dean Clinic assessment. Of these, 418 (47.6%) were discharged prior to admission or Dean Clinic assessment – a 5% decrease in comparison to 2024. The
main reasons for declining the referrals were due to the adolescent service not being able to offer prompt admission or a Dean Clinic assessment within an appropriate time frame to meet urgent needs. Additionally, there was an increase of complex referrals in 2025 that required full MDT input that the part-time Dean Clinics do not have access to. More referrals presented with Autism Spectrum Disorders with co-morbid complex needs which SPMHS could not provide a service for. The Dean Clinic SPUH capacity to accept referrals also reduced due to ongoing recruitment challenges to secure psychological services in the clinic. The clinical team makes recommendations for alternative treatment options in these cases to the referring clinician.
The balance of the referrals received by the adolescent service that were discharged prior to admission or Dean Clinic assessment, 215 (24.5%) were discharged for several reasons, for example, due to the young person not meeting required age parameters, the young person/ parents declining services offered or the young person being admitted to another service. This presents a slight increase of 2.5% in comparison to 2024.
Table 2.8 illustrates the geographical spread of adolescent referrals by province from 2023. The highest referral volume is from Leinster.
Table 2.8 Adolescent Service Referrals by Province
The female to male ratio of Dean Clinic Adolescent referrals for 2025 was 1:0.52. There was a 10.4% decrease in male referrals in comparison to 2024.
Figure 2.9 reflects the reasons for referrals to the Adolescent Dean Clinics throughout 2025 by General Practitioners, HSE Child and Adolescent Mental Health Services (CAMHs), private consultants, HSE adult mental health inpatient services and independent mental health services. The primary reasons for referral were anxiety, depression, and Attention Deficit Hyperactivity Disorder (ADHD).
Figure 2.9 Clinical Reasons for referral to the Adolescent Dean clinics in 2025
Table 2.10 summarises the total number of referrals received by the adolescent service, the number of referrals sent to the Adolescent Dean Clinics and the number of adolescent mental health assessments provided across the Dean Clinics since 2023.
In 2025, 673 referrals were forwarded to the Adolescent Dean Clinics presenting a decrease of 4.1% in comparison to the number of referrals in 2024. As mentioned in subsection 2.2.7, not all referrals result in an assessment due to service users already being under the care of another service; non-attendance at assessment appointments; declining the assessment offered and / or may be referred for an admission assessment. The increased capacity of the Homecare service increased accessibility to the service by creating an acceptable alternative to inperson admissions for young people and their parents; and negated the waiting times for a Dean Clinic assessment. In addition, service users may have been referred to several services and opted to attend a local service. Parental consent is required prior to adolescent assessments taking place. Table 2.10 provides a summary of the number of referrals received and the number of assessments completed in 2025.
Table 2.10 A summary of the number of referrals and mental health assessments provided in the adolescent Dean clinics from 2023 - 2025.
There was a 19.8% increase in the Adolescent Dean Clinic assessments in 2025. The mental health assessment involves a comprehensive evaluation of the young persons’ mental healthcarried out by members of the multidisciplinary team. An individual care plan is agreed with the referred young person and family following assessment. This may involve follow-on community-based therapy, a referral to a day-patient programme, admission to inpatient care and treatment or referral back to the GP with recommendations for treatment. The assessment process is collaborative and focused on assisting the young person to make a full recovery through the most appropriate treatment and care. The
adolescent team provide family psychoeducation to assist families in supporting the adolescents’ recovery.
The total number of Adolescent Dean Clinic appointments offered in 2025 by the Adolescent Dean Clinics nationwide decreased by 8.3% in comparison to 2024. The reductions in appointments offered was due to unplanned clinician leave. The “Did Not Attend” (DNA) rate was 1.1%, which is 4.9% below the national DNA rate of 6% for CAMHS appointments in Ireland. The number of appointments offered is summarized in table 2.11. Appointments include Consultant reviews, Clinical Nurse Manager reviews, Nurse Practitioner appointments, cognitive behavioural therapy, occupational therapy, social work, psychology, and dietetic services. Table 2.11 shows the number of Adolescent Dean Clinic appointments from 2023 - 2025.
Table 2.8 The number of Adolescent Dean Clinic appointments from 2023 – 2025
The total number of admissions to WGAU included 59 inpatient admissions and 73 Homecare admissions in 2025. This represents a decrease of 4.3% in the combined number of inpatient and Homecare admissions. The combined number of inpatient and Homecare first-time admissions was 73, which was a decrease of 12% in comparison to 2024. The reduction in admissions can be attributed to the reduction of referrals for admission in 2025. All referrals are triaged for admission. Table 2.12 summarises the number of first-time inpatient admissions to WGAU from 2023.
Table 2.12 First-time inpatient admissions to WGAU from 2023 – 2025
Figure 2.13 summarises the treatment decisions recorded from individual care plans following initial assessment in Adolescent Dean Clinics in 2025. There was a 60% increase in referrals to the adolescent Dean Clinic nursing team and a 21% increase to cognitive behavioural psychotherapy, a 17% decrease to individual psychology sessions, a 33% decrease in referrals to social work. There was a 17% reduction of referrals to the adolescent psychology day programs. The reduction of referrals to the psychology services was probably due to unplanned clinician leave and challenges in recruitment of psychologists.
SPMHS in-person inpatient care is provided in St Patrick’s University Hospital (SPUH) with 208 in-person inpatient beds, St Patrick’s Lucan (SPL) which contains 52 inpatient beds and Willow Grove Adolescent Unit (WGAU) with 14 in-person inpatient beds. In addition to its inperson inpatient care, SPMHS also provides Homecare services first introduced in March 2020 to both Adult and WGAU service users. The Homecare service offers almost all the elements of in-person inpatient care, involves the highest levels of one-to-one mental health support, but is delivered remotely through frequent contact daily over videocall and other technological channels.
The following information includes gender ratios, age and length of stay (LOS) distributions across Adult and WGAU in-person inpatient and Homecare services for 2025. In 2025, 63.3% of admissions across Inperson Inpatient and Homecare services were female, this compared to 62.0% in 2024.
Table 2.14 Number of Total Admissions (% of Total Admissions) 2025
Table 2.15 shows the numbers and percentages of admission care/treatment days delivered in 2025, providing a synopsis of the inpatient in-person care days and the Homecare service days.
Table 2.15 Number (%) of Inpatient In-person and Homecare Admission Days 2025
Table 2.16 shows the average age of service users admitted across all services was 47.69 in 2025 (2024 - 48.49 years). The average age of adults admitted was 49.25 years in 2025 and was 50.32 years in 2024. The average age of adolescents admitted to WGAU In-person Inpatient and Homecare Services was 15.52 years in 2025 and was 15.27 years in 2024.
Table 2.16 Average Age at Admission (ALL) 2025
Tables 2.17 to 2.22 present the 2025 average length of stay (LOS) for adult in-person inpatient and Homecare service discharges (18 years of age and over) and Adolescent in-person inpatient and Homecare service discharges (under 18 years of age). The analysis and presentation of length of stay for these discharges was informed by the methodology used by the Health Research Board which records the number and percentage of discharges within temporal categories from under one week up to five years.
Table 2.17 SPMHS length of stay (LOS) for 2025 Adult Discharges
Table 2.18 SPMHS length of stay (LOS) for 2025 Adult In-person Inpatient Discharges 2025 Adult Inperson Inpatients
Table 2.19 SPMHS length of stay (LOS) for 2025 Adult Homecare Discharges
Adult Homecare
Table 2.20 SPMHS length of stay (LOS) for 2025 Adolescent (WGAU) discharges
Table 2.21 SPMHS length of stay (LOS) for 2025 WGAU In-person Inpatient Discharges 2025 WGAU Inperson Inpatients
Table 2.22 SPMHS length of stay (LOS) for 2025 WGAU Homecare Discharges
2025 Adolescents
for all In-person Inpatient and Homecare Discharges in 2025
Tables 2.23 and 2.24 outline the prevalence of diagnoses across SPMHS in-person inpatient and Homecare settings during 2024 using the International Classification of Diseases 10th Revision (ICD 10, WHO 2010). The Primary ICD Code Diagnoses recorded on admission and at the point of discharge are presented for all SPMHS In-person inpatient and Homecare settings. The data presented is based on all in-person inpatient and Homecare discharges from SPMHS in 2025.
Table 2.23 SPMHS analysis of inpatient Primary ICD Diagnoses(For all In-person Inpatients discharged in 2025)
SPUH: St Patrick’s University Hospital. SPL: St Patrick’s Lucan. WGAU: Willow Grove Adolescent Mental Health Unit. The categories listed in this table are those defined in the International Classification of Diseases 10th Revision (ICD 10, WHO 2010).
ICD Codes: In-person
For All in-person Inpatient Service Users
F90-F98
Table 2.24 SPMHS analysis of inpatient Primary ICD Diagnoses (For all Homecare Service Users discharged in 2025)
The categories listed in this table are those defined in the International Classification of Diseases 10th Revision (ICD 10, WHO 2010).
ICD Codes: Homecare Admission & Discharge
The Wellness and Recovery Centre (WRC), as well as providing a number of recovery-oriented programmes, provides service users with access to a range of specialist clinical programmes which are available as a step-down service following inpatient or Homecare treatment or as a step-up service accessed from the Dean Clinics. Throughout 2025, many day programmes continued to be delivered entirely or in part, via technology-enabled care. Programme delivery was further enhanced through the introduction of hybrid technology which supports a blend of onsite and remote delivery. This was particularly useful at times of illness and adverse weather conditions, which otherwise would have
prevented service users attending in person. Clinical programmes are delivered by specialist multi-disciplinary teams and focus primarily on disorder-specific interventions, psychoeducation and supports, and fall into the following broad categories;
• CBT based programmes
• Psychology programmes
• Addiction services
• Eating disorder services
• Recovery focused programmes
Table 2.21 compares the total number of day programme referrals to each clinical programme for 2024 and 2025. Referrals come from a number of sources, including SPMHS multidisciplinary teams, Dean Clinics, GPs, and external mental health services. In 2025, the WRC received a total of 2,153 referrals, a marginal increase on 2,146 received in 2024. Of the day programme referrals for 2025, 21.69% were received from Dean Clinics. This compares to a total of 25.25% referrals received from Dean Clinics in 2024. Most day programme referrals (66.4%) are created internally by the service users’ multidisciplinary team. The remainder are referred from GPs, external consultants, and HSE community services.
Table 2.25 Individual day programme referrals for 2024 and 2025 SPMHS
Programmes
Of all referrals to day services in 2025, 1,376 (63.91%) were female, 774 (36.09%) were male, similar to 2024 figures.
In 2025, of the 2,153 referrals to a day programme, 1,287 were registered for day programmes. This compares to 2,146 referrals and 1,325 programme registrations in 2024. These registrations represented a total of 17,817 (2025) and 18,720 (2024) half day attendances respectively. Therefore, in 2024 each registered day service user attended on average 14.1 half days while in 2025 each registered day service user attended on average 13.4 half days. This information is displayed in Table 2.26 below.
Not all service users referred to day programmes commence a programme. This may be due to personal circumstances (work, family, travel) or following assessment by the programme clinicians, the programme that the service user was referred to was considered to be not clinically appropriate. Occasionally, a service user may be referred to multiple programmes and it is not recommended that a service user attend more than one programme at a time. Service users occasionally withdraw from programmes after commencement due to; relapse of acute mental health difficulties, inpatient admission, personal circumstances (work, family, travel) or not feeling the programme meets their needs or expectations.
Table 2.26 Day programme attendances at clinical programmes 2024 and 2025
SPMHS Day Programmes
SPMHS aspires to provide services to the highest standard and quality. Through its clinical governance structures, it ensures regulatory, quality, and relevant accreditation standards are implemented, monitored and reviewed.
Table 3.1 Clinical Governance measures summary 2023-2025
Governance measure
Clinical audits
Number of complaints
Total including all complaints, comments and suggestions received and processed throughout the entire year.
Number of incidents
An event or circumstance that could have or did lead to unintended/unexpected harm, loss or damage or deviation from an expected outcome of a situation or event.
Root cause analyses and focused reviews commenced
A thorough and credible examination of a critical incident in order to determine whether systemic or organisational factors contributed to the occurrence of an incident.
Number of Section 23s – Involuntary detention of a voluntary service user
A person who is admitted voluntarily may be subsequently involuntarily detained by staff of the approved centre (SPUH) - where the person indicates an intention to discharge from the approved centre but following examination is deemed to be experiencing a mental health illness. Section 23(1) allows the centre to detain a voluntary person for a period not exceeding 24 hours for assessment.
% Section 23s which progress to involuntary admission (Section 24Form 13 Admissions)
Following Section 23 an examination by the Responsible Consultant Psychiatrist and a second Consultant Psychiatrist the person may be ultimately detained for ongoing treatment and care (Section 24) for up to 21 days.
Number of Section 14s – Involuntary admissions
An involuntary admission that occurs as a result of an application from a spouse or relative, a member of an Garda Síochána, an Authorised Officer or a member of the public and a recommendation from a GP (the person is admitted as involuntary). A person subject to such an admission may decide to remain voluntarily.
% of Section 14s which progress to involuntary admission (Section 15 - Form 6 Admissions)
Where a service user, under Section 14 admission, does not wish to remain voluntarily and is deemed to be experiencing a mental health illness following assesment, that service user can be detained involuntarily for ongoing treatment and care (Section 15) for up to 21 days.
Number of Section 20/21 - Transfers
Where an involuntary patient is transferred to an approved centre under Section 20 or 21 of the Mental Health Act 2001, the clinical director of the centre from which he or she has been transferred shall, as soon as possible,
give notice in writing of the transfer to the MHC on Statutory Form 10. Assisted Admissions
The number of instances where assisted admissions services were required to assist in the transportation of a service user
Number of Section 60 – Medication reviews
Where medication has been administered to an involuntary patient for the purpose of treating their mental disorder for a continuous period of three months, the administration of that medicine cannot continue unless specific consent is obtained for the continued administration of medication or, in the absence of such consent, a review of this medication must be undertaken by a psychiatrist, other than the responsible consultant psychiatrist.
Number of Section 19 – Appeal to Circuit Court
A service user has the right to appeal to the Circuit Court against a decision of a tribunal to affirm an order made in respect of him / her on the grounds that he / she is not experiencing a mental health illness.
Number of Tribunals held
Number
Physical Restraint
This section summarises clinical audit activity for St Patrick’s Mental Health Services in 2025. Clinical audit is an integral part of clinical governance. Its main purpose is to improve the quality of care provided to service users and the resulting outcomes. The clinical audit process is a cycle which involves measurement of the quality of care and services against agreed and proven standards for high quality, and, where necessary, taking action to bring practice in line with these standards. A complete clinical audit cycle involves remeasurement of previously audited practice to confirm improvements and make further improvements if needed.
Table 3.2 demonstrates the breakdown of projects by type undertaken in 2025, including those facilitated by clinical staff at local level, and those carried out throughout the organisation led by various committees.
Table 3.2 Key Audit Outcomes for 2025 on page 33
1. The Clinical Global Impression (CGI) and Children’s Global Assessment Scale (CGAS) level of change pre and post-inpatient treatment
To measure the CGI/CGAS outcomes for service users pre and post-admission.
2. Multidisciplinary Individual Care Plan, Discharge Planning and The Key Worker System and their compliance with MHC Regulations and Local Policy
To ensure compliance with the Mental Health Commission standards and local policies on Multidisciplinary care planning, the key worker system and discharge planning.
To ensure that required Key Worker information is recorded in the service user’s Individual Care Plan.
Increase the level of compliance with MHC standards on accessible care provided by multi-disciplinary teams to service users.
To ensure that an individual care plan and discharge plan are documented effectively.
3. ECT processes
To ensure the highest quality of clinical governance through ensuring compliance with Mental Health Commission guidelines, code of practice and rules.
4. Admission protocol
To improve compliance with the admission protocol for adult service users being admitted for physical admission.
To improve practice if standards on admission protocols are not being met.
To ensure that the initial care plan is appropriate, and the treatment chosen and implemented on admission is provided in timely manner.
5. PRN benzodiazepine and z-drug hypnotic prescribing
To ensure safe usage of benzodiazepines and hypnotics to service users receiving in-patient care and minimalize side effects that might be caused by these drugs.
To ensure compliance with hospital protocol.
To ensure the use of benzodiazepine and hypnotic drugs is appropriate, feedback the findings to the prescribers and to change the practice if needed.
6. Adherence to the organisations protocol on falls risk prevention interventions
To ensure that service users identified as medium or high risk of fall are managed appropriately to reduce any future fall incidents and to increase service user safety.
Clinical Governance Committee Annual audit completed
Clinical Governance Committee Re-audit completed
Clinical Governance Committee Re-audit completed
Postgraduate Training Audit Committee Re-audit completed
Postgraduate Training Audit Committee Baseline audit completed
Falls Committee Bimonthly audits completed
* The Prescribing Observatory for Mental Health (POMH-UK) runs national quality improvement programmes designed for UK specialist mental health services
7. Turnaround times of the Eurofins SCDL laboratory test results
To ensure that the laboratory test results are reported to the clinical teams of St. Patrick’s Mental Health Services in a timely manner.
8. Benzodiazepine and Hypnotic Snapshot
To determine the percentage of in-patients prescribed benzodiazepines and night sedation in St. Patrick’s University Hospital, St. Patrick’s Hospital Lucan and Willow Grove Unit and feedback the findings to the multidisciplinary teams.
9. The use of Clozapine (audit facilitated by Prescribing Observatory for Mental Health-UK*)
To assess adherence to best practice standards and benchmark the results with the UK Trusts.
10. The use of melatonin (audit facilitated by Prescribing Observatory for Mental Health-UK*)
To assess adherence to best practice standards and benchmark the results with the UK Trusts.
11. Appropriateness of antibiotic prescribing practice
To increase the effectiveness of infection management.
To ensure that antibiotics are prescribed appropriately.
12. Dean Clinic clinical data quality review
To review the current practice on the quality of clinical records of the Dean Clinics’ appointments.
To assess whether the mental health examination and risk assessment are recorded.
13. Medication safety for women of childbearing potential prescribed Sodium Valproate in SPMHS Dean Clinics
To ensure safety of a potential unborn baby if a woman of a childbearing potential is prescribed valproate;
To ensure SPMHS compliance with the local policy CLIN 0032 and the conditions of the national pregnancy prevention programme designated to women of childbearing potential if prescribed Sodium Valproate.
14. Audits of compliance with the regulations for approved centres
To ensure the highest quality of clinical governance through ensuring compliance with Mental Health Commission regulations, code of practice and rules.
Clinical Governance Committee Re-audit completed
Clinical Governance Committee Re-audit completed
Clinical Governance Committee Re-audit completed
Clinical Governance Committee Re-audit completed
Infection Control Committee Re-audit completed
Clinical Governance Committee Re-audit completed
Clinical Governance Committee Baseline and re-audit completed
Departmental Audits Baseline audits and reaudits completed in 2025
15. Nursing Metrics
To compare fundamental aspects of nursing practice with standards as outlined by NMBI, the MHC and best practice.
16. Dean Clinic Nursing Assessments Audit
To support and oversee the implementation of the monitoring, audit and evaluation processes for nurses assessing service users in line with SPMHS policy and NMBI standards.
17. A service evaluation of the effectiveness of the online Group Radical Openness (GRO) programme
To assess the quality and efficacy of the Group Radical Openness (GRO) programme online modality.
18. A Service Review of a Psychology Skills Group for Adolescents (PSG-A)
To inform the PSG-A team of the predominant emotion regulation profile (for example emotional overcontrol, under control or both) of young people referred and on changes to the teaching content of the programme.
19. Prevalence of confirmed and suspected Autism and ADHD in Willow Grove Adolescent Unit
To determine the prevalence rate of: (i) young people admitted to Willow Grove Adolescent Unit who are diagnosed Autistic and/or ADHD prior to admission, and (ii) young people discharged with a query from the team of whether they might have autism and/or ADHD.
Nursing Department This is a monthly routine audit.
Nursing Department This is a routine audit.
Psychology Department Service review completed
Psychology Department Service review completed
Psychology Department Service review completed
A Clinical Audit Programme for audits and monitoring of compliance with regulations for approved centres continued during 2025 and all clinical and non-clinical departments were actively involved. The MHC inspection process confirmed that SPMHS were fully compliant with all regulations, rules and the codes of practice.
The Postgraduate Training Audit Committee facilitates a clinical audit programme to enable Doctors in Training in SPMHS to particpate in organisational clinical audits. Three audits have been completed by non-consultant hospital doctors: admission protocols, PRN Benzodiazepine and hypnotic prescribing and antibiotics prescribing practice. Findings of these audits have been reviewed and acted upon.
SPMHS benchmarked its practice with UK Mental Health Services by taking part in the use of Clozapine audit. The audit report showed higher than the UK national subsample compliance levels on the annual performance of metabolic parameters for patients on Clozapine treatment for more than one year. Nevertheless, the report highlighted a need to strengthen the practice of assessing and recording sideeffects associated with Clozapine.
Sodium Valproate is a widely used mood stabilising medication and one of several medications that are associated with serious teratogenic effects. Analysis of data collected on the use of Sodium Valproate in Dean Clinics showed that a small number of females of child-bearing potential were prescribed this drug. The audit confirmed that the conditions of the national pregnancy prevention programme designated to women of childbearing potential if prescribed Sodium Valproate were met for 75% of the sample. The organization and staff are improving electronic prescribing at the Dean Clinics. This EHR functionality will allow for the easy identification of service users on Valproate, facilitating continuous monitoring and adherence to national guidelines
Clinical outcome measurement has been in place in SPMHS since 2011 and is a priority for the service, embedded within clinical practice. The processes which underpin clinical outcome measurement continue to be refined and informed by the realities and challenges of clinical practice. This report reflects an organisational culture that recognises the value of integrated outcome measurement in informing practice and service development. A strong desire for transparency underpins the approach taken in analysing and reporting the clinical outcomes that follow.
The following important considerations should be borne in mind when reading these findings:
The data reported in this chapter represent pre and postprogramme measurements.
Pre and post-programme measurement are carried out at the start and finish of programmes, however, other elements of care, simultaneous interventions, time, medications etc. may also play a part (any effects cannot be solely attributable to clinical programme intervention).
Where appropriate to the analysis of outcomes, paired sample ttests are used to determine if, across the sample, post-scores are statistically significantly different from pre-scores. Where a t-test is not appropriate (due to sample size), the Reliable Change Index (RCI) is used. The RCI should be interpreted with caution because it can be influenced by measurement variability, but it is useful for
small sample sizes as it provides a standardised way to assess individual change in a way that accounts for reliability.
Statistical significance indicates the extent to which the difference from pre to post is due to chance or not. Typically, the level of significance is set at p > 0.05 which means that there is only a 5% probability that the difference is due to chance and therefore it is likely that there is a difference. Statistical significance provides no information about the magnitude, clinical or practical importance of the difference. It is possible that a very small or unimportant effect can turn out to be statistically significant for example small changes on a depression measure can be statistically significant, but not clinically or practically meaningful.
Statistically non-significant findings suggest that the change from pre and post is not big enough to be anything other than chance but does not necessarily mean that there is no effect. Nonsignificant findings may result from small sample size, the sensitivity of the measure being used or the time point of the measurement. As such non-significant findings are not unimportant; rather they provide useful information and an invitation to investigate further.
Practical significance indicates how much change there is. One indicator of practical significance is effect size. Effect size is a standardised measure of the magnitude of an effect. This means effect sizes can be compared across different studies that have measured different variables or used different scales of measurement. The most common measure of effect size is known as Cohen’s d. For Cohen's d an effect size of:
> 0.3 is considered a "small" effect
> 0.5 a "medium" effect
> 0.8 and upwards a "large" effect
As Cohen indicated: “The terms “small”, “medium” and “large” are relative, not only to each other, but to the area of behavioural science or,
even more particularly, to the specific content and research method being employed in any given investigation. In the face of this relativity, there is a certain risk inherent in offering conventional operational definitions for these terms for use in power analysis in as diverse a field of inquiry as behavioural science. This risk is nevertheless accepted in the belief that more is to be gained than lost by supplying a common conventional frame of reference which is recommended for use only when no better basis for estimating the ES index is available." (p. 25) (Cohen, 1988).
Clinical significance refers to whether a treatment was effective enough to change whether a patient met the criteria for a clinical diagnosis at the end of treatment. It is possible for a treatment to produce a significant difference and medium to large effect sizes but not to demonstrate a positive change in the service user’s level of functioning.
The objective is to measure the efficacy of treatment, by comparing the severity of illness scores completed at the point of admission to treatment (in-person inpatient and Homecare via technology-enabled care) and the final score prior to discharge. These scores are completed by clinicians using the Clinical Global Impressions (CGI) in case of adults and the Clinical Global Assessment Scale in the case of adolescents.
Following admission each service user’s level of functioning and illness severity is evaluated by a clinician or multidisciplinary team (MDT) either between admission and the first MDT meeting, or at a first MDT meeting. This is referred to as the CGI-Severity (CGIS) or Clinical Global Assessment Scale (CGAS) baseline score and this scoring is repeated at each MDT meeting, including at the final MDT meeting preceding discharge. This is referred to as the final CGIC or CGAS score. An audit of the CGI and CGAS completion rates was also conducted.
The CGI is a standard, widely used mental health assessment tool. The complete CGI scale consists of three different global measures designed to rate the effectiveness of a particular treatment: the CGI-Severity (CGIS) that is used to establish the severity of psychopathology at point of assessment; the CGI-Change or Improvement (CGIC) which compares the service user baseline condition to her/his current condition following care, treatment or intervention; the efficacy index that compare the service user’s baseline condition to a ratio of current therapeutic benefit and severity of side effects. Out of these three measures the CGIS and the CGIC are used frequently in clinical and research settings.
The CGIS asks a clinician the question: “Considering your total clinical experience with this particular population, how mentally ill is the patient at this time?” which is rated on the following seven-point scale: 1=normal, not at all ill; 2=borderline mentally ill; 3=mildly ill; 4=moderately ill; 5=markedly ill; 6=severely ill; 7=among the most extremely ill patients.
The CGIC rates on a seven-point scale the following query: “Compared to the patient’s condition on admission to this project (prior to intervention), this patient’s condition is: 1=very much improved since the initiation of treatment; 2=much improved; 3=minimally improved; 4=no change from baseline (the initiation of treatment); 5=minimally worse; 6=much worse; 7=very much worse since the initiation of treatment.”
The Children’s Global Assessment Scale (CGAS) provides a global measure of level of functioning in children and adolescents. CGAS is scored by the MDT on a scale of one to 100 which reflects the individual’s overall functioning level where impairments in psychological, social and occupational/school functioning are considered. Scoring for the CGAS ranges from one, in need of constant supervision, to 100, superior functioning.
4.2.3
This report used data extracted from the electronic health record, eSwift, which provided details on the SPUH and SPL hospital admissions and admissions to WGAU.
A random sample was chosen from admissions to SPUH and SPL. The chosen sample size was 323 adult cases. Then the cases were randomly selected by employing stratified and quasi random sampling strategies. This ensured appropriate representation of cases for each ward within the services.
All 79 WGAU admissions were included for CGAS adolescent dataset.
The anonymised dataset collected for each selected case included the following variables:
Service user age and gender
Admission ICD code (primary and additional)
Date of admission
Admission ward
Re-admission rate
Date of discharge
Baseline assessment scale score (CGIS or CGAS respectively)–recorded on the individual care plan on or before the first MDT meeting
Date recorded against the baseline score
Final assessment scale score (CGIC or CGAS respectively) recorded on the MDT meeting care plan review document
Date recorded against the final score.
4.2.4 Sample description
Table 4.1 Admission type, age and gender of sample
Total Adult Service
Admissions
Table 4.2 The percentage of primary admission ICD-10 diagnosis codes recorded in the sample.
F40F48 Neurotic, stress-related and somatoform disorders
F10F19 Mental and behavioural disorders due to psychoactive substance use
F20F29 Schizophrenia, schizotypal and delusional disorders
F50F59 Behavioural syndromes associated with physiological disturbances and physical factors
F00F09 Organic, including symptomatic, mental disorders
F60F69 Disorders of adult personality and behaviour
Disorders of psychological
F89 development F90F98
4.2.6 Breakdown of baseline and final assessment scale scores
Table 4.3 Total adult service
CGIS - Baseline measure
Table 4.4 Total adult service CGIC – Final
4.2.7 Audit on completion rates of baseline and final CGI scores
4.2.7.1 Clinical audit standards
Audit Standard no. 1: Baseline score is taken within at least seven days following admission: Exception: Short admission Target level of performance: 100%
Audit Standard no. 2: Final score is taken within at least seven days prior to discharge: Exception: Short admission, unplanned discharge Target level of performance: 100%
4.2.7.2 Results
Table 4.6 Results of clinical audits
assessment scale score
A sample was chosen out of a dataset of St. Patrick’s Mental Health Services discharges for 2025.
A female to male ratio was 1.6:1 for adults and WGAU 3.0:1 for adolescents.
In the 2025 sample, 1st admissions accounted for 41% of adult service users and 90% of adolescent service users.
2025 analysis of the primary ICD-10 codes showed for the adults’ population the most frequent reasons for admission were mood disorders followed by neurotic, stress related, somatoform disorders and behavioural disorders due to psychoactive substance use.
In 2025, 38% of SPUH, SPL, and the Homecare service users were moderately ill. Another 29% were markedly ill. 9% were severely ill.
Based on a sample of 270 (total cases with discharge CGI score documented), 89% of the sample were rated with an overall improvement (1 - very much improved (9%), 2 - much improved (56%) and 3 - minimally improved (24%)). This percentage of the sample rated with an overall improvement decreased in comparison to observed in the 2024 data set where 94% overall improvement was observed.
2025 analysis of the primary ICD-10 codes showed for the adolescent’ population the most frequent reasons for admission were neurotic, stress related, somatoform disorders followed by behavioural syndromes associated with physiological disturbances and physical factors.
In 2025, 35% of Willow Grove Adolescent Unit service users were scored as having a moderate degree of interference in functioning on admission and another 41% had major impairment in functioning in several areas. 9% were unable to function in almost all areas.
Overall improvement rate for Willow Grove Adolescent Unit was 90%.
The audit shows a decrease in the rates of recording the baseline and final assessment scales’ scores in adults. Willow Grove Adolescent Unit was found to be fully compliant with the standards.
(April-September 2025 Inclusive)
The Alcohol and Chemical Dependence Programme (ACDP) is designed to support individuals with alcohol and/or chemical dependence or abuse to achieve abstinence by enabling them to develop an increased awareness of the implications and consequences of their drinking or drug-taking. The ‘staged’ recovery programme is delivered by psychiatrists, addiction counsellors and ward-based nursing staff, with input from other disciplines including psychology, social work and occupational therapy. The programme includes:
Inpatient residential service for four weeks
12-week step-down programme
After-care
The programme caters for adults who are currently abusing or dependent on alcohol or chemical substances.
Referral criteria include:
The service user is over the age of 18 years
The service user is believed to be experiencing alcohol and/or chemical dependence or abuse
The service user has the cognitive and physical capability to engage in the activities of the programme such as psychoeducation, group therapy and addiction counselling
The service user is not intoxicated and is safely detoxified
The service user’s mental health condition will not impede their participation in the programme.
4.3.1
In 2025, 111 participants completed the full programme and returned pre and post data. 55.9% of participants were male and 44.1% were female. The mean age of the participants was 47 years (SD = 14.3).
The Leeds Dependence Questionnaire (LDQ; Raistrick et al 1994) is a 10item questionnaire designed to screen psychological dependency to a variety of different substances. The LDQ was designed to be sensitive to change over time and to range from mild to severe dependence (Raistirck et al 1994).
The measure is designed to evaluate 10 markers of substance and/or alcohol dependence. The 10 items map on to the ICD-10 and DSM-IV criteria for substance dependence which include: pre-occupation with the substance; the primacy of activities associated with the substance over other activities; the perceived compulsion to continue using the substance; the way in which the user’s day is planned around procuring and using the substance; attempts to maximise the effect of the substance; the narrowing of the substance use repertoire; the perceived need to continue using the substance in order to maintain effect; the primacy of the pharmacological effect of the substance over any of its other attributes; the maintenance of the substance induced state; and the belief that the substance has become essential to the user’s existence (Kelly, Magill, Slaymaker & Kahler, 2010).
Items are scored on a four-point scale from zero – ‘never’, to three –‘nearly always’, with higher total scores (maximum score of 30) indicating greater dependence.
Analysis of the measure has shown it to have high internal consistency (alpha = .88), good test-retest reliability (r = .95) and has been shown to be a valid, psychometrically sound measure of substance dependence for alcohol and opiates (Raistrick et al 1994). The LDQ has also been suggested as an appropriate measure for use with inpatient psychiatric populations (Ford, 2003), and in evaluating the effectiveness of substance disorder treatments in adults with substance dependency (Tober, Brearley, Kenyon, Raistick & Morley, 2000).
4.3.3
This measure was completed by service users pre- and post-programme participation. Significant reductions in psychological markers of substance and/or alcohol dependency were obtained from pre- to post-programme participation. A paired samples t-test revealed a statistically significant reduction in psychological markers of substance and/or alcohol dependency based on their LDQ scores following participation in the programme, t (110) = 27.10, p < 0.001, with a large effect size (d = 2.57). The mean score on the total LDQ scores decreased from preintervention (M = 17.77, SD = 6.77) to post-intervention (M = .51, SD = 1.08), as depicted in Figure 4.7.
Figure 4.7 Leeds Dependency Questionnaire scores from pre- to postintervention
4.3.4 Summary
Significant and large reductions in psychological markers of substance and/or alcohol dependency were observed, following completion of the Alcohol and Chemical Dependency Programme. These findings are in line with previous research and literature which regard the LDQ as a suitable tool for the evaluation of interventions for adults with substance dependency (Tober et al., 2000).
The Dual Diagnosis Programme is designed for adults who are currently abusing (service users must meet the criteria for dependence) or dependent on alcohol or chemical substances, and in addition, have a comorbid diagnosis of a mental health difficulty such as depression, anxiety, or bipolar disorder (Axis 1 disorder, DSM-V).
The aim of this programme is not only to enable individuals to achieve abstinence and recovery in relation to substance use, but also to facilitate awareness, understanding and to provide practical support and knowledge in relation to their mental health difficulties.
The programme aims to assist the service user in the recovery process, by providing a bio-psychosocial support structure and the therapeutic environment necessary to foster their recovery. This includes a combination of group and one-to-one support to help in the transition from complex mental health and addiction issues to a more sustainable and healthy life in sobriety.
The Dual Diagnosis Programme is a staged recovery programme and is delivered by psychiatrists, addiction counsellors and ward-based nursing staff, with input from other disciplines including psychology, social work and occupational therapy. It includes:
Initial detoxification and assessment by MDT
Inpatient residential service for approximately four weeks (longer if required)
12-week step-down programme (not always required, pending treatment pathway)
Aftercare for 12 months.
The programme includes the following elements:
Individual multidisciplinary assessment: This facilitates the development of an individual treatment care plan for each person.
Psychoeducation lectures: A number of lectures are delivered weekly, with a focus on providing education on substance misuse and recovery, as well as approaches for managing mental health issues for example CBT and mindfulness. There is also a weekly family and service user lecture, facilitated by addiction counsellors, providing information on substance misuse and recovery to service users and their families.
Goal setting and change plan: This group is facilitated by therapists and encourages participants to put plans and structure in place for time spent outside of the hospital.
Mental health groups: This is a psychoeducational group focusing on mental health-related topics such as depression, anxiety and recovery.
Recovery plan: This group facilitates and supports participants in developing and presenting an individual recovery plan. It covers topics such as professional monitoring, community support groups, daily inventories, triggers, physical care, problem-solving, relaxation, spiritual care, balance living, family/friends and work balance etc.
Reflection: This counsellor-facilitated session provides a safe place to support the service user through the process of change and an opportunity to reflect on the extent of dependence on substances and mental health difficulties.
Family support: The allocated therapist liaises with families/significant others and facilitates family meetings while the service user is an inpatient.
Relapse prevention and management groups: This group focuses on developing successful relapse prevention and management strategies.
85 individuals with complete data were included in this analysis. These participants attended and completed the full or modified programme in 2025. Of these, 56.5% were male and 43.5% female. The mean age of the participants was 44.7 (SD = 14.5).
4.4.2
The Leeds Dependence Questionnaire (LDQ; Raistrick et al 1994) is a 10item questionnaire designed to screen psychological dependency to a variety of different substances. The LDQ was designed to be sensitive to change over time and to range from mild to severe dependence (Raistirck et al 1994).
The measure is designed to evaluate 10 markers of substance and/or alcohol dependence. The 10 items map on to the ICD-10 and DSM-IV criteria for substance dependence which include: pre-occupation with the substance; the primacy of activities associated with the substance over other activities; the perceived compulsion to continue using the substance; the way in which the user’s day is planned around procuring and using the substance; attempts to maximise the effect of the substance; the narrowing of the substance use repertoire; the perceived need to continue using the substance in order to maintain effect; the primacy of the pharmacological effect of the substance over any of its other attributes; the maintenance of the substance induced state; and the
belief that the substance has become essential to the user’s existence (Kelly, Magill, Slaymaker & Kahler, 2010).
Items are scored on a four-point scale from zero – ‘never’, to three –‘nearly always’, with higher total scores (maximum score of 30) indicating greater dependence. Analysis of the measure has shown it to have high internal consistency (alpha = .88), good test-retest reliability (r = .95) and has been shown to be a valid, psychometrically sound measure of substance dependence for alcohol and opiates (Raistrick et al 1994). The LDQ has also been suggested as an appropriate measure for use with inpatient psychiatric populations (Ford, 2003), and in evaluating the effectiveness of substance disorder treatments in adults with substance dependency (Tober, Brearley, Kenyon, Raistick & Morley, 2000).
A paired samples t-test revealed a statistically significant reduction in psychological markers of substance and/or alcohol dependency following participation in the programme, t (83) = 14.791, p < .001, with a large effect size (d = 1.61). The mean score on the total LDQ decreased from 16.01 (SD=8.27) pre-programme to 2.82 (SD=3.76) post-programme, as depicted in the Figure 4.8.
Figure 4.8 Leeds Dependency Questionnaires scores from pre- to postintervention
4.4.4 Summary
Large and significant reductions in the psychological markers of alcohol and chemical dependency, as measured by the Leeds Questionnaire, were observed for individuals who took part in the Dual Diagnosis Programme. These findings are in line with previous research and literature which regard the LDQ as a suitable tool for the evaluation of interventions for adults with substance dependency (Tober et al., 2000).
Acceptance and Commitment Therapy (ACT) is an evidence-based psychotherapy that aims to teach people mindfulness skills to help them live in the "here and now" and manage their thoughts and emotions more effectively (Gloster et el., 2020). ACT supports service users to identify and connect with their core personal values and integrate them into everyday action. Though ACT does aim to reduce symptoms, it primarily aims to change people's relationship with anxiety and depression, and to increase value-led behavioural activation (Twohig and Levin, 2017).
The ACT programme is informed by polyvagal theory. Polyvagal theory, developed by Dr Stephen Porges, is about understanding and shaping the
autonomic nervous system (part of the nervous system which regulates several bodily functions that happen unconsciously or automatically). The autonomic nervous system regulates bodily functions like heart rate, digestion and breathing and controls our mood, anxiety levels and our ability to connect, open up and engage with both ourselves and others (Porges, 2011). Many of those who struggle with mental health challenges can feel like they are spending the majority of their time in survival states due to an abundance of unwanted internal experiences, such as unwanted thoughts, feelings, urges and memories.The polyvagalinformed aspects of the ACT programme aim to help people to better understand and regulate their nervous system so that they can spend more time in a state of safety and connection.
ACT is primarily facilitated by an experienced counselling psychologist who also trains other clinicians in the ACT approach. There are two counselling psychologists on the ACT team. Each ACT course is facilitated by a counselling psychologist and a mental health nurse.
The ACT programme runs recurrently over a twelve-week period for one half-day per week, online via Microsoft Teams. During the twelve-week programme, participants engage in a range of experiential exercises to help them develop the six core processes of ACT; mindfulness, thought defusion acceptance, perspective taking, values and committed action (Blackledge and Barnes-Holmes, 2009). Participants are provided with guided recordings to accompany the experiential exercises covered in session which assists in integrating ACT processes into their daily lives. The essential aim of this programme is to help people connect with their values, what matters most to them and develop skills to help overcome the obstacles that get in the way of living a value-guided life. The programme aims to foster a key shift in terms of helping people to look at their lives in terms of workability; what helps them move closer towards who and where they want to be, and what brings them further away. The ACT programme aims to teach new skills to help people deal with difficulties they might experience in their daily life and to improve their
levels of psychological flexibility. As part of this, the ACT programme places emphasis on helping individuals to connect with their values and to develop mindfulness skills (Hayes and Strosahl, 2004).
In 2025, 48 individuals completed pre- and post-measures, including 30 females (62.5%) and 18 males (37.5%). The age of participants completing the programme ranged from 25 to 75 (mean age of 51.50).
4.5.2
The Acceptance and Action Questionnaire (AAQ II) (Bond et al, 2011) is a seven-item measure of experiential avoidance or the tendency to avoid unwanted internal experience
s – the opposite of which is psychological flexibility. The AAQ-II was developed to establish an internally consistent measure of ACT’s model of mental health and behavioural effectiveness. Service users are asked to rate statements on a seven-point Likert scale from one - ‘never true’, to seven - ‘always true’. Scores range from one to 70 with higher scores indicating reduced psychological flexibility/increased experiential avoidance. The AAQ-II has good validity, reliability (Cronbach’s alpha is .84 (.78 - .88)), and three and 12-month test-retest reliability (.81 and .79, respectively) (Bond et al, 2011).
The Behavioural Activation for Depression Scale (BADS) (Kanter et al., 2007) measures behaviours hypothesised to underlie depression and examines changes in activation, avoidance/rumination, work/school impairment and social impairment. The BADS consists of 25 questions, each rated on a seven-point scale from zero – ‘not at all’, to six –‘completely’. Scores range from zero to 150 with higher scores representing increased behavioural activation. Mean scores for a nonclinical sample of undergraduate students were 110.51 (SD = 21.04)
(Kanter et al., 2007) and for a community sample with elevated depressive symptoms the mean was 69.83 (SD =20.15) (Kanter, Rusch, Busch & Sedivy, 2009). The measure has good internal consistency (Cronbach’s α ranging from .76 - .87), adequate test-retest reliability (Cronbach’s α ranging from .60 - .76), and good construct and predictive validity (Kanter et al, 2007).
The Five Facet Mindfulness Questionnaire (FFMQ) (Baer, Smith, Hopkins, Krietmeyer & Toney, 2006) assesses the tendency to be mindful in daily life, including five facets of mindfulness; observing, describing, acting with awareness, non-reactivity to inner experience and non-judging of inner experience. The measure consists of 39 items which are responded to on a five-point rating scale ranging from one – ‘never or very rarely true’, to five ‘very often or always true’. Scores range from 39 to 195, with higher scores suggesting higher levels of mindfulness. In a study of non-clinical samples, participants who regularly practise mindfulness had a mean of 154.2 (SD = 17.5) while those who did not practise mindfulness had a mean of 138.9 (SD = 19.2) (Lykins & Baer, 2009). The measure demonstrates good reliability (alpha co-efficient ranging from .72 to .92 for each facet) (Baer et al, 2006). Evidence for construct validity comes from analysis of data from samples with mindfulness meditation and no mindfulness meditation experience (Baer et al, 2006).
The Work and Social Adjustment Scale (WSAS) is a brief five-item service user self-report measure, which assesses the impact of a person’s mental health difficulties on their ability to function in terms of work, home management, social leisure, private leisure and personal or family relationships. Participants are asked to rate impairment in each domain on a nine-point Likert scale from zero – ‘not at all’, to eight – ‘very severely’. Total scores for the measure can range from zero to 40, with higher scores indicating greater impairment in functioning. A WSAS score above 20 appears to suggest moderately severe or worse psychopathology.
Scores between 10 and 20 are associated with significant functional impairment but less severe clinical symptomatology. Scores below 10 appear to be associated with sub-clinical populations (p. 463, Mundt, Marks, Shear & Greist, 2002). The WSAS is used for service users with depression or anxiety as well as phobic disorders and has shown good validity and reliability (Mundt et al., 2002). The scores on the WSAS have been shown to be sensitive to patient differences in disorder severity and treatment-related change. Its psychometric properties have been well established across different psychopathologies. Its internal consistency, convergent/divergent validity and test–retest reliability is excellent; Cronbach's alpha measure of internal scale consistency ranged from 0.70 to 0.94. Test-retest correlation was 0.73. As an outcome measure, it is highly sensitive to treatment change in a wide range of conditions such as obsessive–compulsive disorder (OCD), bipolar disorder, phobic disorders, anxiety and depression.
The Self-Compassion Scale (SCS) is a 26-item self-report scale, which was designed to assess an individual’s level of self-compassion (Neff, 2003). Self-compassion is measured through six domains: self-kindness, selfjudgement, humanity, isolation, mindfulness and identification or overidentification with thoughts. Each item is rated on a five-point Likert scale, from one – ‘almost never’, to five – ‘almost always’.
4.5.3
Mean scores on the AAQ-II decreased significantly from (M =34.60, SD =8.41) to (M = 28.25, SD = 8.66) indicating greater psychological flexibility post-intervention, t (47) = 5.635, p <.001, with a large effect size (Cohen’s d = 0.81) (see figure 4.9).
Figure 4.9 Total mean psychological flexibility (AAQ-II) scores
Behavioural Activation for Depression Scale (BADS)
Mean BADS scores increased significantly from pre-intervention (M = 75.79, SD = 28.25) to post-intervention (M = 92.35, SD = 29.32) indicating greater behavioural activation, t (47) = -4.85, p < .001, with a medium effect size (Cohen’s d = -0.70) (see Figure 4.10).
Figure 4.10 Total mean behavioural activation (BADS) scores
Total mean FFMQ scores increased significantly from pre-intervention (M = 111.69, SD = 24.25) to post-intervention (M = 127.15, SD = 26.69), indicating greater levels of overall mindfulness, t (47) = -5.38, p < .001,
with a medium effect size observed (Cohen’s d = -0.78). Mindfulness is defined in this context as observing, describing, acting with awareness, non-reactivity to inner experience and non-judging of inner experience (Baer, Smith, Hopkins, Krietmeyer & Toney, 2006) (see Figure 4.11).
Figure 4.11 Total Mean FFMQ scores pre- and post-intervention
Total WSAS scores decreased significantly, t (47) = 3.86, p = <.001, from pre-intervention (M= 22.0, SD = 8.49) to post-intervention (M= 17.46, SD = 9.42), with a medium effect size observed (Cohen’s d = 0.56). This finding suggests that those who completed the ACT programme indicated significantly less functional impairment post-intervention (see Figure 4.12).
Figure 4.12 Total Work and Social Adjustment Scale (WSAS) scores
Total SCS scores increased significantly, t (47) = -5.12, p < .001, from pre (M = 2.42, SD = 0.71) to post (M = 2.90, SD = 0.73) indicating higher overall levels of self-compassion post-intervention. A Medium effect size was observed (Cohen’s d =-0.74) (see Figure 4.13). Self-compassion is measured in six domains: self-kindness, self-judgement, humanity, isolation, mindfulness and identification or ‘over-identification’ (see Figure 4.13).
Figure 4.13 Total Self-Compassion Scale scores pre- and post-intervention
4.5.4
In 2025, service users who completed the ACT programme showed significant gains in mindfulness, psychological flexibility/acceptance, behavioural activation, self-compassion and functioning as measured by the available psychometrics. These outcomes are consistent with findings from previous years, reflecting a sustained pattern of improvement amongst service users who complete the programme. Data since the 2011 Outcome’s report, indicate a continued trend of measurable benefits for service users, reinforcing the programme’s effectiveness.
The Anxiety Disorders Programme provides a clinical intervention programme for service users with primary anxiety disorders. The Anxiety Programme provides both group and individual intervention and support based on the cognitive behavioural therapy (CBT) model. CBT has been found to be efficacious for adult anxiety disorders (Butler, Chapman, Forman & Beck, 2006; Hofmann & Smits, 2008; Olantunji, Cisler & Deacon, 2010). All programme facilitators have received training in both CBT and mindfulness.
The programme is structured into two levels. Level 1 is a five-week programme and includes group-based psychoeducation and CBT treatment to assist service users to understand their anxiety disorders. Level 1 also provides group-based therapy through behaviour workshops. These workshops aid experiential goal work, fine tune therapeutic goals and identify possible obstacles in order to address an individual’s specific anxiety difficulties (Anderson & Rees, 2007). As part of a pilot study and quality initiative, Level 1 of the anxiety programme currently offers Virtual Reality Exposure Therapy (VRET) as an additional treatment option for service users with agoraphobia. It is used in conjunction with traditional in vivo exposure and response prevention. VRET has been shown to have comparable effect sizes to in vivo exposure (Opris et al, 2012).
Service users with more complex clinical presentations of anxiety are referred to Level 2 of the programme; a closed group which builds on therapeutic work carried out during Level 1. Level 2 consists of a CBTbased structured eight-week programme which focuses on shifting core beliefs, emotional processing and regulation and increased exposure work. Service users typically attend Level 2 following discharge from hospital as an outpatient.
A separate obsessive-compulsive disorder (OCD) strand of the Anxiety Programme provides a tailored and focused service for individuals experiencing OCD. This incorporates tasks such as challenging the meanings of obsessions and more tailored goal work.
4.6.1
Data was available for 94 people who completed the programme in 2025, in which 40 (42.6%) were male and 54 (57.4%) were female. Programme attendees ranged in age from 18 to 70 (M = 37.04; SD = 13.79). Pre and post data were collected after Level 1 and Level 2 of the anxiety programme. 79 service users availed of Level 1 and 15 attended Level 2 of the anxiety programme.
Of those individuals who provided information surrounding their primary diagnosis, OCD accounted for the largest subgroup (55.7%), followed by agoraphobia (with/without panic) (14.3%), GAD (11.4%), social phobia/ anxiety (7.1%), health anxiety (5.7%), panic disorder (2.9%), and specific phobia (2.9%). Table 4.14 below shows the percentage of people with each diagnosis over the past four years.
Table 4.14 Percentage of diagnoses for 2022, 2023, 2024 and 2025.
The following section presents a summary of the routine clinical outcome measures for the Anxiety Disorders Programme. All service users attending the Anxiety Programme complete (or are rated on) the following measures: before starting the programme, after completing Level 1 of the programme and again after completing Level 2 (if they have attended this level).
Fear Questionnaire (FQ)
The Fear Questionnaire (FQ) (Marks & Matthews, 1979) consists of 23 items that measure the extent to which potentially anxiety-provoking situations are avoided using a nine-point Likert scale ranging from zero –‘would not avoid’, to eight – ‘always avoid’. Four scores can be obtained from the Fear Questionnaire: main phobia level of avoidance, total phobia score, global phobia rating and associated anxiety and depression. For the purposes of this analysis the global phobia rating score was used. This measure has been found to be psychometrically sound with good discriminant validity and internal consistencies from .71 to .83 (Oei, Moylan, & Evans, 1991).
Yale Brown Obsessive Compulsive Scale (Y-BOCS) (Goodman et al, 1989) is widely considered the best available measure for assessing the severity of OCD and to measure the response to treatment. Taylor (1995, p. 289) states that: “When breadth of measurement, reliability, validity, and sensitivity to treatment effects are considered together, the YBOCS appears to be the best available measure for treatment outcome research.” It was designed specifically to measure the severity of OCD regardless of the type of obsessions and compulsions. The Y-BOCS enables the clinician to rate the severity of the obsessions and compulsions separately for example (five items assess obsessions and five items assess compulsions) which enables the clinician to discern between the severity of obsessions and compulsions as well as have a global score of severity and response by adding the two separate scores.
Obsessions and compulsions are each assessed on a five-point Likert scale ranging from zero – ‘no symptoms’, to four – ‘severe symptoms’, measuring the following: time spent engaging with obsessions and/or compulsions; the level of distress; the ability to resist and level of control over obsessions and compulsions. Scores are rated across five levels: sub-
clinical (0-7), mild (8-14), moderate (16-23), severe (24-31), and extreme (32-40).
The Penn State Worry Questionnaire (PSWQ) (Meyer, Miller, Metzger, & Borkovec, 1990) is designed to capture the generality, excessiveness, and uncontrollability of pathological worry. The PSWQ allows clinicians to identify individuals with generalised anxiety disorder (GAD) who present for treatment for anxiety disorders (Fresco et al, 2003).
The PSWQ is a 16-item self-report measure. Participants are asked to rate worries on a five-point Likert scale ranging from ‘not at all typical of me’, to ‘very typical of me’, capturing the generality, excessiveness and uncontrollability of pathological worry. Total scores range from 16 to 80, with higher scores indicating greater worry. The reliability and validity of the PSWQ has been widely researched, positively correlating with other self-report measures of worry and aggregate peer ratings showing it to be of sound psychometric properties.
The Social Safeness and Pleasure Scale (SSPS) (Gilbert et al., 2009), aims to measure service users’ feelings of safety, warmth, acceptance and belonging within their social world. The measure is a brief 11-item, fivepoint Likert scale, with responses ranging from zero – ‘almost never’, to four – ‘almost all the time’. Previous research has suggested that this scale’s psychometric reliability is good (α =.92; Gilbert et al., 2009). This instrument was administered at two-time points, pre and post Level 2.
The Social Phobia Inventory (SPIN) (Connor et al, 2000) is a 17-item questionnaire developed by the Psychiatry and Behavioural Sciences Department at Duke University. The Social Phobia Inventory (SPIN) provides a patient-rated assessment of the three clinically important symptom domains of social phobia (fear, avoidance and physiological
symptoms), with the practical advantages of brevity, simplicity and ease of scoring. The SPIN, which demonstrates solid psychometric properties, can be used as a valid measure of severity of social phobia symptoms and is sensitive to the reduction in symptoms over time.
The Agoraphobia scale (Bandelow, 1995) consists of 20 items depicting various typical agoraphobic situations, which are rated for anxiety/discomfort (0-4) and avoidance (0-2). The Agoraphobia Scale has high internal consistency. Regarding concurrent validity it correlated significantly with other self-reported measures of agoraphobia (Mobility Inventory and Fear Questionnaire). This instrument was also administered at two time points, pre and post Level 1.
The Rosenberg Self Esteem Scale (RSES) is a ten-item scale that measures self-esteem on a four-point Likert-type scale — from strongly agree, to strongly disagree. The RSES is one of the most widely used measures of self-esteem (Sinclair et al., 2010). Self-esteem is not a singular construct and has been divided equally to measure two 5-item facets; self-competence and self-liking. The minimum total score is 0 and the maximum is 30, with higher scores representing higher self-esteem. To interpret the RSES, scores of 0-14 indicate low self-esteem, scores of 15-25 are within normal range, and scores above 25 indicate high selfesteem. The scale has good predictive validity, as well as internal consistency and test–retest reliability (Schmitt & Allik, 2005; Torrey, Mueser, McHugo, & Drake, 2000).
The Work and Social Adjustment Scale (WSAS) is a brief five-item service user self-report measure, which assesses the impact of a person’s mental health difficulties on their ability to function in terms of work, home management, social leisure, private leisure and personal or family relationships. Participants are asked to rate impairment in each domain on
a nine-point Likert scale from zero – ‘not at all’, to eight – ‘very severely’. Total scores for the measure can range from zero to 40, with higher scores indicating greater impairment in functioning. A WSAS score above 20 appears to suggest moderately severe or worse psychopathology. Scores between 10 and 20 are associated with significant functional impairment but less severe clinical symptomatology. Scores below 10 appear to be associated with sub-clinical populations (p. 463, Mundt, Marks, Shear & Greist, 2002). The WSAS is used for service users with depression or anxiety as well as phobic disorders and has shown good validity and reliability (Mundt et al., 2002). The scores on the WSAS have been shown to be sensitive to patient differences in disorder severity and treatment-related change. Its psychometric properties have been well established across different psychopathologies. Its internal consistency, convergent/divergent validity and test–retest reliability is excellent; Cronbach's alpha measure of internal scale consistency ranged from 0.70 to 0.94. Test-retest correlation was 0.73. As an outcome measure, it is highly sensitive to treatment change in a wide range of conditions such as obsessive–compulsive disorder (OCD), bipolar disorder, phobic disorders, anxiety and depression.
Due to lower response rates on several outcome measures within L1 of the Anxiety Programme, the sample size was insufficient to conduct paired-samples t-tests. Specifically, there were not enough matched preand post-intervention responses from the same participants to support the analysis. As a result, statical comparison of change over time was not possible. Instead, pre- and post-intervention mean scores were calculated and compared to provide an overview of trends in the data for those measures.
Analysis using a paired sample t-test revealed a statistically significant change between pre- and post-intervention at Level 1 on the Global
Phobia rating scores within the Fear Questionnaire, t (78) = 11.958, p < .001. The mean Global Phobia score decreased from 72.47 (SD = 24.48) to 53.61 (SD = 24.97), with a large effect size observed (Cohen’s d=1.35) (see Figure 4.15).
Figure 4.15 Fear Questionnaire mean Global Phobia rating scores pre- and post-intervention for 2024.
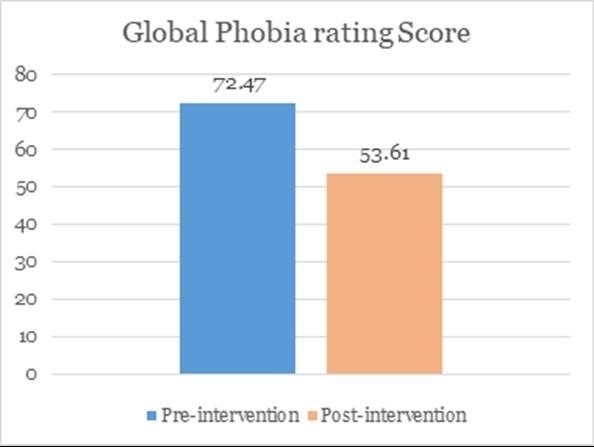
The Yale Brown Obsessive Compulsive Scale (Y-BOCS)
OCD symptomatology as measured by the Y-BOCS reduced from pre intervention to post-intervention. Analysis using a paired samples t-test indicated that scores on this measure decreased significantly, t (38) = 4.03, p <.001, with the total mean score changing from 24.46 (SD = 4.83) to 19.44 (SD = 9.64). This indicates an overall significant reduction in the severity of OCD symptoms post-intervention with a medium to large effect size (Cohen’s d = 0.65) (see Figure 4.16).
Figure 4.16 Yale Brown Obsessive Compulsive Scale mean total scores pre- and post-intervention for 2022, 2023, 2024 and 2025.
Due to smaller response rate for this measure (N=12), a paired samples ttest was not possible. However, comparison of service user mean scores on the Penn State Worry Questionnaire indicated a decrease in scores from pre-intervention (M = 59.83; SD = 6.95) to post-intervention (M = 53.17; SD = 11.17). This finding suggests that participants experienced a reduction in worry following the programme (see Figure 4.17).
Figure 4.17 Penn State Worry Questionnaire mean scores pre- and postintervention for 2024.
Due to smaller response rate for this measure (N=12), a paired samples ttest was not possible. However, comparison of service user mean scores on the Social Phobia Inventory (SPIN) indicated a decrease in scores from pre-intervention (M = 42.08; SD = 11.64) to post-intervention (M = 34.17; SD = 12.06), reflecting improvements in social anxiety symptoms among individuals who engaged with the programme (see Figure 4.18).
Figure 4.18 Social Phobia Inventory mean scores pre and post intervention in 2022, 2023, 2024 and 2025.
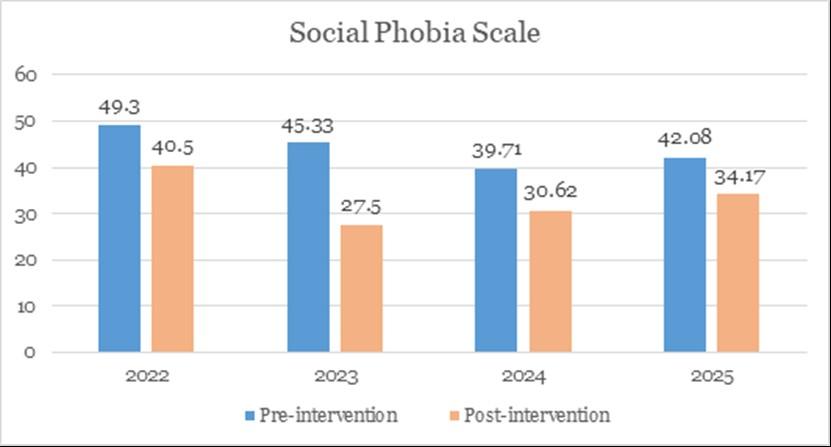
Social Phobia Scale
Analysis of the Work and Social Adjustment scale (WSAS) using a paired samples t-test indicated that there was a statistically significant reduction in mean scores observed, t (78) = 9.14, p < .001, from pre-intervention (M = 26.39, SD = 9.12) to post-intervention (M = 19.16, SD = 8.77) at Level 1. This result reflected a large effect size (Cohen’s d = 1.03) and suggests an improvement in participants functioning across work, home management, social, private leisure, and relationships (see Figure 4.19)
Figure 4.19 Work and Social Adjustment Scale Group mean score pre- and post-intervention for 2022, 2023, 2024 and 2025.
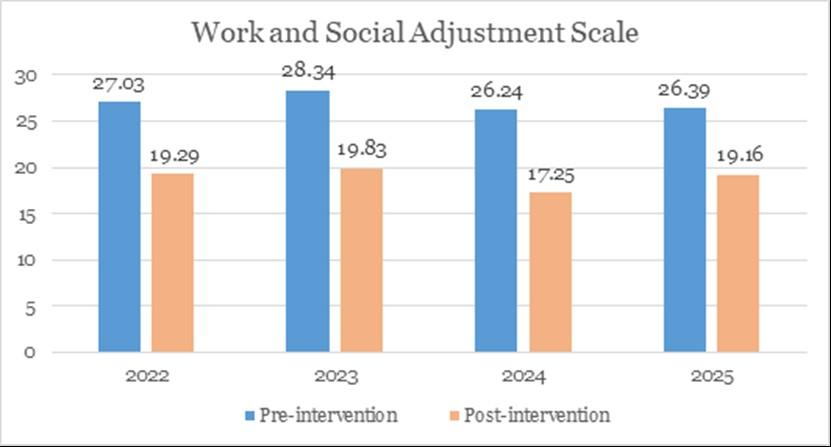
Due to smaller response rate for this measure (N=22), a paired samples ttest was not possible. However, comparison of service user mean scores on the Agoraphobia Scale indicated a decrease in scores from preintervention (M = 62.95; SD = 27.92) to post-intervention (M = 49.45; SD = 27.75) (see Figure 4.20).
Figure 4.20 The Agoraphobia Scale mean scores pre and post-intervention for 2022, 2023, 2024 and 2025.
Results were examined and compared in greater detail including overall mean, individual and cycle scores. Due to the small sample size, statistical analysis of the outcome measures was not possible. The small sample size is due to the fact that this programme is a specialist intervention delivered to a small group of service users, to meet their specific therapeutic needs. Acceptable power was not achieved to reliably conduct statistical operations on the data. G*Power analysis indicated that in order to achieve sufficient statistical power, a sample size of 27 participants would have been required to detect a medium effect size (Cohen’s d=0.5). Therefore, for each measure individual results for the 15 participants who returned both pre and post measures are given to reflect the outcome of the intervention.
Due to the small sample size, changes in the FQ scores were analysed using the Reliable Change Index (RCI) for each participant. To ensure that changes in FQ scores were not attributable to chance or measurement error, a reliable change index (RCI) was calculated for each participant using the Jacobson-Truax method (1991). In accordance with this method, statistically reliable change was reflected by RCI values equal to or larger than 1.96. Participants were classified as “reliable improvement” (passed RCI criterion but the score did not decrease below FQ cut-off score), “no reliable change” (did not pass RCI criterion) or “reliable deterioration” (passed RCI criterion but symptom score increased). One participant (6.67%) reported reliable improvement, and fourteen participants reported uncertain change (93.33%) (see table 4.20).
Table 4.20 Results from Reliable Change Index (RCI) for the FQ pre and post scores for each group member.
Figure 4.21 The Fear Questionnaire, Mean Symptom pre and postintervention
Comparison of service user mean scores on the Fear Questionnaire indicated a decrease in scores from pre-intervention (M = 50.00; SD = 29.00) to post-intervention (M = 35.13; SD = 29.30) (see Figure 4.21).
Further examination of the individual scores indicates that 14 out of 15 (93.33%) participants showed a reduction in total scores from preintervention to post-intervention (see Figure 4.22).
Figure 4.22 Pre and post individual scores of the Fear Questionnaire.
The Social Safeness and Pleasure Scale (SSPS)
Comparison of service user mean scores on the Social Safeness and Pleasure Scale indicated an increase in scores from pre-intervention (M = 33.60; SD = 10.31) to post-intervention (M = 40.93; SD = 10.89) (see Figure 4.23).
Figure 4.23 The Social Safeness and Pleasure Scale mean scores pre and post-intervention
Social Safeness and Pleasure Scale mean total
Further examination of the individual scores indicates that 13 out of 15 (86.7%) participants showed an increase in the Social Safeness and
Pleasure Scale total scores from pre-intervention to post-intervention (see Figure 4.24).
Figure 4.24 Pre and post individual scores of the Social Safeness and Pleasure Scale.
Social Safeness and Pleasure Scale Individual Total Scores
Pre Post
Comparison of service user mean scores on the Rosenberg Self-Esteem Scale indicated an increase in scores from pre-intervention (M = 18.40; SD = 5.89) to post-intervention (M = 20.47; SD = 7.02) (see Figure 4.25).
Figure 4.25 The Social Safeness and Pleasure Scale mean scores pre and post-intervention
Rosenberg Self-Esteem Scale mean total Scores
Further examination of the individual scores indicates that 11 out of 15 (73.3%) participants showed an increase in the Rosenberg Self-Esteem Scale total scores from pre-intervention to post-intervention (see Figure 4.26).
Figure 4.26 Pre and post individual scores of the Rosenberg Self-Esteem Scale.
Rosenberg Self-esteem Scale Total Scores
4.6.5 Summary
Level 1: Outcomes for the service users who completed Level 1 of the Anxiety Programme between January and December 2025 suggested significant reductions in anxiety and depression symptoms, OCD symptoms and reductions in pathological worrying and social anxiety; in line with previous years.
Level 2: Outcomes for the service users who completed pre and post measures at Level 2 of the Anxiety Disorders Programme in 2025 suggest further increases in feelings of safety, warmth, acceptance and belonging within their social world as well as self-esteem.
Changes in scores for most measures have been consistently positive across the data since 2011, following both Level 1 and Level 2, indicating that the Anxiety Disorders programme continues to be a reliable and effective support to those who have completed the programme.
The Bipolar Recovery Programme uses models and principles from Cognitive Behaviour Therapy (CBT), Compassion-Focused Therapy (CFT) and Mindfulness Based Stress Reduction (MBSR). It is run by a team of mental healthcare professionals with a wide range of experience and expertise, including cognitive behavioural therapists and specialist mental health nurses. Further support is provided by a multidisciplinary team (MDT), including a consultant psychiatrist, occupational therapist, pharmacist, and social worker.
There are three elements to the Bipolar Recovery Programme. Of note, in previous years, the programme also included the Bipolar Seminar Series. However, the content of the seminar series has now been incorporated into the other elements of the programme to more effectively deliver this content.
The Bipolar Programme Workshop takes place while the service user is an inpatient in SPMHS or receiving care through our Homecare service. This
single-session workshop is a chance for the service user to develop an initial understanding of bipolar disorder, the signs and symptoms, the phases of recovery, the triggers, and the treatment options available.
The Bipolar Recovery Programme is a group programme available to service users who attend as a day service user, one day per week for 10 weeks. It involves psychoeducation, which is a process of providing people with information and education about their mental health difficulties. The programme content includes psychoeducation on recognising changes in mood, sleep hygiene, and awareness of triggers and early warning signs. The programme also provides peer support and guidance through the group experience, which has been found to be very beneficial in the recovery process.
The Bipolar Aftercare Programme is a group available one half-day per month, to people who have completed the Bipolar Recovery Programme. It gives the service user the chance to continue developing skills around managing their bipolar disorder. This group focuses on developing selfcompassion and mindfulness and provides ongoing supports for service users throughout their recovery.
4.7.1
Paired data were available for 10 service users who completed the programme in 2025: 5 females (50%) and 5 males (50%). The age profile of participants ranged from 21 to 73 years, with the average age being 52.4 years.
4.7.2
The Work and Social Adjustment Scale (WSAS)
The Work and Social Adjustment Scale (WSAS) is a brief five-item service user self-report measure, which assesses the impact of a person’s mental health difficulties on their ability to function in terms of work, home
management, social leisure, private leisure and personal or family relationships. Participants are asked to rate impairment in each domain on a nine-point Likert scale from zero – ‘not at all’, to eight – ‘very severely’. Total scores for the measure can range from zero to 40, with higher scores indicating greater impairment in functioning. A WSAS score above 20 appears to suggest moderately severe or worse psychopathology. Scores between 10 and 20 are associated with significant functional impairment but less severe clinical symptomatology. Scores below 10 appear to be associated with sub-clinical populations (p. 463, Mundt, Marks, Shear & Greist, 2002). The WSAS is used for service users with depression or anxiety as well as phobic disorders and has shown good validity and reliability (Mundt et al., 2002). The scores on the WSAS have been shown to be sensitive to patient differences in disorder severity and treatment-related change. Its psychometric properties have been well established across different psychopathologies. Its internal consistency, convergent/divergent validity and test–retest reliability is excellent; Cronbach's alpha measure of internal scale consistency ranged from 0.70 to 0.94. Test-retest correlation was 0.73. As an outcome measure, it is highly sensitive to treatment change in a wide range of conditions such as obsessive–compulsive disorder (OCD), bipolar disorder, phobic disorders, anxiety and depression.
The Goldberg Mania Scale is a self-administered questionnaire designed to measure the severity of manic thinking and behavior. This tool was designed by Dr Ivan K Goldberg MD. This tool is not designed to diagnose any psychiatric disorder. It is only intended to measure the severity of manic symptoms. The test is made up of eighteen questions. The higher the number, the more severe the mania. If you take the questionnaire again weekly or monthly, changes of five or more points between tests may be significant. This questionnaire is only valid for people aged 18 or older and where symptoms have caused distress and/or interfered with functioning in one or more important areas of life such as home, work, school, or interpersonal relationships. Screening test scoring ranges: 0-9 =
no mania likely; 10-17 = possibly mildly manic, or hypomanic; 18-21 = borderline mania; 22-35 = mild-moderate mania; 36-53 = moderatesevere mania; 54 and up = severely manic.
The Quick Inventory of Depression Symptomatology (QIDS) (Rush et al., 2003) is a 16-item measure used to assess the severity of depression symptoms. The items cover the nine diagnostic domains of depression as identified in the DSMS-IV: sad mood, concentration, self-criticism, suicidal ideation, interest, energy/fatigue, sleep disturbance and decrease or increase in appetite. It utilises a four-point rating scale, with a score of zero = none, one = mild, two = moderate, three = severe and, four = very severe. Total scores range from 0 - 27. The QIDS has been found to have high internal consistency with a Cronbach’s alpha of 0.83. The QIDS is based on the 30-item IDS questionnaire, for which it has good concurrent validity (Ware et al, 1996). The IDS is shown to have comparative sensitivity and specificity to the IDS the HRSD (Rush et al. 1996, 2000, 2003, in press), BDI (Rush et al. 1996), MADRS and SCL-90 (Corruble et al. 1996).
Results were examined and compared in greater detail including overall mean, individual and cycle scores. Due to the small sample size, statistical analysis of the outcome measures was not possible. The small sample size is due to the fact that this programme is a specialist intervention delivered to a small group of service users, to meet their specific therapeutic needs. Acceptable power was not achieved to reliably conduct statistical operations on the data. G*Power analysis indicated that in order to achieve sufficient statistical power, a sample size of 27 participants would have been required to detect a medium effect size (Cohen’s d=0.5). Therefore, for each measure individual results for the 10 participants who returned both pre and post measures are given to reflect the outcome of the intervention.
Comparison of service user mean scores on the WSAS indicated a decrease in impairment functioning from pre-intervention (M = 10.20, SD = 7.13) to post intervention (M= 7.70, SD = 8.14).
Figure 4.27 Total mean scores pre and post-intervention of the Work and Social Adjustment Scale (WSAS).
As can be seen from Figure 4.28, further examination of the individual scores indicates that six out of ten participants (60%) demonstrated a reduction in WSAS scores from pre-intervention to post-intervention.
Three out of ten (30%) participants demonstrated an increase in WSAS scores, and one participant demonstrated no change in scores (10%).
Figure 4.28 Pre and post individual scores of the Work and Social Adjustment Scale (WSAS).
There was a decrease in total scores for the Goldberg Mania Scale from pre- intervention (M = 20.00, SD = 18.40) to post-intervention (M = 10.80, SD= 10.73) This finding indicates that those who completed the bipolar programme in 2025 had a reduction in mania symptoms post-intervention (see Figure 4.29).
Figure 4.29 Total Goldberg Mania Scale mean scores pre and postintervention
Due to the small sample size, changes in the Goldberg scores were analysed using the Reliable Change Index (RCI) for each participant. To ensure that changes in Goldberg scores were not attributable to chance or measurement error, a reliable change index (RCI) was calculated for each participant using the Jacobson-Truax method (1991). In accordance with
this method, statistically reliable change was reflected by RCI values equal to or larger than 1.96. Participants were classified “reliable improvement” (passed RCI criterion), “uncertain change” (did not pass RCI criterion) or “reliable deterioration” (passed RCI criterion but symptom score increased). Results from the RCI demonstrated that four out ten participants (40%) demonstrated reliable improvement, and five out of ten participants (50%) demonstrated Uncertain change, and one participant demonstrated Reliable Deterioration (10%) (see table 4.30).
Table 4.30 Results from Reliable Change Index (RCI) for the Goldberg Mania Scale pre and post scores for each group member.
As can be seen from Figure 4.31, further examination of the individual scores indicates that six out of ten participants (60%) demonstrated a reduction in Goldberg scores from pre-intervention to post-intervention. Three out of ten participants (30%) demonstrated an increase in Goldberg scores, and one participant (10%) demonstrated no change in scores from pre-intervention to post-intervention.
Figure 4.31 Pre and post individual scores of Goldberg Mania Scale.
Quick Inventory of Depression Symptomatology (QIDS)
Comparison of service user mean scores on the QIDS indicated an increase of depression severity scores from pre-intervention (M = 6.50, SD = 5.38) to post-intervention (M = 7.10, SD = 6.05) (see Figure 4.32).
Figure 4.32 Total QIDS mean scores pre and post-intervention
As can be seen from Figure 4.33, further examination of the individual scores indicates that three out of ten participants (30%) demonstrated a reduction in QIDS scores from pre-intervention to post-intervention. Six out of ten participants (60%) demonstrated an increase in scores, and one participant (10%) demonstrated no change in scores pre-intervention to post-intervention.
Figure 4.33 Pre and post individual scores of the QIDS.
4.7.4
This is the fourth year the bipolar programme has been included in the SPMHS Outcomes Report. The aim of the programme is to improve overall functioning and reduce the severity of bipolar symptoms such as mania and depression. In 2025, of those who completed the programme, 10 people completed outcome measures. Three measures were used to assess the efficacy of the programme; the WSAS, which examines functioning impairment; the Goldberg Mania Scale which examines mania symptoms and the QIDS which assesses depression symptoms. The findings indicate that those who completed the programme in 2025 yielded overall reductions in their functioning impairment as measured by the WSAS, alongside decreases in manic symptomatology on the Goldberg Mania Scale. This suggests that the programme was associated with measurable improvements in daily functioning and mood regulation.
Increases in mean QIDs scores may be influenced by the presence of outliers seen in individual scores above. Compared with previous years, several service users presented with higher levels of manic symptoms at assessment and had experienced bereavements before commencing the programme. These factors likely contributed to the observed rise in overall scores.
The Building Healthy Self-Esteem (BHSE) Programme is designed to help individuals build healthy self-esteem using cognitive behavioural therapy. The course is aimed for service users with low self-esteem. This can be debilitating phenomenon often leading to, or exacerbating, anxiety and/ or depression. CBT can help the individual address their low self-esteem and develop a more positive attitude towards themselves, whereby the individual acts in an accepting, respectful and trusting manner towards themselves. The group is facilitated by a team of mental health professionals, including a cognitive behavioural therapist and nurses with expertise in cognitive psychotherapy, compassion- focused therapy and mindfulness-based stress reduction. The programme runs for a half day a week for 10 weeks over Microsoft Teams.
4.8.1 Descriptors
Complete pre- and post-outcome data were available for 22 people. Thirteen participants (59.1%) were female and nine (40.9%) were male. Participants ages ranged from 23 to 69 years with an average age of 46.77 years old.
4.8.2 Building Healthy Self-Esteem Programme outcome measures
The Work and Social adjustment scale (WSAS) was introduced as a new outcome measure within the Building Healthy Self-Esteem programme in 2025 to assess changes in functional impairment. Its inclusion enables the evaluation of improvements in day-to-day functioning and overall quality of life, complementing existing mental health and self-esteem measures.
Rosenberg Self Esteem Scale (RSES)
The Rosenberg Self Esteem Scale (RSES) is a ten-item scale that measures self-esteem on a four-point Likert-type scale — from strongly agree, to strongly disagree. The RSES is one of the most widely used measures of self-esteem (Sinclair et al., 2010). Self-esteem is not a singular construct and has been divided equally to measure two 5-item facets; self-competence and self-liking. The minimum total score is 0 and
the maximum is 30, with higher scores representing higher self-esteem. To interpret the RSES, scores of 0-14 indicate low self-esteem, scores of 15-25 are within normal range, and scores above 25 indicate high selfesteem. The scale has good predictive validity, as well as internal consistency and test–retest reliability (Schmitt & Allik, 2005; Torrey, Mueser, McHugo, & Drake, 2000).
The Generalised Anxiety Disorder-7 (GAD-7)
The Generalised Anxiety Disorder-7 (GAD-7) is a seven-item self-report measure which assesses the presence and severity of GAD symptoms over the past two weeks (Spitzer, Kroenke, Williams, & Löwe, 2006). A score of eight or greater represents a reasonable cut-point for identifying probable cases of generalised anxiety disorder. Research has demonstrated the reliability and validity of the GAD-7 in both primary care settings and the general population (Löwe et al., 2008).
The Patient Health Questionnaire-9 (PHQ-9)
The PHQ-9 is a nine-item self-report questionnaire. It is a clinically validated screening tool that healthcare providers use to monitor the severity of depression and response to treatment (Kroenke, Spitzer, Williams, 2001). The questions address sleep, energy, appetite, and other possible symptoms of depression. It assesses how often service user has “been bothered by any of the following problems” in the past two weeks. Scores are calculated based on how frequently a person experiences these feelings and aims to predict the presence and severity of depression. Scores represent: 0-5 = mild, 6-10 = moderate, 11-15 = moderately severe anxiety, 15-21 = moderately severe and 15-21 = severe depression.
The Work and Social Adjustment Scale (WSAS)
The Work and Social Adjustment Scale (WSAS) is a brief five-item service user self-report measure, which assesses the impact of a person’s mental health difficulties on their ability to function in terms of work, home management, social leisure, private leisure and personal or family relationships. Participants are asked to rate impairment in each domain on
a nine-point Likert scale from zero – ‘not at all’, to eight – ‘very severely’. Total scores for the measure can range from zero to 40, with higher scores indicating greater impairment in functioning. A WSAS score above 20 appears to suggest moderately severe or worse psychopathology. Scores between 10 and 20 are associated with significant functional impairment but less severe clinical symptomatology. Scores below 10 appear to be associated with sub-clinical populations (p. 463, Mundt, Marks, Shear & Greist, 2002). The WSAS is used for service users with depression or anxiety as well as phobic disorders and has shown good validity and reliability (Mundt et al., 2002). The scores on the WSAS have been shown to be sensitive to patient differences in disorder severity and treatment-related change. Its psychometric properties have been well established across different psychopathologies. Its internal consistency, convergent/divergent validity and test–retest reliability is excellent; Cronbach's alpha measure of internal scale consistency ranged from 0.70 to 0.94. Test-retest correlation was 0.73. As an outcome measure, it is highly sensitive to treatment change in a wide range of conditions such as obsessive–compulsive disorder (OCD), bipolar disorder, phobic disorders, anxiety and depression.
4.8.3 Results
The Rosenberg Self Esteem (RSES) Questionnaire
There was an increase in total Self Esteem scores for the RSES from preintervention (M = 10.82; SD = 5.59) to post-intervention (M = 16.64; SD = 5.44) This finding indicates that those who completed the BHSE programme in 2025 had an increase in their self-esteem post-intervention (see Figure 4.34).
Figure 4.34 Pre and post mean scores of the Rosenberg Self Esteem Scale (RSES).
Due to the small sample size, changes in the RSES scores were analysed using the Reliable Change Index (RCI) for each participant. To ensure that changes in RSES scores were not attributable to chance or measurement error a RCI was calculated for each participant using the Jacobson-Truax method (1991). In accordance with this method, statistically reliable change was reflected by RCI values larger than or equal to 1.96.
Participants were classified as “reliable improvement” (passed RCI criterion and symptom score increased), “uncertain change” (did not pass RCI criterion) or “deterioration” (passed RCI criterion but symptom score decreased) (see table 4.35 below).
Table 4.35 Results from Reliable Change Index (RCI) for the RSES pre and post scores for each group member.
Further examination of the individual scores indicates that twenty-one out of twenty-two participants (95.5%) demonstrated an increase in RSES scores from pre-intervention to post-intervention. In addition, ten out of twenty-two (45.45%) participants moved from the low self-esteem to normal self-esteem range of the scale and one participant (4.5%) moved from the normal self-esteem to high self-esteem (see Figure 4.36).
Figure 4.36 Pre and post individual scores of the Rosenberg Self-Esteem Scale (RSES).
There was a decrease in total scores for the GAD-7 from pre- intervention (M = 8.09; SD = 5.56) to post-intervention (M = 5.45; SD = 5.15). This finding indicates that those who completed the BHSE programme in 2025 had a decrease in symptoms related to anxiety (see Figure 4.37).
Figure 4.37 Pre and post mean scores of the Generalised Anxiety Disorder-7 (GAD-7) Scale.
Mean Scores Comparison
Further examination of the individual scores indicates that sixteen out of twenty-two participants (72.7%) demonstrated a decrease in GAD-7 scores from pre-intervention to post-intervention (see Figure 4.38).
Figure 4.38. Pre and post individual scores of the Generalised Anxiety Disorder-7 (GAD-7) Scale.
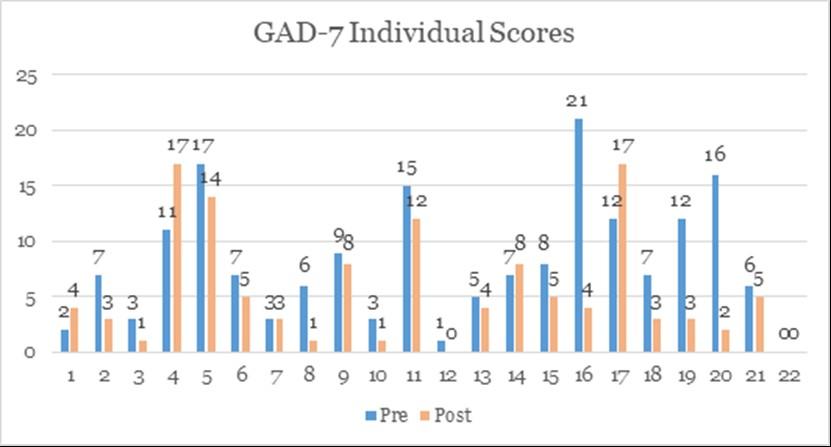
The Patient Health Questionnaire-9 (PHQ-9)
There was a decrease in total scores for the PHQ-9 from pre- intervention (M = 12.05; SD = 7.38) to post-intervention (M = 7.23; SD = 5.77). This finding indicates that those who completed the BHSE programme in 2025 had a decrease in symptoms related to depression (see Figure 4.39).
Figure 4.39 Pre and post mean scores of the Patient Health Questionnaire9 (PHQ-9).
Further examination of the individual scores indicates that nineteen out of twenty-two participants (86.4%) demonstrated a decrease in PHQ-9 scores from pre-intervention to post-intervention (see Figure 4.40).
Figure 4.40 Pre and post individual scores of the Patient Health Questionnaire-9 (PHQ-9).
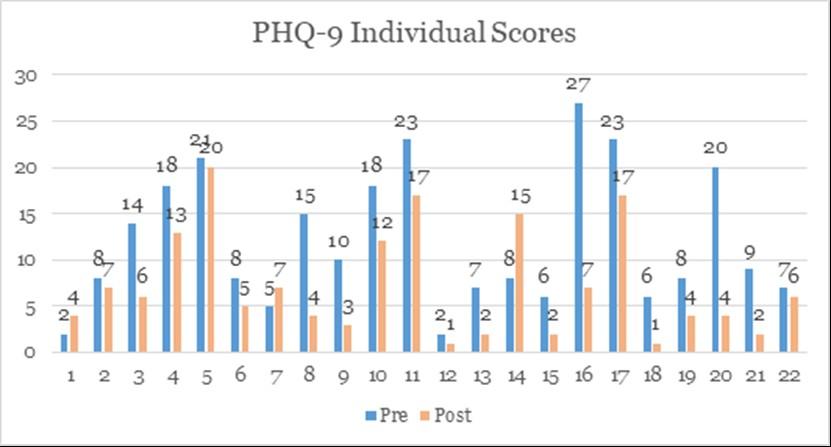
Comparison of service user mean scores on the WSAS indicated a decrease in functional impairment from pre-intervention (M = 16.45; SD = 10.36) to post intervention (M = 10.09; SD = 7.54).
Figure 4.41 Total mean scores pre and post-intervention of the Work and Social Adjustment Scale (WSAS).
As can be seen from Figure 4.42, further examination of the individual scores indicates that fourteen out of twenty-two participants (63.6%) demonstrated a reduction in WSAS scores from pre-intervention to postintervention. Four participants (18.2%) demonstrated an increase in scores while four (18.2%) experienced no change in scores.
Figure 4.42 Pre and post individual scores of the Work and Social Adjustment Scale (WSAS).
Individual Scores
The Building Healthy Self-Esteem Programme has been run in St Patrick’s Mental Health Services for four years. Overall, the results indicate that participants who completed the Building Healthy Self-esteem programme in 2025 experienced improvements across all outcome measures. Selfesteem scores increased post-intervention, while symptoms of anxiety
and depression appeared to decrease from pre-intervention to postintervention indicating reduced symptom severity. Functional impairment also reduced, as measured by the WSAS, suggesting improved day-to-day functioning and quality of life. The findings indicate positive clinical and functional outcomes following programme completion.
Compassion-Focused Therapy (CFT) was developed by Prof Paul Gilbert for individuals with mental health difficulties linked to high levels of shame and critical thinking (Gilbert, 2009; Leaviss & Uttley, 2014). It is an integrative, multi-modal approach that draws on evolutionary psychology, neuroscience, attachment theory, cognitive behaviour therapy, mindfulness, and compassion-focused practices. CFT recognises the importance of being able to engage with our suffering in a compassionate way and helps people to respond to distress and challenging emotions (Kolts, 2016).
Research has demonstrated the importance of self-compassion for psychological functioning (Neff & Germer, 2017). Jazaeir et al. (2012) identified compassion as a predictor of psychological health and wellbeing and found that it was associated with fewer negative feelings and stress, as well as more positive feelings and greater social connectedness. A systematic review conducted by Leaviss & Uttley (2014) suggested CFT as a particularly helpful intervention for service users experiencing high shame and criticism. Research has found that CFT is associated with reductions in depression, anxiety, shame and self-criticism, and increased ability to self-soothe in response to emotional distress (Lucre & Corten, 2012).
Research conducted in SPMHS demonstrated that group CFT was effective in reducing symptoms of mental ill health for service users who attended
the group. These findings were associated with improvements in selfcriticism and fears of self-compassion (Cuppage, Baird, Gibson, Booth & Hevey, 2017). A further research study carried out at SPMHS investigated subjective bodily changes associated with attending a transdiagnostic CFT group (Mernagh, Baird & Guerin, 2020). Results suggest that service users who attended the CFT group developed an increase in mind-body attunement. That is, they developed their capacity to listen to, and trust, their own bodily sensations as a source of important information about their emotions, as well as to regulate their emotions through responding to associated physical sensations with increased compassion and understanding.
The Compassion-Focused Therapy (CFT) group commenced in SPMHS in 2014 and is facilitated by the psychology department. In 2022, the CFT programme implemented a new structure including a Level 1 Introduction to CFT Psychoeducation Group, followed by a Level 2 Therapy Group aimed to reduce the waiting times for service users wishing to access the CFT group. As this effectively reduced waiting times, the CFT programme returned to its original structure of combined psychoeducation and therapy within the 18-session model CFT group. It was felt that the combined structure was the best fit for the needs of the current service users and staff group. Six cycles of the CFT group ran in 2025.
CFT is an effective intervention for many mental health difficulties, and the group format offers a secure base with the potential to have corrective experiences with multiple others (Craig et al, 2020; Greiner et al, 2022). The focus of the CFT Therapy Group is to move towards a more experiential therapeutic experience, where service users are given opportunities to further explore their emotional learning, as well as how their fears, blocks and resistances to compassion have developed in the context of their life experiences. The group provides a safe space for service users to engage in chair work which highlights how the human ‘multi-mind’ is formed of various motivations, emotions, and cognitive
competencies (Gilbert, 2010). CFT chair work also specifically utilizes the compassionate self and the compassionate mind as a framework to consolidate, embody and enact the skills, attributes, and motivations of compassion (Gilbert, 2010).
4.9.2
40 service users completed the CFT in 2025. Pre and post data was available for 28 individuals who completed the CFT programme in SPMHS in 2025. 71.4% of these were female (N = 20) and 28.6% were male (N = 8). Programme attendees ranged in age from 27 to 62 years old with a mean age of 46 (M =45.79, SD= 9.86). The programme had 70% return rate of outcome measures in 2025.
4.9.3
All service users attending the CFT Therapy Group in SPMHS are invited to complete the following measures before starting the programme, and again after completion. These measures were selected based on their use in published international scientific research relating to compassionfocused therapy and having established reliability and validity (Lovibond & Lovibond, 1995; Gilbert et al, 2011; Gilbert et al, 2014).
Depression Anxiety and Stress Scales (DASS-21)
The 21-item Depression, Anxiety and Stress Scale (DASS-21) is a set of three self-report scales designed to measure depression, anxiety and stress. Each of the three DASS-21 scales contain seven items, divided into sub-scales with similar content. Each item comprises a statement and four short response options to reflect severity. They are scored from zero – ‘did not apply to me at all’, to three – ‘applied to me very much, or most of the time’. The Depression Scale assesses dysphoria, hopelessness, devaluation of life, self-deprecation, lack of interest/involvement, anhedonia and inertia. The Anxiety Scale assesses autonomic arousal, skeletal muscle effects, situational anxiety and subjective experience of anxious affect. The stress scale is sensitive to levels of chronic nonspecific arousal. It assesses difficulty relaxing, nervous arousal and being
easily upset/agitated, irritable/over-reactive and impatient. The DASS-21 is based on a dimensional rather than a categorical conception of psychological disorder. The assumption on which the DASS-21 development was based (and which was confirmed by the research data) is that the differences between the depression, anxiety and the stress experienced by non-clinical populations and clinical populations are essentially differences of degree. Cronbach alphas were .66 for the Anxiety Scale, .91 for the Depression Scale and .82 for the Stress Scale.
The Fears of Compassion Scale (FCS) consists of three subscales measuring: fear of compassion for self (for example “I fear that if I am too compassionate towards myself bad things will happen”); fear of compassion from others (for example “I try to keep my distance from others even I know they are kind); and fear of compassion for others (for example “Being too compassionate makes people soft and easy to take advantage of”) (Gilbert, McEwan, Matos & Rivis, 2011). The scale consists of 38 items in total, each rated on a five-point Likert scale from zero –‘don’t agree at all’, to four – ‘completely agree’. Higher scores are indicative of greater fears of self-compassion. Cronbach alphas were .89 for the fear of compassion for others scale, .89 for the fear of compassion from others scale, and .86 for the fear of compassion to self-scale.
The FSCRS was developed by Gilbert, Clarke, Hempel, Miles and Irons (2004). This scale was developed to measure self-criticism and the ability to self-reassure. It is a 22-item scale that measures different ways people think and feel about themselves when things go wrong for them. The items make up three components, there are two forms of self-criticalness: inadequate self (“I am easily disappointed with myself”); and hated self (“I have become so angry with myself that I want to hurt or injury myself”), and one form to self-reassure (“I am able to remind myself of positive things about myself”). The responses are given on a five-point Likert scale
ranging from zero – ‘not at all like me, to four – ‘extremely like me’. Cronbach alphas were .89 for the inadequate self-scale, .89 for the hated self-scale, and .85 for the reassured self-scale.
Compassionate Engagement and Action Scales (CEAS)
The Compassionate Engagement and Action Scales (CEAS) are three separate scales measuring compassion to self, compassion to others and compassion experienced from others (Gilbert et al, 2017). Each scale consists of 13 items which generate an engagement subscale (ie. motivation to care for wellbeing, attention/sensitivity to suffering, sympathy, distress tolerance, empathy, being accepting and nonjudgmental) and an action sub-scale (ie. directing attention to what is helpful, thinking and reasoning about what is likely to be helpful, taking helpful actions and creating inner feelings of support, kindness, helpfulness and encouragement to deal with distress). Responses are given on a 10-point Likert scale; one – ‘never’, to 10 – ‘always’. High scores indicate high compassion. Cronbach alphas were .67 for compassion to self, .71 for compassion to others and .72 for compassion to others.
4.9.4
Prior to analysis, data were screened for accuracy and completeness. Total and subtotal scores were computed according to the scoring guidelines of each measure. Descriptive statistics were examined for all pre- and post-measures to assess distribution and to check for outliers. Visual inspection of boxplots and summary statistics was used to evaluate approximate normality of total scores. A small number of extreme values were observed; however, these reflected plausible clinical scores and were retained in the analyses. One participant was excluded from the analysis of the Fears of Compassion Scale (FCS), From Others and To Self Subscales, as they did not complete these subscales. This participant was retained in all other analyses. All other participants had completed preand post-measures and therefore no other cases were excluded due to
missing data. Assumptions for paired sample t-test were considered sufficiently met.
Analysis of the DASS Stress scores from the CFT therapy programme indicated that there was a significant decrease in reported stress, t (27) = 3.17, p = .004 representing a medium effect size (d = .60). Participants mean scores decreased from 20.57 (SD = 10.73) at pre-intervention to 15.34 (SD = 9.27) after completing the programme.
Analysis of the DASS Depression scores from the CFT therapy programme indicated that there was a significant decrease in reported depressive symptoms, t (27) = 4.30, p <.001, with a large effect size (d = .79).
Participants mean scores decreased from 22 (SD = 13.08) at preintervention to 13.46 (SD = 11.12) after completing the programme.
Analysis of the DASS Anxiety subscale mean scores showed that levels of anxiety decreased significantly from 15.64 (SD = 12.34) at preintervention to 10.18 (SD = 9.57), following engagement in the therapy group, t (27) = 3.22, p = .003. This decrease demonstrated a medium effect size of d = .61.
Figure 4.43 DASS - Depression, Anxiety and Stress Subscale Mean Scores pre and post intervention.
The FCS is divided into three scales: fear of expressing compassion for others, fear of responding to compassion from others, and fear of expressing kindness and compassion towards self. Mean scores on the subscales are presented below.
Mean scores on the fear of expressing compassion for others scale fell from 14.50 (SD = 7.11) at pre-intervention to 12.65 (SD = 7.41) at postintervention. However, this reduction was not found to be statistically significant, p = 0.156.
A paired samples t-test demonstrated a statistically significant reduction in reported fear of responding to compassion from others, t (26) = 3.32, p = .003, representing a medium effect size (d = .640). Mean scores fell from 22.82 (SD = 13.40) at pre-intervention to 16.46 (SD = 9.45) at post intervention.
A paired samples t-test demonstrated a statistically significant reduction in fears of expressing kindness and compassion towards self, t (26) =4.21, p < 0.001, representing a large effect size (d = .810). At pre-intervention, participants mean scores were 25.29 (SD = 15.22), compared to 14.95 (SD = 11.23) at post-intervention.
Figure 4.44 Fears of Compassion Subscale Mean Scores pre and post intervention.
FCS Subscale Mean Scores
The Forms of Self-Criticising/Attacking and Self-Reassuring Scale (FSCRS)
Mean scores on the FSCRS ‘inadequate self’ subscale showed a significant decrease following engagement with the therapy programme, t (27) = 4.89, p <.001. Mean scores fell from 25.41 (SD = 7.47) at preintervention to 18.28 (SD = 7.91) at post-intervention, demonstrating a large effect size, (d = 0.924). Decreases in scores indicate reduced feelings of inadequacy.
Mean scores on the FSCRS ‘reassured self’ subscale showed a significant increase following engagement with the programme t (27) = -4.90, p < .001. Mean scores rose from 11.31 (SD = 5.51) at pre-intervention to 16.04 (SD = 5.68) at post-intervention, demonstrating a large effect size, (d = -0.93). Increases in scores indicate increased feelings of reassurance in self.
Mean scores on the FSCRS ‘hated self’ subscale showed an insignificant decrease following engagement with the programme, t (27) = 1.28, p 111
= .211. This means that the decreases in scores indicating reduced feelings of self-hatred was not statistically significant.
Figure 4.45 FSCRS Subscale Mean Scores pre and post intervention.
FSCRS Subscale Mean Scores
Pre-intervention Post-intervention
The CEAS is divided into three scales ‘Compassion to Self’, ‘Compassion to Others’ and ‘Compassion from Others’. Overall scores, and scores on the engagement and action subscales are reported below.
Significant increases were reported on the overall Compassion to SelfScale from pre-intervention (M = 44.55, SD = 14.57) to post-intervention (M = 60.91, SD = 15.39), t (27) = -6.86, p <.001, with a large effect size (Cohen’s d = -1.29). These findings illustrate that participants’ selfdirected compassion increased from pre- to post-intervention.
Mean scores on the Compassion to Others-Scale increased from preintervention (M = 78.98, SD = 12.25) to post-intervention (M = 79.71, SD = 8.88). However, this increase was not statistically significant, p = 0.052.
Significant increases were reported on the overall Compassion from Others Scale from pre-intervention (M = 59, SD = 17.01) to postintervention (M = 69.41, SD = 10.87), t (27) = -4.35, p <.001, with a large effect size (Cohen’s d = -0.82). These findings illustrate that participants’ compassion from others increased from pre- to post-intervention.
Figure 4.46 CEAS Compassionate Scale Mean Scores pre and post intervention.
CEAS Compassionate Scale Mean Scores
Pre-intervention Post-intervention
Within the Compassionate Engagement sub-scales, an increase in mean scores was observed on the Compassion to Self subscale. Participant mean scores increased from pre-intervention (M = 28.98, SD = 8.97) to post-intervention (M = 36.43, SD = 9.8), t(27) = -4.18, p < .001, with a large effect size (d = -.79).
Mean scores was increased significantly on the Compassion to Others subscale within the Compassion Engagement subscales. Participant mean scores decreased marginally from pre-intervention (M = 45.77, SD = 6.37) to post-intervention (M = 46.64, SD = 6.52). However, this decrease was not statistically significant, p = 0.46.
An increase in mean scores was observed on the Compassion from Others subscale within the Compassionate Engagement subscales. Scores on this
subscale increased slightly from 33.72 (SD = 17.02) pre intervention to 35.82 (SD = 8.92). However, this increase was not statistically significant, p = 0.25.
These findings suggest that on completion of the programme, service users’ compassion for themselves, and openness to receiving compassion from others increased.
Figure 4.47 CEAS Compassionate Engagement Subscale Mean Scores pre and post intervention.
Within the Compassionate Action sub-scales, a statistically significant increase in mean scores was observed on the Compassion to Self subscale. Participant mean scores increased from pre-intervention (M = 15.23, SD = 6.92) to post-intervention (M = 23.98, SD = 6.86), t(27) =8.67, p < .001, with a large effect size (d = -1.64).
An increase in mean scores was observed on the Compassion to Others subscale within the Compassion Action subscales. Participant mean scores increased slightly from pre-intervention (M = 32.98, SD = 5.58) to postintervention (M = 33.12, SD = 3.42). This was not a statistically significant increase, p = .88.
An increase in mean scores was observed on the Compassion from Others subscale within the Compassionate Action subscales. Scores on this subscale increased from 24.10 (SD = 7.95) pre intervention to 33.12 (SD = 3.42), t(27) = -6.65, p < .001, with a large effect size (d = -1.256)
Figure 4.48. CEAS Compassionate Action Subscale Mean Scores pre and post intervention.
4.9.5 Summary
The Compassion-Focused Therapy Programme started in SPMHS in 2014. Each year, the programme has evolved and continued to receive positive outcomes. Effect size calculations for data from the CFT groups in 2025 demonstrated medium to large effect sizes for significant results on outcome measures. These results point towards meaningful reductions in symptoms of depression, anxiety and stress for service users after
completing the therapy group. Significant changes were also noted in relation to people’s openness to compassion, with a decrease in fears associated with receiving compassion from others and offering compassion to oneself. The data demonstrated that after completion of the CFT therapy group the impact of their inner critic had changed and service users reported that feelings of inadequacy had significantly reduced and there was an improvement in their ability to reassure themselves.
Results from outcome measures and anecdotal feedback from service users who attended these groups are consistently positive with participants reflecting that the CFT group has made them feel stronger, more compassionate and more trusting of others over time. CFT continues to be an effective, well-received group-based psychological intervention to SPMHS service users.
Compassion-Focused Therapy (CFT) was developed by Prof Paul Gilbert for individuals with mental health difficulties linked to high levels of shame and critical thinking (Gilbert, 2009; Leaviss & Uttley, 2014). It is an integrative, multi-modal approach that draws on evolutionary psychology, neuroscience, attachment theory, cognitive behaviour therapy, mindfulness, and compassion-focused practices. CFT recognises the importance of being able to engage with our suffering in a compassionate way and helps people to respond to distress and challenging emotions (Kolts, 2016).
Research has demonstrated the importance of self-compassion for psychological functioning (Neff & Germer, 2017). Jazaeir et al. (2012) identified compassion as a predictor of psychological health and wellbeing and found that it was associated with fewer negative feelings and stress, as well as more positive feelings and greater social connectedness. A systematic review conducted by Leaviss & Uttley (2014) suggested CFT as
a particularly helpful intervention for service users experiencing high shame and criticism. Research has found that CFT is associated with reductions in depression, anxiety, shame and self-criticism, and increased ability to self-soothe in response to emotional distress (Lucre & Corten, 2012).
Research conducted in St Patricks Mental Health Service (SPMHS) demonstrated that group CFT was effective in reducing symptoms of mental ill health for service users who attended the group. These findings were associated with improvements in self-criticism and fears of selfcompassion (Cuppage, Baird, Gibson, Booth & Hevey, 2017). A further research study carried out at SPMHS investigated subjective bodily changes associated with attending a transdiagnostic CFT group (Mernagh, Baird & Guerin, 2020). Results suggest that service users who attended the CFT group developed an increase in mind-body attunement. That is, they developed their capacity to listen to, and trust, their own bodily sensations as a source of important information about their emotions, as well as to regulate their emotions through responding to associated physical sensations with increased compassion and understanding.
When considering the older adults who attend SPMHS, this cohort may face multiple losses, an increased dependency on others and reduced ability to engage in everyday activities, which can increase their likelihood of experiencing shame and self-criticism (Mirowsky & Ross, 1992; Atavilla & Strudwick, 2022). Compassion Focused Therapy draws upon compassion to alleviate the impact of self-criticism and shame on mental health. Given this, it was felt that CFT could be a useful intervention for older adults attending SPMHS. This thinking led to the development of the Compassion Focused Therapy for Older Adult Programme (CFT-OA).
In 2025, the CFT-OA programme completed its fourth cycle since its inception. This cycle ran from 6th of February to the 26th of June. In 2024 following review of the group format and in consideration of feedback from group members the group was permanently increased from 16 to 18 group sessions that runs over 20 weeks to facilitate individual reflection
sessions at the halfway point in the group. These individual reflection sessions provide the group members with an opportunity to reflect on their experience of the group before completing the remaining group sessions. Group members are also invited to attend a final review appointment at the end of group, which serves as an opportunity to further reflect on their experiences of doing a group therapy and think about appropriate next steps following the CFT-OA group. The CFT-OA continues to take place in-person, in St Patrick’s University Hospital and uses a closed group format.
In 2025, eight service users engaged with the CFT-OA programme but five of them had to drop out of the group due to unforeseen circumstances. Therefore, only the data of the three service users who completed the program and chose to fill in the pre and post outcome measures was explored. The age of the service users ranged from 65 to 81 years old (M = 71, SD = 8.71). All three of the service users were female. Due to the small sample size available, the statistical significance of potential differences could not be determined. Instead, descriptive statistics are presented for pre and post intervention mean scores. The small sample size is due to the fact that this programme is a specialist intervention delivered to a small group of service users, to meet their specific therapeutic needs.
The Compassionate Engagement and Action Scales (CEAS) was removed from the measures collected at pre- and post-intervention in 2025 to reduce the burden on participants. No other changes were made to the outcome measures used to evaluate the CFT-OA group. Please see a description of the outcome measures used below.
The FSCRS was developed by Gilbert, Clarke, Hempel, Miles and Irons (2004). This scale was developed to measure self-criticism and the ability to self-reassure. It is a 22-item scale that measures different ways people think and feel about themselves when things go wrong for them. The items make up three components, there are two forms of self-criticalness: inadequate self (“I am easily disappointed with myself”); and hated self (“I have become so angry with myself that I want to hurt or injury myself”), and one form to self-reassure (“I am able to remind myself of positive things about myself”). The responses are given on a five-point Likert scale ranging from zero – ‘not at all like me, to four – ‘extremely like me’. Cronbach alphas were .89 for the inadequate self scale, .89 for the hated self scale, and .85 for the reassured self scale.
The 21-item Depression, Anxiety and Stress Scale (DASS-21) is a set of three self-report scales designed to measure depression, anxiety and stress. Each of the three DASS-21 scales contain seven items, divided into sub-scales with similar content. Each item comprises a statement and four short response options to reflect severity. They are scored from zero – ‘did not apply to me at all’, to three – ‘applied to me very much, or most of the time’. The Depression Scale assesses dysphoria, hopelessness, devaluation of life, self-deprecation, lack of interest/involvement, anhedonia and inertia. The Anxiety Scale assesses autonomic arousal, skeletal muscle effects, situational anxiety and subjective experience of anxious affect. The stress scale is sensitive to levels of chronic nonspecific arousal. It assesses difficulty relaxing, nervous arousal and being easily upset/agitated, irritable/over-reactive and impatient. The DASS-21 is based on a dimensional rather than a categorical conception of psychological disorder. The assumption on which the DASS-21 development was based (and which was confirmed by the research data) is that the differences between the depression, anxiety and the stress experienced by non-clinical populations and clinical populations are
essentially differences of degree. Cronbach alphas were .66 for the Anxiety Scale, .91 for the Depression Scale and .82 for the Stress Scale.
Exploratory analysis of the data inspecting for outliers, indicated that there were no extreme values. In order to explore the DASS-21 outcome measures, the pre and post group mean scores on DASS-21 were looked at first, including the ‘DASS-21 Total’ score, the ‘Anxiety Subscale’, the ‘Depression Subscale’ and the ‘Stress Subscale’ scores. The mean for the ‘DASS-21 Total’ score decreased from pre-intervention (M= 38, SD= 14.42) to post-intervention (M =30.67, SD = 16.17), see Figure 4.49.
Figure 4.49 Pre and Post Group Mean Scores for the DASS-21 Total Score.
Figure 4.50. Pre and Post Group Mean Scores for the ‘Stress Subscale’, the ‘Depression Subscale’ and the ‘Anxiety Subscale’ Score on the DASS-21.
Mean Scores for the ‘Stress Subscale’, the ‘Depression Subscale’ and the ‘Anxiety Subscale’ Score on the DASS-21
As illustrated in Figure 4.50, the mean scores on the DASS-21 ‘Depression Subscale’ decreased from pre-intervention (M = 12.67, SD = 6.1) to postintervention (M = 10.67, SD = 8.33). The mean scores on the DASS-21 ‘Stress Subscale’ decreased from pre-intervention (M = 16.67, SD = 5.87) to post-intervention (M = 12.67, SD = 9.02). The mean scores on the DASS-21 ‘Anxiety Subscale’ decreased from pre-intervention (M = 8.67, SD = 6.43) to post-intervention (M = 7.33, SD = 1.15). Due to the small sample size, statistical significance could not be determined for the CFTOA cycle completed in 2025.
The Forms of Self-Criticising/Attacking and Self-Reassuring Scale (FSCRS)
Prior to exploration of the FSCRS total mean scores, visual inspection of the data was performed, and it was determined that there are no extreme values. Subsequently, the pre and post group mean scores for each of the ‘Inadequate Self’, ‘Reassured Self’ and ‘Hated Self’ scales on the FSCRS were calculated, please see Figure 4.51.
Figure 4.51. Pre and Post Mean scores for the ‘Inadequate Self’, ‘Reassured Self’ and ‘Hated Self’ scales on the FSCRS.
FSCRS Subscale Mean Scores Pre-intervention
As illustrated in Figure 4.51, the mean scores on the FSCRS ‘Inadequate Self’ subscale decreased from pre-intervention (M = 23.67, SD = 9.45) to post-intervention (M = 13, SD = 3.46). The mean scores on the FSCRS ‘Reassured Self’ subscale increased slightly from pre-intervention (M = 12, SD = 2.65) to post-intervention (M = 18, SD = 3.46). The mean scores on the FSCRS ‘Hated Self’ subscale decreased from pre-intervention (M = 6.7, SD = 6.02) to post-intervention (M = 2.3, SD = 0.58).
4.10.4 Summary
In 2025, the CFT-OA programme completed its fourth cycle since its inception. The fourth cycle ran from 6th of February 2025 to the 26th of June 2025. The CFT-OA group is a compassion focused group therapy programme specifically designed for older adult service users. It aims to reduce self-criticism and enhance self-compassion amongst its group members.
Analysis of the pre and post mean scores on these outcome measures pointed towards positive changes in the areas targeted by the programme: including reductions in levels of self-criticism as measured by the FSCRS and overall levels of distress as measured by the DASS-21. Due
to the small sample size available, the statistical significance of these differences could not be determined; however, the observed outcome measures suggest that the CFT-OA programme is meeting its aims in seeking to reduce the levels self-criticism experienced by older adult group members and cultivate greater compassion amongst these individuals. To further reflect the impact of the fourth cycle of the programme, a qualitative overview of the participants’ post-group feedback was also added this year. The responses suggest that the group offered supportive and encouraging space for personal growth, particularly in areas such as self-compassion, showing kindness to oneself and others, and perspective thinking, which are some of the main goals of the programme. Challenges noted included the difficulty returning to hospital setting and the emotional effort involved in sharing feelings. Overall, despite the smaller size, the group still managed to offer a meaningful therapeutic process and a space where participants felt less alone in their experiences.
The Compassion Focused Therapy Group for Eating Disorders is a Psychology lead day programme. It is a closed group that runs half a day a week for approximately ten months for those with eating difficulties who have high levels of self-criticism and shame. Those who are suitable typically do not need assisted support around mealtimes, this differentiates the CFT-E programme from the EDP programmes where service users require more intensive input in relation to meal support. Service users suitable for CFT-E treatment as an outpatient have capacity to engage in intensive psychological treatment while having more responsibility for their meal plans as an outpatient. Compassion-Focused Therapy for Eating Disorders (CFT-E) aims to support participants with:
Establishing regular and sufficient eating
Reduce eating disorder symptoms
Increasing attentional control and compassion skills
Experiencing giving and receiving compassion within a group
Increasing access to social support and self-compassion (Allan & Goss, 2012).
Gilbert (2014) defines compassion as involving two parts: a sensitivity to, and an awareness of, suffering of self and others; and a motivation to try to prevent and alleviate suffering.
CFT is underpinned by evolutionary theory and the neuroscience of emotion, thus scientifically explaining the application of compassion to promote mental health (Mullen, Dowling, Doyle, & O’Reilly, 2019). A systematic review conducted by Leaviss & Uttley (2014) suggested CFT as a particularly helpful intervention for service users experiencing high levels of shame and self-criticism, which are more common amongst people experiencing eating disorders than any other mental health population (Ferreira, Pinto Gouveia, & Duarte, 2014). A recent randomized control trial demonstrated that CFT-E is effective for reducing eating disorders, is as effective as CBT-E and maintained better outcomes than CBT-E for those with childhood trauma (Vrabel et al., 2024).
CFT categorises emotions by their functions for:
Alert to threat and activation of defence behaviours
Incentivisation of seeking behaviour
Allow for rest and digest (Gilbert, 2014)
These have been named the threat, drive and soothing systems respectively. The CFT-E model suggests that people who experience eating disorders have learned to regulate their experience of threat through their drive system, with little access to their healthy soothing system (Allan & Goss, 2014). For example, experiences of threat such as shame and self-criticism can be managed through the drive of goaldirected food restriction or accessing soothing through food. Research
indicates that food restriction stems from experiences of threat which are overly responded to by the drive system through excessive dieting which becomes reinforced through feelings of pride (Kelly & Tasca, 2016).
Bingeing behaviour is regulated by the soothing system through dissociation from negative emotions and an increase in pleasurable sensation and soothing affect (Allan & Goss, 2014).
Research carried out in SPMHS (Mullen, Dowling, Doyle, & O’Reilly 2019) reported that after completing the group, people described a more compassionate way of relating to themselves; building new ways of living without an eating disorder; and positive experiences with the programme, particularly from connections made with other group members.
CFT-E incorporates education for both service users and their family members; skill building and therapeutic elements.
The format of the programme. incorporates psychoeducation for service users and their family members; skill building and therapeutic elements. The programme is delivered by two psychologists and one assistant psychologist. In total, there are 2 full day psychoeducation sessions, 1 friends and family session, then 8 skills sessions, 17 therapy sessions, and 3 aftercare sessions, which are all half day.
Seven out of nine participants completed the CFT-E programme in 2025, and 13 cycles of CFT-E have run since its inception. Demographic information is included for all seven participants. Most of the programme was completed face to face with three hybrid sessions. The programme welcomes participants with a range of eating disorder symptoms and diagnoses. Five of the seven participants were female, with two male participants in the programme. Participants ranged in age from 26 to 57 years with a mean age of 43.14. Pre- and post-outcome data was available for four out of the seven programme completers on all measures.
The following section presents a summary of the routine clinical outcome measures used by the CFT-E programme in 2025. All service users attending the CFT-E programme are invited to complete the measures listed below at assessment for the programme and again upon completion.
Due to the small sample size, the statistical significance of changes in mean scores could not be calculated. For this reason, participants individual pre and post measure scores are reported below. The small sample size is due to the fact that this programme is a specialist intervention delivered to a small group of service users, to meet their specific therapeutic needs.
Clinical Outcome Routine Evaluation – Outcome Measures (CORE-OM)
The Clinical Outcomes in Routine Evaluation - Outcome Measure (COREOM) is a 34-item self-report questionnaire developed to monitor clinically significant change in outpatients. The service user is asked to respond to 34 questions about how they have been feeling over the last week using a five-point Likert scale ranging from ‘not at all’, to ‘most or all the time’. The 34 items of the measure cover four dimensions: subjective wellbeing, problems/symptoms, life functioning and risk/harm.
The responses are designed to be averaged by the practitioner to produce a mean score to indicate the level of current psychological global distress (from healthy to severe). The scoring range of the CORE-OM is between zero and four, with four being the highest level of severity. The CORE Outcome Measure (CORE-OM) was conceived as a non-proprietary measure of psychological distress. Crucially, it was informed by feedback from practitioners as to what they considered to be important to include (Barkham et al, 2010). Since its development, the CORE-OM has been validated with samples from the general population, NHS primary and
secondary care and in older adults. Furthermore, analyses of over 2,000 responses show good reliability and convergent validity against longer and less general measures; small gender effects, large clinical/non-clinical differences and good sensitivity to change (Evans et al, 2009).
The Eating Disorder Examination Questionnaire (EDE-Q) is a wellestablished self-report instrument that investigates eating disorder behaviours and attitudes. It is a 36-item self-report questionnaire that measures change in eating disorder symptoms over the course of treatment. It is considered the ‘gold standard’ measure of eating disorder psychopathology and is designed to assess past month cognitive subscales related to eating disorders; restraint, eating concern, shape concern and weight concern, as well as behavioural symptoms related to these concerns (e.g. frequency of binge-eating, vomiting, use of laxatives or diuretics and over-exercise). The EDE-Q has demonstrated good internal consistency, with Cronbach’s alpha coefficients in the range between 0.70 to 0.83 in a clinical sample and from 0.78 to 0.93 in a general population sample (Luce & Crowther, 1999; Peterson et al., 2007; Jennings & Phillips, 2017).
Participants are asked how often they have engaged in a range of eating disorder behaviours over the past 28 days, e.g. “have you been deliberately trying to limit the amount of food you eat to influence your shape or weight?” or “over the past 28 days, how many days have you eaten in secret?” Answers range from ‘no days’, ‘six to 12 days’, ‘23 to 27 days’ and ‘every day’. A cutoff of 2.8 has been recommended to screen for eating disorders (Velkoff et al., 2023).
Participants are also asked about how their weight/shape impacts their thoughts about themselves, e.g. “has your weight influenced how you think about yourself as a person?” or “how dissatisfied have you been with your shape?” Answers range from ‘not at all’, ‘slightly’, ‘moderately’ and ‘markedly’.
The EDE-Q reports good internal consistency and with the exception of some of the eating disorder behaviours, test re-test reliability has been reported to be fairly strong for both men and women.
The Functions of Self-Criticising/Attacking Scale (FSCS)
The Functions of Self-Criticising/Attacking Scale (FSCS) was developed by Gilbert, Clarke, Hempel, Miles and Irons (2004) to measure the functions of self-criticism; why people think they self-criticise and self-attack. Factor analysis suggests two very different functions for being self-critical; one is to try and improve the self and stop the self from making mistakes (selfcorrection) and the other involves expressing anger and wanting to harm the self (self-persecution). It is a 21-item scale measuring both these factors. The responses are given on a five-point Likert scale ranging from zero – ‘not at all like me’, to four – ‘extremely like me’.
The Forms of Self-Criticising/Attacking and Self-Reassuring Scale (FSCRS)
The FSCRS was developed by Gilbert, Clarke, Hempel, Miles and Irons (2004). This scale was developed to measure self-criticism and the ability to self-reassure. It is a 22-item scale that measures different ways people think and feel about themselves when things go wrong for them. The items make up three components, there are two forms of self-criticalness: inadequate self (“I am easily disappointed with myself”); and hated self (“I have become so angry with myself that I want to hurt or injury myself”), and one form to self-reassure (“I am able to remind myself of positive things about myself”). The responses are given on a five-point Likert scale ranging from zero – ‘not at all like me, to four – ‘extremely like me’. Cronbach alphas were .89 for the inadequate self scale, .89 for the hated self scale, and .85 for the reassured self scale.
The Compassionate Engagement and Action Scales – (CEAS)
The Compassionate Engagement and Action Scales (CEAS) are three separate scales measuring compassion to self, compassion to others and
compassion experienced from others (Gilbert et al, 2017). Each scale consists of 13 items which generate an engagement subscale (ie. motivation to care for wellbeing, attention/sensitivity to suffering, sympathy, distress tolerance, empathy, being accepting and nonjudgmental) and an action sub-scale (ie. directing attention to what is helpful, thinking and reasoning about what is likely to be helpful, taking helpful actions and creating inner feelings of support, kindness, helpfulness and encouragement to deal with distress). Responses are given on a 10-point Likert scale; one – ‘never’, to 10 – ‘always’. High scores indicate high compassion. Cronbach alphas were .67 for compassion to self, .71 for compassion to others and .72 for compassion to others.
As mentioned above, the statistical significance of changes in mean scores could not be calculated due to the small sample size. Pre- and postoutcome data was available for four out of the seven programme completers on all measures. Their group and individual pre and post measure scores are reported below.
Clinical Outcome Routine Evaluation – Outcome Measures (COREOM)
Participants total scores decreased from a mean of 2.02 (SD = .44) on the CORE-OM at pre-intervention to 1.4 (SD = 1.05) post-intervention. Three out of the four participants reported a decrease in individual total COREOM scores and one person showed an increase as shown in Figure 4.53.
Figure 4.52 CORE-OM Total Mean Scores
CORE-OM Total Mean Scores
4.53 CORE-OM Total Individual Scores
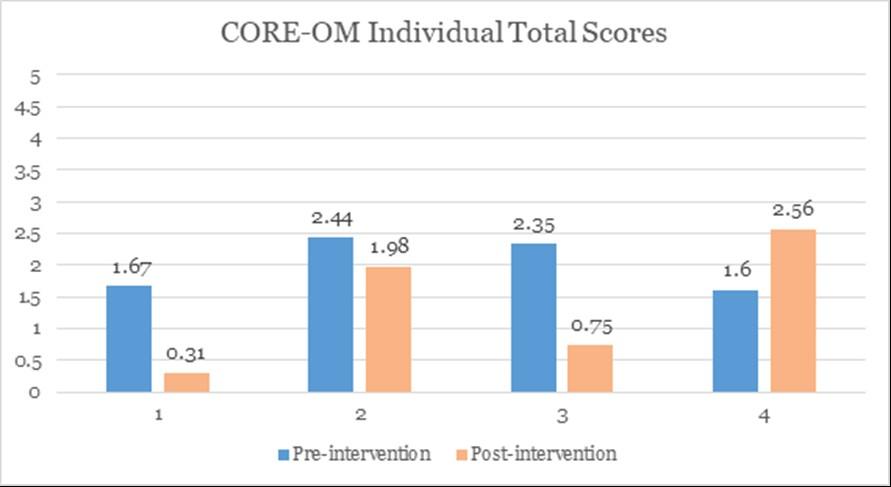
Mean scores on the Subjective Wellbeing subscale decreased from 3.13 (SD = .88) at pre-intervention to 2 (SD = 1.74) at post-intervention. Mean scores on the Problems/Symptom’s domain decreased from 2.65 (SD = .66) at pre-intervention to 1.69 (SD = 1.27) at post-intervention. Mean scores on the Functioning subscale decreased slightly from 1.88 (SD = .17) at pre-intervention to 1.42 (SD = .76) at post-intervention. Mean scores on the Risk/Harm subscale remained relatively unchanged, at .42 (SD = .40) at pre-intervention to .50 (SD = .71) at post-intervention.
Figure 4.54 CORE-OM Subscale Mean Scores
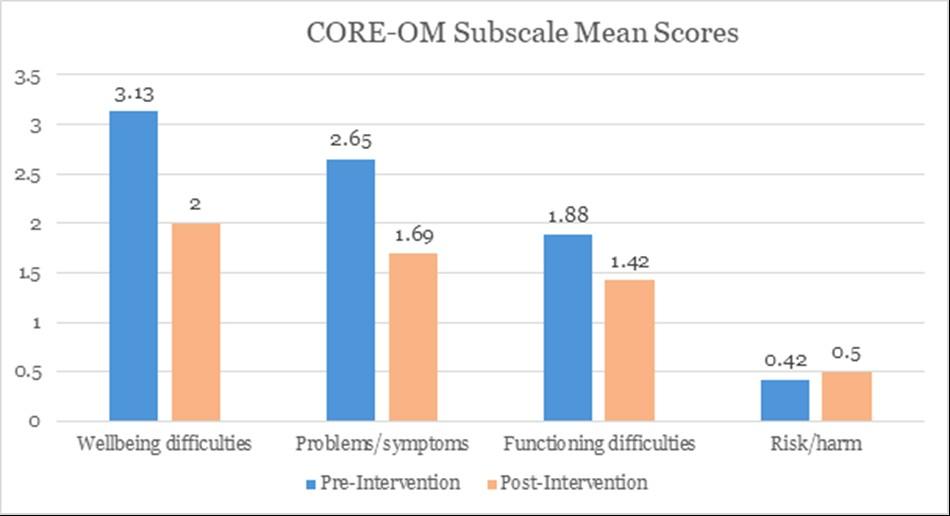
The mean global score on the EDE-Q decreased between pre-intervention (M = 4.58, SD = .59) and post-intervention (M = 2.94, SD = 1.78). The individual scores of three out of four participants decreased while the individual total score of one participant increased post-intervention. The group and individual mean scores of the EDE-Q are displayed below.
Figure 4.55 EDE-Q Global Mean Scores
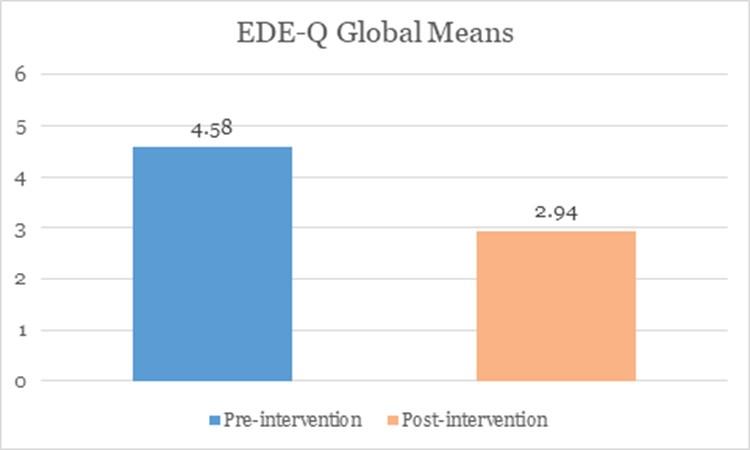
Figure 4.56 EDE-Q Global Mean Individual Scores
There are four sub-scales measured within the EDE-Q, which are restraint, eating concern, shape concern and weight concern. Mean scores on restraint were found to decrease from 3.85 (SD = .85) at pre-intervention to 2.35 (SD = 2.03) at post-intervention. Similarly, mean scores on the eating concern subscale showed a decrease from 3.7 (SD = 1.51) to 2 (SD = 1.73). Scores on the preoccupation with shape subscale also decreased from 5.4 (SD = .61) to 3.72 (SD = 1.93). Scores on the preoccupation with weight subscale similarly decreased from 5.38 (SD = .52) to 3.69 (SD = 2.13).
4.57 EDE-Q Subscale Mean Scores
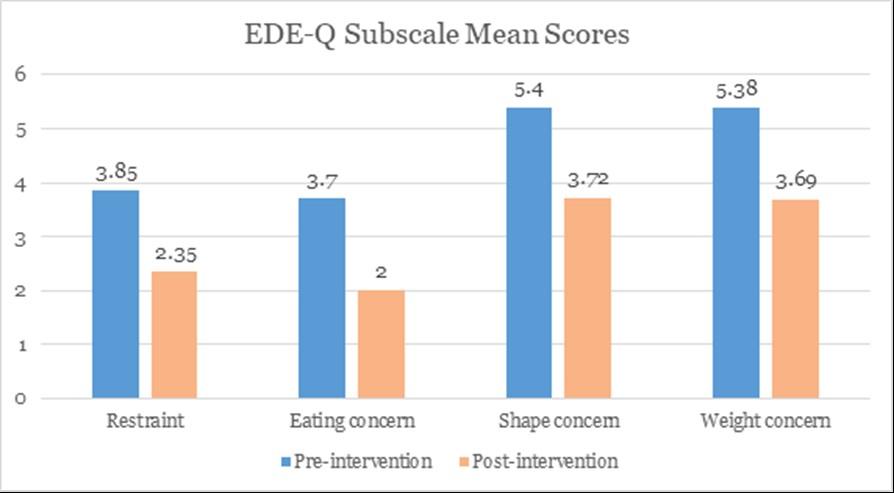
Individual scores on the Restraint subscale, as shown in Figure 4.58, demonstrate that three participants reported a decrease in scores on this subscale, while one participant reported no change in scores.
Figure 4.58 EDEQ Restraint Total Individual Scores
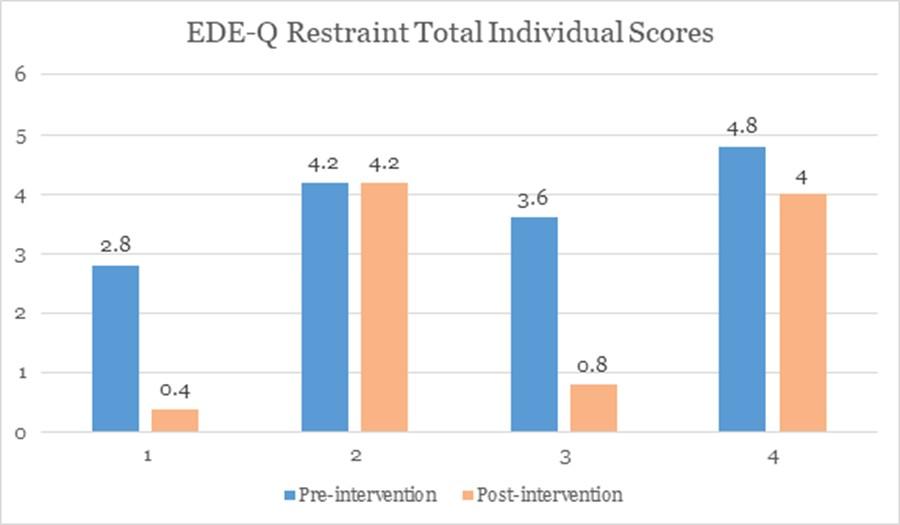
Individual scores on the Eating Concern subscale, as shown in Figure 4.59, demonstrate that three participants reported a decrease in scores on this subscale, and one participant reported an increase in scores.
Figure 4.59 EDE-Q Eating Concern Total Individual Scores
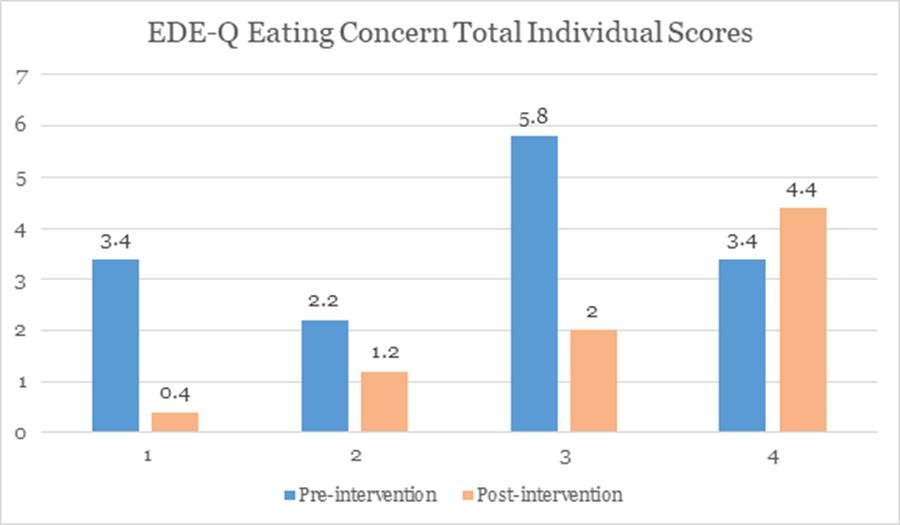
Individual scores on the shape concern subscale, as shown in Figure 4.60, demonstrate that three participants reported a decrease in scores on this subscale, one participant reported increase in scores post-intervention.
4.60 EDE-Q Shape Concern Total Individual Scores
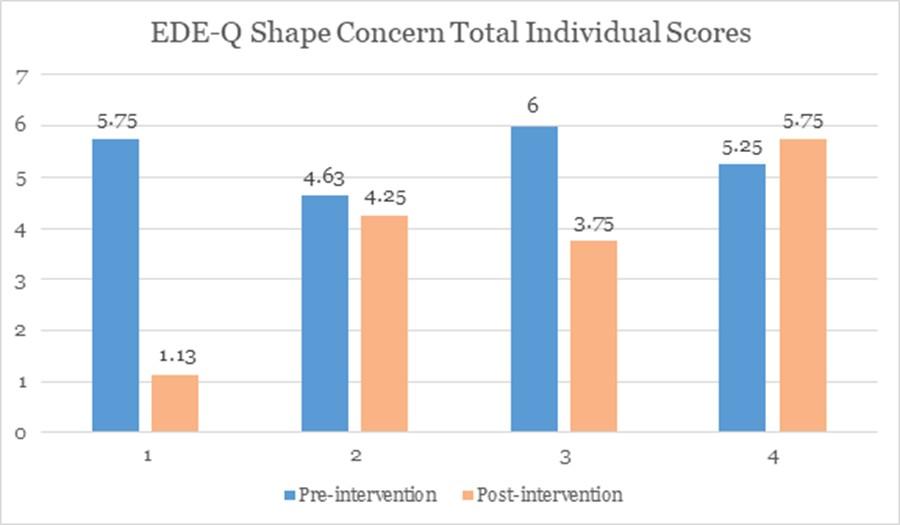
Individual scores on the Weight Concern subscale, as shown in Figure 4.61, demonstrate that two participants reported a decrease in scores on this subscale, and two participant reported increase in scores.
Figure 4.61 EDE-Q Weight Concern Total Individual Scores
EDE-Q Weight Concern Total Individual Scores
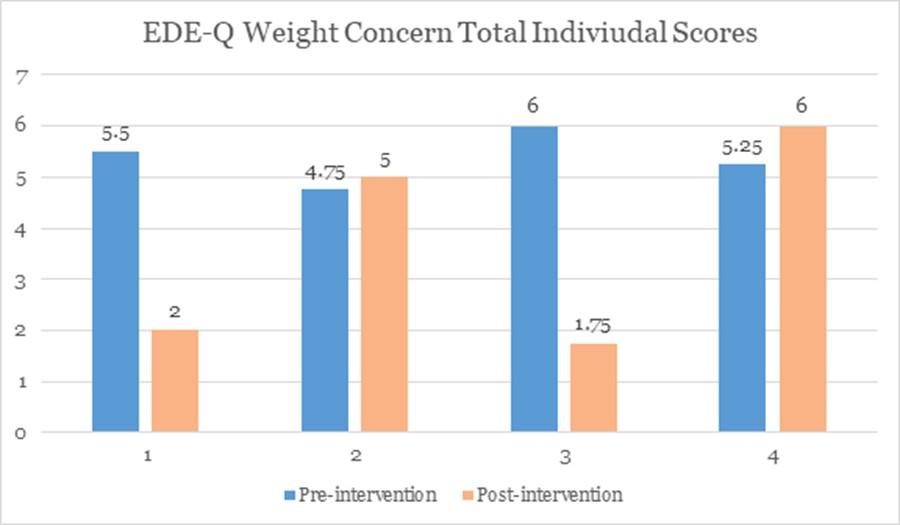
Due to the small sample size, changes in total EDE-Q scores were analysed using the Reliable Change Index (RCI) for each participant. In order to ensure that changes in EDE-Q scores were not attributable to chance or measurement error a RCI was calculated for each participant using the Jacobson-Truax (1991) method. In accordance with this method, statistically reliable change was reflected by RCI values larger than or equal to 1.96. The cut-off score of <2.8 was used as recommended by Velkoff., et al. (2023). Participants were classified as “clinically meaningful improvement” (passed RCI criterion and EDE-Q score decreased to below cut-off score of 2.1), “reliable improvement” (passed RCI criterion but the score did not decrease below EDE-Q cut-off score), uncertain change (did not pass RCI criterion) or deterioration (passed RCI criterion but symptom score increased). As outlined in Table 4.62, two participants (50%) reported reliable improvement, and two participants (50%) reported uncertain change.
Table 4.62 Results from Reliable Change Index (RCI) for EDE-Q pre and post scores.
EDE-Q = Eating Disorder Examination Questionnaire
The FSCS is divided into two sub-scales, measuring the function of selfcriticising/attacking in terms of self-correction and self-persecution. Total scores on the self-persecution subscale decreased from 15.75 (SD = 8.77) to 5.25 (SD = 3.69). Levels of self-correction decreased from preintervention (M = 29.5, SD = 3.87) to post-intervention (M = 13.75, SD = 6.45).
Individual scores on the FSCS Self-Correction subscale, as shown in Figure 4.64, demonstrate that all participants reported a decrease in scores on this subscale.
Figure 4.64 FSCS Self Correction Individual Scores
Individual scores on the FSCS Self-Persecution subscale, as shown in Figure 4.65, demonstrate that all participants reported a decrease in scores on this subscale.
Figure 4.65 FSCS Self-Persecution Individual Scores
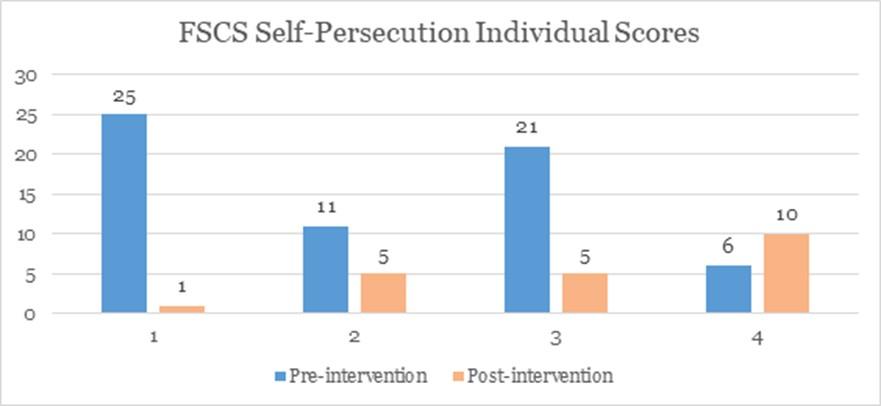
The Forms of Self-Criticising/Attacking and Self-Reassuring Scale (FSCRS) Results
Mean scores on the FSCRS ‘inadequate self’ sub-scale decreased from pre (M = 32.5, SD = 3.32) to post-intervention (M = 14.5, SD = 12.48). A reduction in mean scores on the ‘hated self’ sub-scale was observed from pre (M = 11.5, SD = 5) to post-intervention (M = 4.75, SD = 4.35). Mean scores on the ‘reassured self’ sub-scale increased from pre-intervention (M = 6, SD = 2.45) to post-intervention (M = 14.5, SD = 12.48).
Figure 4.67 FSCRS Mean Subscale Scores
FSCRS Subscale Mean Scores
Pre-intervention Post-intervention
As shown in Figure 4.68, individual scores on the FSCRS Inadequate Self subscale demonstrate that all four participants reported a decrease in scores on this subscale.
Figure 4.68 FSCRS Inadequate Self Individual Scores
As shown in Figure 4.69, individual scores on the FSCRS Hated Self subscale demonstrate that three participants reported a decrease in scores on this subscale, and one participant reported an increase in scores.
Figure 4.69 FSCRS Hated Self Individual Scores
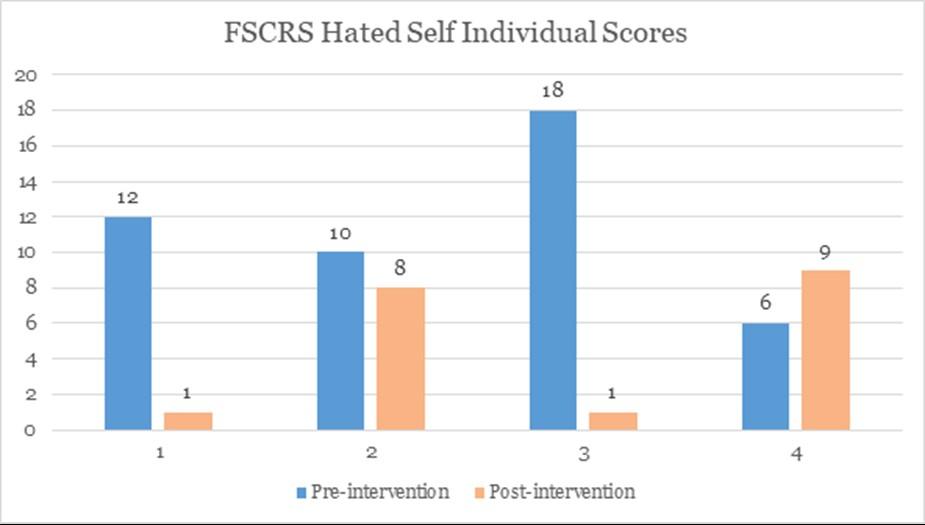
As shown in Figure 4.70, individual scores on the FSCRS Reassured Self subscale demonstrate that two participants reported an increase in scores on this subscale, and two participants reported a decrease in scores.
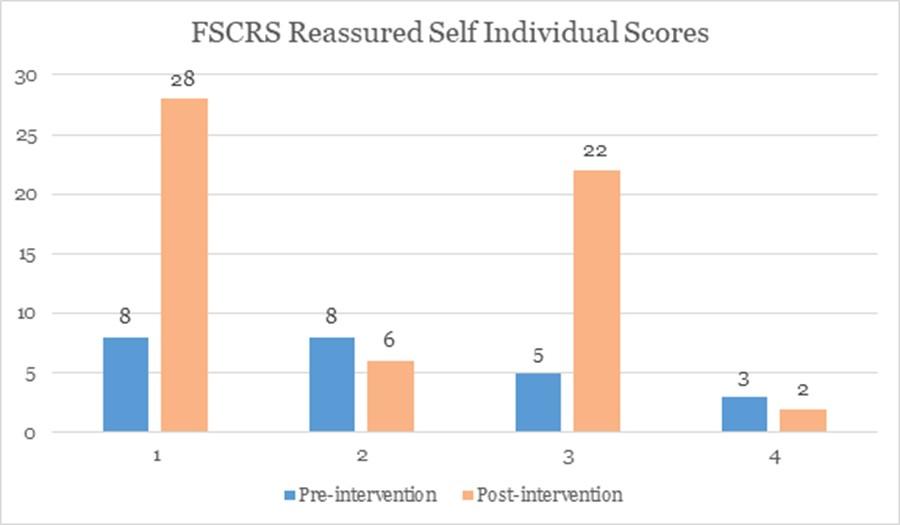
The CEAS is divided into three scales ‘Compassion to Self’, ‘Compassion to Others’ and ‘Compassion from Others’. Overall scores and scores on the Engagement and Action scales are reported below.
Mean scores on the Compassion to Self ‘Engagement’ Scale increased from pre-intervention (M = 28.25, SD = 9.88) to post-intervention (M = 39.5, SD = 9.61). Mean scores also increased on the Compassion to Self ‘Action’ Scale, with scores increasing from 12.5 (SD = 6.76) at preintervention to 21.75 (SD = 10.9) at post-intervention. The total mean score for self-compassion also increased from 40.75 (SD = 15.59) to 65.25 (SD = 20.06).
Mean scores for the Compassion to Others ‘Engagement’ Scale decreased slightly from pre-intervention (M = 54, SD = 4.83) to post-intervention (M= 53.5, SD = 5.69). There was a slight increase in mean scores from the Compassion to Others ‘Action Scale from pre-intervention (M= 35.50, SD = 8.35) to post-intervention (M = 36.25, SD = 4.35). Overall mean scores on the Compassion to Others Scale were (M = 89.5, SD = 13.1) pre-intervention and (M= 89.75, SD = 8.61) post-intervention.
Mean scores on the Compassion from Others Engagement Scale decreased from pre-intervention (M = 39.75, SD = 16.52) to postintervention (M = 38, SD = 16.87). Mean scores on the Compassion from Others Action Scale increased with a pre-intervention mean of 25.25 (SD = 11.95) to a post-intervention mean of 26 (SD = 8.49). The total mean scores on the Compassion from Others subscale slightly decreased from 65 (SD = 28.25) at pre-intervention to 64.00 (SD = 25.07) at postintervention.
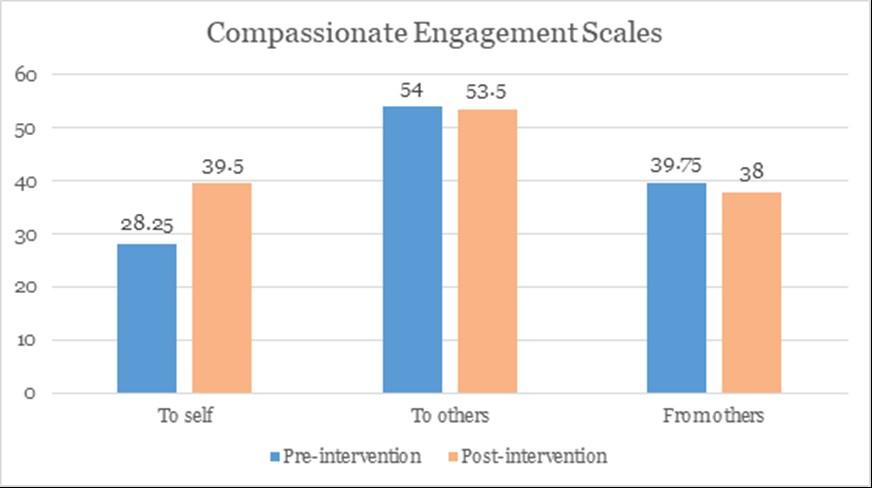
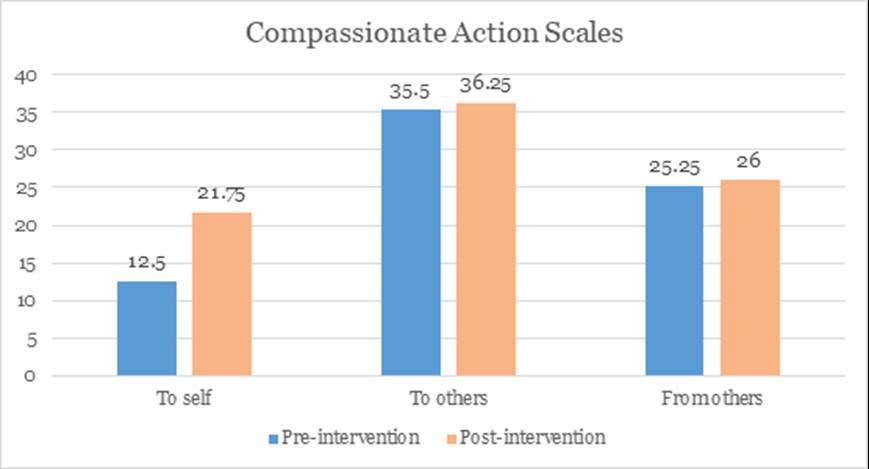
As shown in Figure 4.72, individual scores on the CEAS Self-Compassion subscale demonstrate that two participants reported an increase in scores on this subscale, and two participants reported a decrease in scores.
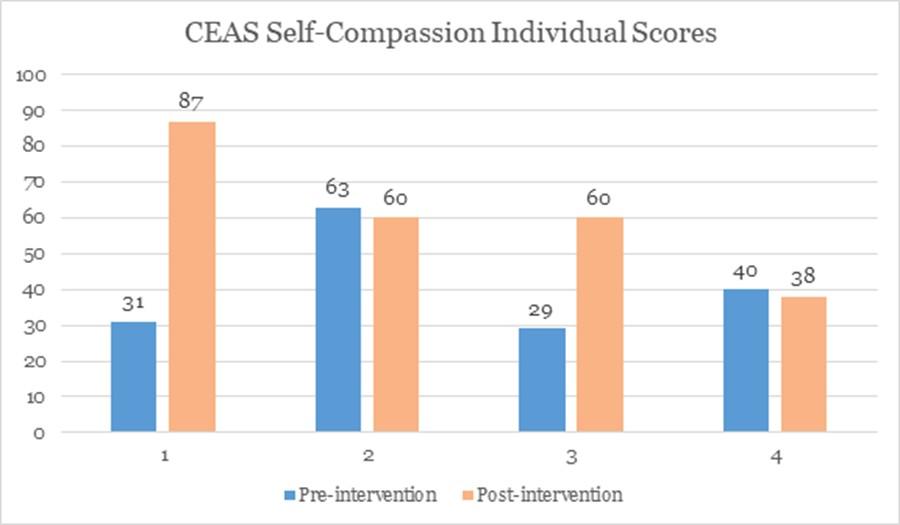
As shown in Figure 4.73, individual scores on the CEAS Compassion for Others subscale demonstrate that two participants reported an increase in scores on this subscale and two participants reported a decrease in scores.
Figure 4.73 CEAS Compassion for Others Individual Scores
As shown in Figure 4.74, individual scores on the CEAS Compassion from Others subscale demonstrate that three participants reported a decrease
in scores on this subscale, while one participant reported an increase in scores.
4.74 CEAS Compassion from Others Individual Scores
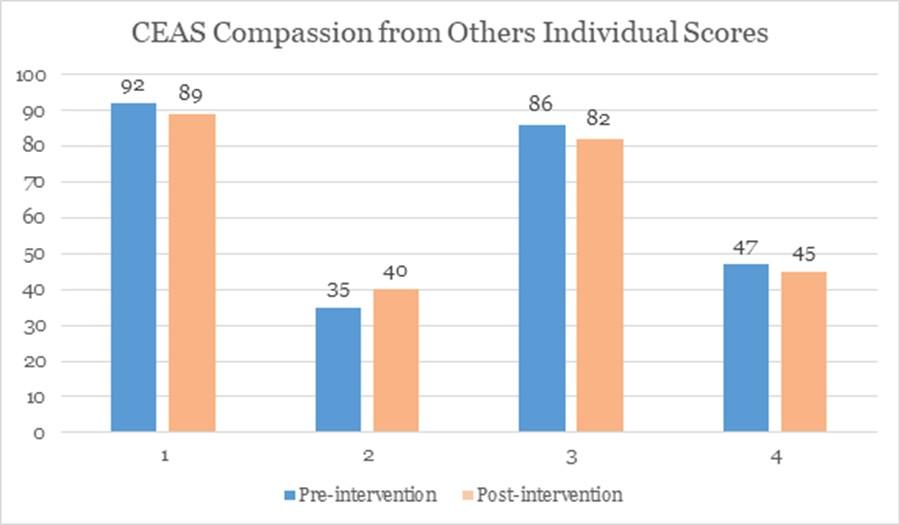
Since CFT-E began in SPMHS in 2015, 13 cycles have been delivered. The most recent cycle, completed in 2025, was delivered in mainly a face-toface format with three hybrid sessions. The programme accepts referrals from within the hospital and from external referrers. The outcomes reported above indicate the efficacy of the CFT-E programme; participants reported reductions in eating disorder symptoms, self-hatred, feelings of inadequacy, alongside increases in self-reassurance and self-compassion. The programme is meetings its aims in reducing eating disorder symptoms and improving service users’ relationship with themselves. Please note the number of participants is small so all results must be interpreted with caution.
The Depression Recovery Service is a comprehensive multidisciplinary assessment, treatment and after-care service for those experiencing
depression. In line with international best practice guidelines for depression, the Depression Recovery Service aims to deliver treatment in an accessible and flexible way (NICE, 2022). It also aims to provide followup care and support for those who require it.
The Depression Recovery Programme is a 10-week psychotherapy group programme which combines approaches from Cognitive Behavioural Therapy (CBT), Compassion-Focused Therapy (CFT), and MindfulnessBased Stress Reduction (MBSR). Sessions are led by cognitive behavioral psychotherapists and nurses with expertise in depression, group therapy, CFT, and mindfulness.
Depression Recovery Aftercare is a group that meets for a half day once a month for up to 2 years post completion of the core programme. It focuses on building on and maintaining the changes made through the Depression Recovery Programme. The group is run by two accredited CBT therapists, and continues to apply the approaches of CBT, CFT and MBSR.
Paired data were available for 21 service users who completed the programme in 2025: 13 females (61.9%) and 8 males (38.1%). The age profile of participants ranged from 22 to 74 years of age (M = 52.33, SD = 14.98).
In 2025, there was an addition to the outcome measures used to capture pre/post intervention analyses for the Depression Recovery Programme. Roughly 41.6% to 67% of people with major depressive disorder (MDD) have a concurrent, current anxiety disorder, while up to 90% of individuals with an anxiety disorder experience depressive symptom (Lamers et al., 2011). The Generalised Anxiety Disorder 7 (GAD-7) is a reliable and valid measure for generalized anxiety symptoms. The GAD7 was introduced to
better identify, treat and recognise potential and probable co-morbid benefits of the Depression Recovery Programme. The programme now can measure for reduction in depression symptoms (QIDS), improved functional performance (WSAS) and a reduction in generalized anxiety symptoms (GAD-7).
The Quick Inventory of Depression Symptomatology (QIDS) (Rush et al., 2003) is a 16-item measure used to assess the severity of depression symptoms. The items cover the nine diagnostic domains of depression as identified in the DSMS-IV: sad mood, concentration, self-criticism, suicidal ideation, interest, energy/fatigue, sleep disturbance and decrease or increase in appetite. It utilises a four-point rating scale, with a score of zero = none, one = mild, two = moderate, three = severe and, four = very severe. Total scores range from 0 - 27. The QIDS has been found to have high internal consistency with a Cronbach’s alpha of 0.83. The QIDS is based on the 30-item IDS questionnaire, for which it has good concurrent validity (Ware et al, 1996). The IDS is shown to have comparative sensitivity and specificity to the IDS the HRSD (Rush et al. 1996, 2000, 2003, in press), BDI (Rush et al. 1996), MADRS and SCL-90 (Corruble et al. 1996).
The Work and Social Adjustment Scale (WSAS) is a brief five-item service user self-report measure, which assesses the impact of a person’s mental health difficulties on their ability to function in terms of work, home management, social leisure, private leisure and personal or family relationships. Participants are asked to rate impairment in each domain on a nine-point Likert scale from zero – ‘not at all’, to eight – ‘very severely’. Total scores for the measure can range from zero to 40, with higher scores indicating greater impairment in functioning. A WSAS score above 20 appears to suggest moderately severe or worse psychopathology. Scores between 10 and 20 are associated with significant functional impairment but less severe clinical symptomatology. Scores below 10
appear to be associated with sub-clinical populations (p. 463, Mundt, Marks, Shear & Greist, 2002). The WSAS is used for service users with depression or anxiety as well as phobic disorders and has shown good validity and reliability (Mundt et al., 2002). The scores on the WSAS have been shown to be sensitive to patient differences in disorder severity and treatment-related change. Its psychometric properties have been well established across different psychopathologies. Its internal consistency, convergent/divergent validity and test–retest reliability is excellent; Cronbach's alpha measure of internal scale consistency ranged from 0.70 to 0.94. Test-retest correlation was 0.73. As an outcome measure, it is highly sensitive to treatment change in a wide range of conditions such as obsessive–compulsive disorder (OCD), bipolar disorder, phobic disorders, anxiety and depression.
The Generalised Anxiety Disorder-7 (GAD-7)
The Generalised Anxiety Disorder-7 (GAD-7) is a seven-item self-report measure which assesses the presence and severity of GAD symptoms over the past two weeks (Spitzer, Kroenke, Williams, & Löwe, 2006). A score of eight or greater represents a reasonable cut-point for identifying probable cases of generalised anxiety disorder. Research has demonstrated the reliability and validity of the GAD-7 in both primary care settings and the general population (Löwe et al., 2008).
4.12.3 Results
Results were examined and compared in greater detail including overall mean, individual and cycle scores. Due to the small sample size, statistical analysis of the outcome measures was not possible. The small sample size is due to the fact that this programme is a specialist intervention delivered to a small group of service users, to meet their specific therapeutic needs. Acceptable power was not achieved to reliably conduct statistical operations on the data. G*Power analysis indicated that in order to achieve sufficient statistical power, a sample size of 27 participants would have been required to detect a medium effect size (Cohen’s d=0.5).
Therefore, for each measure individual results for the 21 participants who returned both pre and post measures are given to reflect the outcome of the intervention.
Comparison of service user scores on the QIDS indicated a reduction of depression severity scores from pre-intervention (M = 12.10, SD = 4.82) to post-intervention (M = 9.95, SD = 4.61) (see Figure 4.75).
4.75 Pre and post-group mean scores for the QIDS
Due to the small sample size, changes in the QIDS scores were analysed using the Reliable Change Index (RCI) for each participant. To ensure that changes in QIDS scores were not attributable to chance or measurement error a reliable change index (RCI) was calculated for each participant using the Jacobson-Truax method (1991). In accordance with this method, statistically reliable change was reflected by RCI values equal to or larger than 1.96. Participants were classified as “reliable improvement” (passed RCI criterion), “no reliable change” (did not pass RCI criterion) or “reliable deterioration” (passed RCI criterion but symptom score increased).
Results for the reliable change index indicated that six participants (28.6%) reported reliable improvement, twelve participants (57.1%) reported uncertain change, two participants (9.52%) reported reliable
deterioration, and one participant (4.76%) reported no change (see table 4.76).
Table 4.76 Results from Reliable Change Index (RCI) for the QIDS pre and post scores for each group member
Further examination of the individual scores indicates that 17 out of 21 participants (81%) demonstrated a reduction in QIDS scores from preintervention to post-intervention (see Figure 4.77).
Figure 4.77 Pre and post individual scores of the QIDS.
Comparison of service user scores on the WSAS indicated a reduction of severity scores from pre-intervention (M = 17.00, SD = 7.33) to postintervention (M = 11.81, SD = 6.59) (see Figure 4.78).
Figure 4.78 Pre and post-group mean scores for the WSAS
Further examination of the individual scores indicates that 15 out of 21 participants (71.4%) demonstrated a reduction in WSAS scores from preintervention to post-intervention (see Figure 4.79).
Figure 4.79 Pre and post individual scores of the WSAS.
There was a decrease in total scores for the GAD-7 from pre- intervention (M = 10.05, SD = 5.94) to post-intervention (M = 7.10, SD = 6.02). This
finding indicates that those who completed the programme in 2025 had a decrease in symptoms related to anxiety (see Figure 4.80).
Figure 4.80 Pre and post-group mean scores for the GAD-7
GAD-7 Mean Scores Comparison
Further examination of the individual scores indicates that 15 out of 21 participants (71.4%) demonstrated a reduction in GAD-7 scores from preintervention to post-intervention (see Figure 4.81).
Figure 4.81 Pre and post individual scores of the GAD-7.
GAD-7 Individual Scores
This is the eleventh year the Depression Recovery Programme has been included in the SPMHS Outcomes Report. This is the third year the the Work and Social Adjustment Scale (WSAS) has been measured pre and post-intervention. This is the sixth year the QIDS has been used to capture the profile of group attendees and investigate the programme’s effectiveness at reducing symptoms of depression. The inclusion of the GAD-7 allows for a more comprehensive assessment of pre- and postintervention change by capturing anxiety symptoms, which commonly cooccur with depressive presentations in individuals seeking treatment. These results provide evidence to suggest that overall people who complete the programme experience a reduction in symptoms associated with depression, anxiety and their functioning impairment.
The Eating Disorders Programme (EDP) is an open day programme which provides specialised interventions for those who do not require inpatient hospitalisation, consistent with the aim of delivering care in the least restrictive environment. The focus of the day programme is nutritional rehabilitation, meal support and on-going psychological interventions around normal eating behaviour. The emphasis is on evidence-based interventions that target cognitions and other underlying factors maintaining the eating disorder behaviour. The day programme is delivered through group work, with individual interventions provided where indicated. Clinical inputs include dietetics, specialised nursing, occupational therapy and psychology. The EDP is run through a hybrid model with a mix of remote and onsite groups. Each service user’s attendance for the programme is individual and planned in consultation with the Eating Disorder Day Care team. The EDP is a service specifically oriented to meet the needs of people with anorexia nervosa, bulimia nervosa, binge eating disorder and Other
Specified Feeding and Eating Disorders (OSFED). The objective of the EDP is to address the physical, psychological and social issues arising as a result of an eating disorder in an attempt to resolve and overcome many of the struggles associated with it. The EDP is a multidisciplinary programme with an emphasis on a CBT treatment model which is applied throughout inpatient, day programme and outpatient treatment stages, as needed by the service user. The programme is structured into three stages. Initially service users are assessed at the Dean Clinic. The typical care pathway then involves inpatient care, day care and follow-up outpatient care. Treatment can also be provided in a standalone capacity as an inpatient, homecare service, day care service or as an outpatient.
Access to homecare is based on suitability and risk assessments and this remotely delivered service aims to mirror the inpatient experience as much as possible.
Inpatient care consists of a variety of interventions including:
Stabilisation of weight
Medical treatment of physical complications where present
Meal supervision
Nutritional assessment and treatment
Dietetics group: discuss nutrition, meal planning, shopping, food portions, etc.
Care planning, goal-setting and personal development
Occupational therapy groups: weekly groups addressing lifestyle balance, stress management and social, leisure and self-care needs. A weekly cookery session is also included in the programme.
Family support and education individual psychotherapy
Psychology groups for compassionate mind training which aims to help participants begin to understand, engage with and alleviate their distress.
Following inpatient treatment, service users will usually attend day services. Similarly, homecare service users can also attend day
services. Often service users will attend daily for the first two weeks and subsequently reduce attendance, which is decided by the service user and treating MDT. The day programme runs Monday to Friday and offers a number of group interventions delivered by nursing, occupational therapy, social work, dietitian and psychology MDT members including:
Occupational therapy groups
Goal-setting and care planning
Meal planning, preparation and cooking groups
Meal supervision and dietetics
Body image and self-esteem
Relaxation/self-reflection groups
Recovery-focused intervention (WRAP)
Social and relationship groups
Psychology groups for skills training in regulating emotions and tolerating distress.
Following day services, outpatient care is offered in the Dean Clinic. Services offered at the Dean Clinic include psychiatry, nursing, and dietitian reviews, along with Cognitive Behavioural Therapy – Eating Disorders (CBT-E), Maudsley Model of Anorexia Nervosa Treatment for Adults (MANTRA) and Specialist Supportive Clinical Management (SSCM) in order to support service users in their recovery.
4.13.1
Data was available for a total of 6 service users attending the EDP as an inpatient in 2025. Inpatient data was collected at two points, inpatient admission, and discharge. Data was available for 12 service users who attended EDP as a day service user in 2025. Day service user data was collected at either inpatient discharge or day service user admission as a pre-intervention measure, and then day service user discharge as their 156
post-intervention measure. 5 service users completed outcome measures for both the inpatient and day service programmes.
The following measures have been chosen to capture eating disorder severity and comorbidity and to assess readiness for change.
The Eating Disorder Examination Questionnaire (EDE-Q) is a wellestablished self-report instrument that investigates eating disorder behaviours and attitudes. It is a 36-item self-report questionnaire that measures change in eating disorder symptoms over the course of treatment. It is considered the ‘gold standard’ measure of eating disorder psychopathology and is designed to assess past month cognitive subscales related to eating disorders; restraint, eating concern, shape concern and weight concern, as well as behavioural symptoms related to these concerns (e.g. frequency of binge-eating, vomiting, use of laxatives or diuretics and over-exercise). The EDE-Q has demonstrated good internal consistency, with Cronbach’s alpha coefficients in the range between 0.70 to 0.83 in a clinical sample and from 0.78 to 0.93 in a general population sample (Luce & Crowther, 1999; Peterson et al., 2007; Jennings & Phillips, 2017). Participants are asked how often they have engaged in a range of eating disorder behaviours over the past 28 days, for example “have you been deliberately trying to limit the amount of food you eat to influence your shape or weight?” or “over the past 28 days, how many days have you eaten in secret?” Answers range from ‘no days’, ‘six to 12 days’, ‘23 to 27 days’ and ‘every day’. A cutoff of 2.8 has been recommended to screen for eating disorders (Velkoff et al., 2023).
Participants are also asked about how their weight/shape impacts their thoughts about themselves, e.g. “has your weight influenced how you think about yourself as a person?” or “how dissatisfied have you been with your shape?” Answers range from ‘not at all’, ‘slightly’, ‘moderately’ and ‘markedly’. The EDE-Q reports good internal consistency and with the
exception of some of the eating disorder behaviours, test re-test reliability has been reported to be fairly strong for both men and women.
The State Self-Esteem Scale is a 20-item scale that measures a participant’s self-esteem at a given point in time. The 20 items are subdivided into three components of self-esteem: performance selfesteem, social self-esteem and appearance self-esteem. All items are answered using a five-point scale (one = not at all, two = a little bit, three = somewhat, four = very much, five = extremely). Higher scores indicate higher levels of self-esteem.
Due to the small sample size, the statistical significance of changes in mean scores could not be calculated. For this reason, group pre and post total scores are reported below.
4.13.3.1
The total Global score on the EDE-Q showed slightly decreased symptomatology between pre-treatment M = 3.52 (SD = 1.43) and posttreatment M = 3.32 (SD = 1.14).
Moreover, the sub-scales of the EDE-Q showed mixed findings with some sub-scales demonstrating reduction in symptomatology by time point, while others reflecting slight increase in scores post-intervention. Symptomatology on the restraint sub-scale decreased from pre-treatment M= 2.82 (SD = 2.15) to post-treatment M = 2.04 (SD =1.54).
Symptomatology on the eating concern sub-scale decreased from pretreatment M= 3.07 (SD = 1.65) to post-treatment M = 2.82 (SD =1.37). In addition, the symptomatology on the shape concern sub-scale increased slightly from pre-treatment M= 4.17 (SD = 1.65) to post-treatment M = 4.27 (SD =1.53). Similarly, symptomatology on the weight concern sub-
scale reflected slight increase from pre-treatment M= 4.01 (SD = 1.3) to post-treatment M = 4.14 (SD =1.16). These findings have been depicted in Figure 4.82.
Figure 4.82 Pre and Post Group Mean Scores for the EDE-Q total and subscale scores
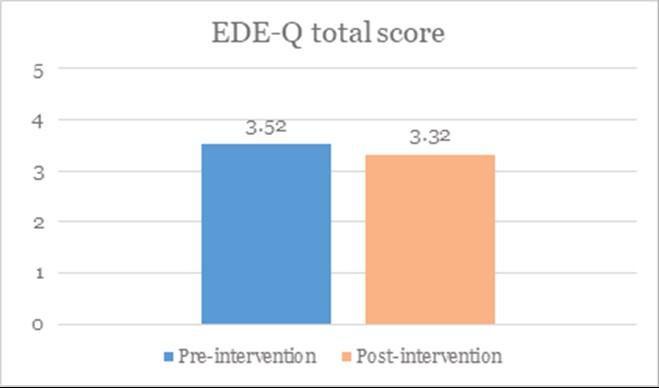
EDE-Q Shape Concern Subscale scores
Weight Concern Subscale scores
On the SSES, patients with measures at both timepoints showed slight increases in overall self-esteem as well as increases across the three subscales: performance self-esteem, appearance self-esteem and social selfesteem. At time two (inpatient discharge) mean score across all scales had increased pointing towards slight improvements across all domains.
The total score on the SESS showed an increase between pre-treatment (M=58.36, SD = 7.8) and post-treatment (M=60.1, SD = 6.78). Similarly, the performance self-esteem score on the SESS showed an increase between pre-treatment (M=18.46, SD = 3.21) and post-treatment (M=18.91, SD = 2.74). Additionally, the social self-esteem score on the SESS showed an increase between pre-treatment (M=25.36, SD = 7.15) and post-treatment (M=26.18, SD = 6.32). The appearance self-esteem score on the SESS showed an increase between pre-treatment (M=14.55, SD = 2.21) and post-treatment (M=15, SD = 1.90). These findings have been depicted in Figure 4.83.
Figure 4.83 Pre and Post Group Mean Scores for the State Self Esteem Scale total and subscale scores
SSES Appearance Self Esteem scores
Social Self Esteem scores
Eating Disorders Examination Questionnaire (EDE-Q)
A reduction of scores on the EDE-Q, measuring eating disorder symptomatology was observed. The total score on the EDE-Q showed decreased symptomatology between pre-treatment M = 3.28 (SD = 1.25) and post-treatment M = 2.19 (SD = 1.68).
Symptomatology on the restraint sub-scale decreased from pre-treatment M = 1.8 (SD = 1.75) to post-treatment M = 1.33 (SD = .8).
Symptomatology on the eating concern sub-scale decreased from pretreatment M = 3.08 (SD = 1.59) to post-treatment M = 1.76 (SD = 1.6).
Additionally, symptomatology on the shape concern sub-scale decreased from pre-treatment M = 4.38 (SD = 1.24) to post-treatment M = 2.88 (SD = 1.89). Finally, symptomatology on the weight concern sub-scale
decreased from pre-treatment M = 3.84 (SD = 1.35) to post-treatment M = 2.78 (SD = 1.89). These findings have been depicted in Figure 4.84.
Figure 4.84 Pre and Post Group Mean Scores for the EDE-Q Global and subscale scores.
EDE-Q total score
EDE-Q Eating Concern Subscale scores
EDE-Q Shape Subscale scores
The total score on the SESS showed a slight decrease between pretreatment M=59.82 (SD = 6.21). and post-treatment M=56.41 (SD = 10.95). The performance self-esteem score on the SESS showed a slight decrease between pre-treatment M=19.88 (SD = 3.02) and posttreatment M=18.65 (SD = 3.06). The social self-esteem score on the SESS showed slight decrease between pre-treatment M=24.65 (SD = 4.83) and post-treatment M=22.18 (SD = 8.39). The appearance self-esteem score on the SESS remained the same between pre-treatment M= 15.29 (SD = 1.83) and post-treatment M=15.58 (SD = 4.65). These findings have been depicted in Figure 4.85.
Figure 4.85 Pre and Post Group Mean Scores for the State Self-Esteem scale total and subscale scores.
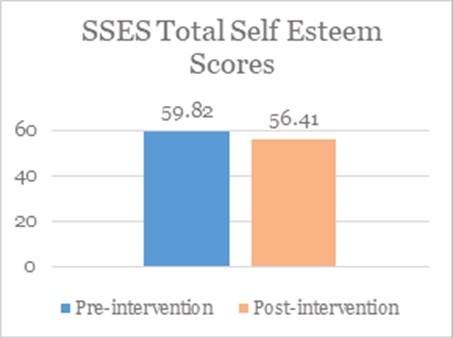
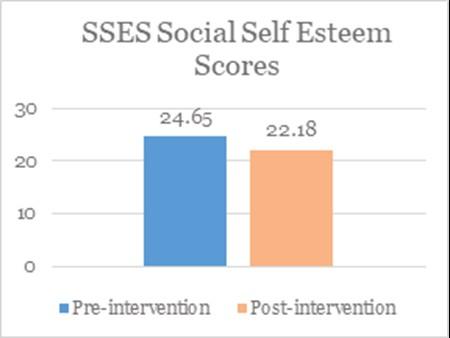
The Eating Disorders Programme (EDP) is a specialist service for people with anorexia nervosa, bulimia nervosa, binge eating disorder, and OSFED. It supports recovery by addressing the physical, psychological, and social impacts of eating disorders.
Exploration of the data collected via outcome measures in 2025 generally reflect mixed findings for those who attend the Eating Disorder Programme as an inpatient in relation to eating disorder symptomology as measured by the EDE-Q. There were slight improvements in self-esteem across a range of domains as measured by the SSES Bigger improvements in eating disorder symptoms were observed for those who took part in the Day Programme. One likely explanation for this finding is that those who had taken part in the inpatient programme beforehand may have already made gains leading to additional improvements during the course of the Day Programme.
Of note is that there was a decline in the number of pre and post measures collected for individuals completing the EDP, resulting in inability for statistical analyses to be performed. The EDP team are confident that the number of day programme pre and post outcome measures collected will improve during 2026 following changes to the process for collection of outcome measures.
The Emotion-Focused Therapy for Young Adults (EFT-YA) programme proposes that the young adult population commonly describe finding themselves stuck at specific developmental points in their lives. These may take the form of vocational crisis (dropping out of college or repeatedly losing employment opportunities), systemic issues (difficulty in achieving psychological individuation and autonomy from family of origin), stuck in unhelpful patterns of behaviour (disorganised attachment/interpersonal difficulties), maladaptive coping strategies, difficulty in achieving developmental milestones (perception of being ‘left behind’ by ‘more successful’ peers). It is postulated that this sense of ‘stuckness’ is mirrored in the internal psychological processing issues experienced by the young adult. It suggests that a fear of/reluctance/inability to access and tolerate the effect associated with core pain leads the young person to engage in emotional and behavioural avoidance strategies which are successful to the extent that they frustrate effective and meaningful processing of this pain. The young person then finds themselves in a state of undifferentiated Global Distress, characterised by secondary emotional experiencing, (i.e. rejecting anger, anxiety, hopelessness, agitation etc). This state can be triggered by current and historic triggers which may be internal and external and is complicated by problematic self-treatment (excessive self-criticism, shame and fear). By accessing the core pain and by identifying the associated needs, the young adult can move beyond global distress and begin to access the necessary compassion and protective anger required to support them in their journey towards relief from their pain and a towards a sense of agency/empowerment.
The purpose of an EFT-YA group for this population would be to support a move to more adaptive emotional functioning through accessing, tolerating and, where possible, transforming/processing hitherto unavailable or aversive emotional experiences. All of this is to be
enhanced on this programme by harnessing the healing benefits of a group experience where that which was previously experienced as shameful or frightening, can be overcome through connection with others and awareness of shared difficulties. The group will mainly utilise chair work techniques (two-chair dialogue for critical split and empty chair dialogue for unfinished business) to work towards resolving issues associated with fear and shame, by accessing the core emotional pain implicit in problematic emotion schemes which will be experientially evoked and worked within session.
“EFT’s theory of psychopathology places emotions at the centre of dysfunction/ function. Emotions are fulfilling many functions. They inform us as to whether our needs are being met, they communicate to others about our internal world, and they set the goals for our rational pursuits (Greenberg, 2011). In terms of psychopathology, EFT sees service users as either, not fully availing of the adaptive information embedded in their emotional experience (e.g. sadness tells me what I miss) or, and more typically, as experiencing chronic, painful, and maladaptive emotions generated through complex memory-based emotional schematic processes (Greenberg, 2016).” (Timulak and Keogh, 2020)
Emotion-Focused Therapy (EFT) is an empirically supported therapy (Greenberg, 2011; Greenberg and Watson, 2005; Greenberg and Watson, 2006) with roots in the person-centred, gestalt, experiential and existential therapies (Rogers, 1957, Gendlin, 1996; Elliott, Watson, Goldman & Greenberg, 2004). It has evolved gradually over twenty-five years through a systematic program of psychotherapy research and in its current incarnation, incorporates elements of contemporary cognitive and emotion theory (Greenberg, 2011). The evolution of EFT is directly attributable to its origins in a research-based investigation of change processes in psychotherapy (Greenberg, 1979; 1984; Rice & Greenberg,
1984) in tandem with a curiosity regarding the role of emotion (Greenberg & Safran, 1987).
This group program utilizes a transdiagnostic model of Emotion-Focused Therapy (EFT-T), which combines modular (targeting specific clusters of symptoms) and shared mechanisms (targeting underlying vulnerability) approaches to the treatment of depression, anxiety and related disorders (Timulak & Keogh, 2020). The program encompasses recent developments in EFT case-formulation (Timulak & Pascual-Leone, 2015; Timulak & McElvaney, 2016) and utilizes empirically supported principles of psychotherapeutic change (Pascual-Leone & Greenberg, 2007; Timulak, 2015).
Emotion-Focused Group Therapy (EFT-G) is a novel therapy format that utilizes individual Emotion-Focused Therapy (EFT) work in a group setting to evoke and transform painful emotions, both directly and vicariously (Thompson & Girz, 2018). Research into EFT-G has revealed participants report statistically and clinically significant decreases in depression and anxiety symptoms, as well as significant improvements in emotion regulation (Thompson & Girz, 2020).
The EFT team has undertaken research with EFT-YA attendees since its commencement. The preliminary effectiveness of EFT was supported for reducing anxiety and depressive symptoms and increasing self-reported overall wellbeing. In terms of feasibility and acceptability, improvements were found and reported across participants. This particular research was awarded first prize in the professional poster category at the Psychological Society of Ireland Conference 2022.
EFT-YA is a 20-week programme. Prior to commencing group, each participant has two individual sessions to help them orient to the model and begin the process of engaging with their emotional processing style. This is essential to support the individual’s future engagement with group (Thompson & Girz, 2020).
4.14.1 Descriptors
A total of 12 people completed EFT- YA in 2025. Complete pre and post outcome data were available for 11 people, representing a 92% total completion rate. Of 11 participants 8 (73%) were female and 3 (27%) were male. Participants ages ranged from 19 to 25 years (M = 22.73; SD 1.56).
Missing Value Analysis (MVA) was carried out to examine the type of ‘missingness’ within the data. Where data was found to be Missing Completely at Random by Little’s Test (Cheng & Evanston, 2013) the Expectation Maximisation method was applied before any total scores were computed or analyses carried out.
4.14.2 Emotion-Focused Therapy for Young Adults Programme outcome measures
Difficulties in Emotion Regulation Scale (DERS)
The Difficulties in Emotion Regulation Scale (DERS; Gratz and Roemer, 2004) assesses emotion dysregulation. It comprises six domains: nonacceptance of emotions; inability to engage in goal-directed behaviours when distressed; impulse control; emotional awareness; emotion regulation strategies; and emotional clarity. The measure consists of 36 items scored on a five-point Likert scale from one – ‘almost never’, to five – ‘almost always’. Total scale scores range from 36 to 180, with higher scores indicating greater difficulties regulating emotion. Gratz and Roemer (2004) reported good internal reliability (α = .93), construct and predictive validity, and test-retest reliability in an article which described the development of this scale.
The Generalised Anxiety Disorder-7 (GAD-7)
The Generalised Anxiety Disorder-7 (GAD-7) is a seven-item self-report measure which assesses the presence and severity of GAD symptoms over the past two weeks (Spitzer, Kroenke, Williams, & Löwe, 2006). A score of eight or greater represents a reasonable cut-point for identifying probable cases of generalised anxiety disorder. Research has demonstrated the reliability and validity of the GAD-7 in both primary care settings and the general population (Löwe et al., 2008).
The PHQ-9 is a nine-item self-report questionnaire. It is a clinically validated screening tool that healthcare providers use to monitor the severity of depression and response to treatment (Kroenke, Spitzer, Williams, 2001). The questions address sleep, energy, appetite, and other possible symptoms of depression. It assesses how often a service user has “been bothered by any of the following problems” in the past two weeks. Scores are calculated based on how frequently a person experiences these feelings and aims to predict the presence and severity of depression. Scores represent: 0-5 = mild, 6-10 = moderate, 11-15 = moderately severe anxiety, 15-21 = moderately severe and 15-21 = severe depression.
The Clinical Outcomes in Routine Evaluation - Outcome Measure (COREOM) is a 34-item self-report questionnaire developed to monitor clinically significant change in outpatients. The service user is asked to respond to 34 questions about how they have been feeling over the last week using a five-point Likert scale ranging from ‘not at all’, to ‘most or all the time’. The 34 items of the measure cover four dimensions: subjective wellbeing, problems/symptoms, life functioning and risk/harm.
The responses are designed to be averaged by the practitioner to produce a mean score to indicate the level of current psychological global distress (from healthy to severe). The scoring range of the CORE-OM is between zero and four, with four being the highest level of severity. The CORE Outcome Measure (CORE-OM) was conceived as a non-proprietary measure of psychological distress. Crucially, it was informed by feedback from practitioners as to what they considered to be important to include (Barkham et al, 2010). Since its development, the CORE-OM has been validated with samples from the general population, NHS primary and secondary care and in older adults. Furthermore, analyses of over 2,000 responses show good reliability and convergent validity against longer
and less general measures; small gender effects, large clinical/non-clinical differences and good sensitivity to change (Evans et al, 2009).
Results were examined and compared in greater detail including overall mean, individual and programme cycle scores. Due to the small sample size, statistical analysis of the outcome measures was not possible. The small sample size is due to the fact that this programme is a specialist intervention delivered to a small group of service users, to meet their specific therapeutic needs. Acceptable power was not achieved to reliably conduct statistical operations on the data. G*Power analysis indicated that in order to achieve sufficient statistical power, a sample size of 27 participants would have been required to detect a medium effect size (Cohen’s d=0.5). Therefore, for each measure individual results for the 11 participants who returned both pre and post measures are given to reflect the outcome of the intervention.
Due to the small sample size, changes in the DERS scores were analysed using the Reliable Change Index (RCI) for each participant. To ensure that changes in DERS scores were not attributable to chance or measurement error a reliable change index (RCI) was calculated for each participant using the Jacobson-Truax method (1991). In accordance with this method, statistically reliable change was reflected by RCI values equal to or larger than 1.96. The cut-off score indicating clinically meaningful improvement on the DERS was 95 (Erez and Gordon, 2025). Participants were classified as “clinically meaningful improvement” (passed RCI criterion and DERS score decreased to below cut-off score), “reliable improvement” (passed RCI criterion but the score did not decrease below DERS cut-off score), “uncertain change” (did not pass RCI criterion) or deterioration (passed RCI criterion but symptom score increased).
Results for the reliable change index indicated that six participants (55%) reported clinically meaningful improvement, two participants (18%)
reported reliable improvement, three participants (27%) reported uncertain change, and no participants (0%) reported reliable deterioration (see table 4.86).
Table 4.86 Results from Reliable Change Index (RCI) for the DERS pre and post scores for each group member
Comparison of service user mean scores on the DERS indicated a decrease in scores from
(M = 129.86; SD = 20.38) to post-intervention (M = 92.64; SD = 30.12).
There were reductions in mean scores for all six of the DERS sub-scales.
There was a reduction in the DERS sub-scale Non-Acceptance of Emotions scores from pre-intervention (M = 23.86; SD = 6.57) to post-intervention (M = 15.73; SD = 6.37); the DERS sub-scale Impulse Control from preintervention (M = 18.82; SD = 6.26) to post-intervention (M = 12.27; SD = 6.77); the DERS sub-scale Emotional Awareness from pre-intervention (M = 20; SD = 3.35) to post-intervention (M = 15.18; SD = 5.46); the DERS sub-scale Emotional Regulation Strategies from pre-intervention (M = 30.82; SD = 5.33) to post-intervention (M = 21.55; SD = 8.25); the DERS sub-scale Inability to Engage in Goal-Directed Behaviours when Distressed from pre-intervention (M = 18.18; SD = 2.36) to post-intervention (M = 15.64; SD = 3.53) and the DERS subscale Emotional Clarity from preintervention (M = 18.18; SD = 3.82) to post-intervention (M = 12.27; SD = 3.69).
These findings indicate that those who completed the EFT-YA programme in 2025 increased their capacity for emotional regulation as well as yielded improvements in impulse control and emotional awareness (see Figure 4.87).
Figure 4.87 Pre and post-group mean scores for the Difficulties in Emotion Regulation Scale (DERS) total and subscale scores.
DERS Non-Acceptance of Emotions
Subscale Mean Scores Comparison
DERS Emotional Awareness
Subscale Mean Scores Comparison
DERS Impulse Control
Subscale Mean Scores Comparison Pre-intervention
DERS Emotional Regulation Strategies
Subscale Mean Scores Comparison
DERS Emotional Clarity
Subscale Mean Scores Comparison
DERS Inability to Engage in Goal Directed Behaviours
Subscale Mean Scores Comparison
Further examination of the individual scores indicates that ten out of eleven (91%) participants showed a reduction in DERS total scores from pre-intervention to post-intervention (see Figure 4.88).
Figure 4.88 Pre and post individual scores of the Difficulties in Emotion Regulation Scale (DERS) total scores.
Pre Post
Comparison of service user mean scores on the GAD-7 indicated a decrease in scores from pre-intervention (M = 10.91; SD = 6.64) to postintervention (M = 8.09; SD = 5.79). The finding indicates that those who completed the programme did reduce their anxiety symptoms (see Figure 4.89).
Figure 4.89. Pre and post-group mean scores for the Generalised Anxiety Disorders-7 (GAD-7).
Further examination of the individual scores indicates that six out of eleven (55%) participants showed a reduction in GAD-7 total scores from pre-intervention to post-intervention (see Figure 4.90).
Figure 4.90 Pre and post-group individual scores for the Generalised Anxiety Disorders-7 (GAD-7).
The Patient Health Questionnaire-9 (PHQ-9)
Comparison of service user mean scores on the PHQ-9 indicated a decrease in scores from pre-intervention (M = 15.64; SD = 5.71) to postintervention (M = 10; SD = 6.47). The finding indicates that those who completed the programme did reduce their symptoms related to depression.
Figure 4.91 Pre and post-group mean scores for the Patient Health Questionnaire-9 (PHQ-9)
As can be seen from the below graph, further examination of the individual scores indicates that ten out of eleven (91%) participants showed a reduction in PHQ-9 total scores from pre-intervention to postintervention.
Figure 4.92 Pre and post-group individual scores for the Patient Health Questionnaire-9 (PHQ-9).
The Clinical Outcomes in Routine Evaluation (CORE)
There was a reduction in the CORE total scores from pre-intervention (M = 56.05; SD = 16.42) to post-intervention (M = 52.73; SD= 17.46).
There was further a reduction of scores on: the CORE subscale of problems from pre-intervention (M = 24.77; SD = 12.73) to post-
intervention (M = 20.36; SD = 12.76) and the CORE subscale of risk from pre-intervention (M = 3.45; SD = 2.94) to post-intervention (M = 2; SD = 3.19). However, slight increases were observed in scores on the CORE subscale life functioning from pre-intervention (M = 21.10; SD = 2.45) to post-intervention (M = 22.09; SD = 3.62) and the CORE subscale of wellbeing from pre-intervention (M = 6.73; SD = 1.85) to post-intervention (M = 8; SD = 2.24) showing small increases in functional difficulties and reduced wellbeing.
Figure 4.93 Pre and post-group mean scores for the Clinical Outcomes in Routine Evaluation (CORE) total and subscale scores.
Total Mean Scores Comparison
Risk
Subscale Mean Scores Comparison
Further examination of the individual scores indicates that six out of eleven (55%) participants showed a reduction in CORE total scores from pre-intervention to post-intervention (see Figure 4.94).
Figure 4.94 Pre and post-group individual scores for the Clinical Outcomes in Routine Evaluation (CORE).
4.14.4 Summary
This was the fourth year the Emotion-Focused Therapy for Young Adults (EFT-YA) programme has been delivered by SPMHS. The programme targets difficulties related to anxiety, depression, stress and complex trauma. It does this by transforming maladaptive shame and fear by accessing primary emotion.
In 2025, young adults who completed the programme showed increases in their capacity for emotional regulation strategies, as well as having reported improvements in non-acceptance of emotions, impulse control and emotional awareness. Outcome measure data also indicated reductions in overall symptom severity across the PHQ-9, GAD-7 and CORE scores. Specially, GAD-7 scores demonstrated a shift from the moderate anxiety range (scores 10-14) to scores at or below the clinical cut-off of 8 (scores of 5-9), reflecting improvement across anxiety-related domains (Plummer et al., 2016). Similarly, PHQ-9 scores showed a reduction from the moderately severe depression range (scores of 15-19) at pre-intervention to moderate depressive symptomatology at postintervention (scores of 10-14) (Kroenke et al., 2001). These findings further illustrate the positive improvements observed among young adults who engaged in EFT-YA.
Dialectical Behaviour Therapy (DBT) originated in the 1980s as a behavioural treatment for repetitive suicidal behaviours (Swales, 2019). It was initially developed for borderline personality disorder (BPD), a condition characterised by emotional and behavioural dysregulation that often leads to self-harm and suicidal behaviours (Flynn et al., 2019). DBT integrates behaviour therapy, Zen Buddhist principles, and a dialectical philosophy (Robins, 2002). Its overarching aim is to support service users in developing a life worth living (Rizvi et al., 2024). DBT conceptualises treatment in five stages: pre-treatment followed by four active stages—1) Control, 2) Order, 3) Synthesis, and 4) Transcendence. St Patrick’s Mental Health Services delivers pre-treatment and Stage 1 DBT on an outpatient basis, supporting individuals to move from behavioural dyscontrol to stability and behavioural control (Robins et al., 2018).
DBT directly targets:
1. life-threatening behaviours,
2. therapy-interfering behaviours (by client or therapist), and
3. other severe or destabilising behaviours (Linehan et al., 2006).
To address these targets, DBT aims to:
1. increase behavioural capabilities,
2. improve motivation for skilful behaviour,
3. ensure generalisation of skills to the environment,
4. structure the treatment environment to reinforce adaptive behaviour, and
5. enhance therapist capability and motivation (Linehan et al., 2006).
These functions are delivered across four modes: weekly individual psychotherapy, weekly group skills training, phone coaching as needed, and weekly therapist consultation team meetings (Linehan, 1993). Standard DBT is delivered over 12 months, with the full skills curriculum repeated twice. Although originally designed for BPD, DBT has an emerging evidence base for other conditions, including eating disorders (Telch et al., 2001), addiction (Linehan et al., 1999; 2002), and PTSD (Harned et al., 2014). It is increasingly recognised as a transdiagnostic treatment for individuals with emotion regulation difficulties (Neacsiu et al., 2014a; Ritschel et al., 2015).
Multiple randomised controlled trials have evaluated the efficacy of the standard 12-month DBT programme (Linehan et al., 1991; Linehan et al., 2006; Priebe et al., 2012). Two Cochrane Reviews have shown DBT to be superior to treatment as usual in reducing BPD symptom severity, self-harm, and psychosocial impairment (Storebø et al., 2020). DBT is therefore considered an empirically supported treatment in its full 12-month format.
Brief DBT
A growing research area examines whether DBT can be delivered effectively in shorter timeframes. There is currently no evidence base identifying an optimal psychotherapy duration for BPD (McMain et al., 2018). Early findings from the first DBT Randomised Control Trial (RCT) (Linehan et al., 1991) indicated significant improvements by four months, suggesting that briefer interventions may be viable (Seow et al., 2022). However, the optimal length of treatment remains unknown (McMain et al., 2018).
Potential advantages of briefer DBT include:
• more rapid reduction in self-harm risk,
• increased safety and reduced need for inpatient admission,
• greater service capacity and reduced cost, and
• lower dropout rates, which remain high in standard and skills-only DBT (Seow et al., 2022).
Although research is limited, several studies support shorter DBT models. Koons et al. (2001) conducted an RCT comparing six months of DBT to treatment as usual for female veterans with BPD (n=10 per group), finding greater improvements in suicidal ideation, hopelessness, depression, and anger expression. A larger Australian non-randomised study (n=45) found significant improvements in suicidal ideation/non-suicidal self-injury, emergency department visits, hospital admissions, and bed days, as well as self-reported reductions in depression, anxiety, and general symptom severity (Pasieczny & Connor, 2011).
A major development in the field came from McMain et al. (2022), who conducted a two-arm, single-blind, randomised controlled non-inferiority trial comparing 6-month and 12-month DBT for suicidal or self-harming individuals with BPD. DBT-6 was non-inferior to DBT-12 for general psychopathology, self-harm, and coping skills at 24-month follow-up. Notably, the 6-month group showed a more rapid reduction in BPD symptoms and general psychopathology. This represents a significant
shift in the literature, suggesting treatment duration may be halved without compromising effectiveness.
To address resource demands, some services have trialled offering only the skills-training component of DBT. Lyng et al. (2020) compared six months of standalone DBT skills training for adults with BPD to six months of standard DBT. The skills-only group used a stepped-care model, excluding individuals with self-harm or suicidal behaviour in the previous six months. No significant differences were found between treatment conditions. Overall, research suggests that skills-only DBT is best used as an adjunctive or stepped-down intervention for individuals not currently engaging in life-threatening behaviours (Lyng et al., 2020; Neacsiu et al., 2010).
The DBT programme in St Patrick’s University Hospital is a Stage 1 DBT programme, focusing on helping individuals move from out-of-control behaviour to behavioural control, even in the presence of high-intensity emotions (Rizvi & Sayrs, 2020). The programme is offered transdiagnostically to individuals with pervasive difficulties in understanding and managing emotions, and who engage in maladaptive behaviours to regulate distress.
DBT at SPMHS is delivered in an intensive format, with group skills training occurring twice weekly over a three-month period. The service offers a brief intensive comprehensive DBT programme (all modalities) and a standalone skills group for individuals not currently engaging in a pervasive pattern of life-threatening behaviours. Skills groups are available both in person and online.
In 2025, ten DBT groups were delivered:
three brief intensive comprehensive DBT streams,
three in-person DBT-informed skills groups,
three online DBT-informed skills groups, and
one pilot DBT graduate group (October 2025), delivered over eight weekly sessions to support previous DBT graduates in generalising skills and applying them to their Life Worth Living goals. All groups were closed groups, meaning no new members joined after commencement. Table 4.95 provides details of all interventions.
within office hours
Weekly therapist consultation team meetings building and skills acquisition/ generalisation.
Weekly therapist consultation team meetings commitment building and skills acquisition/ generalisation.
Weekly therapist consultation team meetings n team meetings
Data from nine cycles of the programme are described below, all of which finished in 2025. Data analysis of the Comprehensive DBT and DBT skills group are reported separately.
Difficulties in Emotion Regulation Scale (DERS)
The Difficulties in Emotion Regulation Scale (DERS; Gratz and Roemer, 2004) assesses emotion dysregulation. It comprises six domains: nonacceptance of emotions; inability to engage in goal-directed behaviours when distressed; impulse control; emotional awareness; emotion regulation strategies; and emotional clarity. The measure consists of 36 items scored on a five-point Likert scale from one – ‘almost never’, to five – ‘almost always’. Total scale scores range from 36 to 180, with higher scores indicating greater difficulties regulating emotion. Gratz and Roemer (2004) reported good internal reliability (α = .93), construct and predictive validity, and test-retest reliability in an article which described the development of this scale.
DBT Ways of Coping Checklist (DBT-WCCL)
The Dialectical Behaviour Therapy Ways of Coping Checklist (DBT-WCCL; Neacsiu et al, 2010) is a 59-item self-report inventory measuring DBT skills use. It contains two main subscales the DBT skills subscale (DSS) and the Dysfunctional Coping Subscale (DCS). The measure consists of 59 items scored on a four-point Likert scale (0 = never used; 3 = regularly used). Higher mean scores on the DSS indicate greater use of DBT skills while higher mean scores on the DCS indicate greater use of unhelpful coping behaviours. Test-retest reliability and content validity analyses showed the scale to have good to excellent properties (Neacsiu et al., 2010). The test has been validated for use as a measure of DBT skills use in a psychiatric population beyond the original borderline personality disorder sample the originators studied (Stein et al, 2016).
Five Facet Mindfulness Questionnaire – Short Form (FFMQSF)
The Five Facet Mindfulness Questionnaire - Short Form (FFMQ-SF; Bohlmeijer at al., 2011) is a 24-item shortened version of the five-facet mindfulness questionnaire (Baer et al. 2006). It measures five facets of mindfulness, observing, describing, acting with awareness, non-judging and nonreactivity. It was originally tested in a sample of adults with depression and anxiety and subsequently cross validated in a sample of adults with fibromyalgia (Bohlmeijer et al., 2011). It has also previously been used to assess DBT participants’ acquisition of mindfulness (Kells et al., 2020). The five facets of mindfulness displayed adequate internal consistency with alpha coefficients ranging from 0.73 for nonreactivity to 0.91 for describing (Bohlmeijer et al., 2011). Confirmatory factor analysis showed a good model fit for a correlated five-factor structure of the FFMQSF (Bohlmeijer et al., 2011).
4.15.2 Descriptors for DBT Comprehensive Programme
Pre- and post-programme data were available for 13 participants who completed the DBT Comprehensive programme in 2025. Of the 13 participants, 69.2% were female, 15.4% were male, 7.7% were
transgender and 7.7% identified as gender non-conforming. DBT attendees ranged in age from 18 to 54 years, with a mean age of 29.69 years (SD = 11.38). Of the eleven participants who responded regarding education, their highest level of educational attainment included Junior Certificate (9.1%), Leaving Certificate (36.4%), third level non-degree qualification (9.1%), third level degree (36.4%) and postgraduate qualification (9.1%). Attendees’ current employment status was also recorded, of the eleven participants who responded, 36.4% were in fulltime employment, 36.4% were in part-time employment, 18.2% were unemployed, and 9.1% worked in the home.
Results were examined and compared in greater detail including overall mean, individual and cycle scores. Due to the small sample size, statistical analysis of the outcome measures was not possible. Acceptable power was not achieved to reliably conduct statistical operations on the data. G*Power analysis indicated that in order to achieve sufficient statistical power, a sample size of 27 participants would have been required to detect a medium effect size (Cohen’s d=0.5). Therefore, for each measure individual results for the 13 participants who returned both pre and post measures are given to reflect the outcome of the intervention.
Due to the small sample size, changes in the DERS scores were analysed using the Reliable Change Index (RCI) for each participant. To ensure that changes in DERS scores were not attributable to chance or measurement error a reliable change index (RCI) was calculated for each participant using the Jacobson-Truax method (1991). In accordance with this method, statistically reliable change was reflected by RCI values equal to or larger than 1.96. The cut-off score indicating clinically meaningful improvement on the DERS was 95 (Erez and Gordon, 2025). Participants were classified as “clinically meaningful improvement” (passed RCI criterion and DERS score decreased to below cut-off score), “reliable improvement” (passed RCI criterion but the score did not decrease below DERS cut-off score), “no
reliable change” (did not pass RCI criterion) or “reliable deterioration” (passed RCI criterion but symptom score increased). As outlined in the table 4.16, four participants (30.77%) reported clinically significant improvement, five participants (38.5%) reported reliable improvement, four participants reported uncertain change (30.77%), and no participants (0%) reported reliable deterioration (see table 4.96).
Table 4.96 Results from Reliable Change Index (RCI) for the DERS pre and post scores for each group member
Comparison of service user mean scores on the DERS indicated a decrease in scores from pre-intervention (M = 143.23; SD = 21.90) to post-intervention (M = 111.38; SD = 35.26).
There were reductions in mean scores for all six of the DERS sub-scales. There was a reduction in the DERS sub-scale Non-Acceptance of Emotions scores from pre-intervention (M = 25.31; SD = 6.14) to post-intervention (M = 20.31; SD = 6.87). There was a reduction in the DERS sub-scale Impulse Control from pre-intervention (M = 22.92; SD = 6.70) to postintervention (M = 16.00; SD = 6.53). There was a reduction in the DERS sub-scale Emotional Awareness from pre-intervention (M = 22.62; SD =5.01) to post-intervention (M = 17.85; SD = 7.21). There was a reduction in the DERS sub-scale Emotional Regulation Strategies from preintervention (M = 31.85; SD = 6.76) to post-intervention (M = 24.85; SD = 9.75). There was a reduction in the DERS sub-scale Inability to Engage in Goal-Directed Behaviours when Distressed from pre-intervention (M = 21.77; SD = 3.56) to post-intervention (M = 17.15; SD = 4.02). There was a reduction in the DERS sub-scale Emotional Clarity from pre-intervention (M = 18.77; SD = 4.25) to post-intervention (M = 15.23; SD = 5.05).
These findings indicate that those who completed the DBT Comprehensive programme in 2025 increased their capacity for emotional regulation as well as yielded improvements in impulse control and emotional awareness (see Figure 4.97 below).
Figure 4.97 Pre- and post-group mean scores for the Difficulties in Emotion Regulation Scale (DERS) total and subscale scores.
Non-Acceptance of Emotions
DERS Impulse Control Subscale Mean Scores Comparison
Emotional Regulation Strategies
DERS Inability to Engage in Goal Directed Behaviours Subscale Mean Scores Comparison
As can be seen from Figure 4.98, further examination of the individual scores indicates that 11 out of 13 (84.6%) participants showed a reduction in DERS total scores from pre-intervention to post-intervention (see Figure 4.98).
Figure 4.98 Pre and post individual scores of the Difficulties in Emotion Regulation Scale (DERS) total scores.
Comparison of service user mean scores on the FFMQ-SF indicated an increase in scores from pre-intervention (M = 55.83; SD = 11.86) to postintervention (M = 70.35; SD = 18.87), suggesting that participants had greater mindful qualities upon completion of the programme.
Mean scores increased for all five of the FFMQ-SF sub-scales. Mean scores on the Observing subscale increased from 12.62 (SD = 4.81) at preintervention to 14.31 (SD = 4.23) at post-intervention. Mean scores on the Describing subscale increased from 12.00 (SD = 5.34) at pre-intervention to 15.15 (SD = 5.16) at post-intervention. Mean scores on the NonReactivity subscale increased from 10.88 (SD = 3.61) at pre-intervention to 14.46 (SD = 4.22) at post intervention. Mean scores on the Acting with Awareness subscale increased from 10.71 (SD = 3.66) at pre-intervention to 13.92 (SD = 4.29) at post-intervention. Mean scores on the Non-Judging subscale increased from 9.63 (SD = 4.01) at pre-intervention to 12.50 (SD = 4.32) at post intervention (see Figure 4.99 below).
Figure 4.99 Pre and post-group mean scores for the FFMQ-SF total and subscale scores.
FFMQ Observing Subscale Mean Scores Comparison
Acting with Awareness Subscale Mean Scores Comparison
Non-Reactivity Subscale Mean Scores Comparison
As can be seen from Figure 5.0, further examination of the individual scores indicates that 12 out of 13 (92.3%) participants showed an increase in FFMQ-SF total scores from pre-intervention to postintervention.
Figure 5.0 Pre and post individual scores of the FFMQ-SF total scores.
Results for the DBT WCCL sub-scales indicated that participants reported an increase in the use of their DBT Skills. Mean scores on the Skills Use Subscale increased from 1.44 (SD = 0.59) at pre-intervention to 1.96 (SD = 0.50) at post-intervention. Mean scores on the General Dysfunctional Coping Subscale decreased from 2.42 (SD = 0.46) at pre-intervention to 1.87 (SD = 0.66) at post-intervention. This indicates that participants’ abilities to cope improved upon completing the intervention. Participants’ mean scores on the Blaming Others Subscale also showed a reduction from 1.41 (SD = 0.82) to 1.26 (SD= 0.60) post-intervention (see Figure 5.1)
Figure 5.1 Pre- and post-group mean scores for the DBT-WCCL subscale scores.
Skills Use Subscale
DBT-WCCL General Dysfunctional Coping Subscale Mean Scores Comparison Pre-intervention Post-intervention
Blaming Others Subscale
As can be seen from Figure 5.2, further examination of the individual scores indicates that 11 out of 13 (84.6%) participants showed an increase in the DBT-WCCL Skills Use Subscale from pre-intervention to post-intervention, 13 out of 13 (100%) participants showed a reduction in the DBT-WCCL Dysfunctional Coping Subscale scores from preintervention to post-intervention, and 6 out of 13 (46.2%) participants
showed a reduction in the DBT-WCCL Blaming Others Subscale scores from pre-intervention to post-intervention (see Figure 5.2).
Figure 5.2 Pre and post individual scores of the DBT-WCCL individual total scores.
DBT-WCCL Skills Use Subscale Individual Total Scores
DBT-WCCL Dysfunctional Coping Subscale Individual Total Scores
Complete pre and post data was available for 39 participants who completed the DBT Skills Only group in 2025. Of these 39, 29 (74.4%) were female, 7 (18%) were male, 2 (5.1%) were non-binary, and one gender non-conforming (2.6%). The mean age of participants was 35.46 (SD = 11.54), ranging from 19 to 57 years.
Their highest level of educational attainment included Junior Certificate (5.1%), Leaving Certificate (25.6%), third level non-degree qualification (17.9%), third level degree (30.8%) and postgraduate qualification (17.9%). 2.6% chose ‘other’ as their highest level of educational attainment. Attendees’ current employment status was also recorded. 35.9% were in full-time employment, 223.1% were unemployed, 17.9% were in part-time employment, 2.6% worked in the home, 7.7% were students and 7.7% chose other.
Difficulties in Emotion Regulation Scale (DERS)
Significant gains were made on the Difficulties in Emotion Regulation Scale (DERS) from pre- to post-intervention. Participants experienced a decrease in difficulties regulating emotions moving from a mean score of 123.38 (SD = 17.33) on the DERS at pre-intervention to 92.00 (SD = 26.05) post-completion of the programme; t (38) = 6.90, p < .001. This
change represented a large effect size (Cohen’s d = 1.11). See Figure 5.3 below for visual representation.
Figure 5.3 Pre- and post-group mean scores of Difficulties in Emotion Regulation Scale (DERS).
Pre-intervention Post-intervention
Note: Higher scores indicate greater difficulties with emotional regulation
Pre and post data was available for 39 participants who completed this measure during 2025. Total mean scores of 63.26 (SD = 10.19) at preintervention increased to 78.08 (SD = 14.02) at post-intervention, suggesting that participants had greater mindful qualities upon completion of the programme. A paired samples t-test indicated that this increase was statistically significant, t (38) = -6.64, p = <.001 with a large effect size (d = -1.06).
Significant increases were observed across all five subscales in the FMMQ (see Figure 5.4 for visual representation). There was an increase on total scores on the observing subscale from 13.13 (SD = 3.53) at preintervention to 14.74 (SD = 3.41) at post-intervention. A paired samples ttest indicated that this increase was statistically significant, t (38) = -3.61, p = <.001 with a medium effect size (d = -0.58).
Total scores on the describing subscale increased from 15.10 (SD = 4.32) at pre-intervention to 17.79 (SD = 3.88) at post-intervention, t (38) =4.77, p <.001. A medium to large effect size was observed (d = -0.76).
Total scores on the Nonreactivity subscale increased from 10.92 (SD = 2.69) at pre-intervention to 15.13 (SD = 3.20) at post-intervention, t (38) = -7.02, <.001. A large effect size was observed (d = -1.12).
Total scores on the Acting with Awareness subscale increased from 12.38 (SD = 3.42) at pre-intervention to 14.26 (SD = 3.72) at post-intervention, t (38) = -3.20, p = .003. A medium effect size was observed (d = -0.51).
Total scores on the Nonjudging subscale increased from 11.72 (SD = 3.25) at pre-intervention to 16.15 (SD = 4.91) at post-intervention, t (38) =5.13, p <.001. A large effect size was observed (d = -0.82).
Figure 5.4 Pre- and post-group mean scores of Total FFMQ-SF And Total Subscale Scores.
Non-Reactivity FFMQ Scores
Results for the WCCL sub-scales indicated that participants reported a significant increase in the use of their DBT Skills. Mean scores on the Skills Use Subscale increased from 1.64 (SD = 0.31) at pre-intervention to 1.97 (SD = 0.42) at post-intervention, t (38) = -5.340, p < .001, with a large effect size (d = -0.86).
Mean scores on the General Dysfunctional Coping Subscale significantly decreased from 2.21 (SD = 0.34) at pre-intervention to 1.56 (SD = 0.62) at post-intervention, t (38) = 6.39, p < .001, with a large effect size (d = 199
1.02). This indicates that participants’ abilities to cope improved upon completing the intervention.
Participants mean scores on the Blaming Others Subscale also showed a significant reduction from 1.68 (SD = 0.74) to 1.29 (SD= 0.69) postintervention, t (38) = 3.00, p = .005, with a small to medium effect size (d = .48) (see Figure 5.5).
Figure 5.5 Pre- and post-group mean scores of Ways of Coping checklist subscales.
WCCL DBT Skills Scores
Total WCCL Dysfunctional Coping Scores
Total WCCL Blaming Others Scores
14.15.6
In October 2025 a new DBT pilot ‘Graduate group’ was introduced. The DBT graduate programme offers service users who have already completed either the comprehensive stream of the programme or a standalone skills group an opportunity to consolidate and further
generalise their DBT skills. The Graduate programme aims to empower service users by facilitating them to play a lead role in their recovery and to work towards their next steps in confidence and in connection with others. Thus, increasing the likelihood service users arrive to their stage 2 intervention best positioned to engage with and avail of the intervention. As only one cycle of the programme took place there was limited qualitative and quantitative outcome data available for pre/post intervention analysis. Based on the positivity of feedback from service users, the DBT graduate group will continue in 2026. Data for the pilot programme will be incorporated with data from 2026 streams and analysed and reported in the 2026 outcomes report.
For participants with pre- and post-data, significant improvements were observed in the acquisition of DBT coping skills, and the reduction of maladaptive coping strategies. Our service users reported improvement elements of mindfulness and a reduction in difficulty regulating emotion in both the comprehensive and skills only groups with variations across both streams of the programme. Effect size calculations demonstrated small to large effect sizes for significant results. As the DBT programme is a DBT informed stage 1 intervention focussing on initial stabilisation of maladaptive attempts to cope with dysregulated emotion these outcomes are reflective of the programme meeting its clinical goals.
Compassion Focused Therapy for Psychosis (CFT-P) is a group-based psychology programme for adults who have experienced or live with psychosis. It aims to help individuals to learn how to cope with emotional and psychological difficulties associated with living with psychosis. In 2025, the CFT-P programme continued to offer a group informed predominantly by Compassion Focused Therapy (CFT; Gilbert, 2014), which includes eleven weekly group sessions as well as a screening pre-
group, a mid-way individual review session and an end of therapy session. Areas of focus in the group include: i) developing a psychological understanding of psychosis; ii) having a safe space to connect with others about challenges associated with having experienced psychosis; iii) exploring what it means to be self-compassionate and working on ways to develop more self-compassion, iv) learning new skills to cope with difficult emotions and to feel more calm/soothed and v) a new addition to the group – to formulate their experiences of psychosis in the context of their lives. It is hoped that through addressing these areas, service users will experience a reduction in self-judgment, shame and distress relating to their experiences.
4.16.1 Descriptors
14 individuals completed the CFT-P programme in 2025, across three cycles. Pre and post self-report data was available for 12 out of those 14 (85.7% rate of return). Programme attendees ranged in age from 20 to 69 years, with a mean age of 41.3 (SD = 13.18). Of the twelve participants that completed the pre and post measures, eight participants were male, and four participants were female.
Missing Value Analysis (MVA) was carried out to account for any missing data. As the data was determined as Missing Completely at Random by Little’s Test (Cheng & Evanston, 2013) the Expectation Maximisation method was applied to the dataset before any total scores were computed or statistical analyses carried out. Due to the small sample size, statistical significance could not be determined for changes in scores pre-to-post intervention. Instead, participants individual pre and post measure scores are reported below. The small sample size is due to the fact that this programme is a specialist intervention delivered to a small group of service users, to meet their specific therapeutic needs.
4.16.2. Compassion Focused Therapy for Psychosis Programme Outcome Measures
The following section presents a summary of the routine clinical outcome measures used by the CFT-P programme in 2025. All service users attending the CFT-P programme are invited to complete the measures listed below at assessment for the programme and again upon completion.
Due to the small sample size, statistical significance could not be determined for changes in scores pre-to-post intervention. Instead, participants individual pre and post measure scores are reported below.
Compassionate Motivation and Action Scale (CMAS) (Steindl, Tellegen, Filus, Seppala, Doty & Kirby, 2020)
The CMAS offers a brief and user-friendly measure of compassionate and self-compassionate motivation and action. It encompasses two subscales, a Compassion Scale (12 items) and a Self-Compassion Scale (18 items). Within each scale, there are three subscales: compassionate intention, distress tolerance, and compassionate action. CMAS demonstrates a good internal consistency with an overall Cronbach’s alpha of 0.94 and subscale consistencies of 0.92 (Intention), 0.95 (Distress tolerance), and 0.94 (Action; Steindl et al., 2021). Items are rated on a seven-point scale (1 = strongly disagree, to 7 = strongly agree), with higher scores indicate higher levels of self-compassion.
The Southampton Mindfulness Questionnaire (SMQ)
The Southampton Mindfulness Questionnaire (SMQ; (Chadwick, Hember, Mead, Lilley, & Dagnan, 2007) assesses awareness of distressing thoughts and images defined as a concept consisting of four related constructs: awareness of cognitions as mental events in wider context; allowing attention to remain with difficult conditions; accepting such difficult thoughts and oneself without judging; and letting difficult cognitions pass without reactions such as rumination. The measure consists of 16 items and is measured on a seven-point Likert scale, from zero – ‘strongly
disagree’, to six – ‘strongly agree’. Total scale scores range from zero to 96.
The SMQ was included in a study by Baer et al. (2006) exploring the psychometric properties of five mindfulness questionnaires. The SMQ was internally reliable (a=.85) and significantly positively correlated with mindfulness measures, as well as with measures of emotional experience, self-compassion, psychological symptoms and dissociation.
The Brief Symptom Inventory (BSI; Derogatis, L. R., & Savitz, K. L. (1999)
The BSI (BSI; Derogatis, 1983) is a 53-item scale that measures symptoms of psychological distress within the previous week. Psychometric evaluations have shown that the BSI is a reliable and valid measure (Derogatis & Melisartos, 1983: Derogatis & Fitzpatrick, 2004). It has good test-retest reliability and internal consistency, and it shows high convergence with comparable scales on the SCL-90-R and MMPI. Service users rate each symptom on a scale of zero – ‘not at all’, to four ‘extremely’. The Global Severity Index score, which is used in this report, is the best indicator of current distress levels.
The Personal Beliefs about Experience Questionnaire (PBEQ) (Taylor, Pyle, Schwannauer, Hutton, & Morrison, 2015)
The PBEQ is a 13-item self-report measure of appraisals of psychotic-like experiences, in the domains of negative appraisal of experience, external shame, and internal shame/defectiveness. Items are rated on a four-point scale (1 = strongly disagree, to 4 = strongly agree). Although the measure has three scales, they have variable internal consistency so for the purpose of this report we use only the total score, range 13-52 (higher scores representing fewer negative appraisals of psychotic-like experiences).
4.16.3 Results
As mentioned above, due to the small sample size, statistical significance could not be determined for changes in scores pre-to-post intervention. Instead, group means and participants’ individual pre and post measure scores are reported below.
Compassionate Motivation and Action Scales (CMAS) – Self Compassion Scale
Mean scores on the CMAS Self Compassion Scale increased from 92.38 (SD = 21.08) pre intervention to 106.17 (SD = 12.78) following engagement in the programme. As seen in Figure 5.8, twelve of fourteen participants (85.71%) reported an increase in overall self-compassion from pre to post intervention.
Due to the small sample size, changes in total CMAS self-compassion scores were analysed using the Reliable Change Index (RCI) for each participant. In order to ensure that changes in CMAS scores were not attributable to chance or measurement error, an RCI was calculated for each participant using the Jacobson-Truax (1991) method. In accordance with this method, statistically reliable change was reflected by RCI values larger than or equal to 1.96. Participants were classified as “reliable improvement” (passed RCI criterion but the score did not increase above CMAS cut-off score), uncertain change (did not pass RCI criterion) or deterioration (passed RCI criterion but symptom score decreased). As outlined in Table. 5.6, seven participants (58%) reported Reliable Improvement while five participants reported uncertain change (42%).
Table 5.6 Results from Reliable Change Index (RCI) for the CMAS pre and post scores for each group member
CMAS = Compassionate Motivation and Action Scales
The three subscales within the Self Compassion Scale were also analysed. The compassionate intention subscale mean score remained relatively unchanged increasing slightly from 31.17 (SD = 3.16) to 32 (SD = 2.89) from pre- to post-intervention. Analysis of individual scores showed that this increased for four out of twelve participants (33.3%), three of twelve participants’ scores remained unchanged (25%) while the scores of five participants decreased post-intervention (42%). The distress tolerance subscale mean score slightly increased from 35.08 (SD = 10.71) to 38.75 (SD = 6.69) with individual scores increasing on this subscale for eight of twelve participants (66.7%). Similarly, the compassionate action subscale mean score increased from 26.13 (SD = 9.52) to 35.42 (SD = 5.23), with seven of twelve participants (58.3%) reporting increased scores on this subscale post-intervention.
Figure 5.7 Pre and Post Group Mean Scores of Compassionate Motivation and Action Scales (CMAS) total and subscales scores
Figure 5.8 Pre and Post Group Individual Scores of Compassionate Motivation and Action Scales (CMAS) total and subscales scores
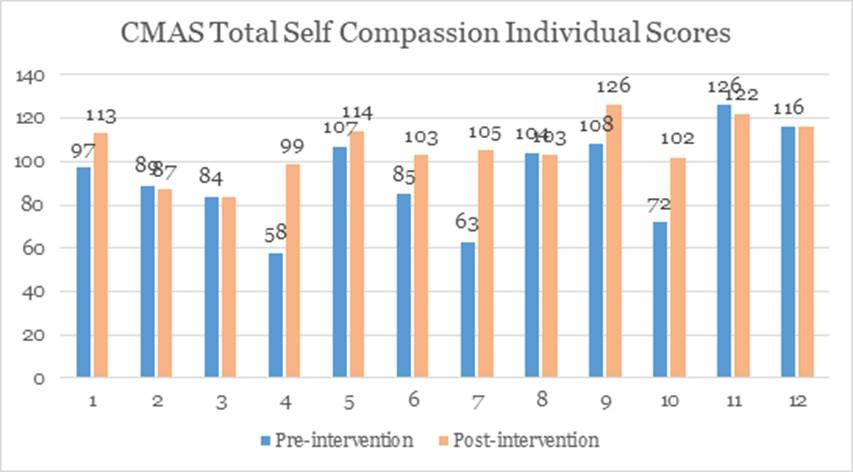
Analysis of the SMQ mean scores suggests that individuals’ tendency to mindfully respond to distressing thoughts and images increased. Higher scores on this measure indicate greater mindful awareness. Service users demonstrated a mean score of 65.83 (SD = 16.94) at pre-intervention and a mean score of 74.58 (SD = 15.60) following the intervention. As shown in Figure 5.9, mindfulness scores increased for eleven out of twelve participants (91.7%) post-intervention.
Figure 5.9 Pre and Post Group total and individual mean scores of Southampton Mindfulness Questionnaire (SMQ)
SMQ Individual Scores
The Brief Symptom Inventory (BSI)
Global distress levels as measured by the BSI Global Index score demonstrated a decrease following the intervention. The mean score of 1.82 (SD = .61) pre-intervention decreased to 1.63 (SD = .60) postintervention. Scores on this measure decreased for 10 out of twelve participants (83.3%) post-intervention.
Figure 5.10 Pre and Post Group total and individual mean scores of Brief Symptom Inventory (BSI)
Mean scores on the PBEQ increased slightly following engagement with the programme. The mean score beforehand was 34.23 (SD = 5.86), this increased to 36.18 (SD = 6.71) at post-intervention. Scores on this measure increased for eight of twelve participants (66.7%) postintervention.
Figure 5.11 Pre and Post Group total and individual mean scores of Personal Beliefs about Experiences Questionnaire (PBEQ)
Individual Total Scores
4.16.4 Summary
Compassion Focused Therapy for Psychosis (CFT-P) is a group-based psychology programme for adults who have experienced or live with psychosis. It aims to help individuals learn how to cope with emotional and psychological difficulties associated with living with psychosis. The CFT-P Programme continues to offer an opportunity for service users to develop skills to cope with emotional and psychological challenges relating to recovering from and living with psychosis.
The results from this evaluation suggest positive trends across key psychological domains following engagement in the programme. There was observed increase in self-compassion with more than half of the participants demonstrating clinically meaningful or reliable improvement. Moreover, participants’ scores point toward an enhanced capacity to respond more mindfully to distressing thoughts and images. This is in line with the aim of the CFT-P to cultivate compassionate awareness and flexibility in responding to mental health difficulties. Similarly, there was a downward trend in global psychological distress scores, which could reflect reduced symptom burden for some participants.
Taken together these results suggest that the CFT-P programme may support improvements in self-compassion, mindful responding and overall distress.
It is also important to consider the impact of the small sample size when measuring significant change. The CFT-P team will continue to develop the programme offering during 2026 in order to address the psychological needs of service users with psychosis.
4.17 Focused Acceptance and Commitment Therapy Programme (FACT)
FACT is an 8-week online group therapy which uses acceptance and mindfulness strategies to help service users transform their relationship with unwanted experiences, such as unwanted thoughts, emotions, memories, or bodily sensations. While FACT does not aim to change these unwanted experiences, it helps individuals to accept these experiences and focus on actions that are guided by chosen values. FACT balances acceptance and mindfulness-based skills with commitment strategies aimed at helping individuals move towards what matters most, while practicing acceptance of what is outside of their control.
Pre and post data were collected for eleven participants who completed the FACT programme in 2025. Eight of the participants were female (72.7%) and three were male (27.3%). Participant’s ages ranged from 33 years to 73 years (M = 51.45, SD = 11.725).
4.17.2. FACT Programme outcome measures
Acceptance and Action Questionaire II
The Acceptance and Action Questionnaire (AAQ II) (Bond et al, 2011) is a seven-item measure of experiential avoidance or the tendency to avoid unwanted internal experiences – the opposite of which is psychological flexibility. The AAQ-II was developed to establish an internally consistent measure of ACT’s model of mental health and behavioural effectiveness. Service users are asked to rate statements on a seven-point Likert scale from one - ‘never true’, to seven - ‘always true’. Scores range from one to 70 with higher scores indicating reduced psychological flexibility/increased experiential avoidance. The AAQ-II has good validity, reliability (Cronbach’s alpha is .84 (.78 - .88)), and three and 12-month test-retest reliability (.81 and .79, respectively) (Bond et al, 2011).
Depression Anxiety and Stress Scale (DASS-42)
The 42-item Depression, Anxiety and Stress Scale (DASS-42) is a set of three self-report scales designed to measure depression, anxiety, and stress (Lovibond & Lovibond, 1995). Higher scores are indicative of higher
levels of depression, anxiety, and/or experienced stress. The DASS-42 has been shown to have good validity and reliability (Cronbach’s alpha = .84 - .91).
The Five Facet Mindfulness Questionnaire (FFMQ) (Baer, Smith, Hopkins, Krietmeyer & Toney, 2006) assesses the tendency to be mindful in daily life, including five facets of mindfulness; observing, describing, acting with awareness, non-reactivity to inner experience and non-judging of inner experience. The measure consists of 39 items which are responded to on a five-point rating scale ranging from one – ‘never or very rarely true’, to five ‘very often or always true’. Scores range from 39 to 195, with higher scores suggesting higher levels of mindfulness. In a study of non-clinical samples participants who regularly practise mindfulness had a mean of 154.2 (SD = 17.5) while those who did not practise mindfulness had a mean of 138.9 (SD = 19.2) (Lykins & Baer, 2009). The measure demonstrates good reliability (alpha co-efficient ranging from .72 to .92 for each facet) (Baer et al, 2006). Evidence for construct validity comes from analysis of data from samples with mindfulness meditation and no mindfulness meditation experience (Baer et al, 2006).
4.17.3
Results were examined and compared in greater detail including overall mean, individual and cycle scores. Due to the small sample size, statistical analysis of the outcome measures was not possible. Acceptable power was not achieved to reliably conduct statistical operations on the data. G*Power analysis indicated that in order to achieve sufficient statistical power, a sample size of 27 participants would have been required to detect a medium effect size (Cohen’s d=0.5). Therefore, for each measure, individual results for the 11 participants who returned both pre and post measures are given to reflect the outcome of the intervention.
Acceptance and Action Questionaire II (AAQ-II)
There was a decrease in total scores from pre-intervention (M = 27.09, SD = 7.57) to post-intervention (M = 25.45, SD= 11.15). This finding indicates that those who completed the FACT programme in 2024 had more psychological flexibility post-intervention (see Figure 5.12).
Figure 5.12 Pre and post mean scores of the Acceptance and Action Questionnaire - II (AAQ-II).
Further examination of the individual scores indicates that seven out of eleven participants (63.64%) demonstrated a reduction in AAQ-2 scores from pre-intervention to post-intervention (see Figure 5.13).
Figure 5.13 Pre and post individual scores of the Acceptance and Action Questionnaire – II (AAQ-II).
There was a decrease in total scores on the depression subscale from preintervention (M = 12.09, SD = 9.97) to post-intervention (M = 11.82, SD= 11.29) (see Figure 5.14). There was a slight increase in total scores on the anxiety subscale from pre-intervention (M = 8.73, SD = 5.73) to postintervention (M = 10.09, SD= 9.49) (see Figure 5.15). There was a decrease in total scores on the stress subscale from pre-intervention (M = 16.73, SD = 9.10) to post-intervention (M = 15.09, SD= 8.61) (see Figure 5.16).
Figure 5.14 Pre and post mean scores of Depression Anxiety and Stress Scale (DASS-42) depression subscale.
Figure 5.15 Pre and post mean scores of Depression Anxiety and Stress Scale (DASS-42) anxiety subscale.
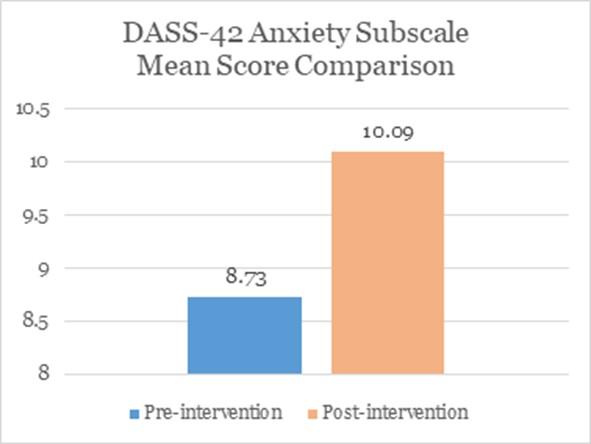
Figure 5.16 Pre and post mean scores of Depression Anxiety and Stress Scale (DASS-42) stress subscale.
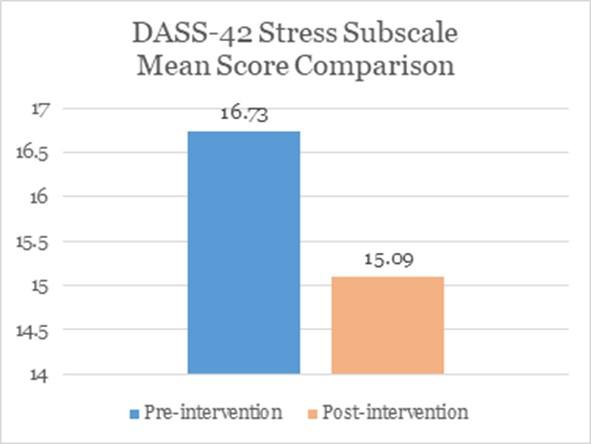
Further examination of individual Scores on the DASS-42 are as follows.
Five out of eleven participants (45.45%) reported reduced depression scores at the end of the intervention, five out of eleven participants (45.5%) reported reduced anxiety scores post-intervention, and eight out of eleven participants (72.73%) reported reduced stress scores postintervention.
See Figures 5.17 to 5.19 below for visual representation of changes in individual scores from pre- to post-intervention.
Figure 5.17 Pre and post individual scores of Depression Anxiety and Stress Scale (DASS-42) – depression subscale.
DASS-42 Depression Subscale Individual Scores
Pre-intervention Post-intervention
Figure 5.18 Pre and post individual scores of Depression Anxiety and Stress Scale (DASS-42) – anxiety subscale.
Anxiety Subscale
Figure 5.19 Pre and post individual scores of Depression Anxiety and Stress Scale (DASS-42) – stress subscale.
Total mean scores of 112.45 (SD = 20.42) at pre-intervention increased to 118.09 (SD = 25.96) at post-intervention, suggesting that participants had greater mindful qualities upon completion of the programme. Mindfulness is defined in this context as observing, describing, acting with awareness, non-reactivity to inner experience and non-judging of inner experience.
Total scores on the act with awareness subscale increased from 21.45 (SD = 6.20) at pre-intervention to 22.82 (SD = 5.84) at post-intervention.
Total scores on the describing subscale decreased from 26.64 (SD = 5.87) at pre-intervention to 25.82 (SD = 7.44) at post-intervention. Total scores on the observing subscale increased from 22.00 (SD = 6.40) at preintervention to 26.73 (SD = 7.60) at post-intervention. Total scores on the nonjudging subscale decreased from 25.27 (SD = 8.20) at preintervention to 23.73 (SD = 8.52) at post-intervention. Total scores on the nonreactivity subscale increased from 17.09 (SD = 5.15) at preintervention to 19.00 (SD = 4.60) at post-intervention (see Figure 5.20).
and
Scores
Further examination of individual Scores on the FFMQ are as follows. Five out of eleven (45.45%) participants showed an overall increase in total FFMQ scores. Six out of eleven (54.55%) participants showed an increase in total Acting with Awareness scores. Four out of eleven (36.36%) participants showed an increase in Describing scores. Nine out of eleven (81.82%) participants showed an increase in Observing scores. Four out of eleven (36.36%) participants showed an increase in Nonjudging scores. Seven out of eleven (63.64%) showed an increase in Nonreactivity scores. See Figures 5.21 to 5.22 for visual representation of changes in individual scores from pre- to post-intervention.
Figure 5.21 Pre and post individual scores of Five Facet Mindfulness
Questionnaire (FFMQ)
Individual Scores
Figure 5.22 Pre and post individual scores of Five Facet Mindfulness
Questionnaire (FFMQ) – Act with Awareness Subscale
Figure 5.23 Pre and post individual scores of the FFMQ – Describing Subscale
Figure 5.24 Pre and post individual scores of the FFMQ – Observing Subscale
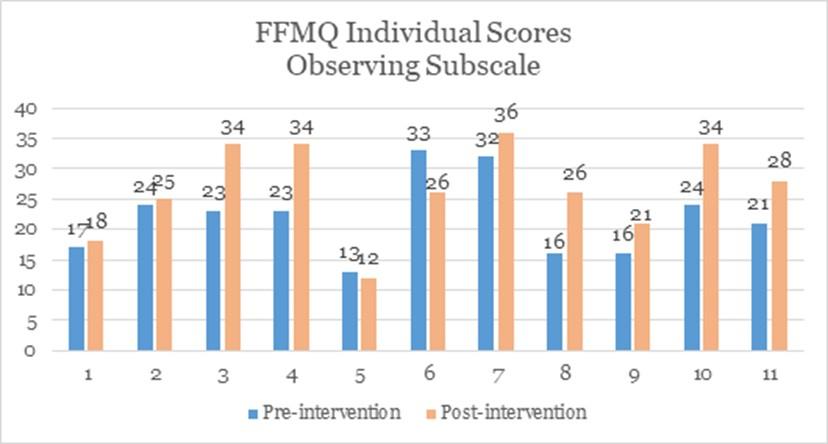
Figure 5.25 Pre and post individual scores of the FFMQ – Nonjudging Subscale
FFMQ Individual Scores Nonjudging Subscale
Figure 5.26 Pre and post individual scores of the FFMQ – Nonreactivity
Subscale
4.17.4 Summary
In 2025, service users who completed the FACT programme showed significant gains in mindfulness, psychological flexibility/acceptance, and reduction in symptoms of depression, and stress, as measured by the available psychometrics. Although mean anxiety scores increased slightly post-intervention, the substantial increase in score variability at postintervention (SD = 9.49 compared to SD = 5.73 at baseline) suggests that the rise in the mean may have been influenced by a small number of participants with notably higher anxiety scores, rather than a uniform increase across the sample. This suggests that the change may be driven by outliers or differential responses to therapy, potentially reflecting transient anxiety increases associated with therapeutic engagement rather than a general worsening of symptoms.
A recording and analysis of the five distinct subscales of the FFMQ has provided clinically useful data about how participants are learning and utilising different aspects of mindfulness. Changes across mindfulness subscales were mixed, with increases in acting with awareness, observing, and nonreactivity, and slight decreases in describing and nonjudging. This pattern may reflect differential rates of skill development across mindfulness facets, as well as increased self-awareness leading to more critical self-appraisal at post-intervention. Increased variability in some
subscales may suggest individual differences in response to the intervention rather than uniform change. However, these interpretations should be considered preliminary and approached with caution, as the results are based on a small sample of 11 participants, limiting generalizability and increasing susceptibility to individual variability.
The Psychology Skills Group for Adolescents is an online psychological group therapy that aims to support young people (and their parents) to understand themselves and their difficulties and learn new ways to manage them. The group teaches a range of skills from Dialectical Behaviour Therapy for Adolescents (DBT-A), Radically Open Dialectical Behaviour Therapy (RO-DBT), and Group Radical Openness (GRO) in a multi-family context. The group invites parents or caregivers to attend and participate alongside their young person to help support them in learning and practicing new coping skills. The group runs on a rolling basis for one afternoon per week for 22 weeks. The group is comprised of four modules: Orientation/Mindfulness, Managing Emotions, Distress Tolerance, Relationships, and Walk the Middle Path. Modules vary in length between two and five sessions.
4.18.1 Descriptors
In 2025, 16 families participated in PSG-A. Of these 16, six families withdrew from the programme, and one family did not complete the preprogramme measures and were thus excluded from further analysis. Only their demographic data will be included in the report for descriptive analyses. Therefore, the pre- and post-measurements of 9 families were explored. The mean age of young people attending was approximately 16 years old (M=15.63, SD =1.46). Six of the nine young people were female, with two male and one non-binary participants. One of the parents were male and eight of the parents were female.
4.18.2 Psychology Skills
The following section presents a summary of clinical outcome measures used by the PSGA programme in 2025. All service users and their parents attending the PSGA programme are invited to complete the measures listed below at assessment for the programme and again upon completion. In November 2025, small changes were made to the PSG-A outcome measures. These included removing the items of the Impact subscale of the Strengths and Difficulties Questionnaire (SDQ) and Strengths and Difficulties Questionnaire – Parents (SDQ-P). Measures were changed in order to reduce the burden on service users while also aiming to more accurately capture the goals of the programme. Due to the small sample size statistical significance could not be determined for changes in scores on a number of measures below. For these measures, participants’ individual pre- and post-measure scores are reported instead. The small sample size is due to the fact that this programme is a specialist intervention delivered to a small group of service users, to meet their specific therapeutic needs.
The Difficulties in Emotion Regulation Scale (DERS; Gratz and Roemer, 2004) assesses emotion dysregulation. It comprises six domains: nonacceptance of emotions; inability to engage in goal-directed behaviours when distressed; impulse control; emotional awareness; emotion regulation strategies; and emotional clarity. The measure consists of 36 items scored on a five-point Likert scale from one – ‘almost never’, to five – ‘almost always’. Total scale scores range from 36 to 180, with higher scores indicating greater difficulties regulating emotion. Gratz and Roemer (2004) reported good internal reliability (α = .93), construct and predictive validity, and test-retest reliability in an article which described the development of this scale.
The DBT Ways of Coping Checklist (DBT-WCCL; Neacsiu, Rizvi, Vitaliano, Lynch, & Linehan, 2010) was completed by young people and parents at
pre- and post- intervention. The DBT-WCCL assesses use of DBT skills and comprises of two subscales: the DBT Skills Subscale (DSS) and the Dysfunctional Coping Subscale (DCS). The measure consists of 59 items scored on a four-point Likert scale (0 = never used; 3 = regularly used). Higher mean scores on the DSS indicate greater use of DBT skills while higher mean scores on the DCS indicate greater use of unhelpful coping behaviours. This measure has shown good to excellent internal consistency, test-retest reliability, and content validity (Neacsiu et al., 2010).
The Youth Over- and Under-control (YOU-C; Lenz et al., 2021), previously referred to as the OUT-MA was completed by young people at pre- and post-intervention. The YOU-C assesses traits of over and under control in adolescents and is comprised of two subscales: Over control (OC) and Under control (UC). In the YOU-C, traits of over and under control are presented and participants are asked to rate how characteristic each trait is of them. The measure consists of 25 items scored on a seven-point Likert scale (0 = not at all; 6 = extremely). Higher mean scores on the OC and UC subscales are indicative of higher levels over and under controlled traits, respectively.
Strengths and Difficulties Questionnaire (SDQ) and Strengths and Difficulties Questionnaire – Parents (SDQ-P).
The Strengths and Difficulties Questionnaire (SDQ) was completed by the young people, while parents completed the Strengths and Difficulties Questionnaire – Parents (SDQ-P). This questionnaire is used to assess children’s mental health and can be completed by children and young people themselves, by their parents or by their teachers. It can be used for various purposes, including clinical assessment, evaluation of outcomes, research and screening. It measures 5 dimensions: emotional problems, conduct problems, hyperactivity/inattention problems, peer problems, and prosocial behaviour. Items are measured on a 3-point Likert scale (0 = Not True; 1 = Somewhat True; 2 = Certainly True). This widely
used measure has demonstrated good reliability and validity (Giannakopoulos et al., 2013; Mieloo et al., 2012).
The BYI-D (Beck et al., 2001) scale was completed by young people before and after taking part in group. The BYI-D consists of 20 items scored on a four-point Likert scale (0= never; 3 = always) and includes items from five domains: negative views of the self, negative views of the world in general, hopelessness (referred to as “motivational”), and physiological and emotional indicators of depression. One summated score is obtained from the items on the scale. Total scale scores range from 0 to 60 with higher total scores indicating higher levels of depression. This measure has shown good internal consistency and test-retest reliability (Beck et al., 2001) as well as high validity (Steer, Kumar & Beck, 2001).
The SCORE-15 is a self-report measure of family functioning and provides rich information about group member’s experiences and perspectives on their familial relationships. It consists of 19 items, which are scored on a 5-point Likert scale (1 = Describes us: Very well; 5 = Describes us: Not at all). The SCORE-15 has been shown to have strong consistency and reliability and can be used to monitor proven indicators of progress in group therapy (Stratton et al., 2013).
The GBO tool is a way of evaluating progress towards goals in clinical work with children, young people, and their families and carers. The GBO compares how far a child or young person feels they have moved towards reaching a goal that they have set for themselves at the beginning of an intervention, on a 10-point Likert scale (1 = Goal not at all met; 10 = Goal reached). Research on the reliability and validity of this measure is ongoing, but some studies have demonstrated good internal consistency (Duncan et al., 2023).
4.18.3 Results
As mentioned above, participants’ individual pre and post measure scores are reported as statistical significance could not be determined for changes in scores due to the small sample size.
The DBTWCCL was completed by parents and young people. Mean scores indicated that DBT skill use (DSS) increased from pre-intervention to post intervention. At pre-intervention, parents and young people had a mean DSS score of 1.75 (SD=.48). Post-intervention, parents and young people achieved a mean DSS score of 2.09 (SD=.46). Pre-group scores fell within the “Typical Clinical” range, post-group scores fell within the “Low Clinical” range.
Mean scores on the Dysfunctional Coping Skills subscale (DCS) decreased from pre to post intervention. At pre-intervention, parents and young people had a mean score of 1.75 (SD=.39) on the DCS, pre-group scores fell within the “Typical Clinical” range, post-group scores fell within the “Low Clinical” range. At post-intervention, this was 1.31 (SD=.47). Due to the small sample size, the statistical significance of these changes could not be determined. Taken together, these results indicate that use of DBT skills increased, while use of unhelpful coping mechanisms decreased.
Figure 5.27 Pre and Post Group mean score of DBT Ways of Coping Checklist (DBTWCCL) subscales.
The DERS and DERS-P were completed by young people and their parents. Pre- and post-intervention data were available for nine of the young people. Analysis showed total difficulties in regulating emotions decreased from pre-intervention (M=126.67, SD = 14.24) – Very High Average to post-intervention (M=92.22, SD = 17.15) - Average. Due to the small sample size, changes in total DERS scores were analysed using the Reliable Change Index (RCI) for each participant. In order to ensure that changes in DERS scores were not attributable to chance or measurement error a RCI was calculated for each participant using the Jacobson-Truax (1991) method. In accordance with this method, statistically reliable change was reflected by RCI values larger than 1.96. The cut-off score indicating clinically meaningful improvement on the DERS was 95 (Erez & Gordon, 2025). Participants were classified as “clinically meaningful improvement” (passed RCI criterion and DERS score decreased to below cut-off score), “reliable improvement” (passed RCI criterion but the score did not decrease below DERS cut-off score), uncertain change (did not pass RCI criterion) or deterioration (passed RCI criterion but symptom score increased). As outlined in the table below, five participants (55.6%) reported clinically significant improvement, while three participants (33.3%) reported reliable improvement, and one participant reported uncertain change (11.1%). No participants demonstrated deterioration.
Table 5.28 Results from Reliable Change Index (RCI) for the DERS pre and post scores for each group member
DERS = Difficulties with Emotion Regulation Scale
Pre and post DERS-P responses were available for nine of the parents. Analysis showed that parent’s ratings of their child’s difficulties with emotional regulation decreased from an average of 117.11 (SD = 24.98) –High Average to 78.89 (SD=21.57) – Average.
As shown in the Figure 5.29, all nine young people and parents (100%) reported a decrease in overall difficulties regulating emotions postintervention.
Figure 5.29 Pre and Post Group total mean score of Difficulties in Emotional Regulation (DERS) and Difficulties in Emotional RegulationParents (DERS-P).
Difficulties with Emotional Regulation
Difficulties with Emotional Regulation (Parent Report)
Figure 5.30 Pre and Post Individual total scores of Difficulties in Emotional Regulation (DERS) and Difficulties in Emotional Regulation- Parents (DERS-P).
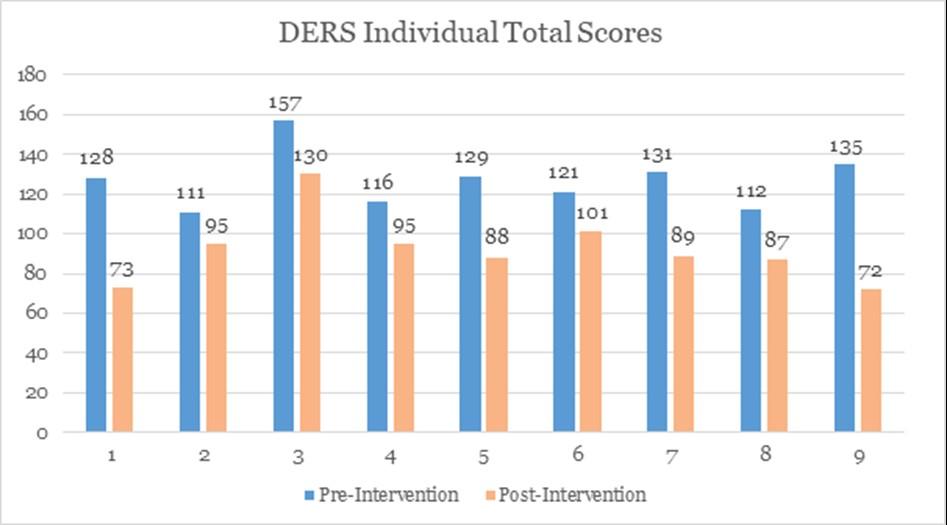
Pre-Intervention Post-Intervention
The Youth Over- and Under-control (YOU-C) is comprised of two subscales, one measuring under-control traits and one measuring overcontrol traits. Pre-intervention, the mean under control subscale score was 2.17 (SD = .98). Post intervention, this decreased to a mean of 1.87 (SD = 1.24). Pre-intervention, the mean over-control score was 2.86 (SD = 1.14). Post-intervention, this increased slightly to a mean of 3.02 (SD = .95). Numerically, these findings suggest under-control decreased following engagement in the intervention, while over-control increased.
As illustrated in Figure 5.32 and Figure 5.33, five out of nine young people (55.6%) reported a decrease in under-control traits post-intervention, and five out of nine (55.6%) young people reported an increase in over-control traits post-intervention.
Figure 5.31 Pre and Post total mean scores of Youth Over- and Undercontrol (YOU-C).
Pre-Intervention Post-Intervention
Figure 5.32 Pre and Post Individual total scores of Youth Over- and Undercontrol (YOU-C).
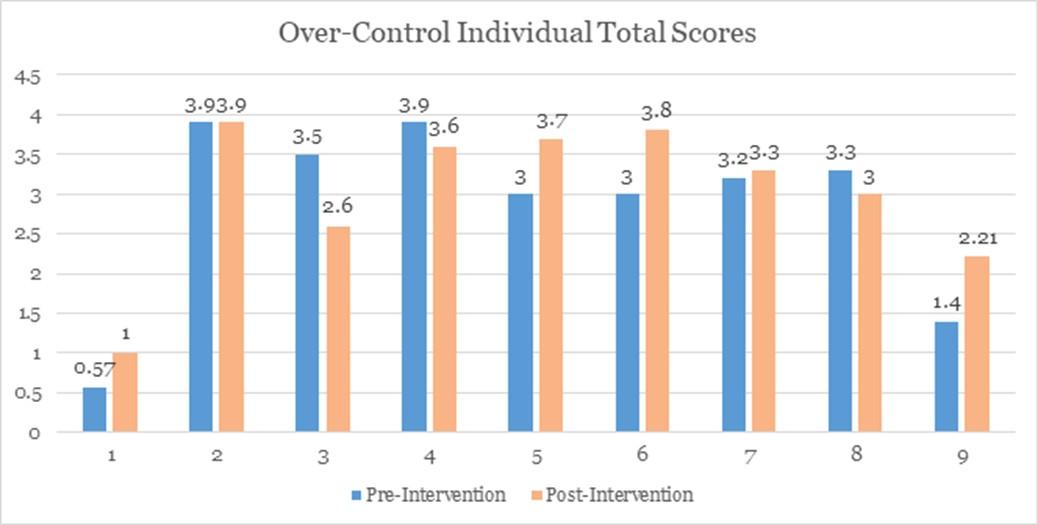
Figure 5.33 Pre and Post Individual total scores Youth Over- and Undercontrol (YOU-C).
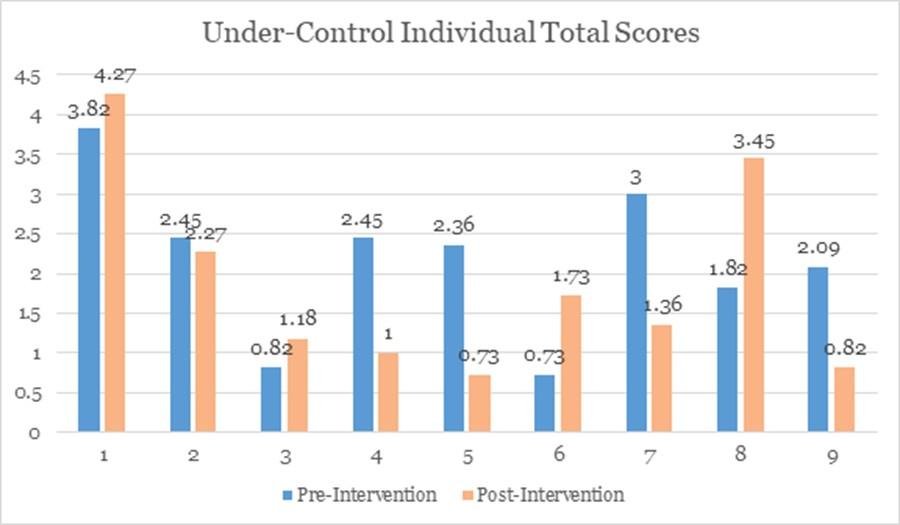
Pre-intervention, the mean BYI-D t-score was 68.4 (SD = 7.3). Postintervention, this decreased to a mean of 53.6 (SD = 10.31). Pre scores are considered to fall within the “Moderately Elevated” range. Post scores fell within the “Average” range. As shown in Figure 5.35, seven out of nine young people (66.7%) reported a decrease in depressive symptoms while two out of nine young people (22.2%) reported an increase in depressive symptoms.
Figure 5.34 Pre and Post total mean scores of Beck Youth Inventory –Depression (BYI-D) Scale
Figure 5.35 Pre and Post Individual total scores Beck Youth InventoryDepression (BYI-D) scale.
Pre-Intervention Post-Intervention
Strengths and Difficulties Questionnaire (SDQ) and Strengths and Difficulties Questionnaire – Parents (SDQ-P).
Pre-intervention, the mean total difficulties score was 22.33 (SD= 5.43) –just above the “Very High” range. This fell to 19.11 (SD = 2.93) – “High” post intervention. Pro-social behaviour was found to increase slightly from a mean of 8.33 (SD = 1.5) to 8.78 (SD = 1.20). Both scores fell within the “Close to Average” range. As shown in Figure 5.37, six out of nine young people (66.7%) reported a decrease in total difficulties post-intervention. This improvement in total difficulties was also reflected in parental reports. Pre-intervention, parents reported a mean of 21.78 (SD= 6.18) –“Very High” range. This fell to 15.56 (SD = 4.85) – “Slightly raised” range post intervention. Pro-social behaviour was found to increase slightly from a mean of 7.11 (SD = 3.01) to 8.00 (SD = 1.73). Both scores were in the “Close to Average” range. Five out of nine parents (55.6%) reported a decrease in total difficulties post-intervention.
Figure 5.36 Pre and Post mean scores of Strengths and Difficulties
Questionnaire (SDQ) total and subscales.
Figure 5.37 Pre and Post individual scores of Strengths and Difficulties
Questionnaire (SDQ).
SDQ Difficulties Individual Total Scores
Figure 5.38 Pre and post mean scores of Strengths and Difficulties
Questionnaire -Parents (SDQ-P) total and subscales.
Figure 5.39 Pre and post individual scores of Strengths and Difficulties
Questionnaire- Parent (SDQ-P).
Pre-Intervention Post-Intervention
Both parents and young people were asked to complete the SCORE-15 before and after taking part in the group, as a measure of family functioning. Levels of family functioning reported by young people and parents improved from before group (M = 2.00, SD = .55) to after group (M = 1.66, SD = .40). Due to the small sample size statistical significance could not be determined for this change. However, scores remained within the “Below Clinical” range.
Figure 5.40 Pre and Post total mean scores of Score 15.
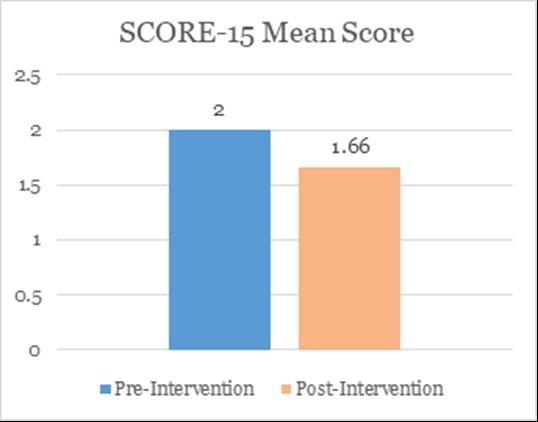
Both parents and young people were asked to complete their Goal Based Outcomes for goals set out at the beginning of groups. Scores on this outcome reflect how close the young person/parent felt to achieving their goal, with higher scores indicating being closer to achieving that goal.
GBO scores increased from a mean of 3.58 out of a possible 10 (SD = 2.08) to 7.3 out of a possible 10 (SD = 2.34), with a score of 10 indicating that the goal had been achieved. This trend indicated parents and young people made progress in achieving their goals post intervention.
Figure 5.41 Pre and Post total mean scores of Goal Based Outcomes.
4.18.4 Summary
The Psychology Skills Group for Adolescents (PSGA) aims to teach young people new skills for regulating emotions, fostering healthy relationships and managing distressing situations. It also seeks to enable parents and caregivers to support their young people in the use of more adaptive coping strategies.
The findings presented provide a meaningful insight into the effectiveness of the programme. The results indicate that by attending the group, most young people developed an increased capacity to regulate their emotions with the majority showing clinically meaningful improvement. Parents’
ratings mirrored this pattern, indicating perceived improvements in emotion regulation. Young people who completed the group also evidenced an increase in the use of DBT skills when coping with difficulty. Levels of under control traits decreased slightly following the programme. There was also a reduction in behavioural/emotional difficulties after the group, reflected in both young people’s self-reports and parent reports, alongside a small increase in prosocial behaviour. Scores on a measure of depression also decreased following the group. Both parents and children reported feeling closer to achieving their goals after the intervention, suggesting personally meaningful progress over the course of programme.
In addition to the 2025 outcome data, an exploratory review of baseline scores on the SDQ and DERS questionnaires, was undertaken for both young people and parents for the period 2022 to 2025. The aim of this exploration was to provide broader service-level context. A trend pointing towards higher levels of emotional and behavioural difficulties prior to group participation was observed. This general pattern suggests a gradual increase in baseline severity among young people’s presentations, with the highest pre-intervention scores observed in the year of 2025. These trends could reflect changes in the clinical profile of referrals; however this is difficult to confirm due to the descriptive nature of this analysis and the small sample size.
Group Radical Openness (GRO) is a transdiagnostic group therapy intervention for service users presenting with mental health difficulties associated with costly and harmful overcontrol. GRO was developed in St Patrick’s Mental Health Services. Overcontrol, sometimes referred to as too much self-control, underlies a range of mental health difficulties. These include certain Axis I mood and eating disorders and Axis II
presentations, such as Obsessive-Compulsive Personality Disorder and Avoidant Personality Disorder.
GRO is a structured group therapy approach. In GRO, the participants work on three core themes of overcontrol: distance in relationships, rigidity, and inhibited emotion. The therapeutic process facilitates developing understanding, awareness, and insight into each individual’s struggle with overcontrol. Safety is core to the treatment and through a series of experiential exercises, the group work out ways to develop more intimate and connected relationships, develop more flexibility in their lives, and experience and express their emotions.
GRO consists of 27 sessions and is delivered over a five-month period. Group sessions occur twice per week for 12 weeks and then once a week for the final three weeks.
4.19.2
A total of 30 people completed GRO in 2025. 60% of the participants were female, 40% were male. Participant’s ages ranged from 23 years to 67 years (M=44.72, SD=10.68). Of the 30 people, six completed the programme online and 24 completed the group in-person. Pre- and postoutcome data were available for 23 people, representing an 76.7% return rate.
Missing Value Analysis (MVA) was carried out to examine the type of missingness within the data. Where data was found to be Missing Completely at Random by Little’s test (Cheng & Evanston, 2013), the Expectation Maximisation method was applied before any total scores were computed or analyses carried out. Moreover, a post-hoc power analysis was performed in G*Power 3.1 for paired-samples t-test.
Assuming a medium effect size (Cohen’s d = 0.5), a two-tailed significance level of alpha = .05, and sample size of 23 paired observations, the achieved statistical power was 0.63. Given the modest sample size, statistical significance cannot be examined. Therefore, analyses focused on descriptive statistics, means of individual and total
scores and assessing clinically meaningful change at an individual level using the Reliable Change Index (RCI).
The GRO programme has five outcome measures that explore change in the key areas targeted by the programme. These are: the Five Factor Obsessive Compulsive Inventory (Short Form) (FFOCI-SF), the Brief Symptom Inventory (BSI), the Revised Adult Attachment Scale – Close Relationships Version (RAAS), the Personal Need for Structure Scale (PNS), and the Emotion Regulation Questionnaire (ERQ).
Five Factor Obsessive Compulsive Inventory (Short Form) (FFOCI-SF)
The FFOCI-SF (Samuel et al., 2012) is a 48-item self-report questionnaire which explores traits of obsessive-compulsive personality disorder (OCDP) that are associated with overcontrol. The FFOCI-SF is based on the conceptual framework of the five-factor model of personality. The questionnaire is made up of 12 sub-scales: excessive worry, detached coldness, risk-aversion, constricted, inflexibility, dogmatism, perfectionism, fastidiousness, punctiliousness, workaholism, doggedness, and ruminative deliberation. Each item is rated on a five-point Likert scale from one (strongly disagree), to five (strongly agree). Higher scores indicate greater identification with OCPD traits.
Research has found that the FFOCI-SF has good psychometric properties with strong internal and external validity, and strong reliability with a Cronbach’s alpha ranging from .77 to .87 (Samuel et al., 2012). Additionally, a strong similarity coefficient has been found between the long and short form of the measure. (Griffin, Suzuki, Lyman et al., 2018). This report focuses on total scores of the FFOCI-SF to determine overall levels of overcontrol.
Brief Symptom Inventory (BSI)
The BSI (BSI; Derogatis, 1983) is a 53-item scale that measures symptoms of psychological distress within the previous week. Psychometric evaluations have shown that the BSI is a reliable and valid measure (Derogatis & Melisartos, 1983: Derogatis & Fitzpatrick, 2004). It has good test-retest reliability and internal consistency, and it shows high convergence with comparable scales on the SCL-90-R and MMPI. Service users rate each symptom on a scale of zero – ‘not at all’, to four ‘extremely’. The Global Severity Index score, which is used in this report, is the best indicator of current distress levels.
Version (RAAS)
The RAAS (Collins, 1996) is an 18-item measure of relationship attachment. It contains three sub-scales: Close, Depend, and Anxiety. Respondents are asked to rate each statement on a five-point scale from one (not characteristic of me at all), to five (very characteristic of me). Higher scores on the Close and Depend subscales indicate greater comfort with closeness and intimacy (depending on others) in everyday life. Lower scores on the Anxiety subscale indicate less fear of rejection. The RAAS is highly correlated with the long form Adult Attachment Scale (AAS) and has been found to have good internal and external validity (Graham & Unterschute, 2015).
Personal Need for Structure Scale (PNS)
The PNS (Neuberg & Newsom, 1993) is an 11-item self-report questionnaire consisting of two sub-scales: Desire for Structure and Response to Lack of Structure. Respondents are asked to rate each statement on a six-point scale from one (strongly disagree), to six (strongly agree). Higher scores indicate greater desire for structure and a dislike for unstructured and unpredictable situations (inflexibility). The measure has shown good reliability in previous research, with a Cronbach’s alpha of 0.62 for Desire for structure and 0.73 for Response to Lack of Structure (Hamtiaux & Houssemand, 2012).
The ERQ (Gross & John, 2003) is a 10-item self-report measure consisting of two subscales: Cognitive Reappraisal and Expressive Suppression. Cognitive Reappraisal describes the process of confronting automatic thoughts and assumptions regarding emotions and reframing them in a more helpful way. Expressive Suppression describes the ability to control or suppress responding to emotional experiences. Participants are asked to rate each statement on a seven-point scale from one (strongly disagree), to seven (strongly agree). The ERQ has been found to have high internal validity, and good convergent and discriminant validity (Preece, Becerra, Robincon et al. 2019).
4.19.4
Five Factor Obsessive Compulsive Inventory (Short Form) (FFOCISF)
Analysis showed total scores of FFOCI-SF decreased from pre-intervention (M= 153.670, SD = 25.89) to post-intervention (M= 141.19, SD = 20.38).
Due to the small sample size, changes in total FFOCI-SF scores were analysed using the Reliable Change Index (RCI) for each participant. In order to ensure that changes in FFOCI-SF scores were not attributable to chance or measurement error a RCI was calculated for each participant using the Jacobson-Truax (1991) method. In accordance with this method, statistically reliable change was reflected by RCI values larger than 1.96. FFOCI-SF does not have an official cut off score established in scientific literature; therefore, it could not be determined whether service users’ post-intervention change in scores is clinically meaningful. Participants were classified as “reliable improvement” (passed RCI criterion), uncertain change (did not pass RCI criterion) or deterioration (passed RCI criterion but symptom score increased). As outlined in Table 5.42, four participants (17.4%) reported clinically significant improvement, while nineteen participants (82.6%) reported uncertain change. No participants demonstrated deterioration.
Table 5.42 Results from Reliable Change Index (RCI) for the Five Factor Obsessive Compulsive Inventory (Short Form) pre and post scores for each group member
Post-group FFOCI-SF individual total scores indicated that 73.91% of participants demonstrated reduction in general levels of overcontrol after completing the intervention while 26% of participants demonstrated slight increase in overcontrol. For these individuals, the increase in FOCI score at the end may point to a greater awareness and acknowledgement of traits like perfectionism, inflexibility, dogmatism, etc. Many individuals initially report lower rigidity at baseline, however as the programme progresses, they develop more awareness regarding rigid behavioural patterns. Therefore, higher endorsement of these items post-intervention may reflect an increased self-awareness rather than deterioration. Group and Individual mean total scores are displayed in Figure 5.43.
Figure 5.43 Pre and post total mean scores of Five Factor Obsessive Compulsive Inventory (Short Form) (FFOCI-SF)
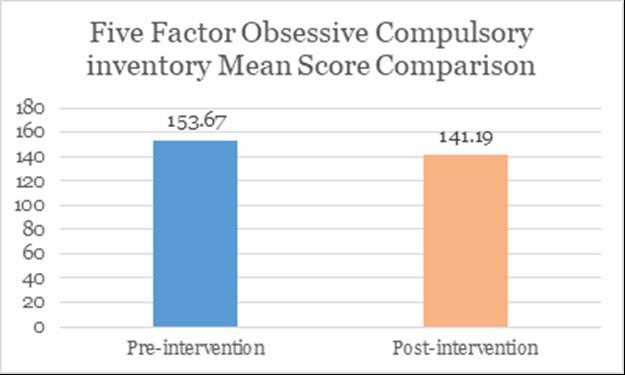
Brief symptom Inventory (BSI)
A slight reduction in service users’ psychological distress was also observed after completing the
programme. This was shown by a reduction in mean scores on the Global Severity Scale of the BSI subscale from (M= 2.14, SD = .58) preintervention to (M= 1.85, SD = .53) post-intervention. The Individual total scores indicated that 73.91% of participants reported decrease in overall levels of psychological distress after completing the intervention. 13% of participants reported increase in levels of psychological distress while 4.3% reported no change. The observed increase in distress in some participants might be explained by reduced avoidance of facing psychological problems after completing the programme.
Figure 5.44 Pre and post group and individual total mean scores of Brief symptom Inventory (BSI)
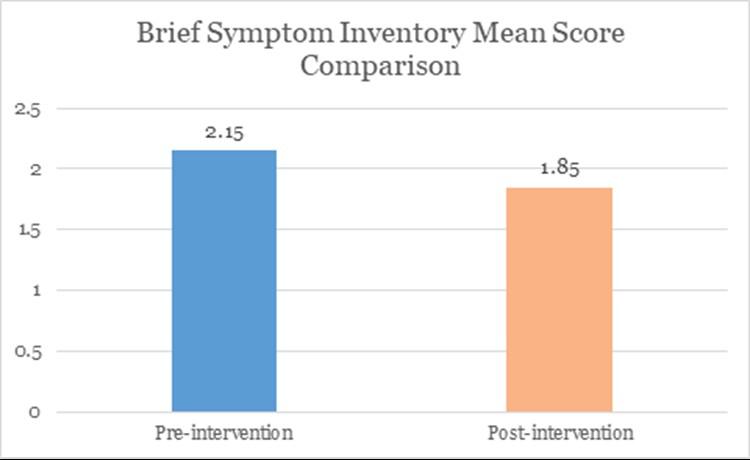
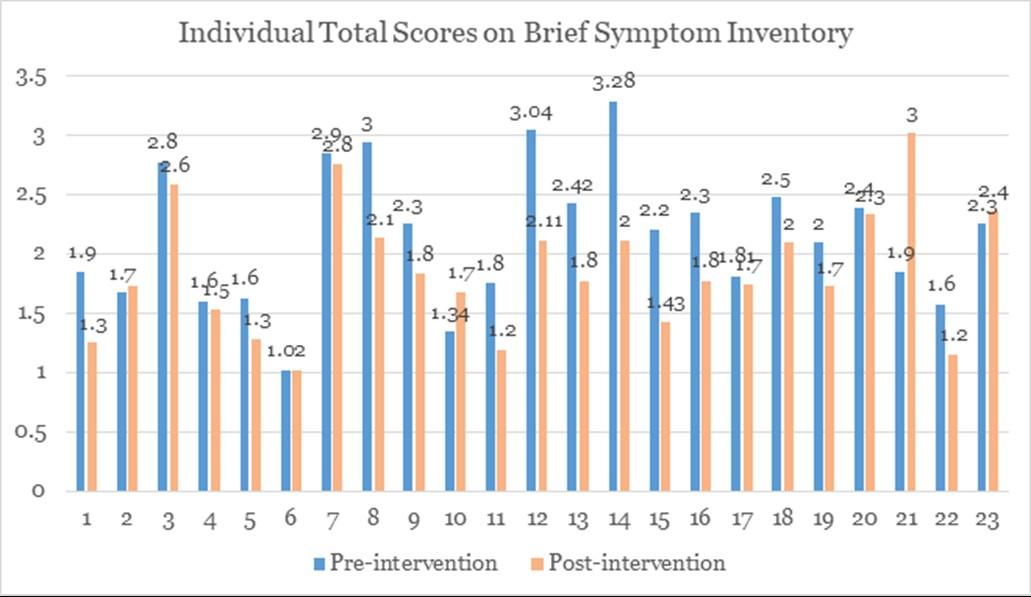
The Close subscale measures the extent to which a person is comfortable with closeness and intimacy. The Depend subscale measures the extent to which a person feels they can depend on others to be available when needed. The Anxiety subscale measures the extent to which a person is worried about being rejected or unloved.
On the Close subscale, there was no change in the mean group scores pre-intervention to post-intervention. However, visual inspection of the individual total scores revealed between-subject heterogeneity in response to the intervention with some participants demonstrating increases, others decreases or minimal change. This variability likely contributed to the small changes in mean total scores pre- and postintervention on a group-level.
For the Depend Subscale, a slight increase in mean scores was observed, which may reflect increased willingness to rely on others for some participants. Anxiety subscale scores showed a small reduction at the group level with individual changes indicating mixed responses. Given the limited statistical power of the sample, these results are interpreted descriptively, aiming to showcase individual patterns of change rather than statistically significant group effects.
Figure 5.45 Pre and post individual and group mean scores of Revised Adult Attachment Scale – Close Relationships Version (RAAS) total and subscales
Personal Need for Structure Scale (PNS)
There was a slight decrease on the Desire for Structure subscale from (M= 16.78, SD = 2.65) pre-intervention to (M= 15.5, SD = 2.44) postintervention. This may point towards a reduction in participants’ desire for structure in their daily lives (indicating more flexibility) after completing the programme. Fourteen out of twenty-three participants (60.78%)
reported a reduced desire for structure post-group, while eight (34.8%) reported and increase and one participant (4.3%) demonstrated no change of scores post-intervention. Individual scores are displayed in Figure 5.46.
Figure 5.46 Pre and post group and individual total mean scores of Personal Need for Structure Scale subscale (PNS)
Individual Mean Scores of PNS Desire for Structure Pre-intervention
There was only a very slight decrease on the Response to Lack of Structure subscale from (M= 28.41, SD = 3.8) pre-intervention to (M=
26.9, SD = 2.87) post-intervention. Eighteen out of twenty-three participants (78.3%) reported a reduced desire for structure post-group, while four (17.4%) reported and an increase and one participant (4.3%) demonstrated no change of scores post-intervention. However, improvements in flexibility were previously noted by researchers to occur in the months following the GRO programme when service users had time to implement and embed their learning (Egan, Long, McElvaney, & Booth, 2021).
Figure 5.47 Pre and post mean scores of Personal Need for Structure Scale (PNS)
PNS Response to Lack of Structure Subscale Mean Score Comparison
Pre-intervention Post-intervention
Emotion Regulation Questionnaire (ERQ)
The ERQ consists of two subscales: Cognitive Reappraisal and Expressive Suppression.
On the Cognitive Reappraisal subscale, there was a slight increase from (M= 4.03, SD = 1.36) pre-intervention to (M= 4.4, SD = 1.11) postintervention. This points towards an increase in participants’ ability to confront unhelpful cognitions regarding emotions. Nine out of twentythree participants (39.1%) reported reduction in cognitive reappraisal post-group, while ten participants (43.5%) reported an increase and four participants (17.4%) demonstrated no change of scores post-intervention. Individual scores are displayed in Figure 5.48.
Figure 5.48 Pre and post mean scores of Emotion Regulation Questionnaire (ERQ) subscales
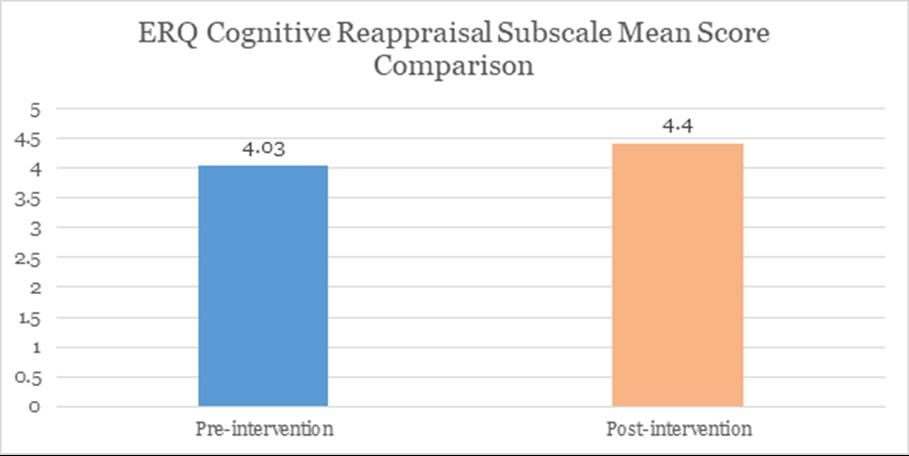
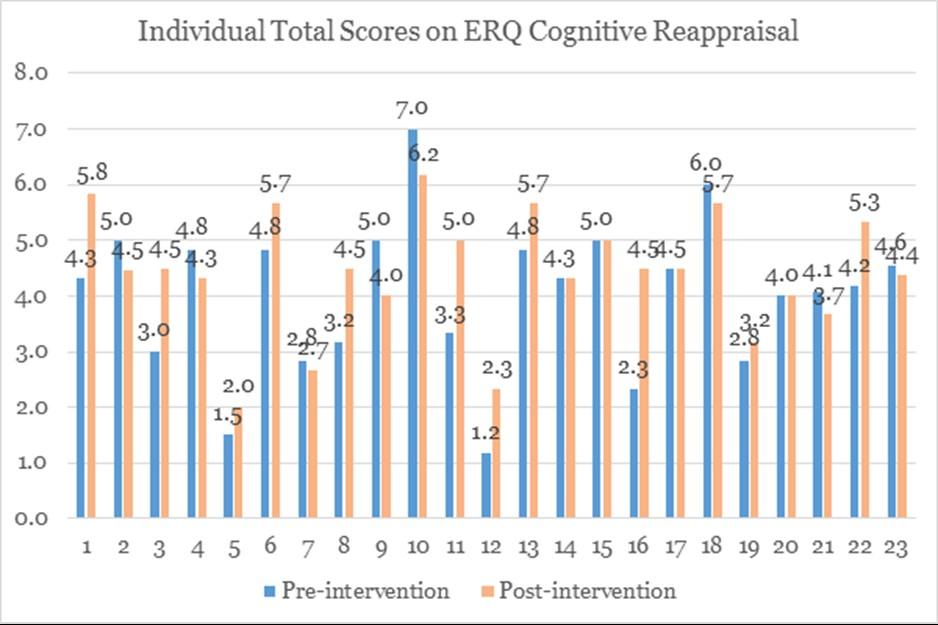
On the Expressive Suppression subscale, there was a slight decrease from (M= 4.59, SD = 1.10) pre-intervention to (M= 4.14, SD = 1.19) postintervention. This points towards less suppression of their emotions following completion of the programme. Thirteen out of twenty-three participants (56.5%) reported decrease in expressive suppression postgroup, while nine participants (39.1%) reported an increase, and one participant (4.3%) demonstrated no change of scores post-intervention Individual scores are displayed in Figure 5.49
Figure 5.49 Pre and post mean scores of Emotion Regulation Questionnaire (ERQ) Expressive Suppression subscales
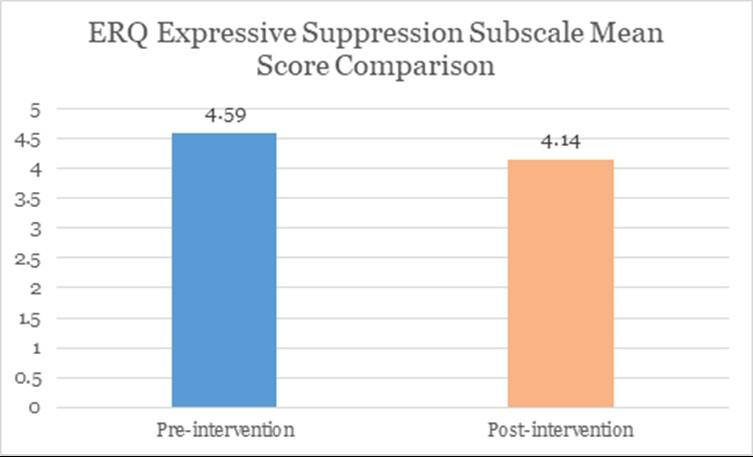
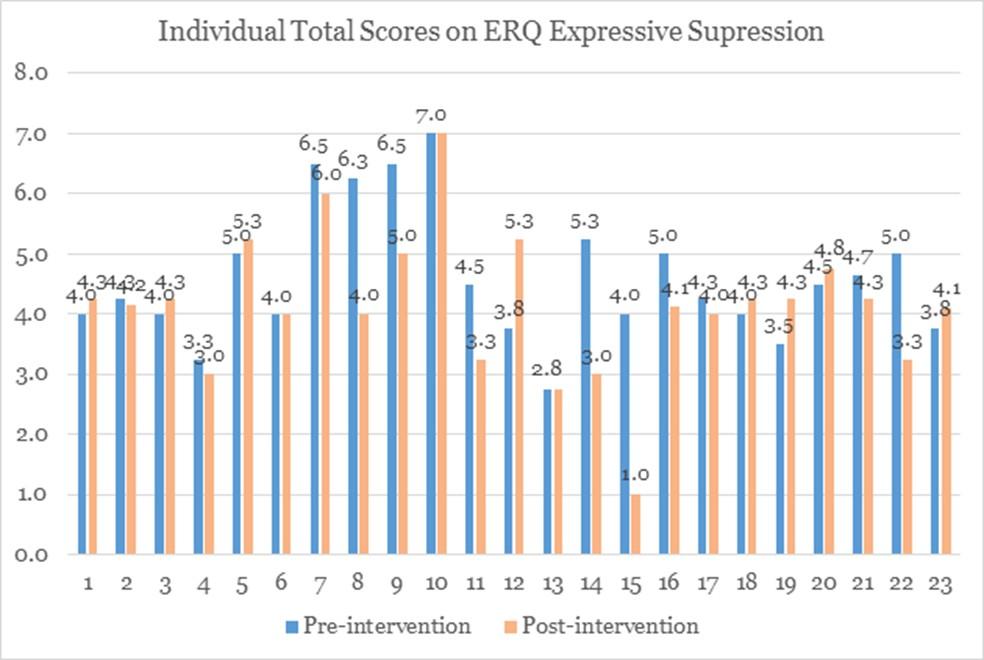
4.19.5 Summary
The Group Radical Openness (GRO) programme supports individuals to develop understanding and awareness of their overcontrol. The programme targets and encourages new ways of coping that are less costly and less harmful. This is a vital programme for service users who are often underserved in mental healthcare.
In 2025, service users who completed the GRO programme showed reductions in overcontrolled traits and reductions in overall psychological distress. At the group level, mean scores generally moved in adaptive direction post-intervention across several domains, including emotional
openness, attachment-related functioning and maladaptive personality traits linked to overcontrol. However, mean changes were modest and individual heterogeneity remained high with some participants showing improvements, while others remained stable. This may mean that the group averages masked individual differences. One potential explanation for the observed pattern of between-subject variability might be the transdiagnostic and process-focused nature of the programme, which may differentially impact participants depending on baseline levels of overcontrol, interpersonal distance and emotional inhibition.
The intervention may have been more effective in reducing maladaptive regulation strategies than in increasing adaptive coping. Moreover, as there was no evidence of reliable deterioration, the format of the GRO Programme can be considered safe for GRO’s targeted population.
Exploration of outcome measures of the GRO Programme show that this intervention had an overall positive impact on service users’ lives across most domains targeted by this intervention.
The Recovery Programme is a structured 10-day programme based on the Wellness and Recovery Action Plan (WRAP) approach designed by Mary Ellen Copeland of the Copeland Centre (1992). The WRAP approach focuses on assisting service users who have experienced mental health difficulties to regain hope and personal responsibility through education, self-advocacy, and support. The recovery model emphasises the centrality of the personal experience of the individual and the importance of mobilising the person’s own resources as part of treatment. It emphasises the development of individualised self-management plans rather than compliance with a standard treatment regime. The Recovery Programme at SPMHS is delivered through the Wellness and Recovery Centre for day service users.
The programme is aimed at service users who are either recently discharged and need structured and continued support to stay well or those that prefer structured day programme attendance. The programme is group-based and focuses on accessing good healthcare, managing medications, self-monitoring their mental health using their WRAP, using wellness tools and lifestyle, keeping a strong support system, participating in peer support, managing stigma and building self-esteem. The option of attending monthly after-care meetings is available to all participants for a period of 12 months after completion of the programme. The programme is delivered by three mental health nurses (all are advanced level WRAP® Facilitators trained by the Copeland Centre in America) as well as a part-time social worker and a part-time Occupational Therapist, with sessional input from a pharmacist, a Dietician and a service user who is an ex-participant that uses their WRAP® as a tool to manage their mental health.
4.20.1 Descriptors
Pre and post data were collected for 23 participants who completed the Recovery programme in 2025. Fifteen of the participants were female (65%) and eight were male (35%). Participant’s ages ranged from 27 years to 68 years (M = 55, SD = 10.35).
4.20.2
Recovery Assessment Scale – Revised (RAS)
The Recovery Assessment Scale (RAS: Giffort et al., 1995) assesses service user empowerment, coping ability and quality of life. Scale scores have been found to be positively associated with self-esteem, empowerment, social support and quality of life, indicating good concurrent validity. It was inversely associated with psychiatric symptoms suggesting discriminant validity (Corrigan et al., 1999). The Recovery Assessment Scale – Revised (RAS-R; Corrigan et al., 2004) consists of 24 items on a five-point Likert scale (from Strongly Disagree to Strongly Agree). These 24 items represent five dimensions of personal recovery:
personal confidence and hope, willingness to ask for help, goal and success orientation, reliance on others, and not dominated by symptoms. The RAS-R has been shown to have good reliability (Cronbach’s alpha = 0.90; Biringer & Tjoflat, 2018).
Results were examined and compared in greater detail including overall mean, and individual scores. Due to the small sample size, statistical analysis of the outcome measures was not possible. Acceptable power was not achieved to reliably conduct statistical operations on the data. G*Power analysis indicated that in order to achieve sufficient statistical power, a sample size of 27 participants would have been required to detect a medium effect size (Cohen’s d = 0.5). Therefore, individual results for the twenty-three participants who returned both pre and post measures are given to reflect the outcome of the intervention.
There was an increase in total scores from pre-intervention (M = 87.83, SD = 15.13) to post-intervention (M = 95.83, SD = 18.44). This finding indicates that those who completed the Recovery programme in 2025 showed enhanced levels of recovery (see figure 5.50).
5.50 Total RAS-R mean scores pre and post-inervention
As can be seen from figure 5.51, further examination of the individual scores indicates that 18 out of 23 participants (78%) demonstrated an increase in RAS-R scores from pre-intervention to post-intervention, 4 out of 23 participants (18%) experienced a decrease in RAS-R scores and 1 participant (4%) demonstrated no change in scores. Figure 5.51 Pre and post individual scores of the RAS-R.
RAS-R Individual Scores
4.20.4
The findings presented provide insight into the effectiveness of the programme. Careful consideration has been given to the retention of the RAS-R as the primary outcome measure for the Recovery Programme. While there is no ‘gold standard’ measure of recovery, the RAS-R has strong support for its psychometric properties. Overall, the data indicate a positive therapeutic impact, with the majority of participants demonstrating improvement in their RAS-R scores following completion of the Recovery Programme.
SAGE is a psychological therapy group for older adults who are experiencing difficulties with anxiety and/or depression and are interested
in applying a psychological approach to their difficulties. The group is adapted from psychological theories based on emotional regulation and emotional over-control (Lynch 2018; Booth & Egan, 2023), and how these can contribute to recurrent mental health difficulties. Themes addressed in the programme are difficulties with emotional inhibition, interpersonal aloofness, psychological rigidity and the role they play in maintaining mental health issues. Outcome measures used have been selected to reflect these three therapeutic themes, as well as an overall measure of mental health symptomatology. The SAGE programme incorporated a hybrid mode of attendance since 2024, whereby a large television screen was used to allow service users to join in-person groups remotely when they were occasionally unable to attend in-person, usually for physical health reasons.
4.21.1 Descriptor
11 older adult service users completed the programme in 2025, 5 of whom were female (45.5%), and 6 of whom were male (54.5%). Programme attendees ranged in age from 65 to 80 years old, with a mean of 72.27 (SD = 5.14). Pre and post data was available on the measures below for all 11 participants. There were no missing items in any of the measures completed in 2025, as a result of the effort made by the SAGE team to ensure all measures are completed.
4.21.2
The 21-item Depression, Anxiety and Stress Scale (DASS-21) is a set of three self-report scales designed to measure depression, anxiety and stress. Each of the three DASS-21 scales contain seven items, divided into sub-scales with similar content. Each item comprises a statement and four short response options to reflect severity. They are scored from zero – ‘did not apply to me at all’, to three – ‘applied to me very much, or most of the time’. The Depression Scale assesses dysphoria, hopelessness, devaluation of life, self-deprecation, lack of interest/involvement,
anhedonia and inertia. The Anxiety Scale assesses autonomic arousal, skeletal muscle effects, situational anxiety and subjective experience of anxious affect. The stress scale is sensitive to levels of chronic nonspecific arousal. It assesses difficulty relaxing, nervous arousal and being easily upset/agitated, irritable/over-reactive and impatient. The DASS-21 is based on a dimensional rather than a categorical conception of psychological disorder. The assumption on which the DASS-21 development was based (and which was confirmed by the research data) is that the differences between the depression, anxiety and the stress experienced by non-clinical populations and clinical populations are essentially differences of degree. Cronbach alphas were .66 for the Anxiety Scale, .91 for the Depression Scale and .82 for the Stress Scale.
The PNS (Neuberg & Newsom, 1993) is an 11-item self-report questionnaire consisting of two sub-scales: Desire for Structure and Response to Lack of Structure. Respondents are asked to rate each statement on a six-point scale from one (strongly disagree), to six (strongly agree). Higher scores indicate greater desire for structure and a dislike for unstructured and unpredictable situations (inflexibility). The measure has shown good reliability in previous research, with a Cronbach’s alpha of 0.62 for Desire for structure and 0.73 for Response to Lack of Structure (Hamtiaux & Houssemand, 2012).
High scores on the PNS are indicative of higher levels of rigidity and need for structure. Lower scores indicate a greater ability to manage novel situations, which in this context is interpreted as evidence of greater flexibility, one of the goals of this intervention.
• The Emotional Control Questionnaire 2 – Emotional Inhibition
Subscale (ECQ2-EI) (Roger & Najarian, 1989)
The ECQ-EI (Roger & Najarian, 1989) 14-item subscale aims to measure emotional inhibition. Lower scores are indicative of decreased emotional inhibition and suppression, a goal of the intervention.
The RAAS (Collins, 1996) is an 18-item measure of relationship attachment. It contains three sub-scales: Close, Depend, and Anxiety. Respondents are asked to rate each statement on a five-point scale from one (not characteristic of me at all), to five (very characteristic of me). Higher scores on the Close and Depend subscales indicate greater comfort with closeness and intimacy (depending on others) in everyday life. Lower scores on the Anxiety subscale indicate less fear of rejection. The RAAS is highly correlated with the long form Adult Attachment Scale (AAS) and has been found to have good internal and external validity (Graham & Unterschute, 2015).
The ERQ (Gross & John, 2003) is a 10-item self-report measure consisting of two subscales: Cognitive Reappraisal and Expressive Suppression. Cognitive Reappraisal describes the process of confronting automatic thoughts and assumptions regarding emotions and reframing them in a more helpful way. Expressive Suppression describes the ability to control or suppress responding to emotional experiences. Participants are asked to rate each statement on a seven-point scale from one (strongly disagree), to seven (strongly agree). The ERQ has been found to have high internal validity, and good convergent and discriminant validity (Preece, Becerra, Robincon et al. 2019).
Due to the small sample size, statistical significance could not be determined for changes in scores pre-to-post intervention. Means and individual scores are displayed instead. The small sample size is due to the fact that this programme is a specialist intervention delivered to a
small group of service users, to meet their specific therapeutic needs, but also may be related to the barriers which exist for older people in accessing psychological therapies (Wuthrich & Frie, 2015), Liu & Gellatly, 2020).
In 2023, Reliable Change Index (RCI) analysis was trialled with the DASS21, from the Sage programme dataset in 2023. Since 2024, the decision has been made to additionally display individual participant scores along with clinical cut-offs before and after participation in the programme as this method provides a more clinically meaningful and transparent representation of change over time. Therefore, in this 2025 report we have displayed both a complete RCI analysis and individual participant scores to provide a fuller picture.
Analysis of the total of the three subscales (Depression, Anxiety and Stress) within the DASS-21 revealed a decrease in psychological difficulties from a pre-intervention mean of 38.91 (SD = 23.18) to 28.55 (SD = 11.73) at post intervention. Scores on the Depression subscale showed a decrease from 15.27 (SD = 10.52) to 9.45 (SD = 4. 99), and on the Stress subscale from 15.64 (SD = 8.89) to 12.91 (SD = 3.94).
Similarly, scores on the Anxiety subscale decreased from 8 (SD = 6.26) to 6.18 (SD = 5.04). All scores are depicted in Figure 5.52.
Figure 5.52 Pre and Post mean scores of Depression Anxiety and Stress Scale (DASS-21) total and subscales
Mean Scores for the Depression Subscale, Anxiety Subcale and Stress Subsclae of DASS-21
Pre-intervention
Total scores on the DASS-21 decreased for eight out of eleven participants (72.73%) post-intervention. Similarly, eight out of eleven participants (72.73%) reported reduced depression scores at the end of the intervention, while six out of eleven participants reported reduced stress (54.55%) scores post-intervention. Five out of eleven participants (45.45%) reported reduced anxiety scores post-intervention. Overall, these changes point towards improvements in emotional well-being and reduced symptom severity among most participants post-intervention.
Please see Figure 5.53 for visual representation of changes in individual scores from pre to post intervention.
Figure 5.53 Pre and Post individual total mean scores of Depression Anxiety and Stress Scale (DASS-21)
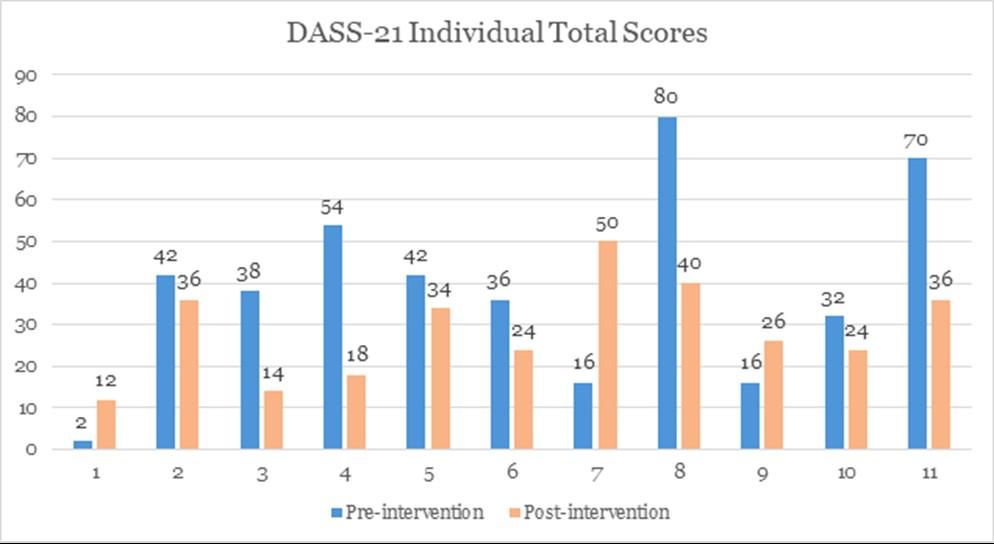
Figure 5.54 Pre and Post individual mean scores of Depression Anxiety and Stress Scale (DASS-21) subscales
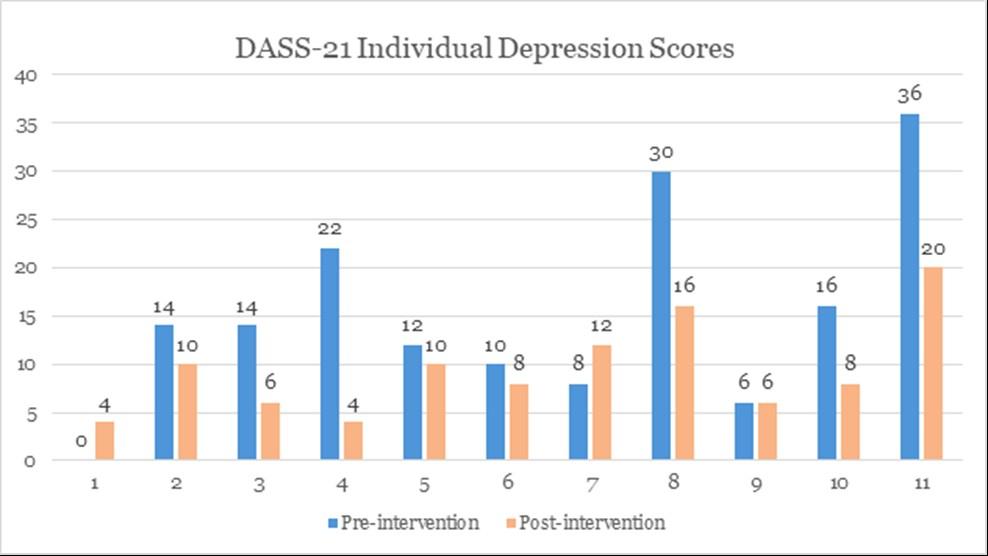
Due to the small sample size, changes in total DASS scores were analysed using the Reliable Change Index (RCI) for each participant. In order to ensure that changes in DASS scores were not attributable to chance or measurement error a RCI was calculated for each participant using the
Jacobson-Truax method (1991). In accordance with this method, statistically reliable change was reflected by RCI values of greater than or equal to 1.96. Participants were classified as “reliable improvement” (passed RCI criterion but the score did not decrease below DASS cut-off score), uncertain change (did not pass RCI criterion) or deterioration (passed RCI criterion but symptom score increased). As outlined in Table 5.55, seven participants (63.6%) reported uncertain change, and three participants (27.27%) demonstrated clinically reliable improvement. One participant’s score (9%) indicated deterioration.
Table 5.55 Results from Reliable Change Index (RCI) for the DASS-21 pre and post scores for each group member
Clinical cut-off scores for the DASS-21 range from normal to extremely severe across the three subscales of Depression, Anxiety and Stress. Scores on the depression subscale range from 0 to 28+. The anxiety subscale scores range from 0 to 20+, and the stress subscale scores range from 0 to 34+. Of the 11 participants who completed pre-group measures for the Sage programme, 27.27% fell within the normal range for depression (no or very low levels of depression symptoms), 18.18% fell within the mild range, 27.27% fell within the moderate range, 18.18% scored within the severe range and 9.09% fell within the extremely severe range. Post-group depression scores indicated that 54.55% of participants
fell within the normal range, 27.27% fell within the mild range, and 18.18% fell within the moderate range. With regards to stress scores, 54.55% of participants scored within the normal range of stress pre-group, 18.18% scored within the mild range, 9.09% scored within the moderate range and 18.18% scored within the severe range. Post-group scores indicated that 72.73% of participants scored within the normal range for stress, 18.18% scored within the mild range, and 9.09% scored within the moderate range. Pre-group scores on the anxiety subscale indicated that 54.55% participants scored within the normal range for anxiety, 9.09% scored within the mild range, 27.27% scored within the moderate range and 9.09% scored within the severe range. Scores on the anxiety subscale post-group indicated that 63.64% fell within the normal range, 9.09% scored within the mild range, 18.18% scored within the moderate range, and 9.09% scored within the severe range.
The mean scores on the PNS increased from 47.09 (SD = 5.22) at preintervention to 48.27 (SD = 7.46) at post-intervention. See Figure 5.66.
Despite the overall increase in total mean score, seven out of eleven participants (63.64%) reported a greater ability to manage novel situations, which in this context is interpreted as evidence of greater flexibility, having completed the intervention. Individual scores are displayed in Figure 5.57.
Figure 5.56 Pre and Post mean scores of Personal Need for Structure (PNS)
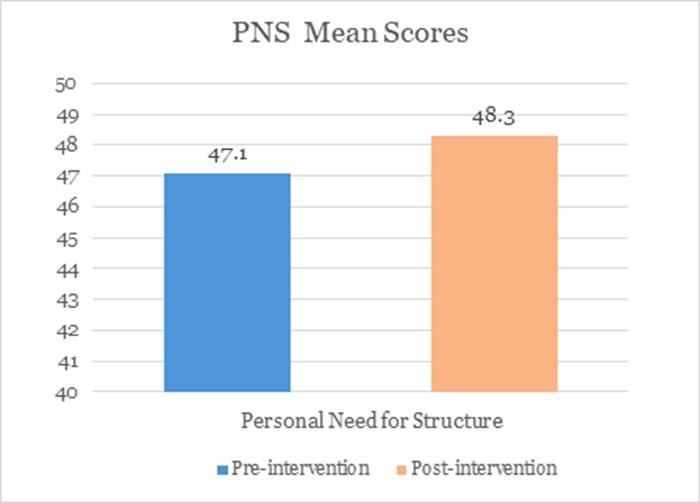
Figure 5.57 Pre and Post individual mean scores of Personal Need for Structure (PNS)
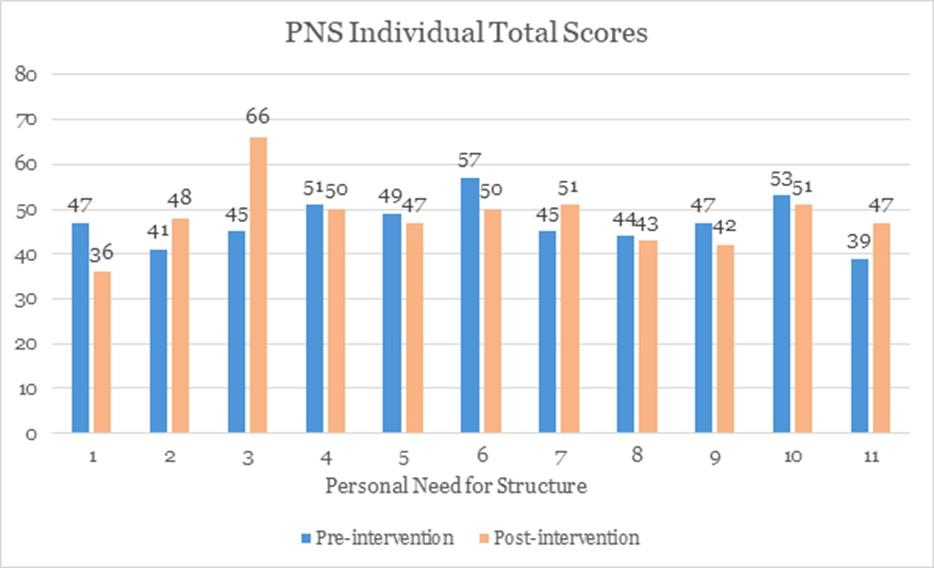
Emotion control questionnaire – Emotional inhibition (ECQ-EI)
The total mean score on the ECQ-EI showed an increase from 8.64 (SD = 3.50) at pre-intervention to 9.18 (SD = 3.12) at post intervention, see Figure 5.68. Individual scores are displayed in Table 5.59, with only four out of eleven participants (36.36%) endorsing decreased levels of emotional inhibition and suppression.
Figure 5.58 Pre and Post total mean scores of Emotional Inhibition subscale (ECQ-EI)
Figure 5.59 Pre and Post individual mean scores of Emotional Inhibition subscale (ECQ-EI)
Mean scores on the Closeness subscale slightly increased from a mean of 16 (SD = 3.87) pre-intervention to 16.64 (SD = 4.80), post-intervention. Similarly, mean scores on the Dependency subscale increased from a mean of 16.18 (SD = 3.57) to 17.81 (SD = 3.09). Mean scores on the Anxiety levels were found to decrease from 20 (SD = 4.58) to 19.36 (SD = 5.03) at post-intervention. Figure 5.60 and Figure 5.61 depicts pre and post mean scores of the RAAS subscales. Individual total scores can be found in Figures 5.62 – 5.64.
Figure 5.60 Pre and Post mean scores of Revised Adult Attachment Scale (RAAS) Closeness and Dependency Subscales
Figure 5.61 Pre and Post mean scores of Revised Adult Attachment Scale (RAAS) Anxiety Subscale
Figure 5.62 Pre and Post individual scores of Revised Adult Attachment Scale (RAAS) Anxiety Subscale
Five out of eleven participants (45.45%) reported less anxiety meaning less fear of rejection having completed the intervention. Figure 5.62 is displayed for visual representation of individual Anxiety total scores.
Figure 5.63 Pre and Post individual scores of Revised Adult Attachment Scale (RAAS) Dependency Subscale
RAAS Dependency
Seven out of eleven participants (72.73%) endorsed greater comfort with closeness and intimacy in everyday life, having completed the intervention, see Figure 5.63.
Figure 5.64 Pre and Post individual scores of Revised Adult Attachment Scale (RAAS) Closeness Subscale
Individual RAAS Closeness
Closeness
Five out of eleven participants (45.45%) reported greater comfort with closeness in everyday life after completing the intervention, see Figure 5.64.
The mean score for reappraisal increased from 26 (SD= 9.75) at baseline to 31.27 (SD= 4.15) post-intervention. Expressive suppression, which describes the ability to control or suppress the urge to respond to emotional experiences, decreased from a mean of 18.6 (SD= 6.99) to 17.7 (SD= 6.39). Mean and individual scores for these subscales are displayed in Figure 5.65.
Figure 5.65 Pre and Post mean scores of Emotion Regulation Questionnaire (ERQ) Reappraisal and Suppression subscales
Eight out of eleven participants (72.73%) reported increased use of reappraisal as a strategy for managing difficult emotional experiences having completed the intervention. Six out of eleven participants (54.55%) reported less use of suppression as a coping strategy for difficult emotional experiences having completed the intervention, shown in Figure 5.66.
Figure 5.66. Pre and Post individual scores of Emotion Regulation Questionnaire (ERQ) Reappraisal and Suppression subscales
Suppression
Pre-Intervention Post-Intervention
Reappraisal
Pre-Intervention Post-Intervention
4.21.4 Summary
Most measures in the battery of outcome measures indicate positive changes endorsed by most service users in the areas targeted by the SAGE programme: psychological flexibility and closeness and intimacy in relationships. The increase in cognitive reappraisal on the ERQ was understood as a greater level of awareness of, and ability to think about
emotional experiences in general, a useful first step towards responding to emotions in a more healthy and beneficial way. There was also an overall decrease in mental health symptomatology as measured by the DASS-21, suggesting that the programme has had a positive impact on the mental health of older adult participants and met its goals in 2025.
However, there was an overall increase on the PNS which measures levels of rigidity and need for structure and the ECQ which measures emotional inhibition and suppression. Deducing from many of the qualitative comments participants often made at end of the programme in 2025, it may be that participants have gained more insight into their ways of coping and may have underreported their difficulties at beginning of group. This is highlighted in the following quotes: “These sessions gave me an insight on how I might deal with [my emotions]. This is still not easy”, “It made me look at how set in my ways and in my thinking I am. Sometimes you don’t realise how stuck you are in a pattern of behaviour” and “I’m more aware of my emotions and actions/reactions.” Thus, increased endorsement of emotional inhibition and personal need for structure may reflect a greater awareness rather than an increase in the behaviours themselves.
23 cycles of Sage have been completed up to 2025. This is the third year of the hybrid screen technology, which allowed for a far better online experience for service users who occasionally needed to attend remotely, usually for physical health reasons. This is particularly relevant for our older adult cohort who often have a higher level of physical health issues and concerns around travel and safety at certain times of year.
The Trauma Group Programme is a therapeutic group delivered by the Psychology Department. The programme is for individuals with a history of complex trauma. The group has three stages adapted from Judith Herman’s Model of Trauma Recovery (Herman, 1992). It incorporates both group and individual work, memory reprocessing, compassion-focused
therapy and attachment theory. Stage one includes safety, stabilisation and connection. Stage two aims to work on remembering and reprocessing memories. Individual work runs alongside the group in stage two. Stage three focuses on looking forward and reclaiming the participants’ life from trauma. This format of three stages is considered as best practice (Willis, Dowling, O’ Reilly, 2022). The group is offered over a seven-month period which includes twice a week for six weeks, then once a week for twelve weeks (during this time participants also engage in individual memory processing therapy work) and then twice a week for five weeks. The programme was delivered all in person in 2025.
4.22.1
Twenty-one participants returned pre and post outcome measures across cycles 8, 9 and 10. Fourteen of the participants were female (67%) and seven were male (33%). Participant’s ages ranged from 20 years to 82 years (M= 41.57, SD= 15.00). Pre-treatment completion of the Adverse Childhood Experience (ACEs) indicated that 18 out of 21 returned ACEs measures scored four and above, with four participants scoring 4; six participants scoring 5; two participants scoring 6; three participants scoring 7; two participants scoring 8 and one participant scoring 9. The higher the ACE score the more at risk the client is to chronic health problems, mental health difficulties, social difficulties, and substance misuse in adulthood.
4.22.2
There were two new additions to the measures used for the Trauma Programme: The Brief Symptom Inventory (BSI) and The Scale of Body Connection (Adapted) Scale (SBC). The Scale of Body Connection scale was included to assess participants’ awareness of, and connection to, bodily sensations, which is a clinically relevant outcome in trauma-focused interventions whilst the Brief Symptom Inventory (BSI) was added to provide a broad assessment of psychological distress, changes in symptom severity over time and overall treatment-related outcomes across multiple psychological domains.
The PTSD Checklist is a 20-item self-report checklist of post-traumatic stress disorder (PTSD) symptoms based closely on the DSM-5 criteria (PCL-5; Lang & Stein, 2005). Service users rate each item from 0 – ‘not at all’, to 4 – ‘extremely’, to indicate the degree to which they have been impacted by that symptom over the past month. The PCL has demonstrated strong psychometric properties. Estimates of internal consistency (Cronbach's alpha) range between 0.94 (Blanchard et al, 1996) to 0.97 (Weathers et al. 1994). Test-retest reliability has been reported as .96 at two to three days and 0.88 at one week (Blanchard et al.,1996; Ruggiero et al.,2003). Higher scores indicate higher experiencing of PTSD symptoms. A cut-off raw score of 33 indicates a provisional diagnosis of PTSD. This cut-off has high sensitivity (.78) and specificity (.98) (Cohen et al., 2015). When used to track symptoms over time, a minimum 10-point change represents clinically significant change.
The Dissociative Experiences Scale- Taxon (DES- T) (Bernstein and Putnam, 1986) is an 8- item self-report subscale of the DES which measures dissociation among clinical populations. Each item is rated from 0-100% which indicates what percentage of time the individual experiences dissociation. High numbers indicate higher levels of dissociation, and the mean score is calculated by summing the eight items.
The PTCI (Foa, Ehlers, Clark, Tolin & Orsillo, 1999) is a 36-item self-report scale that was designed to measure trauma-related thoughts and beliefs. Each item is rated on a seven-point Likert scale from 1 – ‘totally disagree’, to 7 – ‘totally agree’. The measure consists of three subscales measuring negative cognitions about self, negative cognitions about the world and self-blame. Higher scores indicate higher post-traumatic cognitions. This scale has been normed using three categories of individuals; a nontraumatised population, a traumatised population without PTSD and a
traumatised population with PTSD. The median score for the nontraumatised group was 45.5, for the traumatised group without PTSD was 49 and for the traumatised group with PTSD the median score was 133.
Compassionate Engagement and Action Scales (CEAS)
The Compassionate Engagement and Action Scales (CEAS) are three separate scales measuring compassion to self, compassion to others and compassion experienced from others (Gilbert et al, 2017). Each scale consists of 13 items which generate an engagement subscale (ie. motivation to care for wellbeing, attention/sensitivity to suffering, sympathy, distress tolerance, empathy, being accepting and nonjudgmental) and an action sub-scale (ie. directing attention to what is helpful, thinking and reasoning about what is likely to be helpful, taking helpful actions and creating inner feelings of support, kindness, helpfulness and encouragement to deal with distress). Responses are given on a 10-point Likert scale; one – ‘never’, to 10 – ‘always’. High scores indicate high compassion. Cronbach alphas were .67 for compassion to self, .71 for compassion to others and .72 for compassion to others.
Brief Symptom Inventory (BSI; Derogatis, 1975)
The BSI (BSI; Derogatis, 1983) is a 53-item scale that measures symptoms of psychological distress within the previous week. Psychometric evaluations have shown that the BSI is a reliable and valid measure (Derogatis & Melisartos, 1983: Derogatis & Fitzpatrick, 2004). It has good test-retest reliability and internal consistency, and it shows high convergence with comparable scales on the SCL-90-R and MMPI. Service users rate each symptom on a scale of zero – ‘not at all’, to four ‘extremely’. The Global Severity Index score, which is used in this report, is the best indicator of current distress levels.
Scale of Body Connection (Adapted) Scale (SBC)
The Scale of Body Connection (SBC) (Price & Thompson, 2007) is a 20item self-report measure designed to assess two core dimensions: Body Awareness and Body Dissociation. The adapted version retains the original structure but includes minor wording or item modifications to better accommodate specific clinical populations or intervention contexts. For the purposes of this programme evaluation, only the Body Awareness subscale (12 items) was administered across cycles. This subscale assesses the degree to which an individual is attuned to internal bodily sensations, including physical cues associated with emotional or physiological states. Item responses are rated on a 5-point scale, ranging from 0 (“not at all”) to 4 (“all of the time”). Higher awareness scores reflect: Greater sensitivity to internal sensations, Enhanced ability to notice physical responses and Improved mind–body integration.
International Trauma Questionnaire (ITQ) - (Cycles 9 and 10)
The ITQ (Cloitre et al., in press) is an 18-item self-report measure designed to assess the ICD-11 diagnoses of Post-Traumatic Stress Disorder (PTSD) and Complex PTSD (CPTSD). The PTSD section consists of 6 core symptom items and 3 functional impairment items, reflecting the ICD-11 model of trauma-related disorders. Respondents report how much they were troubled by each symptom in the past month. The ITQ uses a 5point scale from 0 (Not at all), 1 (A little bit), 2 (Moderately), 3 (Quite a bit) to 4 (Extremely). Ratings capture the intensity and frequency of each symptom. This provides two overall total scores; a PTSD symptom scale and Disturbances in Self-Organization (DSO) symptom scale. Only participants from cycles 9 and 10 were included in the analysis, as the ITQ measure was implemented after the completion of cycle 8.
Results were examined and compared in greater detail including overall mean, individual and cycle scores. Due to the small sample size, statistical analysis of the outcome measures was not possible. The small sample size is due to the fact that this programme is a specialist intervention
delivered to a small group of service users, to meet their specific therapeutic needs. Acceptable power was not achieved to reliably conduct statistical operations on the data. G*Power analysis indicated that in order to achieve sufficient statistical power, a sample size of 27 participants would have been required to detect a medium effect size (Cohen’s d=0.5). Therefore, for each measure individual results for the twenty-one participants who returned both pre and post measures are given to reflect the outcome of the intervention.
There was a decrease in total PTSD scores for the PCL-5 checklist from pre- intervention (M = 52.81, SD = 11.61) to post-intervention (M = 35.33, SD= 16.65). This finding indicates that those who completed the trauma programme in 2025 had a reduction in PTSD symptoms post-intervention (see Figure 5.68).
Due to the small sample size, changes in the PCL scores were analysed using the Reliable Change Index (RCI) for each participant. To ensure that changes in PCL-5 scores were not attributable to chance or measurement error a reliable change index (RCI) was calculated for each participant using the Jacobson-Truax method (1991). In accordance with this method, statistically reliable change was reflected by RCI values larger than or equal to 1.96. The cut-off score indicating clinically meaningful improvement on the PCL-5 was 33. Participants were classified as “clinically meaningful improvement” (passed RCI criterion and PCL-5 score decreased to below cut-off score), “reliable improvement” (passed RCI criterion but the score did not decrease below PCL-5 cut-off score), “uncertain change” (did not pass RCI criterion) or “reliable deterioration” (passed RCI criterion but symptom score increased).
Results from the RCI demonstrated that five out of twenty-one participants (23.8%) demonstrated clinically meaningful improvement, eight participants (38.1%) demonstrated reliable improvement, eight
participants (38.1%) demonstrated uncertain change, and no participants demonstrated reliable deterioration (0%) (see table 5.67).
Table 5.67 Results from Reliable Change Index (RCI) for the PCL-5 pre and post scores for each group member
Figure 5.68 Pre and post mean scores of Post-Traumatic Stress Disorder (PTSD) Checklist DSM 5 (PCL-5).
As can be seen from Figure 5.69, further examination of the individual scores indicates that fourteen out of twenty-one participants (66.7%) demonstrated a clinically significant reduction in PCL scores from preintervention to post-intervention (10 points or greater). In addition, five participants (23.8 %) have moved from meeting criteria for a provisional diagnosis of PTSD pre-intervention (cut off score 33 or higher) to no longer meeting criteria post intervention (see Figure 5.69).
Figure 5.69 Pre and post individual scores of Post-Traumatic Stress Disorder (PTSD) Checklist DSM 5 (PCL-5).
The Total Dissociation mean scores for 2025 decreased from preintervention (M = 19.37; SD = 15.61) to post-intervention (M = 17.67; SD = 17.85) (see Figure 5.70).
Figure 5.70 Pre and post mean scores of the Dissociative Experiences Scale - Taxon (DES- T).
Further examination of the individual scores indicated that eighteen out of twenty-one participants (85.7%) demonstrated a decrease in total scores on the Dissociative experiences scale-Taxon (DES-T) (see Figure 5.71)
Figure 5.71 Pre and post individual scores of the Dissociative experiences scale-Taxon (DES-T).
The Post Traumatic Cognitions Inventory (PTCI)
There was a decrease in total PTCI scores from pre-intervention (M = 171.95; SD = 31.07) to post-intervention (M = 135.24; SD = 41.42) (see Figure 5.72).
Figure 5.72 Pre and post mean scores of the Post Traumatic Cognitions Inventory (PTCI).
Further examination of individual total PTCI scores indicates that twenty out of twenty-one (95%) participants who completed the programme in 2025 had a reduction in post-traumatic cognition symptoms postintervention (see figure 4.153). Nineteen out of Twenty-one (91%) participants scored 133 or above at pre-intervention, indicating a similar level of distress as experienced by traumatised subjects with PTSD. Eleven out of twenty-one (52%) participants yielded reduction in posttraumatic cognition symptoms and demonstrated a significant reduction in scores, no longer meeting this criteria post intervention following completion of the programme (see Figure 5.73).
Figure 5.73 Pre and post individual scores of the Post Traumatic Cognitions Inventory (PTCI) total.
In addition, fourteen out of twenty-one (67%) participants demonstrated reductions across the subscale ‘self-blame’, nineteen out of twenty-one
(91%) demonstrated reductions across the subscale ‘negative cognitions about the self’ and seventeen out of twenty-one (81%) across the subscale ‘negative cognitions about the world’. These findings indicate that participants who completed the trauma programme significantly reduced their PTSD symptoms associated with trauma related thoughts and beliefs (see Figure 5.74 to Figure 5.76).
Figure 5.74 Pre and post individual scores of the Post Traumatic Cognitions Inventory (PTCI) - self-blame subscale.
Figure 5.75 Pre and post individual scores of the Post Traumatic Cognitions Inventory (PTCI) - negative cognitions to self-subscale.
Figure 5.76 Pre and post individual scores of the Post Traumatic Cognitions Inventory (PTCI) - negative cognitions to world subscale.
Scores Comparison Pre Post
Compassionate Engagement and Action (CEA)
There was an increase in total self-compassion scores from preintervention (M = 47.00; SD = 12.91) to post-intervention (M = 62.14; SD = 17.53) (see Figure 5.77).
Figure 5.77 Pre and post mean scores of the Compassionate Engagement and Action (CEA) self-compassion subscale.
Further examination of the individual scores indicated that sixteen out of twenty-one participants (76.2%) demonstrated an improvement on the self-compassion subscale (see Figure 5.78)
Figure 5.78 Pre and post individual scores of the Compassionate Engagement and Action (CEA) - self-compassion subscale.
Self-Compassion Individual Scores
Individual scores indicate that eight out of twenty-one participants (38.1%) demonstrated an increase in compassion to others, ten participants demonstrated a decrease in scores (47.6%) while three participants revealed no change in scores (14.3%) (see Figure 5.79 and Figure 5.80).
Figure 5.79 Pre and post mean scores of the Compassionate Engagement and Action (CEA) - compassion to others subscale.
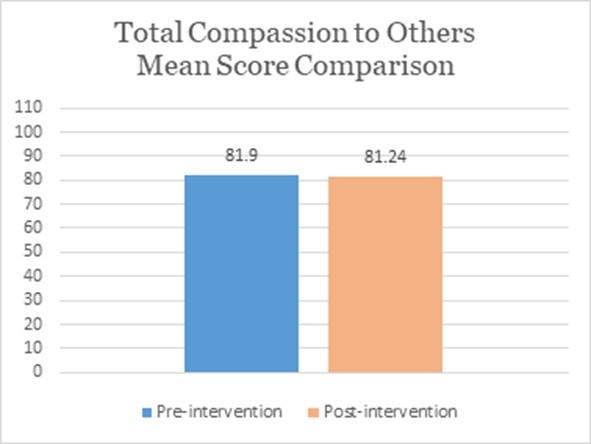
Figure 5.80 Pre and post individual scores of the Compassionate Engagement and Action (CEA) Compassion to others subscale.
There was an increase in total compassion from others’ scores from preintervention (M = 47.33; SD = 19.67) to post-intervention (M = 57.48; SD = 23.46) (see Figure 5.81).
Figure 5.81 Pre and post mean scores of the Compassionate Engagement and Action (CEA) - compassion from others subscale.
Total Compassion from Others Mean Score Comparison
Further exploration of individual scores indicates that seventeen of twenty-one participants (81%) demonstrated an increase in perceived levels of compassion from others post- intervention (see Figure 5.82).
Figure 5.82 Pre and post individual scores of the Compassionate Engagement and Action (CEA) - compassion from others subscale.
Scale of Body Connection (Adapted) Scale (SBC)
There was an increase in Total Body Awareness scores from preintervention (M = 2.44; SD = 0.86) to post-intervention (M = 2.82; SD = 0.69) (see Figure 5.83).
Figure 5.83 Pre and post mean scores of the Scale of Body Connection (SBC)- Body Awareness subscale.
Further examination of the individual scores indicated that sixteen out of twenty-one participants (76.2%) demonstrated increases in Body Connection scores on the Body Awareness subscale (see Figure 5.84)
Figure 5.84 Pre and post individual scores of the Scale of Body Connection (SBC)- Body Awareness subscale.
There was a decrease in BSI Global Severity Index Scores from preintervention (M = 2.92; SD = 0.58) to post-intervention (M = 2.39; SD = 0.73) (see Figure 5.85).
Figure 5.85 Pre and post mean scores of the BSI Global Severity index (GSI) Scores.
Total Global Severity Index Mean Score comparison
Further examination of the individual scores indicated that eighteen out of twenty-one participants (85.7%) demonstrated decreases in Global Severity Index scores on the Brief Symptom Inventory (BSI) (see Figure 5.86).
Figure 5.86 Pre and post individual scores of the BSI Global Severity index (GSI).
Global Severity Index Individual Scores
International Trauma Questionnaire (ITQ) - (Cycles 9 and 10)
Only participants from cycles 9 and 10 were included in the analysis, as the ITQ measure was implemented after the completion of cycle 8. Sample size differences reflect partial ITQ completion; one participant completed the PTSD domain only. In total, 12 participants returned data for the PTSD symptom scale total scores (n=12) and 11 participants returned data for the DSO scores (n=11). There was a decrease in PTSD scores from pre-intervention (M = 18.83; SD = 4.45) to post-intervention (M = 12.08; SD = 4.40) (see Figure 5.87).
Figure 5.87 Pre and post mean scores of the International Trauma Questionnaire (ITQ)- PTSD Total Scores
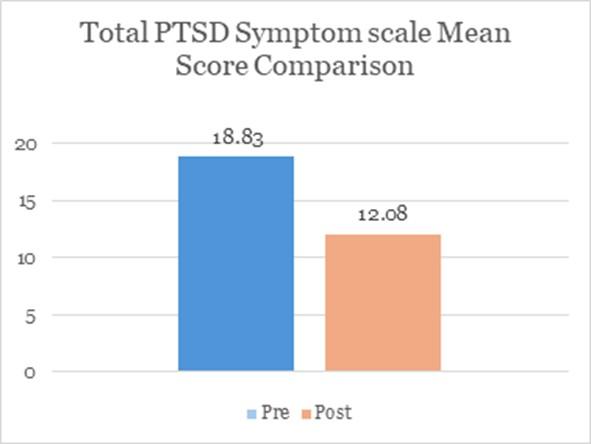
Further examination of the individual scores indicated that eleven out of twelve (91.7%) demonstrated decreases in symptom scores on the PTSD subscale (see Figure 5.88).
Figure 5.88 Pre and post individual scores of the International Trauma Questionnaire (ITQ)- PTSD Total Scores
Data on the Disturbances in Self-Organization (DSO) symptom scale were available for 11 participants. There was a decrease in DSO scores from pre-intervention (M = 19.73; SD = 2.20) to post-intervention (M = 13.84; SD = 6.12) (see Figure 5.89).
Figure 5.89 Pre and post mean scores of the International Trauma Questionnaire (ITQ)- Disturbances in Self-Organization (DSO) Total Scores
Further examination of the individual scores indicated that nine out of eleven participants (76.2%) demonstrated decreases in symptom scores on the DSO symptom scale (see Figure 5.90)
Figure 5.90 Pre and post individual scores of the International Trauma Questionnaire (ITQ)- Disturbances in Self-Organization (DSO) Total Scores
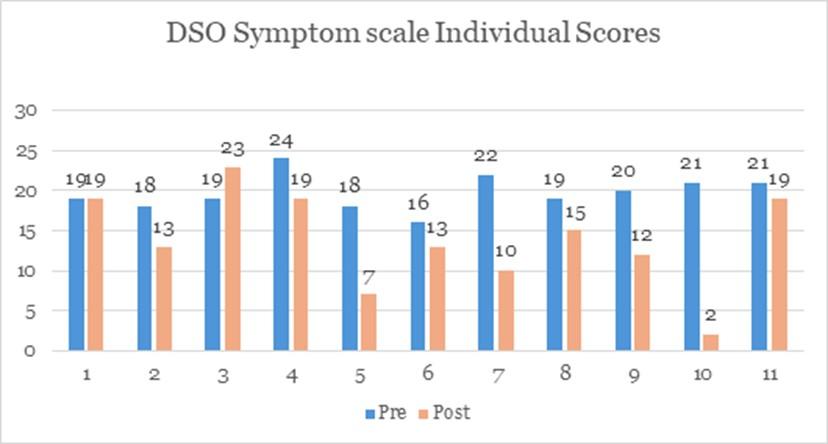
The Trauma programme aspires to reduce participants’ symptoms of PTSD and increase their capacity for compassion in their relationships with themselves and others. The analysis of group and individual scores overall demonstrated promising positive results. These results indicate that the
Trauma Programme is effective in delivering its aims. There were improvements in reducing PTSD symptoms post- intervention as demonstrated through findings from the PCL and PTCI measures. Another aim of the programme was to increase participants’ capacity for compassion, and the results indicate there were improvements in selfcompassion and receiving compassion from others. The addition of two further outcome measures provided more detailed insight into participants’ attunement to internal bodily sensations, including physical cues associated with emotional and physiological states, as well as changes in overall symptom severity over time. In conclusion, the 2025 trauma programme demonstrated promising results in relation to reducing trauma symptoms and improving the capacity to cultivate compassion, these outcome reports are consistent with previous qualitative research exploring participants’ experiences of attending the Trauma Programme (Willis, Dowling, Deehan, O’ Reilly 2022).
Willow Grove is the inpatient adolescent service of SPMHS. The 14-bed unit (with 2 Homecare Service, ‘Virtual beds’) opened in April 2010 and aims to provide evidence-based treatment in a safe and comfortable environment to young people between the ages of 12 and 17 years who are experiencing mental health difficulties. The unit is an approved centre accepting voluntary and involuntary admissions. The team consists of medical and nursing personnel together with psychologists, cognitive behavioural therapists, social worker, family therapist, occupational therapists, and teaching staff.
The unit offers an intensive structured clinical programme designed to assist and support young people and their families to manage and alleviate mental health difficulties. These difficulties include:
Mood disorders
Anxiety disorders
Psychosis
Eating disorders
Care is delivered from a multidisciplinary perspective. The unit provides a group programme in addition to individual therapy and treatment focuses on skills to assist and maintain recovery and promote personal development. Groups include psychotherapy, self-esteem, assertiveness, life skills, DBT and CBT skills, WRAP group, advocacy, music, drama, gym, and activity/creative groups. Education is also a central component of the programme and tailored for individual needs.
4.23.1
Health of the Nation Outcome Scales for Children and Adolescents (HoNOSCA)
The Health of the Nation Outcome Scales for Children and Adolescents (HoNOSCA) was developed as an outcome measure for children and adolescents (three to 18 years) engaging with mental health services (Gowers, Levine, Bailey-rogers, Shore & Burhouse, 2002). This measure provides a global assessment of the behaviour, impairments, symptoms and social functioning of children and adolescents with mental health problems. Studies such as Garralda et al. (2000) have found the validity and inter-rater reliability of the HoNOSCA to be satisfactory. Lesinskiene, Senina & Ranceva (2007) investigated the use of the HoNOSCA in an inpatient child psychiatric unit and found satisfactory inter-rater reliability amongst MDT members. The measure has been regarded as suitable for use as a routine measure in mental health services and is used internationally.
The HoNOSCA is used to assess the most pertinent problems presenting during the previous two weeks. The measure is comprised of 15 items in total, with the first 13 items used to compute a total score (Bilenberg, 2003). These include disruptive/aggressive behaviours, over-reactivity/concentration problems, self-injury, substance misuse,
scholastic skills, physical illness, hallucinations/delusions, non-organic somatic symptoms, emotional symptoms, peer relationships, self-care, family relationships and school attendance. All scales are scored on a zero to four-point Likert scale from ‘no problems’, to ‘severe problems’. Higher scores are indicative of greater severity of difficulty.
In line with the collaborative ethos of the unit, the HoNOSCA’s were completed at admission and discharge by the young person (self-rated), parent and clinician.
4.23.2 Results
Health of the Nation Outcome Scales for Children and Adolescents (HoNOSCA)
Pre and post scores on measures were available for 69 out of 72 service users (95.8%) who were discharged from Willow Grove inpatient care in 2025. Analysis was run on pre and post data received up until January 15, 2026.
As illustrated in Figure 6.1 below, a significant decrease in total scores for the client rated HoNOSCA was apparent from pre-intervention (M = 21.61, SD = 7.48) to post- intervention (M = 14.09, SD = 8.22), t(68) = 8.34, p < .001. A large effect size was observed (Cohen’s d = 1.0) (see Table 6.0).
A significant decrease in total scores for the parent rated HoNOSCA was apparent from pre-intervention (M = 21.08, SD = 7.57) to postintervention (M = 12.80, SD = 7.07), t(68) = 8.43, p < .001. A large effect size was observed (Cohen’s d = 1.02) (see Figure 9.2).
A significant decrease in total scores for the clinician rated HoNOSCA was observed from pre-intervention (M = 4.83, SD = 3.19) to post-intervention (M = 3.38, SD = 2.45), t(63) = 3.44, p = .001. A small effect size was observed (Cohen’s d = .43) (see Table 6.0).
Table 6.0 HoNSOCA Client and Parent rated paired samples t-tests results
Note: a reduction in HoNOSCA scores indicates a decrease in mental health difficulty.
Figure 6.1 Pre and post mean scores of Health of the Nation Outcome
Scales for Children and Adolescents - Client Rated scale.
Rated HoNOSCA Mean Scores
Figure 6.2 Pre and post mean scores of Health of the Nation Outcome
Scales for Children and Adolescents - Parent Rated scale.
Parent Rated HoNOSCA
Pre-intervention Post-intervention
Figure 6.3 Pre and post mean scores of Health of the Nation Outcome Scales for Children and Adolescents - Clinician Rated scale.
Clinician Rated HoNOSCA
4.23.3 Summary
Willow Grove outcomes were captured using the Health of the Nation Outcomes Scales for Children and Adolescents (HoNOSCA). Significant improvements were identified post-intervention on the self-rated, parentrated and clinician-rated HoNOSCA.
The measure has been commended in the literature for its ease of access for adolescents (Levine, Bailey-Rogers, Shore & Burhouse, 2002) and
clinicians (Jaffa, 2000). It is expected to continue to serve as the primary outcome measure for 2026.
The Temple Formulation Group (TFG) is designed to support adults experiencing mental health difficulties, specifically those with co-occurring substance use or dual diagnosis. The group focuses on helping service users make sense of their current challenges by reflecting on their background, life experiences, and coping strategies. Through formulation process, participants develop a deeper understanding of how their experiences have shaped their current patterns of thinking, feeling, and their behaviours.
The programme provides compassionate and reflective space where service users explore their strengths, values and the factors that have contributed to their difficulties. It encourages self-awareness and insight, aiming to empower individuals to approach their struggles with greater understanding and to foster personal growth. The group facilitates reflection on these elements to promote identifying more adaptive coping strategies and emotional resilience toward recovery and more balanced life.
The TFG adopts a compassionate, neuropsychologically informed approach, integrating up-to-date research to support service users in developing more holistic insight of themselves by understanding how the nervous system shapes emotions, thoughts and behaviours. The formulation model draws on several psychological frameworks, including Polyvagal Theory, Compassion-Focused Therapy, Rogers’ Person-Centred Theory, Attachment Theory and Trauma-Informed Care (Long et al., 2026).
4.24.1
The Temple Formulation Group will be included in the Outcomes Report for the first time in 2025 with 22 cycles of TFG completed since its
inception. In 2025 the programme completed 3 full cycles, data from which will be explored below. 21 individuals with complete data were included in this analysis. These participants attended and completed the TFG programme in 2025. Of these, 6 were male (28.6%) and 15 female (71.4%). The age of participants ranged from 21 to 75, with a mean age of 50.5 (SD = 13.59).
4.24.2
Formulation
The Forms of Self-Criticising/Attacking and Self-Reassuring Scale (FSCRS)
The FSCRS was developed by Gilbert, Clarke, Hempel, Miles and Irons (2004). This scale was developed to measure self-criticism and the ability to self-reassure. It is a 22-item scale that measures different ways people think and feel about themselves when things go wrong for them. The items make up three components, there are two forms of self-criticalness: inadequate self (“I am easily disappointed with myself”); and hated self (“I have become so angry with myself that I want to hurt or injury myself”), and one form to self-reassure (“I am able to remind myself of positive things about myself”). The responses are given on a five-point Likert scale ranging from zero – ‘not at all like me, to four – ‘extremely like me’. Cronbach alphas were .89 for the inadequate self-scale, .89 for the hated self-scale, and .85 for the reassured self-scale.
Clinical Outcome Routine Evaluation – Outcome Measures (CORE-OM)
The Clinical Outcomes in Routine Evaluation - Outcome Measure (COREOM) is a 34-item self-report questionnaire developed to monitor clinically significant change in outpatients. The service user is asked to respond to 34 questions about how they have been feeling over the last week using a five-point Likert scale ranging from ‘not at all’, to ‘most or all the time’. The 34 items of the measure cover four dimensions: subjective wellbeing, problems/symptoms, life functioning and risk/harm.
The responses are designed to be averaged by the practitioner to produce a mean score to indicate the level of current psychological global distress (from healthy to severe). The scoring range of the CORE-OM is between zero and four, with four being the highest level of severity. The CORE Outcome Measure (CORE-OM) was conceived as a non-proprietary measure of psychological distress. Crucially, it was informed by feedback from practitioners as to what they considered to be important to include (Barkham et al, 2010). Since its development, the CORE-OM has been validated with samples from the general population, NHS primary and secondary care and in older adults. Furthermore, analyses of over 2,000 responses show good reliability and convergent validity against longer and less general measures; small gender effects, large clinical/non-clinical differences and good sensitivity to change (Evans et al, 2009).
The Personal Mastery Scale (PMS)
The Personal Mastery Scale (PMS), developed by Leonard I. Pearlin and Elizabeth G. Menaghan in the late 1970s, is a brief 7-item self-report measure designed to assess an individual’s perceived sense of control and ability to influence life circumstances (Pearlin & Schooler, 1978). It reflects the degree to which a person feels capable of managing challenges, achieving goals and maintaining autonomy in the face of stress. In clinical settings, the scale is often used to evaluate changes in self-efficacy and resilience over the course of a psychological intervention. Higher scores indicate a stronger sense of agency and confidence in one’s ability to cope effectively, whereas lower scores may suggest feelings of helplessness or dependence on external factors. Within TFG, the PMS provides a useful indicator of progress, helping to capture how participants’ self-perception and coping capacity evolve as they gain greater insight into their experiences and develop more adaptive strategies for managing difficulties.
4.24.3 Results
Due to the small sample size, statistical significance could not be determined for changes in scores pre-to-post intervention. Means and
individual scores are displayed instead The small sample size is due to the fact that this programme is a specialist intervention delivered to a small group of service users, to meet their specific therapeutic needs. This population can also have higher dropout rates due to difficulties around addiction and so it is not always possible to collect post-group measures.
Clinical Outcome Routine Evaluation – Outcome Measures (COREOM)
Participants total scores decreased from a mean of 16.1 (SD = .71) on the CORE-OM at pre-intervention to 14.1 (SD = .76) post-intervention. 13 out of the 21 participants reported a decrease in individual total CORE-OM scores and eight participants showed an increase in scores as shown in Figure 6.4.
Figure 6.4 CORE-OM Total Mean Scores
CORE-OM Total Mean Scores
Due to the small sample size, changes in total CORE-OM scores were analysed using the Reliable Change Index (RCI) for each participant. In order to ensure that changes in CORE-OM scores were not attributable to chance or measurement error a RCI was calculated for each participant using the Jacobson-Truax (1991) method. In accordance with this method, statistically reliable change was reflected by RCI values larger than 1.96. The clinical cut-off score indicating clinically meaningful improvement on
the CORE-OM is 10 (Connell et al., 2007). Participants were classified as “clinically meaningful improvement” (passed RCI criterion and CORE-OM score decreased to below cut-off score), “reliable improvement” (passed RCI criterion but the score did not decrease below CORE-OM cut-off score), uncertain change (did not pass RCI criterion) or deterioration (passed RCI criterion but symptom score increased). As outlined in Table 6.5, five participants reported reliable improvement (23.81%), three participants (14.29%) reported clinically significant improvement, two participants reported deterioration (9.52%) while eleven participants (52.38%) reported uncertain change.
Table 6.5 Results from Reliable Change Index (RCI) for the CORE-OM pre and post scores for each group member
Overall, the pattern suggests the group is most consistently associated with reliable symptom reduction for a subset of participants. For many the measurable change in global distress/functioning is not yet stable enough to attribute to the programme in a short timeframe. This is still consistent with the aims of the Temple Formulation Group, to build understanding, self-compassion and emotional awareness, which might necessitate more time to be processed for some individuals. There are two cases of deterioration as reported above. This might suggest the beginning of psychological processes and better insight into the mental health difficulties these individuals might be facing. Their internal experience might feel heavier in result of increased self-awareness and selfunderstanding at post-intervention. Moreover, the format of TFG which is not a therapeutic intervention, but rather a psychological programme aiming to increase self-awareness. For some, siting with formulation prompts could direct attention toward distress or connect dots between past traumatic experiences, that were previously pushed away or managed through distraction/avoidance. Consequently, increase in post-
scores could reflect the beginning of better insight into the intrapersonal difficulties of the participants.
Figure 6.6 CORE-OM Total Individual Scores
CORE-OM Individual Scores
Pre-intervention Post-intervention
Mean scores on the subjective wellbeing subscale decreased from 19.55 (SD = .99) at pre-intervention to 16.2 (SD = .86) at post-intervention.
Mean scores on the problems/symptoms domain decreased from 20.7 (SD = .84) at pre-intervention to 18.3 (SD = .88) at post-intervention. Mean scores on the functioning subscale decreased from 16.0 (SD = .72) at preintervention to 14.3 (SD = .88) at post-intervention. Mean scores on the risk/harm subscale decreased from 28.2 (SD = 4.25) at pre-intervention to 23.1 (SD = 3.84) at post-intervention.
Figure 6.7 CORE-OM Subscale Mean Scores
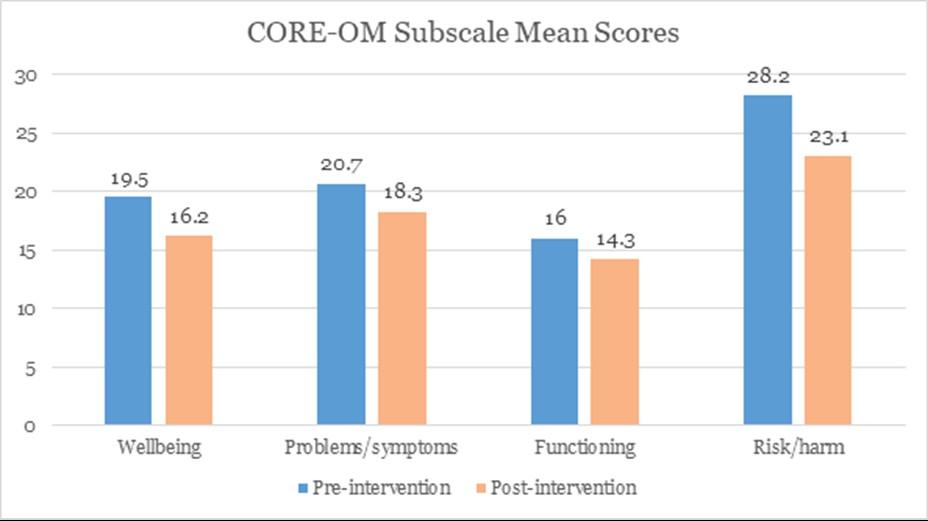
Mean scores on the FSCRS ‘inadequate self’ sub-scale decreased from pre (M = 24.78, SD = 6.71) to post-intervention (M = 20.71, SD = 8.87). A reduction in mean scores on the ‘hated self’ sub-scale was observed from pre (M = 7.52, SD = 5.69) to post-intervention (M = 5.86, SD = 4.87).
Mean scores on the ‘reassured self’ sub-scale increased from preintervention (M = 13.59, SD = 7.99) to post-intervention (M = 15.42, SD = 6.91).
6.8 FSCRS Mean Subscale Scores
As shown in Figure 6.9, individual scores on the FSCRS Inadequate Self subscale demonstrate that 14 out of 21 participants reported a decrease in scores on this subscale, one participant reported no change in scores and six participants reported slight increase in scores after completing the programme. This could be understood as a consequence of the psychological process that was deliberately activated and steered during the programme. As the programme encourages self-reflection rather than suppression, this could lead to activation of core beliefs and unmet needs for some participants, leading to higher scores post-intervention.
As shown in Figure 6.10, individual scores on the FSCRS Hated Self subscale demonstrate that 13 participants reported a decrease in scores on this subscale, two participants reported no change in scores and six participants reported slight increase in scores. This increase could reflect the start of psychological processes during the course of the programme.
6.10 FSCRS Hated Self Individual Scores
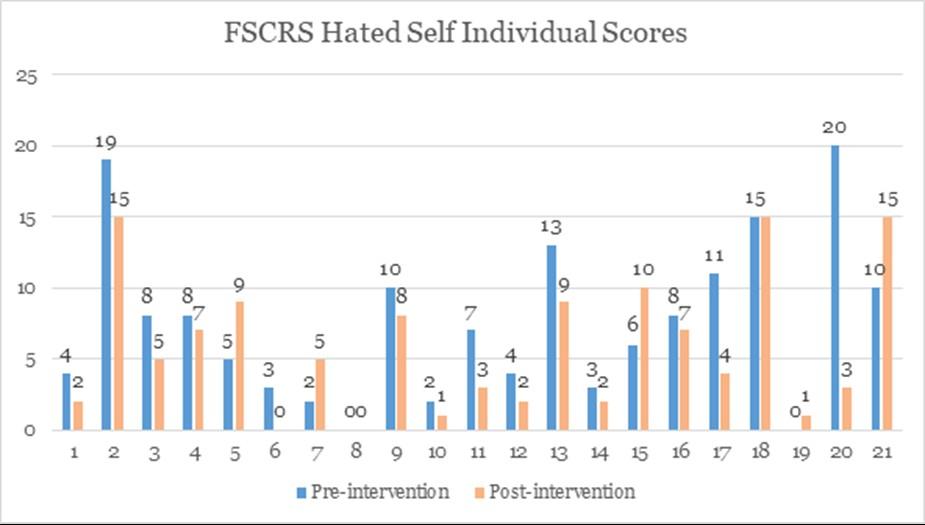
As shown in Figure 6.11, individual scores on the FSCRS Reassured Self subscale demonstrate that 11 participants reported an increase in scores on this subscale, one participant reported no change in scores and nine participants reported a decrease in scores.
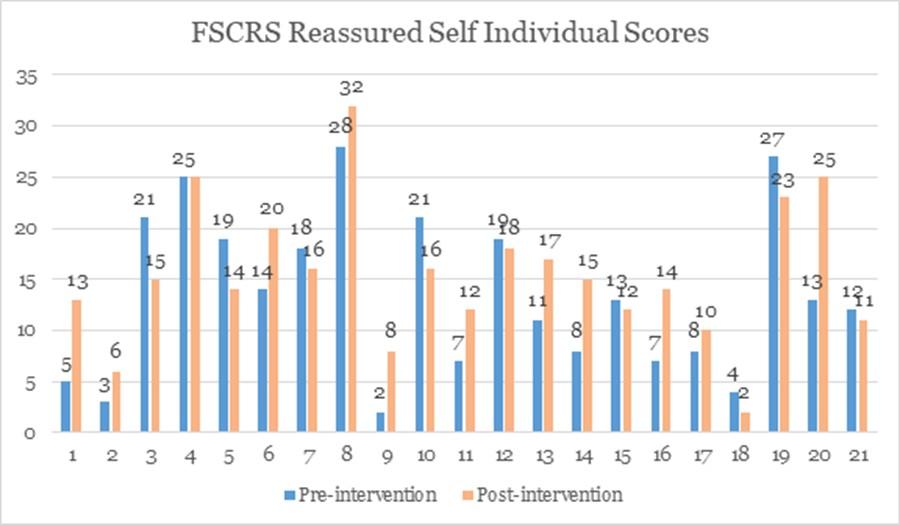
The Personal Mastery Scale (PMS)
Participants total scores decreased slightly from a mean of 17.35 (SD = .3.96) on the PMS at pre-intervention to 16.46 (SD = 4.06) postintervention. 11 out of the 21 participants reported a decrease in individual total PMS scores, two participants demonstrated no change in scores and eight participants showed an increase in scores as shown in Figure 6.13. The slight drop in scores of personal mastery postintervention might be explained by the loss of structure and containment when the programme ends. As mastery is a felt sense of being able to influence outcomes, endings might make some people feel less held, and that can manifest as lower PMS.
The Temple Formulation Group (TFG) is designed to support adults experiencing mental health difficulties, specifically those with co-occurring substance use or dual diagnosis. The programme completed its 22nd cycle in 2025. This section aims to report the outcomes of service users who completed the programme in 2025.
Overall, results from the Temple Formulation Group suggested improvements across general psychological distress and self-compassion. Given the small sample size, statistical significance was not tested, and outcomes are described using mean and individual change.
Participants’ psychological distress was generally reduced after completing the programme, with an average decrease pointing towards broad improvements: reduced distress, better wellbeing and functioning
and reduced risk indicators. Through formulation work individuals are encouraged to connect life experiences and understand their patterns of coping in difficult moments. The mixed individual pattern may reflect temporary increased emotional activation steered by these processes (Yang et al., 2020). Therefore, for some participants higher scores on distress may reflect increases in insight of their mental health struggles, coping strategies and triggers, rather than deterioration (Long et al, 2026). Moreover, completers of the programme reported reduction in selfcriticism and increase in self-reassurance. These outcomes fit with the goal of the TFG programme to increase the understanding of participants of their mental health struggles. Personal mastery decreased slightly with heterogeneity at the individual level. This drop may possibly reflect an adjustment period following programme completion and/or increased insight and recalibration of self-appraisal following regular self-reflection.
Schema therapy was designed to help individuals with complex and enduring mental health problems which stem from unmet attachment needs in childhood. Group Schema Therapy (GST) was developed to combine schema therapy with the benefits of group. GST is an evidencedbased treatment that has shown to be effective in reducing difficulties associated with depression, anxiety, eating disorders, substance misuse, emotional dysregulation, relationships poor self-image and improves psychosocial functioning (Farrell, Shaw & Webber, 2009; Fassbinder et al. 2016). GST has been shown to increase life satisfaction and reduce early maladaptive schemas (Altın & Alsancak-Akbulut, 2018).
Until August 2022, Group Schema therapy was delivered via 70 sessions over 18 months. However, informed by research the group was adapted to deliver a shorter intervention, known as Brief Group Schema Therapy, to enhance its accessibility and practicality for service users. Brief Group Schema Therapy (BGST) is a 20-session closed group experiential intervention designed for individuals with chronic, complex or entrenched
problems related to attachment and relational trauma (and who may have attracted a diagnosis of “personality disorder”). The group is suitable for individuals who have had longstanding difficulties relating in a healthy manner to self and/or others and who can recognise their own role in schema perpetuation. The goal of BGST is for the individual to develop a ‘felt sense’ of schemas and modes and to experience ‘good enough’ reparenting by the group facilitators or group ‘family’. It combines both experiential change techniques drawn from schema therapy (i.e. Imagery Rescripting; Chairwork; roleplays) and interpersonal group processes (e.g. Yalom & Leczcz, 2005) to help individuals gain insight into and ultimately transform maladaptive intra-and interpersonal patterns that underlie mental health symptomatology. BGST focuses on beginning the process of change in relation to healing painful emotions from childhood trauma, developing the Healthy Adult and improving current relationship functioning.
13 participants completed the Schema programme in 2025. Pre and post outcome data on all measures were available for all 13 participants, representing 100% complete response rate. 85% of the participants were female (11) and 15% of the participants were male (2).
Missing Value Analysis (MVA) was carried out to examine the type of missingness within the data. Where data was found to be Missing Completely at Random by Little’s Test (Cheng & Evanston, 2013), the Expectation Maximisation method was applied before any total scores were computed or analyses carried out.
Since the 2023 Outcomes Report, outcome measures used within the GST programme have been updated. This change was made to reduce respondent burden on service users completing the measures as the 318
previous measures included lengthy questionnaires which take an extended time to complete.
In 2023 the following measures were used in the Outcomes Report:
Schema Mode Inventory (SMI; Young et al., 2006)
The Symptom Checklist Revised -90 (SCL-90-R)
Young Schema Questionnaire (YSQ-L3; Young et al., 2006)
Quality of Life (WHOQOL Group, 1998)
In November 2024, two measures were substituted, and one was removed to reduce respondent burden: The WHOQOL was removed; the YSQ-R replaced the YSQ-L3, and the BSI-53 replaced the SCL-90.
As of November 2024, and carried forward into the 2025 report, the following outcome measures were adopted:
Schema Mode Inventory (SMI; Young et al., 2006)
Young Schema Questionnaire-Revised (YSQR; Yalcin et al., 2022)
Brief Symptom Inventory-53 (BSI; Derogatis & Melisarotos, 1983)
Below is a description of each of the 6 measures used across all of 2024 and 2025 for the Outcomes Report:
Schema Mode Inventory (SMI)
The Schema Mode Inventory (SMI; Young et al., 2006) is a 124-item selfreport measure to assess the presence of schema modes, which includes five child modes, five dysfunctional coping modes, two dysfunctional parent modes and the adaptive healthy adult mode. Respondents are asked to rate each statement from one to six (one = never or almost never to six = all of the time). Positive outcomes include a reduction in scores for all modes with the exception of the happy child and healthy adult modes, which are intended to increase over the course of the treatment. Lobbestael & van Vreeswijk (2010) reported acceptable internal consistency of the subscales (ranging from α = .79 to α = .96),
adequate test-retest reliability, and moderate construct validity in the article describing the measures development.
The SCL-90 (Derogatis, 1983) evaluates a broad range of psychological symptoms through a self-administrated questionnaire. It consists of 90 items, each rated on a 5-point Likert scale (0= not at all, 4= extremely) which indicate the individual’s perception of distress over the past week. Scores are combined in nine primary symptom dimensions Somatization, Obsessive-Compulsive, Interpersonal Sensitivity, Anger-Hostility, Depression, Anxiety, Paranoid ideation, Phobic Anxiety and Psychoticism. A subsequent Global Severity Index score is then calculated. The SCL-90-R has shown good internal consistency for all subscales (α=0.76-0.89) and excellent consistency for the global scale (α=0.97) (Ignatyev et al., 2016).
The YSQ (Young, 2003) assesses clients’ early maladaptive schemas, which are proposed to underlie a variety of mental health difficulties associated with personality disorders. 18 schemas are examined in total across 232 items. Each item is rated from one to six (one = completely untrue of me, six = describes me perfectly). Only items scored four or higher are included for total scores for each schema.
The WHOQOL-BREF (WHOQOL Group, 1993) is a 26-item instrument consisting of four domains relating to quality of life: physical health, psychological health, social relationships and environmental health. Scores range from one to five within each domain, relating to frequency and relatability of different items.
Young Schema Questionnaire-Revised (YSQ-R)
The Young Schema Questionnaire-Revised (YSQR; Yalcin et al., 2022) assesses clients’ early maladaptive schemas, which are proposed to underlie a variety of mental health difficulties associated with personality disorders. 20 schemas are examined in total across 116 items. Each item
is rated from one to six (one = completely untrue of me, six = describes me perfectly). Only items scored four or higher are included for total scores for each schema. Yalcin et al. (2022) reported good to excellent reliability (ranging from α = .74 to α = .86) for the subscales of the YSQ-R except for the enmeshment subscale (α = .57).
The Brief Symptom Inventory-53 (BSI; Derogatis, 1983) is a self-report measure designed to assess psychological distress and symptoms associated with a range of mental health disorders. The BSI consists of 53 items that assess nine symptom dimensions, such as depression, anxiety, and interpersonal sensitivity, as well as a global severity index. Each item is rated on a five-point scale (0 = not at all, 4 = extremely), reflecting the severity of the symptoms in the past week. The BSI allows clinicians to assess the severity of current psychological distress and track changes over time. Total scores for the symptom dimensions and the global index provide a comprehensive view of a client’s psychological wellbeing. Prinz et al. (2013) reported satisfactory internal consistency for the BSI-53 subscales (ranging from α = 0.67 to α = 0.96). Test-retest reliability was also reported to be satisfactory (ranging from α = 0.68 to α = 0.91).
4.25.3
Results were examined and compared in greater detail including overall mean, individual and programme cycle scores. Due to the small sample size, statistical analysis of the outcome measures was not possible. The small sample size reflects the specialist nature of the programme, which is delivered to a limited number of service users to meet specific therapeutic needs. The available data was further reduced due to cycle 8 and 9 being analysed separately, as they consisted of different outcome measures due to the changes made in 2024 and therefore could not be combined for pre- and post- intervention analyses. Cycle 8 ran from July 2024 to January 2025, while cycle 9 ran from March to September 2025. Results for each cycle are shown independently—Cycle 8 first, followed by Cycle 9. The only exception is the SMI, which appears once as it was used across both
cycles and incorporates data from each. Acceptable power was not achieved to reliably conduct statistical operations on the data. G*Power analysis indicated that in order to achieve sufficient statistical power, a sample size of 27 participants would have been required to detect a medium effect size (Cohen’s d=0.5).
Individual total scores for the YSQ, YSQ-R, WHOQOL, and SMI were not calculated, as aggregating multiple schema and quality-of-life domains into a single score would obscure clinically important distinctions between the separate domains. This approach would lead to a loss of nuance that is brought by illustrating the individual profiles through their respective subscale totals.
Schema Mode Inventory (SMI): Cycle 8 and Cycle 9.
Comparison of service user mean scores on the Schema Mode Inventory (SMI) subscales indicated improvements across levels of maladaptive schema modes with cross-cycle reductions in Vulnerable Child mode, Angry Child Mode, Enraged Child Mode, Impulsive Child Mode, Compliant Surrender Child Mode, Detached Protecter, Detached Self-Soother, Punitive Parent, Bully and Attack Mode and Demanding Parent. Small increases in mean scores for Undisciplined Child mode and SelfAggrandiser mode were observed from pre- to post-intervention. Both cycles demonstrated increases in Happy Child Mode and Healthy Adult mode. (See Figure 6.14).
Figure 6.14 Pre and Post Group Mean Scores of Schema Mode Inventory (SMI) subscales.
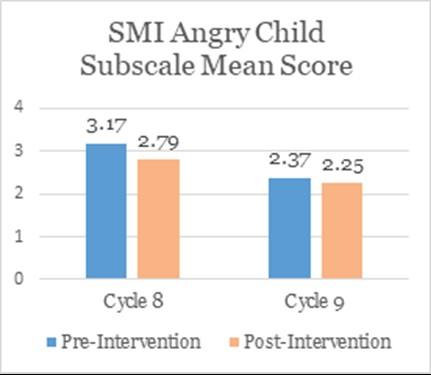
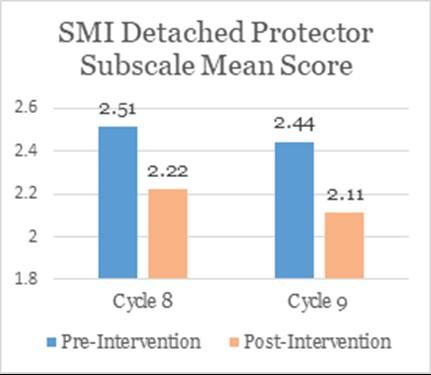
SMI Punative Parent Subscale Mean Score
SMI Healthy Adult Subscale Mean Score
Pre-Intervention Post-Intervention
Pre-Intervention Post-Intervention
Bully Attack Subscale Mean Score
SMI Detached Self-Soother Subscale Mean Score
SMI Demanding Parent Subscale Mean Score
SMI Compliant Surrender Child Subscale Mean Score
Th e
Pre-Intervention Post-Intervention
Symptom Checklist- 90: Cycle 8
Comparison of service user mean scores on the SCL-90 GSI indicated a decrease in scores from pre-intervention (M = 1.34; SD = 0.65) to postintervention (M = 0.96; SD = 0.40) (see Figure 6.15)
Figure 6.15 Pre and post-group mean scores for the Symptom Checklist-90 (SCL-90) Global Severity Index.
Due to the small sample size, changes in the SCL-90 Global Severity Index scores were analysed using the Reliable Change Index (RCI) for each participant. To ensure that changes in SCL-90 scores were not attributable to chance or measurement error a reliable change index (RCI) was calculated for each participant using the Jacobson-Truax method (1991). In accordance with this method, statistically reliable change was reflected by RCI values equal to or larger than 1.96. The cut-off score indicating clinically meaningful improvement on the SCL-90 GSI was 0.6. Participants
were classified as “clinically meaningful improvement” (passed RCI criterion and SCL-90 score decreased to below cut-off score), “reliable improvement” (passed RCI criterion but the score did not decrease below SCL-90 cut-off score), “uncertain change” (did not pass SCL-90 criterion) or deterioration (passed RCI criterion but symptom score increased).
Results for the reliable change index indicated that three participants (43%) reported clinically meaningful improvement, two participants (29%) reported reliable improvement, one participant (14%) reported uncertain change, and one participant (14%) reported reliable deterioration (see table 6.16).
Table 6.16 Results from Reliable Change Index (RCI) for the SCL-90 Global Severity Index pre and post scores for each group member
Further examination of the individual scores indicates that 6 out of 7 participants (86%) demonstrated a reduction in GSI scores from preintervention to post-intervention (see Figure 6.17).
Figure 6.17 Pre and post individual scores of the Symptom Checklist-90 (SCL-90) Global Severity Index scores.
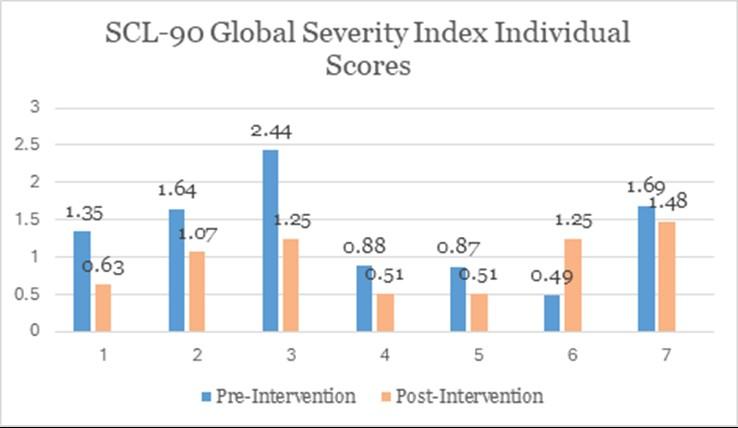
Reductions in mean scores were observed across eight of the nine SCL-90 subscales (Somatization, Obsessive–Compulsive, Interpersonal Sensitivity, Depression, Anxiety, Phobic Anxiety, Paranoid Ideation, and Psychoticism). In contrast, a slight increase was noted in the Hostility subscale, rising from pre-intervention (M = 0.81; SD = 0.74) to post-intervention (M = 0.89; SD = 0.52) (see Figure 6.18).
Figure 6.18 Pre- and post-group mean scores for the Symptom Checklist90 (SCL-90) total and subscale scores.
SCL-90R Anxiety Subscale
SCL-90R Phobic Anxiety Subscale
SCL-90R Hostility Subscale
SCL-90R Psychoticism Subscale
SCL-90R Paranoid Ideation Subscale
As mentioned in the Descriptives section above, individual total scores for the YSQ were not computed, as aggregating the scores across all schemas would conflate the distinct psychological constructs each subscale is designed to measure and overlook meaningful differences between specific schemas. Comparison of service users’ mean scores across the YSQ subscales showed an overall reduction from pre- to postintervention, with 17 of the 18 schema domains demonstrating
improvement (Abandonment, Social Isolation, Defectiveness, Vulnerability, Dependence, Punitiveness, Negativity, Emotional Inhibition, Failures, Enmeshment, Insufficient Self-Control, Subjugation, Self-Sacrifice, Emotional Deprivation, Mistrust/Abuse, Unrelenting Standards, and Approval-Seeking). The only exception was the Entitlement schema, which showed a slight increase from pre-intervention (M = 21.29, SD = 6.99) to post-intervention (M = 22.00, SD = 7.70) (see Figure 6.19).
Figure 6.19 Pre and Post Group Mean Scores of Young Schema Questionnaires (YSQ) subscales by Schema Domain.
YSQ Subscale Mean Scores: Disconnection and Rejection Domain
YSQ Subscale Mean Scores: Impaired Autonomy and Performance Domain
YSQ Subscale Mean Scores: Impaired Limits Domain
YSQ Subscale Mean Scores: Other-Directedness Domain
of Life (WHOQOL): Cycle 8
Comparison of service users’ WHOQOL domain scores indicated improvements in three of the four assessed quality-of-life areas. Physical Health, Psychological Health, and Environmental Health domains all showed positive change from pre- to post-intervention. In contrast, scores within the Social Relationships domain showed a moderate decline over the same period (see Figure 6.20).
Figure 6.20 Pre and Post Group Mean Scores of WHO Quality of Life (WHOQOL) subscales.
WHO Quality of Life (WHOQOL) Subscale Mean Scores
Brief Symptom Inventory (BSI): Cycle 9
Comparison of service user mean scores on the BSI GSI indicated a decrease in scores from pre-intervention (M = 0.29; SD = 0.20) to postintervention (M = 0.20; SD = 0.14). See figure 6.21.
Figure 6.21 Pre- and post-group mean scores for the Brief Symptom Inventory (BSI-53) Global Severity Index.
Due to the small sample size, changes in the BSI Global Severity Index scores were analysed using the Reliable Change Index (RCI) for each participant. To ensure that changes in BSI scores were not attributable to chance or measurement error a reliable change index (RCI) was calculated for each participant using the Jacobson-Truax method (1991). In accordance with this method, statistically reliable change was reflected by RCI values equal to or larger than 1.96. The cut-off score indicating clinically meaningful improvement on the BSI GSI was 0.2. Participants were classified as having a “clinically meaningful improvement” (passed RCI criterion and BSI GSI score decreased to below cut-off score), “reliable improvement” (passed RCI criterion but the score did not decrease below BSI GSI cut-off score), “uncertain change” (did not pass RCI criterion) or deterioration (passed RCI criterion but symptom score increased).
Results for the reliable change index indicated that five participants (83%) reported uncertain change while one participant (17%) reported reliable improvement (see table 6.22).
Table 6.22 Results from Reliable Change Index (RCI) for the BSI Global Severity Index pre and post scores for each group member
3 0.07 0.08 0.19
4
Uncertain change
5 0.43 0.33 -1.95 Uncertain Change
6 0.1 0.01 -1.75 Uncertain Change
Further examination of the individual scores indicates that all 6 participants (100%) demonstrated a reduction in GSI scores from preintervention to post-intervention (see Figure 6.23).
Figure 6.23 Pre and post individual scores of the Brief Symptom Inventory (BSI-53) Global Severity Index scores.
BSI-53 Global Severity Index Individual Scores Pre-Intervention
There were reductions in mean scores for eight out of nine of the BSI subscales (Somatization, Obsessive-Compulsive, Interpersonal Sensitivity, Depression, Anxiety, Phobic Anxiety, Paranoid Ideation, Psychoticism).
However, there was an increase in Hostility scores from pre-intervention (M = 0.43; SD = 0.23) to post-intervention (M =0.57; SD = 0.46) (see Figure 6.24).
Figure 6.24 Pre- and post-group mean scores for the Brief Symptom Inventory (BSI-53) subscale scores.
Somatization Subscale
BSI-53 Obsessive-Compulsive Subscale
Interpersonal Sensitivity Subscale
Depression Subscale
Anxiety Subscale
Hostility Subscale
BSI-53 PhobicAnxiety Subscale
BSI-53 Paranoid Ideation Subscale
Psychoticism Subscale
Young Schema Questionnaire – Revised (YSQ-R): Cycle 9
Comparison of service user mean scores on the various YSQ-R subscales indicated an overall decrease in scores from pre-intervention to postintervention with 18 out of the 20 schema domains reflecting this improvement (Abandonment, Emotional Deprivation, Defectiveness, Social Isolation, Dependence, Vulnerability to harm, Enmeshment, Failures, Subjugation, Self-Sacrifice, Approval Seeking, Negativity, Emotional Constriction, Fear of Losing Control, Unrelenting Standards, Insufficient Self-Control, Punitiveness (self) and Punitiveness (others)). However, there was an increase in the Entitlement subscale from pre-intervention (M =
12.33; SD =4.13) to post-intervention (M =13.00; SD = 4.60) and there was no change in Mistrust/Abuse from pre-intervention (M = 10.00; SD =4.47) to post-intervention (M = 10.00; SD = 4.24).
Figure 6.25 Pre and Post Group Mean Scores of Young Schema Questionnaire- Revised (YSQ-R) subscales by Schema Domain.
YSQ-R Subscale Mean Scores: Disconnection and Rejection
YSQ-R Subscale Mean Scores: Impaired Autonomy and Performance
YSQ-R Subscale Mean Scores: Impaired Limits
YSQ-R Subscale Mean Scores: Other-Directedness
YSQ-R Subscale Mean Scores: Overvigilance and Inhibition
Since the introduction of Brief Group Schema Therapy in 2022, four cycles have been facilitated. This report provides outcomes for two groups, cycle 8 and cycle 9, which were facilitated in 2025. While results must be interpreted with caution, due to the small sample size, findings showed an overall decrease in psychological symptom severity from pre- to postintervention (SCL-90; BSI-53) with the intervention having a positive impact on individuals’ quality of life (WHOQOL). Minor score increases were observed in the Hostility subscales (SCL-90; BSI-53). While speculative, and holding unresolved difficulties/frustration in mind, these scores may be temporarily elevated due to an increased awareness of early maladaptive schemas and childhood trauma. A decrease in activation was also observed across most schemas (i.e. Abandonment; Defectiveness) and modes (Detached; Compliant Surrender) from pre- to post- intervention. Minor increases were observed for the Entitlement schema and the Undisciplined Child and Self-Aggrandiser modes which may reflect increased honesty and self-awareness. However, the small sample size and the use of mean comparisons only limits any meaningful interpretations while acknowledging that minor score fluctuations may reflect normal variability rather than a meaningful clinical change.
It is also helpful to hold in mind that post-intervention measures are provided towards the end of group. The ending of group often involves increased activation of schemas & coping modes. Therefore, postintervention scores may reflect short-term activation rather than eventual reduction. Research indicates that progress often continues for up to six months to a year following group completion—provided individuals actively practice and apply the strategies learned. While caution is advised in interpreting the findings, they do illustrate that the group is meeting its clinical goals in increasing awareness of schemas and modes and supporting services users to begin the process of change.
5.1.1 Introduction
SPMHS is committed to listening to, and acting upon, the views of those who use and engage with its service. To enhance communication between service users and providers, the Service User Experience Survey was developed and is distributed to service users who accessed inpatient and Homecare services, attended Dean Clinics and who completed a day programme.
This report provides an overview of feedback from these surveys received between January and December 2025. The results of the Service User Experience Survey are collated every month with monthly overview reports reviewed by management as part of ongoing performance monitoring. Standards of performance are set for measures throughout the survey and failure to achieve defined average scores results in actions being apportioned to the appropriate staff. This approach is in keeping with continuous quality improvement.
5.1.2
The report is structured to reflect the design of the survey, whereby responses of each survey question are depicted in graph and/or table form. The inpatient survey was initially created based on the Picker Institute National Inpatient Survey for Mental Health Services in the UK. Subsequent adaptations were made to include topics which were identified as being important to service users (as identified by previous service user feedback and complaints) and to service providers (for example service users’ perception of stigma after receiving mental healthcare). The Dean Clinic and day programme surveys were subsequently adapted from the inpatient survey and tailored to collect data regarding the respective services.
One of the priorities of this project was that all service users would be made aware that participation was voluntary and anonymous. The data was collected using the online survey tool, Survey Monkey and descriptive graphs were created using Microsoft Excel.
5.1.3
In accordance with SPMHS’ aim to go paperless where possible, and to make it easy for service users to provide feedback, all service users with an email address on file receive an invitation to complete the survey online. Where service users have no email address on file, they receive a letter by post that indicates four options for how they can access the
survey. This includes the option to receive a printed version of the survey by post if required.
In 2025, Dean Clinic appointments were delivered face-to-face and remotely by technology-enabled care. Service User Experience Surveys were sent by email to service users attending Dean Clinic appointments remotely, with letters sent to service users who did not have an email informing them of how they could access the survey. Service users also sent responses via a QR code which was attached to Dean Clinic letters. Service users who attended appointments in person were given the Service User Experience Survey to complete onsite or to return by post. The survey received 358 responses in 2025, and the mode of collection was 152 by email, zero in paper format, one by QR code and one via the SPMHS website.
This is a considerable decrease from the 745 responses received in 2024. There was a decrease in all collection modes, and unusually no surveys in paper format were returned in 2025, which accounted for 11% of responses to this survey in 2024. A review of the collection modes and ways to in increase the service user experience response rates overall for 2026 will be completed.
5.2.1
The majority of Dean Clinic survey responses in 2025 were from females (60%, n=201), with 42% (n=162) of all respondents aged between 61 and 80 years of age and 71% (n=252) of all respondents living in Leinster. 58% (n=194) of respondents said they heard about the Dean Clinic while they were an inpatient.
Figure 5.1 Gender profile of Dean Clinic survey respondents in 2025
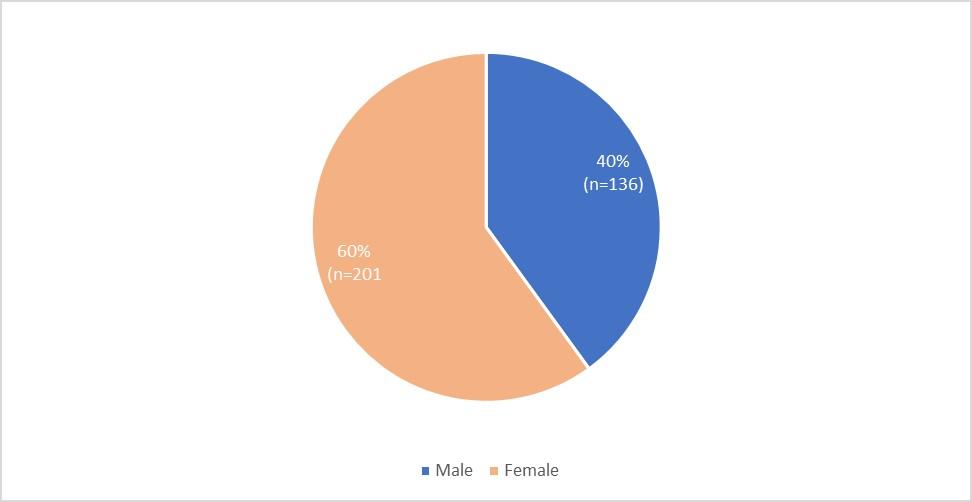
5.2 Age profile of Dean Clinic survey respondents in 2025
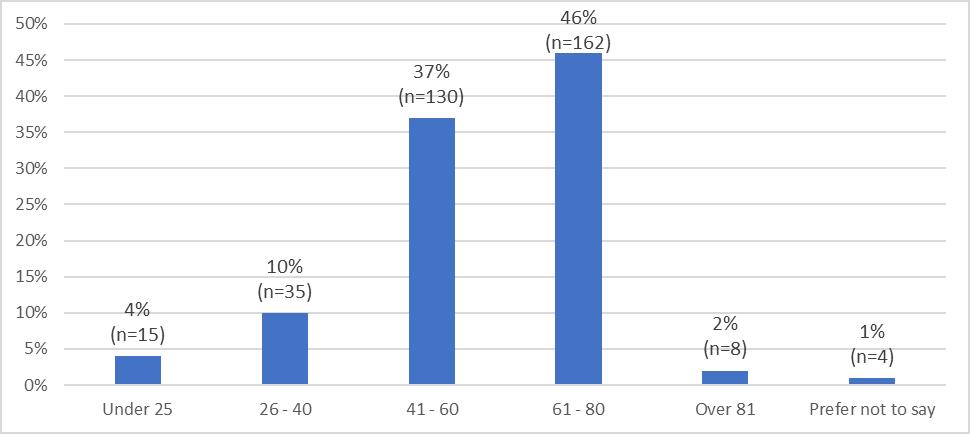
Figure 5.3 Location of Dean Clinic survey respondents in 2025
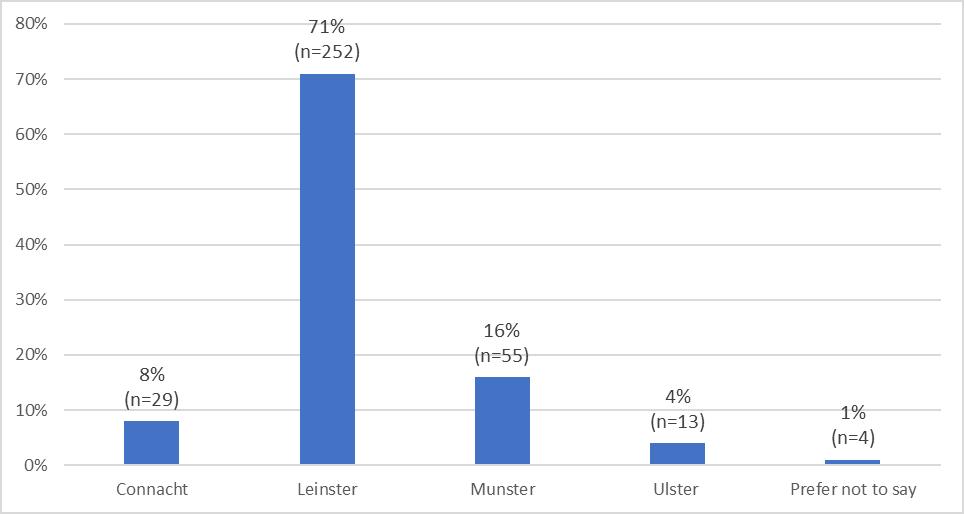
Figure 5.4 How respondents heard about Dean Clinic in 2025
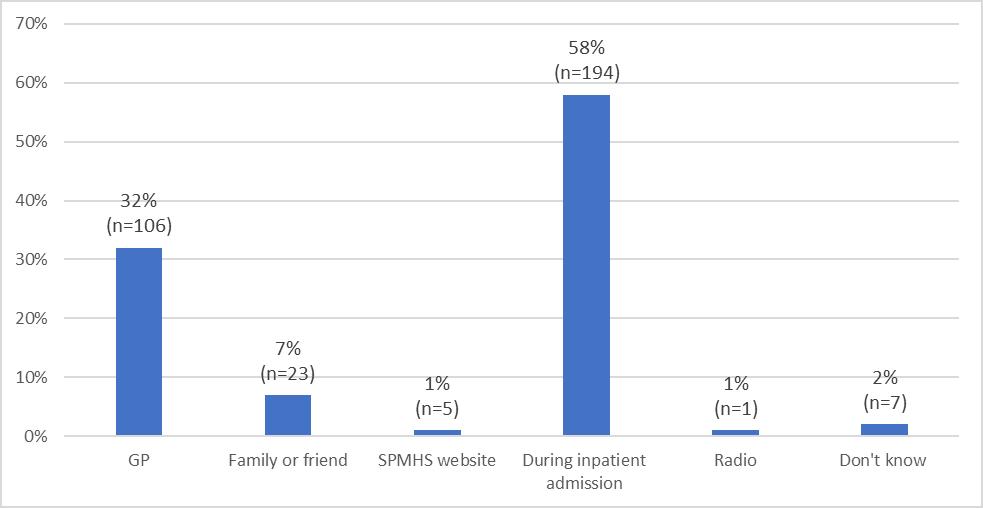
Figure 5.5 Dean Clinic survey respondents’ who said they had additional access and disability needs in 2025
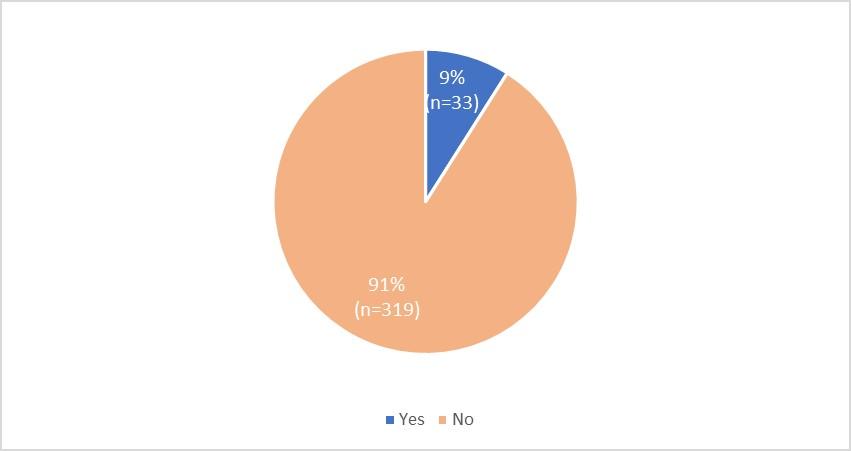
Table 5.6 Impact Dean Clinic survey respondents said these additional access and disability needs had on them while they were attending a Dean Clinic appointment, either in-person or remotely.
While you were attending you Dean Clinic appointment, either in-person or remotely, did you have any difficulties:
Figure 5.7 How respondents attended their most recent Dean Clinic appointment
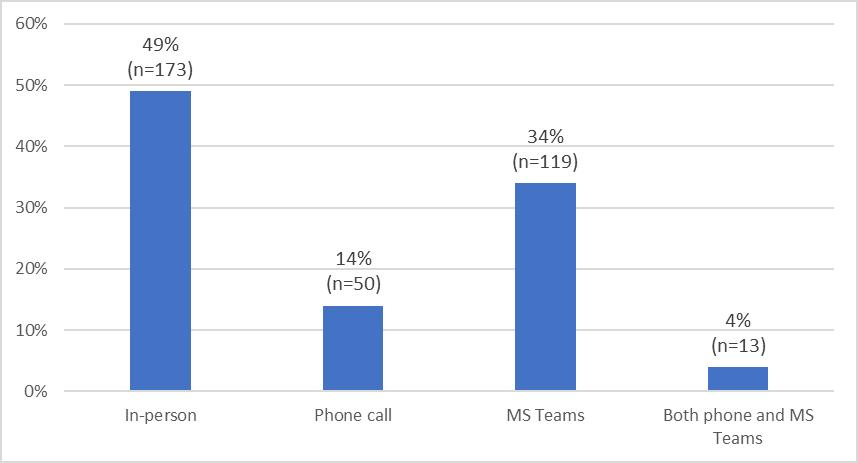
5.2.2 Dean Clinic in person appointment feedback
49% (n=173) of Dean Clinic survey respondents said they attended their appointments in person between January and December 2025. They were asked if they strongly agreed with, agreed with, neither agreed or disagreed with, or strongly disagreed with statements about their experience of the staff they encountered while attending their appointments.
Table 5.8 Dean Clinic survey respondents experience of attending in person appointments in 2025
Please tell us about your experience of attending the Dean Clinic
I
I
bathroom and waiting room
5.2.3
73% (n=264) of Dean Clinic survey respondents said they attended their appointments remotely between January and December 2025. They were asked if they ‘strongly agreed with’, ‘agreed with’, ‘neither agreed or disagreed with’, or ‘strongly disagreed with’ statements about their experience of accessing their Dean Clinic appointment remotely.
Table 5.9 Dean Clinic survey respondents experience of attending appointments remotely.
Please tell us about your experience of attending your Dean Clinic appointment remotely
It was clearly explained to me how to access my appointment by phone or MS Teams.
5.2.4 Devices used to attend Dean Clinic appointments remotely
The majority of Dean Clinic survey respondents used smartphones (44%, n=114), followed by laptops (31%, n=81) to access their appointments remotely. 9% (n=24) of respondents used a mobile phone without internet with a further 10% (n=26) who used tablets and 6% (n=15) using personal computer (PC) to access their appointment remotely in 2025.
Figure 5.10 Devices used by respondents to attend their most recent Dean Clinic appointment
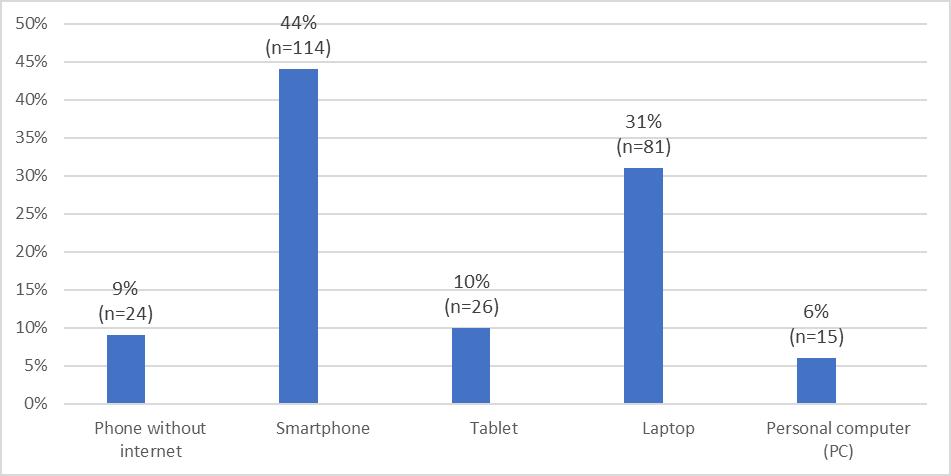
Figure 5.11 Dean Clinic respondents who contacted the SUITS service for IT support to access their remote appointment
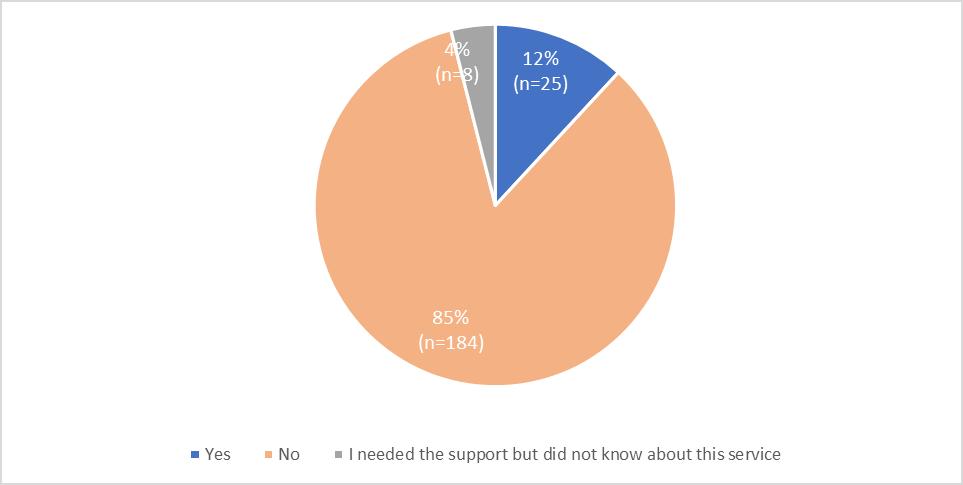
Table. 5.12 Dean Clinic survey respondents’ rating of experience of contacting the SUITS service in 2025
you did contact the SUITS service how would you rate the support they provided?
Of those who responded
22% (n=78) of Dean Clinic survey respondents who attended appointments remotely answered this question based on their experience of the SUITS service in 2025. This saw 92% (n=72) of respondents provide a rating of five out of 10 stars or higher. The average rating was 8.3 out of 10.
5.2.5 Experience of staff while attending Dean Clinic appointments
Table 5.13 Dean Clinic survey respondents experience of staff while attending appointments in 2025
Dean Clinic survey respondents were asked if they ‘strongly agreed with’, ‘agreed with’, ‘neither agreed or disagreed with’, or ‘strongly disagreed with’ statements about their experience of accessing their Dean Clinic appointment either in-person or remotely.
Tell us about your experience of your Dean Clinic appointment
I
my doctor or therapist or nurse
Members of my care team talked to me about 'Your Portal' and explained its benefits.
I
recommend the Dean Clinic to family and friends
Table 5.14 Compassion and empathy
Two new questions were added to our Service User Experience Surveys in 2025 to help us better understand respondents’ experience of the compassion and empathy provided by staff. Respondents to the Dean Clinic survey were asked if they strongly agreed with, agreed with, neither agreed or disagreed with, strongly disagreed with or disagreed with the following statements.
How much do you agree or disagree with each of the following statements?
SPMHS staff were compassionate. I felt they cared and understood me.
SPMHS staff were empathetic. I felt they understood my experiences and emotions.
Table 5.15 Respondents’ ratings of care and treatment and overall experience of SPMHS while attending Dean Clinic appointments in 2025
How would you rate…?
Table 5.16 Respondents’ ratings of care and treatment and overall experience of SPMHS while attending Dean Clinics appointments in 2025
How would you rate…?
Overall experience of SPMHS
The average rating between one and 10 of care and treatment from 334 respondents who attended Dean Clinic appointments in 2025 was 8.4 out of 10. The average rating between one and 10 of the overall experience of SPMHS from 340 respondents was 8.2 out of 10.
Service users discharged from inpatient and Homecare treatment between January and December 2025 were invited to complete either the inpatient Service User Experience Survey or the Homecare Service User Experience Survey.
Service users were provided with the option to complete the survey they felt was most relevant to the service they received for the majority of their care. It is necessary to provide service users with this option of surveys as it is not possible at present for the Service User Engagement Lead to determine if service users discharged have received only inpatient or Homecare services, or a combination of both.
154 responses were received to the inpatient Service User Experience Survey and 28 to the Homecare Service User Experience Survey. This is a total of 182 responses for this 12-month period.
The majority of respondents to the inpatient survey in 2025 were female (65%, n=98) with 44% (n=65) of all respondents aged between 41 and 60 years of age, and living in Leinster (70%, n=103).
Figure 5.17 Gender profile of inpatient survey respondents in 2025
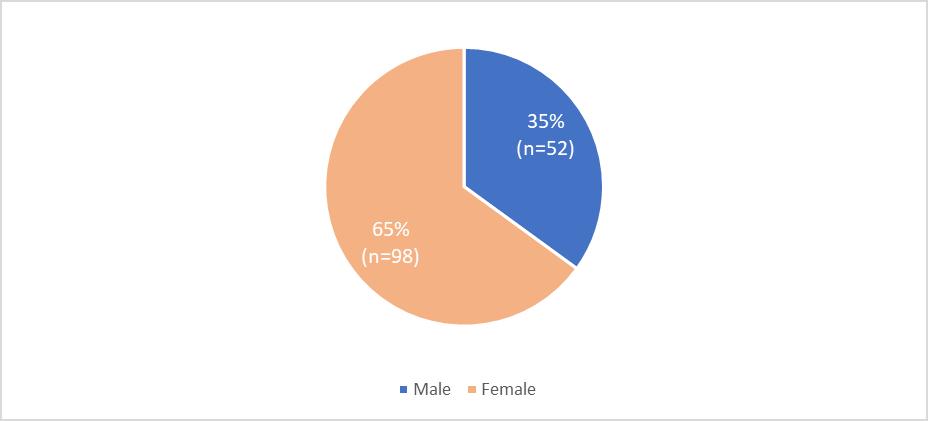
Figure 5.18 Age profile of inpatient survey respondents in 2025
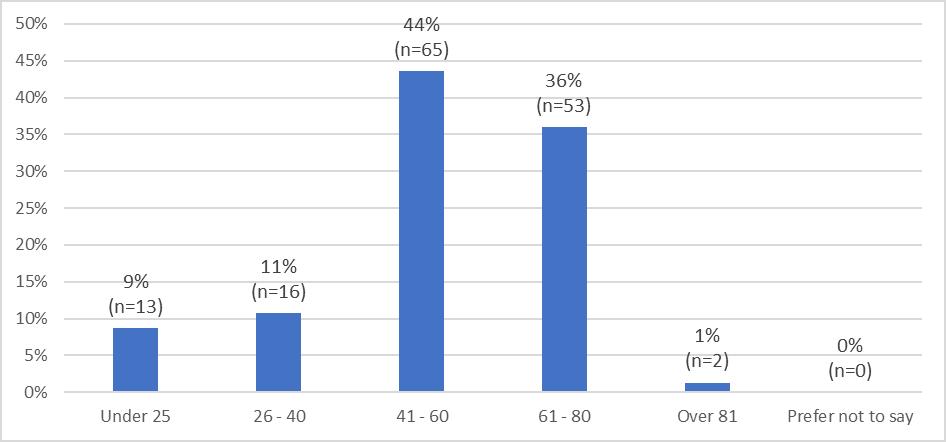
Figure 5.19 Location of inpatient survey respondents in 2025
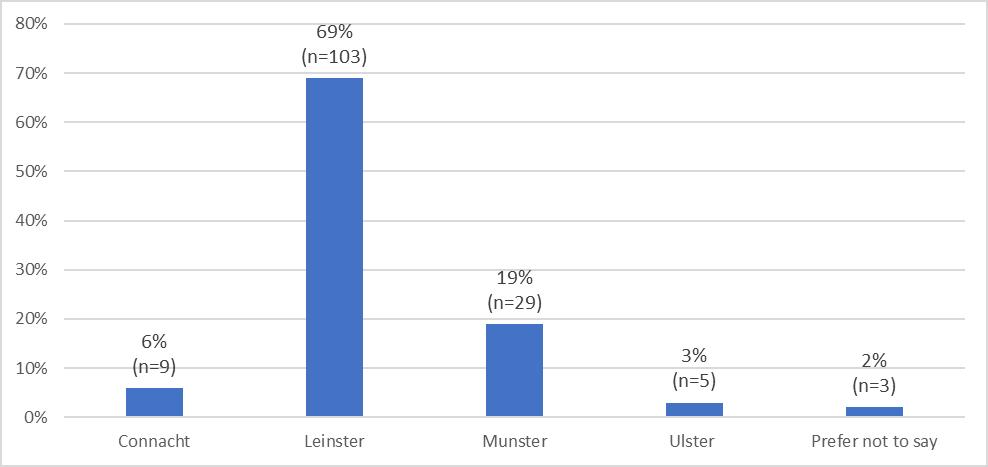
New questions were added to the inpatient Service User Experience Survey in 2025 to help us to better understand the different needs of our service users. The first of these additional questions asked survey respondents if they have any access or disability needs, including sensory needs. This saw 9% (n=14) of service users state that they have additional needs.
Figure 5.20 Inpatient survey respondents’ who said they had additional access and disability needs in 2025
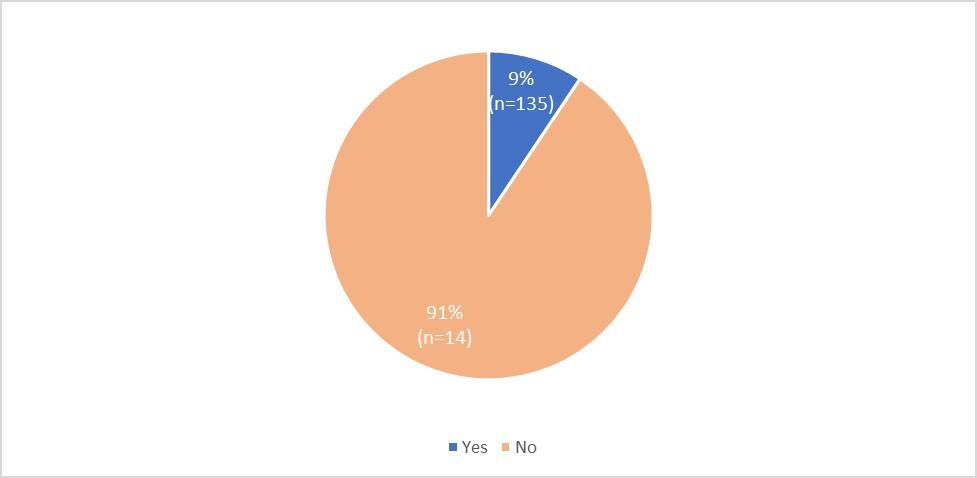
Table 5.21 Impact inpatient survey respondents said these additional access and disability needs had on them while they were an inpatient in 2025
While you were an inpatient did you have any difficulties:
Table 5.22 Respondents’ opinions regarding their experience of admission to hospital in 2025
Tell us about your experience of admission
The information I was given about inpatient treatment before I was admitted was helpful.
The admission process was explained to me by a member of staff
The ward routine, such as mealtimes and visiting arrangements, was explained to me by a member of staff
The activities available to me, and how to access them, was explained to me by a member of staff
Shortly after I was admitted, a member of staff explained how I would access appointments and activities remotely
care team talked to me about 'Your Portal' and explained its benefits.
I found inpatient activities easy to access
5.3.2.1 Accessing remote inpatient appointments and activities
38% (n=56) of respondents said they used a tablet provided by SPMHS to access remote appointments and activities while they were an inpatient in 2025.
Figure 5.23 Devices used by respondents to access remote appointments and activities during their inpatient admission
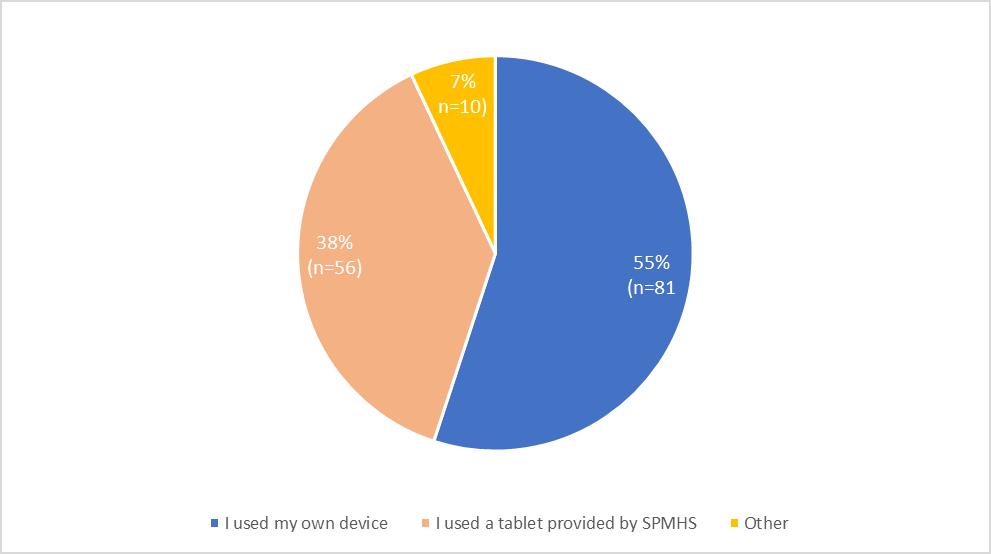
Survey respondents were asked if they needed technical support, and if they did, if they then contacted the Service User IT Support (SUITS) service.
Figure 5.24 Respondents who contacted the Service User IT Support
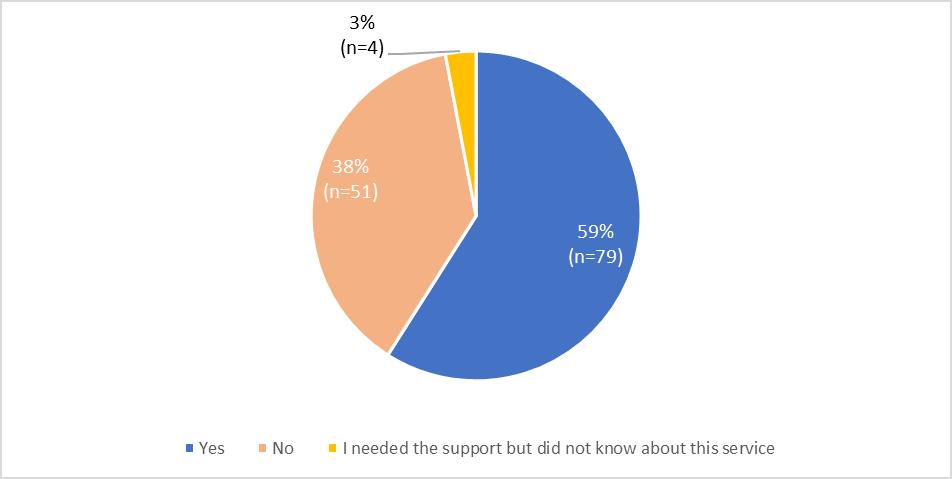
Inpatient survey respondents who contacted the SUITS service during their inpatient treatment were asked to rate their experience on a scale of 1 to 10, where 1 star is poor, and 10 stars is excellent.
91% (n=80) of respondents provided a rating of 5 stars or higher out of 10 for their experience of the SUITS service between January and December 2025. The average rating was 8.5 out of 10.
Table 5.25 Inpatient respondents’ rating of experience of contacting the SUITS service
If you did contact the SUITS service how would you rate the support
Respondents to the inpatient survey were asked to rate their experience of the staff who cared for them using the options of poor, good, excellent, or ‘not applicable’.
Table 5.26 Overall, what was your experience of hospital staff looked after you while you were an inpatient in St Patrick’s Hospital?
Table 5.27 Compassion and empathy
Two new questions were added to our Service User Experience Surveys in 2025 to help us better understand respondents’ experience of the
compassion and empathy provided by staff. Respondents to the inpatient experience survey were asked if they strongly agreed with, agreed with, neither agreed or disagreed with, strongly disagreed with or disagreed with the following statements.
How much do you agree or disagree with each of the following statements?
SPMHS staff were compassionate. I felt they cared and understood me.
SPMHS staff were empathetic. I felt they understood my experiences and emotions.
Table 5.28 Respondents’ overall experience while an inpatient in St Patrick’s Mental Health Services in 2025
Table 5.29 Respondents’ experiences of leaving the hospital in 2025
I
I
Following my admission, I am confident that I would know what to do in the event of a possible future mental health
To better understand respondents’ attitude towards mental health, respondents were asked if they strongly agreed with, agreed with, neither agreed or disagreed with, strongly disagreed with or disagreed with statements about their own perceptions when leaving hospital.
Table 5.30 Respondents’ attitudes towards mental health in 2025
I felt comfortable talking about my mental health prior to my inpatient admission
I
Table 5.31 Recommending SPMHS to others
I would recommend St Patrick’s Mental Health Services to others
Respondents to the inpatient survey are asked to rate on a scale of 1 to 10 their overall experience of the inpatient care and treatment they received while attending St Patrick's Hospital, where 1 star is poor, and 10 stars is excellent.
The average rating between one and 10 of care and treatment from 142 inpatient survey respondents was 7.8 out of 10. The average rating between one and 10 of the overall experience of SPMHS from 142 inpatient survey respondents was 7.7 out of 10.
Table 5.32 Inpatient respondents’ ratings of care and treatment and overall experience of hospital for inpatients in 2025
How would you rate…?
Table 5.33 Inpatient respondents’ ratings of care and treatment and overall experience of SPMHS in 2025 How would you rate…?
This section provides an overview of the feedback received from 28 respondents to the Homecare survey between January and December 2025.
5.4.1 Homecare survey respondent demographics
The majority of Homecare survey respondents in 2025 were female (68%, n=19), aged between 61 and 80 years (42%, n=10), and who live in Leinster (75%, n=21).
Figure 5.34 Gender profile of Homecare survey respondents in 2025
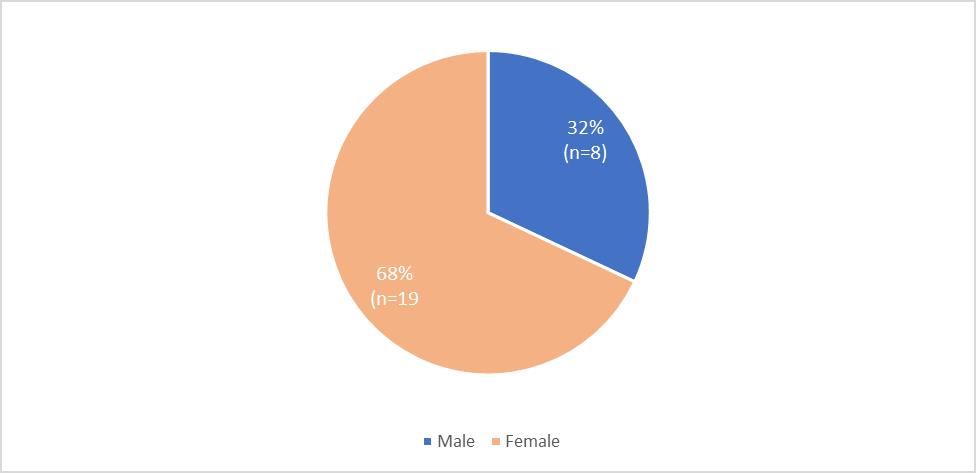
Figure 5.35 Age profile of Homecare survey respondents in 2025
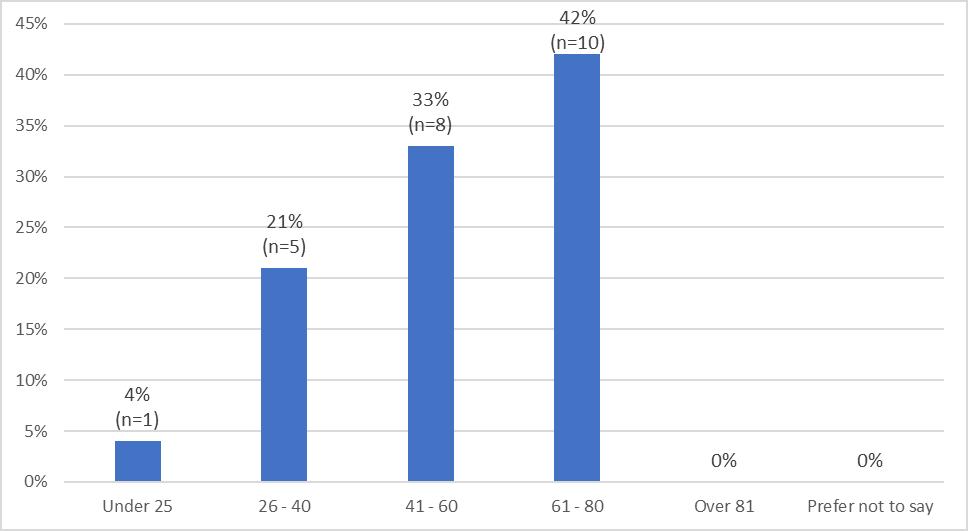
5. 36 Location of Homecare survey respondents in 2025
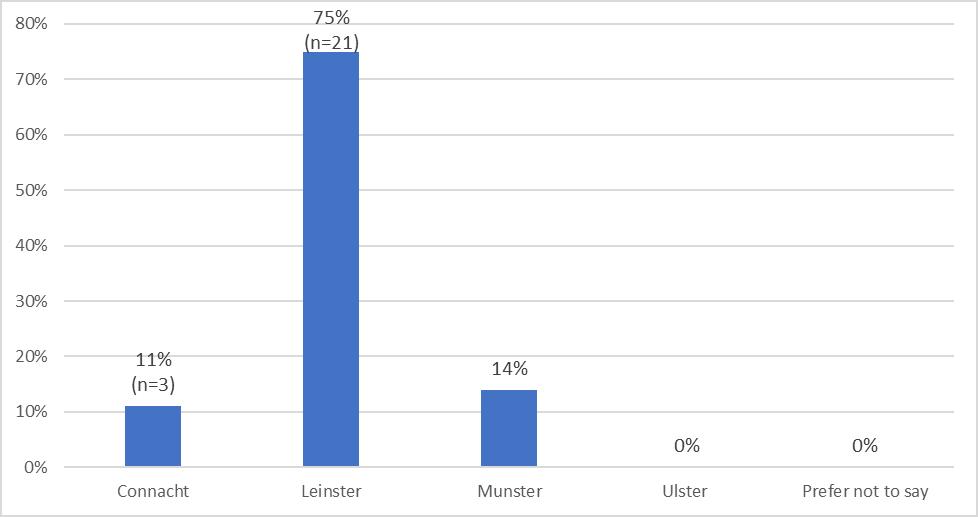
Respondents are asked to indicate if their admission was Homecare only or if they had also been admitted as an inpatient.
Figure 5. 37 Type of admission in 2025
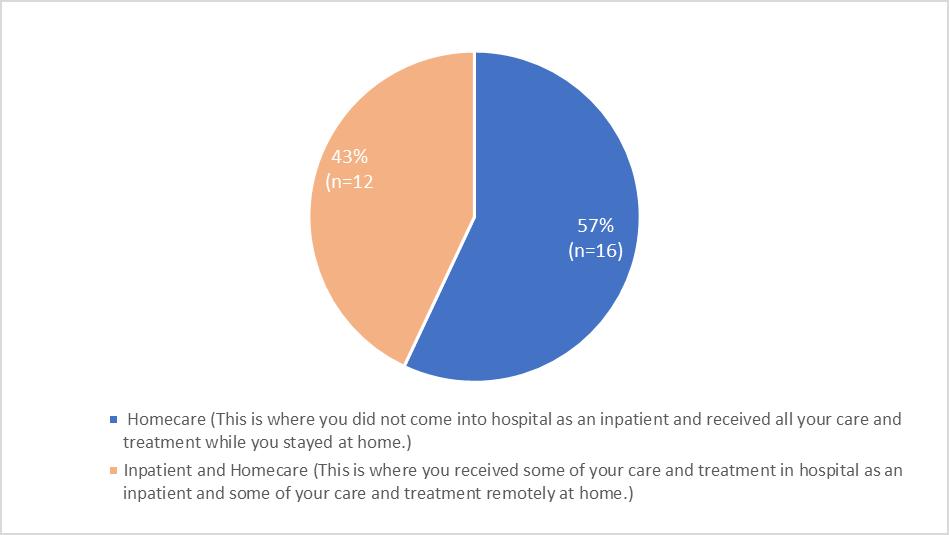
Figure 5.38 Homecare survey respondents’ who said they had additional access and disability needs in 2025
New questions were added to the Homecare Service User Experience Survey in 2025 to help us to better understand the different needs of our service users. The first of these additional questions asked survey respondents if they have any access or disability needs, including sensory needs. This saw 7% (n=2) of service users state that they have additional needs.
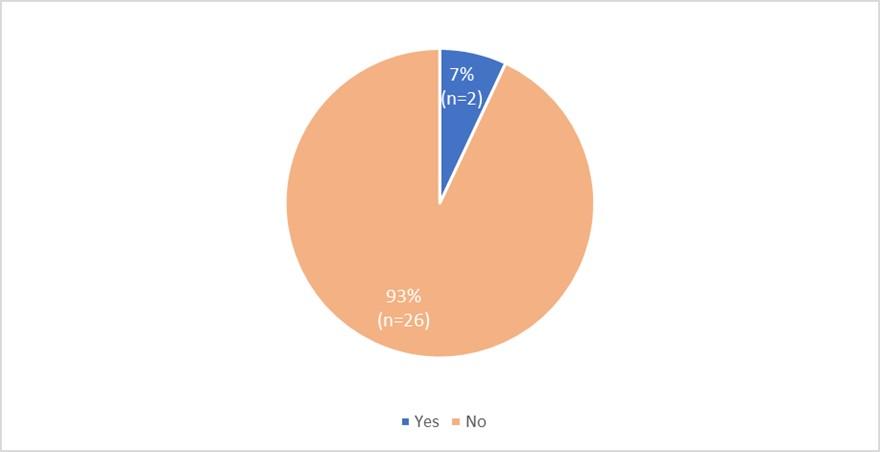
Table 5.39 Impact Homecare survey respondents said these additional access and disability needs had on while they were a homecare patient in 2025
While you were a Homecare patient did you have any difficulties:
5.4.2 How respondents accessed homecare services in 2025
Figure 5.40 How respondents accessed Homecare services in 2025
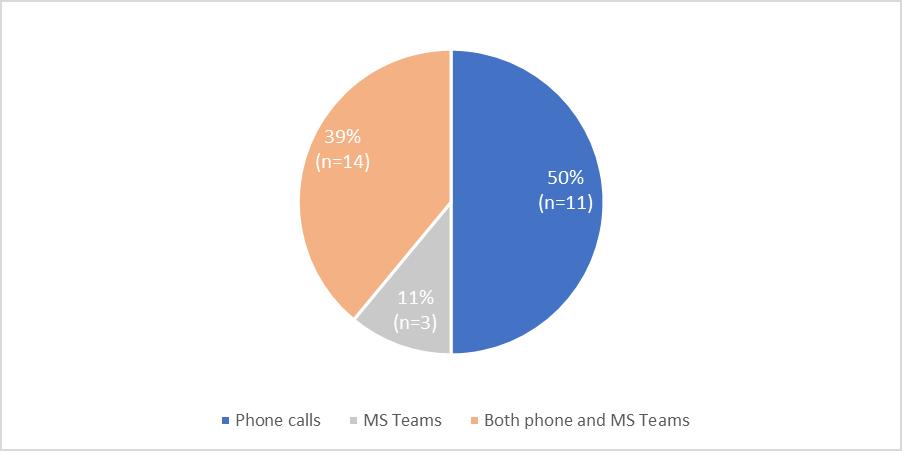
Figure 5.41 Type of devices used by respondents to access Homecare appointment and activities
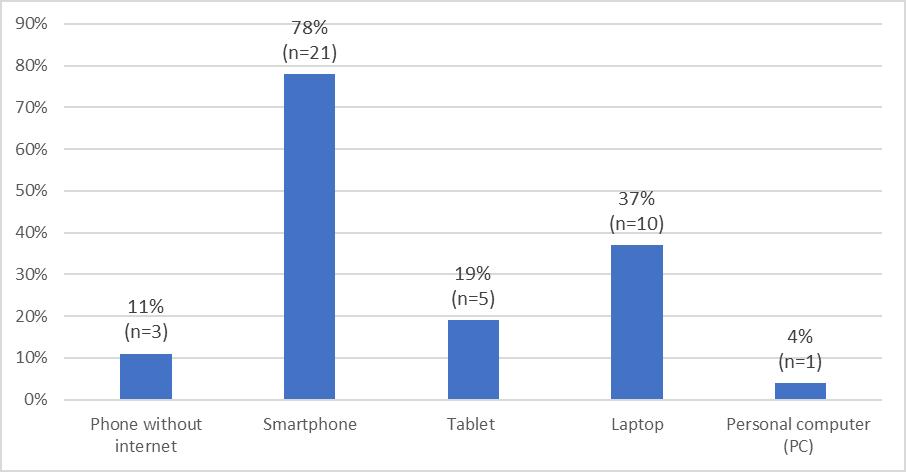
5.4.2.1 IT Support
Figure 5.42 Respondents who accessed the SUITS service to access Homecare appointments and activities in 2025
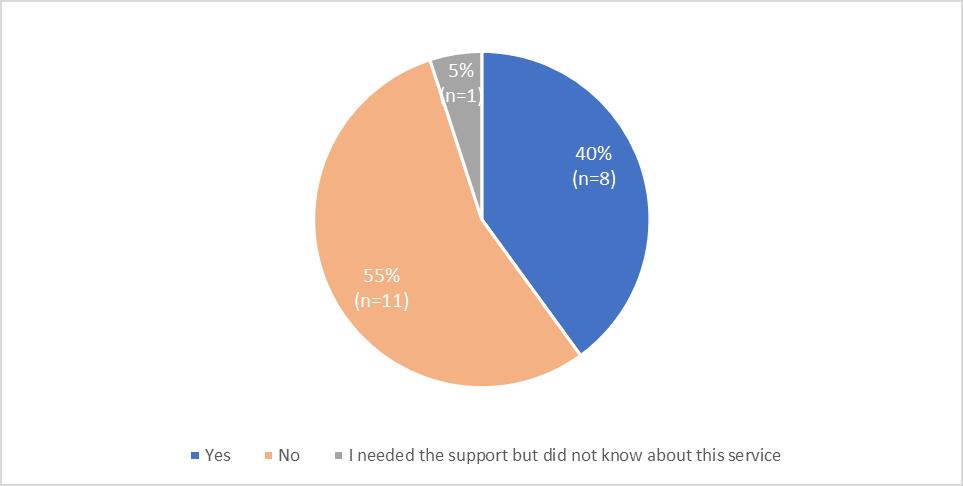
In 2025 40% (n=8) of respondents said they did contact SUITS. 55% (n=11) of Homecare survey respondents said they did not contact the SUITS service for IT support to access services. One respondent said they needed support but were unaware of this service.
Table 5.43 Homecare survey respondents’ rating of experience of contacting the SUITS service in 2025
If you did contact the SUITS service how would you rate the support they provided % Of those who responded
Table 5.44 Homecare survey respondents’ experience of beginning Homecare in 2025
Tell us about your experience of beginning Homecare
The information I was given about Homecare before starting was helpful.
How to access care and treatment while on Homecare was clearly explained
Table 5.45 Homecare survey respondents’ experience of the care provided by staff while on Homecare in 2025
Table 5.46 Compassion and empathy
Two new questions were added to our Service User Experience Surveys in 2025 to help us better understand respondents’ experience of the compassion and empathy provided by staff. Respondents to the Homecare survey were asked if they strongly agreed with, agreed with, neither agreed or disagreed with, strongly disagreed with or disagreed with the following statements.
How much do you agree or disagree with each of the following statements?
staff were compassionate. I felt they cared and understood me.
SPMHS staff were empathetic. I felt they understood my experiences and emotions.
Table 5.47 Homecare survey respondents’ experience of the following while on Homecare in 2025
calls from nursing staff
I
calls from my key worker
I felt any issues I had were understood by my team
I felt any issues I had were addressed by my team
Members of my care team talked to me about 'Your Portal' and explained its benefits.
Table 5.48 Homecare survey respondents’ experience of leaving Homecare in 2025
leave Homecare when I was discharged
Homecare admission, I feel confident that I would know what to do in the event of a possible further mental health crisis
I would consider the option of attending appointments with my SPMHS team by MS Teams or phone in the future
Table 5.49 Homecare survey respondents’ attitudes towards mental health in 2025
I felt comfortable talking about my mental health to friends and family prior to my Homecare admission
I would feel comfortable talking to family about my mental health following my Homecare admission
I would feel comfortable talking to friends about my mental health following my Homecare
admission I would feel comfortable talking to colleagues about my mental health following my Homecare admission
Table 5.50 Would respondents recommend St Patrick’s Mental Health Services to others
I would recommend St Patrick’s Mental Health Services to others
Respondents to the Homecare survey are asked to rate on a scale of 1 to 10 their overall experience of the care and treatment they received while on Homecare, where 1 star is poor, and 10 stars is excellent.
Table 5.51 Homecare respondents’ ratings of care and treatment and overall experience of SPMHS in 2025
How would you rate…?
Table 5.52 Homecare respondents’ ratings of care and treatment and overall experience of SPMHS in 2025
How would you rate…?
The average rating between one and 10 of care and treatment from 28 Homecare survey respondents was 8.0 out of 10. The average rating between one and 10 of the overall experience of SPMHS from 28 Homecare survey respondents was 8.0 out of 10.
SPMHS offers mental health programmes through the day service’s Wellness and Recovery Centre. A range of programmes are offered either in person at St Patricks University Hospital or remotely via MS Teams. The programmes aim to support people experiencing recovery from mental illhealth and promote positive mental health.
5.5.1
In 2025, 520 Day Programme service users were invited by email to complete the Day Programme Service User Experience Survey. A further 8 service users were invited by letter to complete this survey.
The Day Programme Service User Experience Survey received 63 responses in 2025. This is a decrease from the 96 responses received in 2024. Several day programmes invite participants to provide feedback by completing surveys that are programme specific and this may account for the low number of responses received to the Day Programmes Service User Experience Survey.
Table 5. 53 Day service programmes attended by survey respondents in 2025
5.5.2 Day programmes survey respondent demographics
The majority of day programme survey respondents in 2025 were female (60%, n=38) with 47% (n=29) of al respondents aged between 41 and 60 years of age and living in the Leinster region (84%, n=52). The majority of feedback (54%, n=34) was provided by respondents who attended the Access to Recovery programme.
Figure 5.54 Gender profile of day programme survey respondents in 2025
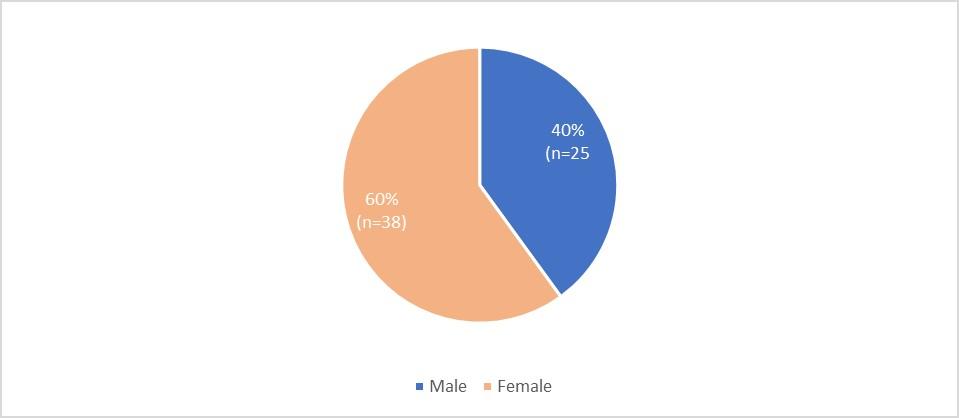
5.55 Age profile of day programme survey respondents in 2025
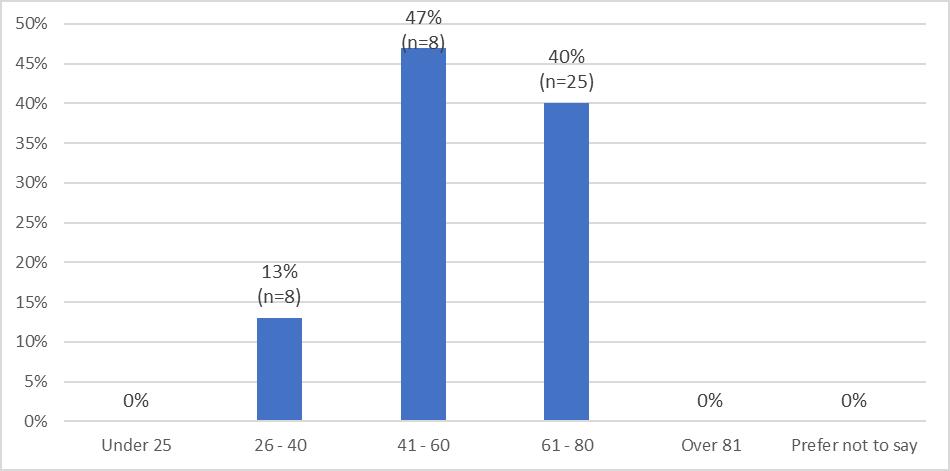
5.56 Location of day programme survey respondents in 2025
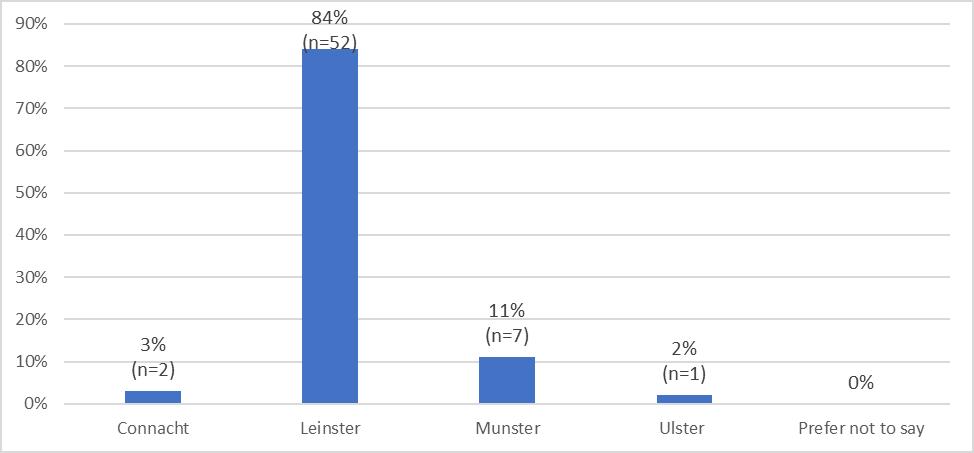
Figure 5.57 How day programme survey respondents attending programmes in 2025
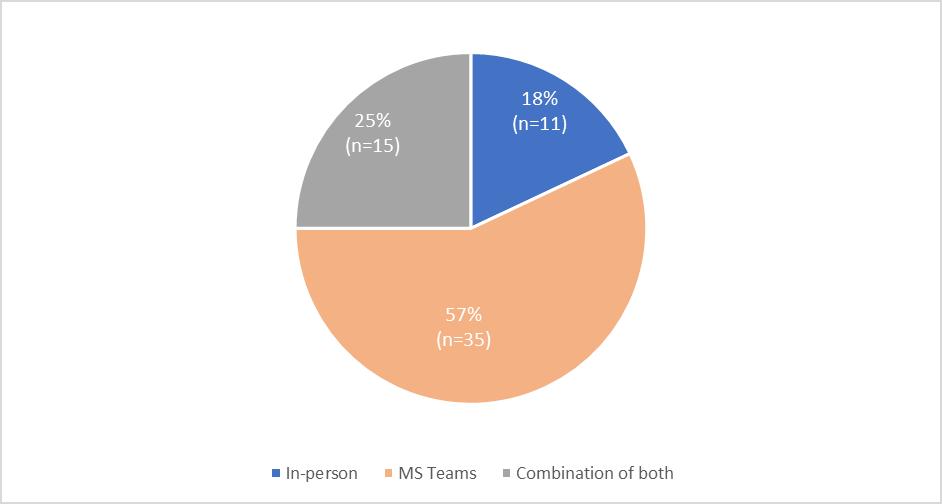
Figure 5.58 Devices used by day programme survey respondents to attend programmes remotely in 2025
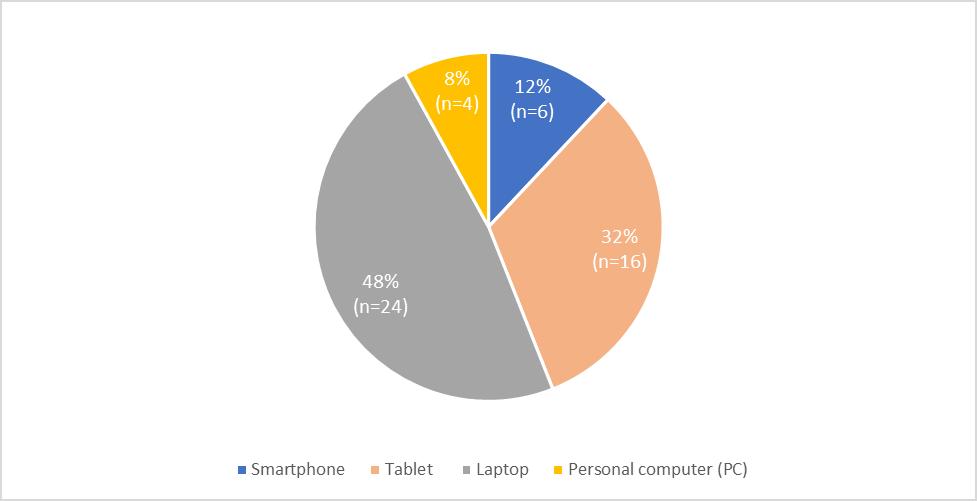
Figure 5.59 Day programme survey respondents who contacted SUITS for support to attend programmes remotely in 2025
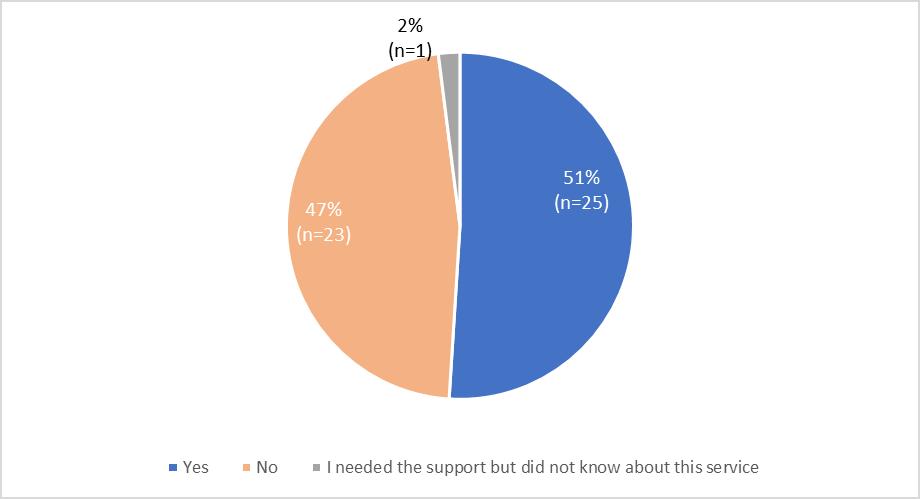
Table 5.60 Day programme survey respondents’ rating of experience of contacting the SUITS service in 2025
If you did contact the SUITS service, how would you rate the support they provided, % Of those who responded
New questions were added to the day programmes Service User Experience Survey in 2025 to help us to better understand the different needs of our service users. The first of these additional questions asked survey respondents if they have any access or disability needs, including sensory needs. This saw 5% (n=3) of service users state that they have additional needs.
Figure 5.61 Day programme survey respondents who said they had additional access and disability needs in 2025
Table 5.62 Impact that day programme survey respondents said these additional access and disability needs had on them while they were attending
While you were attending your day programme, either in-person or remotely, did you have any difficulties:
Getting around or using different facilities, for example bathrooms?
Day programme survey respondents who completed all or some of their programmes remotely were asked if they strongly agreed with, agreed with, neither agreed or disagreed with, or strongly disagreed with statements about their experience of beginning their day programme remotely.
Table 5.63 Day programme survey respondents’ experience of beginning day programmes remotely in 2025
Please tell us about your experience of remotely accessing our services:
Table 5.64 All day programme survey respondents’ experience of their day programme in 2025
Please tell us about your experience of remotely accessing our services:
The information I was given about my day programme before starting was helpful
A member of staff explained clearly what would be happening in the programme
A member of staff explained the timetable to me when I
agree
of my programme team were courteous and respected me as an individual
and easy
understand
Members of my programme team talked to me about 'Your Portal' and explained its benefits.
Table 5.65 All day programme survey respondents’ experience of finishing day programmes in 2025
Please tell us about your experience of remotely accessing our services:
agree
I knew in advance when the programme was due to finish
The programme met all of my expectations
Having completed my programme, I am confident that I would know what to do in the event of a possible future mental health crisis
Table 5.66 Compassion and empathy
Two new questions were added to our Service User Experience Surveys in 2025 to help us better understand respondents’ experience of the compassion and empathy provided by staff. Respondents to the day programme survey were asked if they strongly agreed with, agreed with, neither agreed or disagreed with, strongly disagreed with or disagreed with the following statements.
How much do you agree or disagree with each of the following statements?
SPMHS staff were compassionate. I felt they cared and understood me.
SPMHS staff were empathetic. I felt they understood my experiences and emotions.
Respondents to the day programme survey were asked if they strongly agreed with, agreed with, neither agreed or disagreed with, or strongly disagreed with statements about their attitudes towards mental health after completing their programme.
Table 5.67 Day programme survey respondents’ attitudes towards mental health having completed day programmes in 2025
Please tell us about your experience of remotely accessing our services:
I
I
feel comfortable talking to family about my mental health
about my mental health having completed this day programme
Table 5.68 Recommending SPMHS to others
I would recommend St Patrick’s Mental Health Services to others
Table 5.69 Respondents’ ratings of care and treatment and overall experience of SPMHS while attending day programmes in 2025
Table 5.70 Respondents’ ratings of care and treatment and overall experience of SPMHS while attending day programmes in 2025
How would you rate…?
The average rating between one and 10 of care and treatment from 61respondents who completed day programmes was 9.3 out of 10. The average rating between one and 10 of overall experience of SPMHS from 59 respondents who completed day programmes was 9.2 out of 10.
5.6.1
Willow Grove Adolescent Unit (WGAU) of SPMHS (previously described in this document). The unit provides inpatient and Homecare treatment for young people between the ages of 12 and 17 years who are experiencing mental health difficulties. It also has an associated outpatient Dean Clinic located in St Patricks University Hospital, Dublin, which offers assessment and treatment services for adolescents. The MDT are committed to ongoing quality improvement. This report presents the responses from the WGAU Service User Experience Surveys were received between January and December 2025.
5.6.2
WGAU is part of the Quality Network of Inpatient Child and Adolescent Mental Health Services (QNIC), a group of similar units which conduct yearly peer review cycles. The Network is co-ordinated by the Royal
College of Psychiatrists in the United Kingdom and every two years their standards are reviewed and updated in line with best practice. The satisfaction survey used is an adapted version of a standard Child and Adolescent Mental Health Service (CAMHS) inpatient satisfaction questionnaire, taken from the COSI-CAPs study, recommended by QNIC.
5.6.3
Young people and their parents are invited to complete paper versions of the WGAU inpatient Service User Satisfaction Survey at the point of discharge. Young people and their parents/carers who were discharged from a Homecare are invited to complete the survey by email.
In 2025, 27 young people and 35 parents/carers completed the inpatient survey. The number of inpatient surveys returned by young people in 2025 increased by 17% and the number of surveys completed by parents/carers decreased by -39% when compared with 2024, where responses were provided from 23 young people and 57 parents/carers. The WGAU Homecare survey was completed by six young people and nine parents/carers in 2025. The number of Homecare surveys returned by young people in 2025 decreased by -14% and the number of surveys completed by parents/carers decreased by -55% when compared with 2024, where responses were provided from seven young people and 20 parents/carers.
5.6.4
In 2025 the WGAU satisfaction surveys for young people and their parents/guardians were replaced with a new Service User Experience Survey. The format follows the same format as the adult experience users. The questions are designed to gather information on experiences of access to services, the environment and facilities of the unit, the therapeutic services offered, the ability of the service to support young
people and parents to manage mental health difficulties, discharge preparation, professionalism of staff and confidentiality and rights.
5.6.5 Willow Grove Adolescent Unit Inpatient survey results
Table 5.71 Before you came to Willow Grove - young people
Thinking about what it was like while you were waiting to come to Willow Grove, tell us how much you agree or disagree with these statements.
was given about Willow Grove before coming was helpful.
I found the information about Willow Grove on the St Patrick's website was helpful.
Table 5. 72 Before your child came to Willow Grove – Parents
Thinking about what it was like while you were waiting for your child to come to Willow Grove, tell us how much you agree or disagree with these statements.
before my child was admitted was helpful.
I found the information about Willow Grove on the St Patrick's website was helpful.
Figure 5.73 Parents/guardians and young people were asked if they visited Willow Grove prior to admission
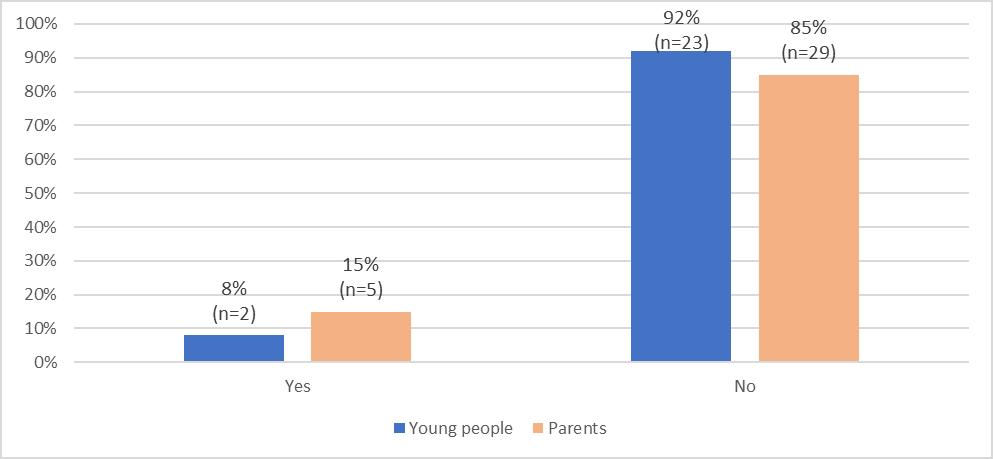
Figure 5.74 Inpatient survey respondents’ who said they had additional access and disability needs in 2025
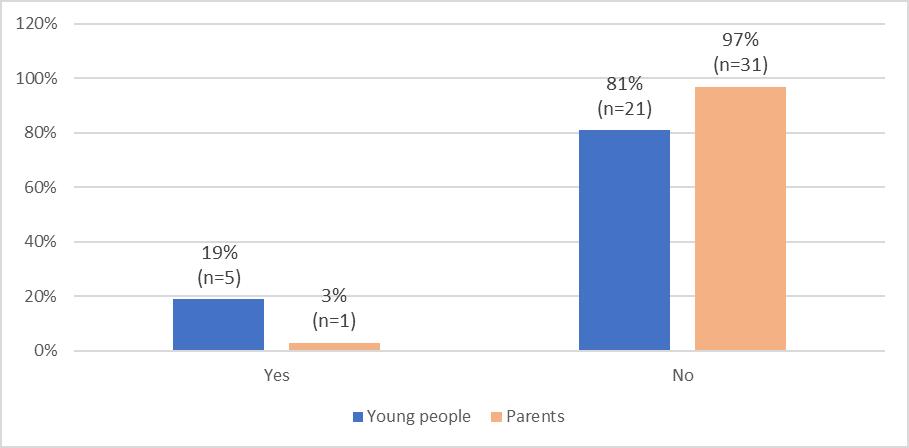
These questions were added to the experience surveys in 2025 to help us to understand the different needs of our service users. Both young people and their parents/guardians were asked if they have any access or disability needs, including sensory needs. This saw 19% (n=5) of young people and 3% (n=1) parent/guardian indicate that they had additional access needs.
Table 5.75 Impact young people said these additional access and disability needs had while they were an inpatient in 2025
While you were an inpatient did you have any difficulties:
Table 5.76 Young people’s opinions regarding their experience of admission to hospital in 2025
Please tell us about your experience of Willow Grove by selecting how much you agree or disagree with each of the following statements:
A member of staff explained to me what was happening when I was being admitted
A member of staff explained how things work, like mealtimes and visiting arrangements, shortly after I arrived.
There was a good range of things to do in Willow Grove.
Willow Grove is kept clean.
Table 5.77 Parents/guardians opinions regarding their experience of their child’s admission to hospital in 2025
Please tell us about your child's experience of Willow Grove by selecting how much you agree or disagree with the following statements:
A member of staff explained to me what was happening when my child was admitted
A member of staff explained how things work, like mealtimes and visiting arrangements, shortly after my child was admitted.
my child liked the food available.
There was always good food options for my child to choose from.
There was a good range of things for my child to do in Willow Grove.
I
overall atmosphere in Willow Grove was good.
It was easy to arrange to visit my child.
Weekend or midweek therapeutic leave was easy to arrange for my child.
I was able to access parking when visiting Willow Grove
Table 5.78 Young people’s opinions regarding their experience of the care and treatment while an inpatient in 2025
Tell us about your care and treatment in Willow Grove by selecting how much you agree or disagree with each statement:
I was happy with the care and treatment I received when I was in Willow Grove.
I had access to group therapy
I
I
my
I felt involved in decisions about my care and treatment
plan.
I was able to share feedback with my treatment team.
I felt my privacy was protected and well managed by Willow Grove staff.
Table 5.79 Parents/guardians opinions regarding their experience of their child’s care and treatment while an inpatient in 2025
Tell us about your child’s care and treatment in Willow Grove by selecting how much you agree or disagree with each statement:
I was happy with the care and treatment my child received when I was in Willow Grove.
My child had access to group therapy.
My child had access to individual therapy.
I
I felt involved in decisions about my child’s care and treatment
I was able to share feedback with members of child’s
my treatment team.
I felt my child’s privacy was protected and well managed by Willow Grove staff.
Respondents to the inpatient survey were asked to rate their experience of the staff who cared for them or their child using the options of poor, good, excellent, or ‘not applicable’.
Table 5.80 How would you rate the care and support you got from these members of staff while you were an inpatient?
Table 5.81 How would you rate the care and support your child got from these members of staff while they were an inpatient?
Two new questions were added to our Service User Experience Surveys in 2025 to help us better understand respondents’ experience of the compassion and empathy provided by staff. Respondents to the Willow Grove inpatient surveys were asked if they strongly agreed with, agreed with, neither agreed or disagreed with, strongly disagreed with or disagreed with the following statements.
Table 5.82 Young people’s experience of compassion and empathy while an inpatient in 2025
How much do you agree or disagree with each of the following statements?
I
Table 5.83 Parents/guardians experience of compassion and empathy while their child was an inpatient in 2025
How much do you agree or disagree with each of the following statements?
understood my child.
SPMHS staff were empathetic. I felt they understood my child’s experiences and emotions.
Table 5.84 What young people said they liked most about Willow Grove in 2025
How would you rate the following?
Table 5.85 What parents/guardians said they liked most about Willow Grove in 2025
How would you rate the following?
Table 5.86 Young people’s experiences of leaving the hospital in 2025
Tell us about your experience of leaving Willow Grove by selecting how much you agree or disagree with the following statements:
I felt prepared
go home when I was discharged
I feel confident that I now have the skills to manage my mental health in the event of a future mental health crisis.
service has been identified for my follow-up care.
Table 5.87 Parents/guardians experiences of when their child was leaving the hospital in 2025
Tell us about your experience of when your child was leaving Willow Grove by selecting how much you agree or disagree with the following statements:
prepared
I feel confident that my child now has the skills to manage my mental health in the
identified for my child’s follow-up care.
Table 5.88 Young people’s experiences of the information provided prior to beginning Homecare in 2025
Thinking about what it was like while you were waiting to begin Homecare, tell us how much you agree or disagree with these statements.
The information I was given about Homecare before starting was helpful.
I found the information about Willow Grove and Homecare on the St Patrick's website was helpful.
agree
Table 5.87 Parents/guardians experiences of the information provided prior to their child beginning Homecare in 2025
Thinking about what it was like while you were waiting for your child to begin Homecare, tell us how much you agree or disagree with these statements.
The information I was given about Homecare before my child was admitted was helpful.
I found the
information about Willow Grove and Homecare on the St Patrick's website was helpful.
Table 5.90 Young people’s opinions regarding their experience of their care and treatment while on Homecare in 2025
Please tell us about your care and treatment on Homecare by selecting how much you agree or disagree with each of the following statements:
I
feedback with my treatment team
I felt my privacy was protected and well managed by Willow Grove staff
Table 5.91 Parents/guardians opinions regarding their experience of the care and treatment their child received while on Homecare in 2025
Please tell us about the care and treatment our child received on Homecare by selecting how much you agree or disagree with each of the following statements:
A member of staff explained to me what was happening when my child was being admitted
I was happy with the care and treatment my child received while on Homecare
The information about my child’s care and treatment plan was helpful
I was happy with the amount of contact I had with my child’s
team
I felt involved in decisions about my child’s care and treatment plan
I was able to share feedback with my child’s treatment team
I felt my child’s privacy was protected and well managed by Willow Grove staff
Respondents to the inpatient survey were asked to rate their experience of the staff who cared for them or their child using the options of poor, good, excellent, or ‘not applicable’.
Table 5.92 How would you rate the care and support you got from these members of staff while on Homecare?
Table 5.93 How would you rate the care and support your child got from these members of staff while on Homecare?
Two new questions were added to our Service User Experience Surveys in 2025 to help us better understand respondents’ experience of the compassion and empathy provided by staff. Respondents to the Willow Grove Homecare surveys were asked if they strongly agreed with, agreed with, neither agreed or disagreed with, strongly disagreed with or disagreed with the following statements.
Table 5.94 Young people’s experience of compassion and empathy while on Homecare in 2025
How much do you agree or disagree with each of the following statements?
The staff in Willow Grove were compassionate. I felt they cared and understood me.
The staff were empathetic. I felt they understood my experiences and emotions.
Table 5.95 Parents/guardians experience of compassion and empathy while their child was on Homecare in 2025
How much do you agree or disagree with Strongly agree Agree
each of the following statements?
The staff in Willow Grove were compassionate. I felt they cared for and understood my child.
The staff were empathetic. I felt they understood my child’s experiences and emotions.
Tell us about your experience of leaving Homecare by selecting how much you agree or disagree with the following statements:
I attended a discharge planning meeting.
I felt prepared to leave Homecare when I was discharged.
I feel confident that I now have the skills to manage my mental health in the event of a future mental health crisis.
Table 5.97 Parents/guardians experiences of when their child was leaving Homecare in 2025
Tell us about your experience of when your child was leaving Homecare by selecting how much you agree or disagree with the following statements:
I attended a discharge planning meeting.
I felt my child was prepared to leave Homecare when they were discharged
I feel confident that my child now has the skills to manage my mental health in the event of a future mental health crisis.
A service has been identified for my child’s followup care.
5.7 Adolescent Dean Clinic
5.7.1 Surveys 2025
In 2025, Adolescent Dean Clinic appointments were delivered face-to-face and remotely by technology-enabled care. The Adolescent Dean Clinic gathers feedback from young people attending the service through the use of a Service User Experience survey. The format of this survey is the same as the version used by adult service users.
The survey is sent by email to the parents/carers of young people who had attended Adolescent Dean Clinic appointments inviting them to ask the young people to complete the survey. Access to the survey was also displayed in the Adolescent Dean Clinic where young people attending appointments could access the survey using a QR code. In 2025, this survey was completed by 14 young people. This is a significant decrease of -81% (n=78) received in 2024. This was due to the administrator taking extended leave.
The majority of the adolescent Dean Clinic survey responses in 2025 were from females (79%, n=11), aged between 15 and 17 years of age (70%, n=7) and who live in Munster (70%, n=7). 67% (n=6) of respondents said they heard about the Dean Clinic adolescent service from their General Practitioner (GP).
Figure 5.98 How respondents attended their most recent Adolescent Dean Clinic appointment
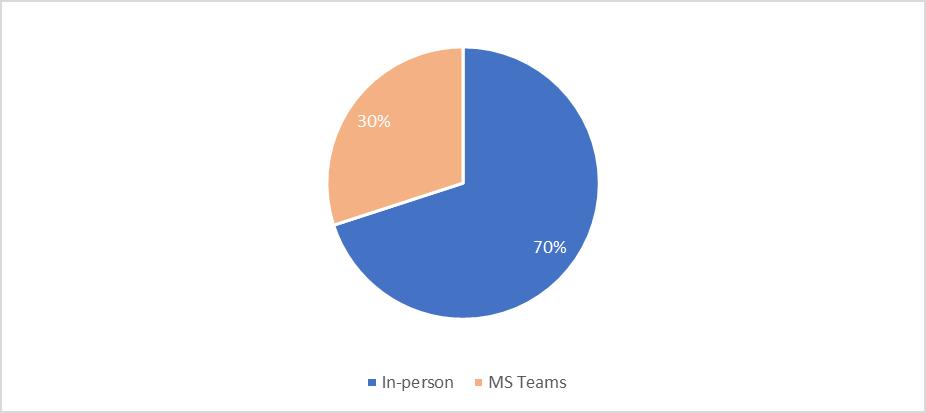
The majority of respondents (70%, n=7) attended their Adolescent Dean Clinic appointment in-person in 2025. 30% (n=3) said they attended their appointments by MS Teams.
The following section of this report details the feedback provided by 93% (n=13) of Adolescent Dean Clinic survey respondents who attended their appointments in person between January and December 2025.
Table 5.99 Dean Clinic adolescent survey respondents experience of attending appointment in person in 2025
Please tell us about your experience of attending the Adolescent Dean Clinic
The information I was given in advance of my appointment was helpful.
It was convenient for me to access the
I was welcomed in a friendly and professional manner by the Dean Clinic staff
I was shown where the facilities were in the Dean Clinic, such as the bathroom and waiting room.
The following section of this report details the feedback provided by 79% (n=11) of Adolescent Dean Clinic survey respondents who attended their appointments in person between January and December 2025.
Table 6.0 Dean Clinic adolescent survey respondents experience of attending appointment remotely in 2025
Please tell us about your
experience of attending the Dean Clinic remotely
It was convenient for me to access my appointment remotely.
It was clearly explained to me how to access my appointment remotely.
Attending my appointment remotely was a positive experience.
I would consider the option of attending Dean Clinic appointments remotely in the future.
Table 6.1 Respondents experience of staff during their Dean Clinic appointment in 2025
Tell us about your experience of your Adolescent Dean
Two new questions were added to our Service User Experience Surveys in 2025 to help us better understand respondents’ experience of the compassion and empathy provided by staff. Respondents to the adolescent Dean Clinic survey were asked if they strongly agreed with, agreed with, neither agreed or disagreed with, strongly disagreed with or disagreed with the following statements.
Table 6.2 Respondents experience of compassion and empathy while on attending their Dean Clinic appointment.
How much do you agree or disagree with each of the following statements?
SPMHS staff were compassionate. I felt they cared and understood me.
SPMHS staff were empathetic. I felt they understood my experiences and emotions.
5.7.6
Table 6.3 Respondents’ ratings of care and treatment and overall experience of SPMHS while attending Adolescent Dean Clinics appointment
How would you rate…?
Table 6.4 Respondents’ ratings of care and treatment and overall experience of SPMHS while attending Adolescent Dean Clinics appointment
The average rating between one and 10 of care and treatment from 10 respondents was 9.0 out of 10. The average rating between one and 10 of overall experience of SPMHS was also 9.0 out of 10.
1. The SPMHS fifteenth Outcomes Report builds on the previous reports. Service evaluation, outcome measurement, clinical audit and service user experience surveys are now being used routinely in the context of improving the quality-of-service delivery. The annual Outcomes Report provides valuable feedback to the staff who deliver the outcomes driven services within SPMHS. Recruitment and ongoing education/training is underpinned by a service user-centred philosophy and the attainment of positive outcomes. The skills, talents and commitment of staff are reflected in the positive outcomes within this report.
2. The Service User Experience Survey results indicate the service user experience of SPMHS services continued to be positive. The surveys
have helped SPMHS to identify and address any areas for improvement.
3. The clinical staff delivering the programmes and services continue to identify the appropriate validated clinical outcome measures and utilise them as a routine part of clinical service delivery. Clinical outcome measurement is a strongly established practice within SPMHS. Clinical staff continue to initiate and improve ways to expand and improve how outcomes are measured and utilised to maintain and improve services. The evidence-based services we deliver, and their outcome measures were updated with many further additions made to the list of references by several services and programmes. The increase in the number of clinical programmes utilising our secure service user electronic portal (Your Portal), to send clinical outcome measures for completion by consenting service users attending their clinical programme continued in 2025. The service users are able to complete the outcome measures via the secure portal, which are instantly accessible for review by the clinical staff delivering the programme of care.
4. The scope of audit across the organisation was further strengthened in 2025, consistent with the requirements of the Mental Health Commission’s Judgement Support Framework (2025). Clinical audit is utilised within SPMHS as part of robust clinical governance processes to deliver continuously improving services.
5. Strengths: SPMHS continues to provide a detailed insight into service accessibility, efficacy of clinical programmes and service user experience. Reporting this breadth of routinely collected clinical outcomes, demonstrates a willingness to constantly re-evaluate the efficacy of clinical programmes and services in an open and transparent way. A detailed service user experience survey encompassing all service delivery within SPMHS is well established,
reinforcing the organisation’s commitment for service user-centred care and treatment. In 2025, overall Service User Experience Survey response rates continued strong. The results presented in this annual outcomes report are reflective of the continued achievement of excellent levels of compliance on annual mental health commission inspection in 2025 across our three approved centres. The organisation delivers here a full and comprehensive outcomes report for 2025, demonstrating the commitment of all SPMHS staff to continuously measure and improve our services. In keeping with efforts to expand the number of services incorporated in this report, an additional two programmes were added to the Outcomes Report this year: The Temple Formulation Group and the Brief Group Schema Therapy Programme. The Dialectical Behavioural Therapy (DBT) Programme also introduced and reported on their new DBT Graduate Group for the first time in 2025. Technology-enabled care continues as an effective option for clinical service delivery and providing access and convenience to service users.
6. Challenges: We continue in our efforts to expand the number of services included within the SPMHS Outcomes Report, but as yet we do not have all areas of service delivery included. Efforts to benchmark the results of this report remain very difficult. The percentage of referrals accepted for treatment by SPMHS remains low. Work is onging to assess and address the reasons for this. In order to best capture the efficacy of clinical programmes and services, there have been changes in the outcome measures used, which can create difficulties when comparing results to previous reports. The report’s clinical outcome results cannot be solely attributed to the service or intervention being measured and are not developed to the standard of randomised control trials.
Altavilla, A., & Strudwick, A. (2022). Age Inclusive Compassion-Focused Therapy: a Pilot Group Evaluation. International Journal of Cognitive Therapy, 15(2), 209-230.
Anderson, A., & Rees, S. (2007). Group versus individual cognitivebehavioural treatment for obsessive-compulsive disorder: a controlled trial. Behaviour Research and Therapy, 45(1), 123-37.
Baer, A., Smith, T., Hopkins, J., Krietemeyer, J., & Toney, L. (2006). Using self-report assessment methods to explore facets of mindfulness.
Assessment, 13, 27-45.
Bandelow, B. (1995). Assessing the efficacy of treatments for panic disorder and agoraphobia: II. The Panic and Agoraphobia Scale. International Clinical Psychopharmacology, 10(2), 73-81.
Barkham et al., 2010 (2006 in list)
Barkham, M., Mellor-Clark, J., Connell, J., & Cahill, J. (2006). A core approach to practice-based evidence: A brief history of the origins and applications of the CORE-OM and CORE System. Counselling and Psychotherapy Research, 6(1), 3-15.
Beaumont P.J.V., Kopec-Schrader E.M., Talbot P., Toyouz S.W.: Measuring the specific psychopathology of eating disordered patients. Psychiatry, 27, 506–511, 1993.
Beck, J. S., Beck, A. T., & Jolly, J. B. (2001). Beck youth inventories of emotional and social impairment: Depression inventory for youth, anxiety inventory for youth, anger inventory for youth, disruptive behavior inventory for youth, self-concept inventory for youth: Manual. Psychological Corporation.
Bernstein, E., Putnam, W. (1986) Development, reliability and validity of a dissociation scale. J Nerv Ment Dis. 174:727–735.
Bilenberg, N. (2003). Health of the Nation Outcome Scales for Children and Adolescents (HoNOSCA): Results of a Danish field trial. European Child & Adolescent Psychiatry, 12, 298-302.
Biringer, E., & Tjoflåt, M. (2018). Validation of the 24-item recovery assessment scale-revised (RAS-R) in the Norwegian language and context: a multi-centre study. Health and quality of life outcomes, 16, 1-12.
Blackledge, J. T., & Barnes-Holmes, D. (2009). Core processes in acceptance and commitment therapy. In J. T. Blackledge, J. Ciarrochi, & F. P. Deane (Eds.), Acceptance and commitment therapy: Contemporary theory, research, and practice (pp. 41–58). Australian Academic Press.
Blanchard B., Jones-Alexander, J., Buckley, C., & Forneris, A. (1996). Psychometric properties of the PTSD Checklist (PCL). Behaviour research and therapy, 34(8), 669-673.
Bohlmeijer, E., ten Klooster, P. M., Fledderus, M., Veehof, M., & Baer, R. (2011). Five facet mindfulness questionnaire--short form. Mindfulness.
Bond, F. W., Hayes, S. C., Baer, R. A., Carpenter, K. M., Guenole, N., Orcutt, H. K., Waltz, T., & Zettle, R. D. (2011). Preliminary psychometric properties of the Acceptance and Action Questionnaire - II: A revised measure of psychological flexibility and experiential avoidance. Behaviour Therapy.
Booth, R., & Egan, R. (2023). Group radical openness: An intervention for overcontrol. Routledge.
Butler, A.C., Chapman, J.E., Forman, E.M., & Beck, A.T. (2006). The empirical status of cognitive-behavioural therapy: a review of metaanalyses. Clinical Psychology Review, 26(1), 17-31.
Carter, J. C., Stewart, D. A., & Fairburn, C. G. (2001). Eating disorder examination questionnaire: norms for young adolescent girls. Behaviour research and therapy, 39(5), 625-632.
Chadwick, P., Hember, M., Mead, S., Lilley, B., & Dagnan, D. (2005). Responding mindfully to unpleasant thoughts and images: Reliability and validity of the Mindfulness Questionnaire. Unpublished manuscript, 10.
Chorpita, B. F., Moffitt, C., & Gray, J. (2005). Psychometric properties of the Revised Child Anxiety and Depression Scale in a clinical sample. Behaviour Research and Therapy, 43, 309-322.
Cohen, J. (1988). Statistical power analysis for the behavioural sciences (2nd ed.) Hillsdale, NJ Erlbaum.
Collins, N. L. (1996). Revised adult attachment scale. Behavior Therapy.
Connor, K., Davidson, J., Churchill, L., Sherwood, A., Weisler, R., & Foa, E. (2000). Psychometric properties of the Social Phobia Inventory (SPIN): New self-rating scale. British Journal of Psychiatry, 176(4), 379-386. doi:10.1192/bjp.176.4.379.
Cooper, Z., Cooper, P. J., & Fairburn, C. G. (1989). The validity of the eating disorder examination and its subscales. The British Journal of Psychiatry, 154(6), 807-812.
Corrigan, P., Giffort D., Rashid, F., Leary, M., & Okeke, I. (1999). Recovery as a psychological construct. Community Mental Health Journal, 35(3), 231-239.
Corruble, E., Ginestet, D., & Guelfi, J. D. (1996). Comorbidity of personality disorders and unipolar major depression: a review. Journal of Affective Disorders, 37(2-3), 157-170.
Craig, C., Hiskey, S., & Spector, A. (2020). Compassion focused therapy: A systematic review of its effectiveness and acceptability in clinical populations. Expert review of neurotherapeutics, 20(4), 385-400.
Cuppage, J; Baird, K; Gibson, J; Booth, R; & Heavy (2017) Compassion focused therapy: Exploring the effectiveness with a transdiagnostic group and potential processes of change. British Journal of clinical psychology, 57(2).
Derogatis, L.R., & Fitzpatrick, M. (2004). The SCL-90-R, the Brief Symptom Inventory (BSI), and the BSI-18. In L.R. Derogatis, M.M. Fitzpatrick, & E. Mark (Ed). The use of psychological testing for treatment planning and outcomes assessment: Volume 3: Instruments for adults (3rd ed.), (pp. 141). Mahwah, NJ, US: Lawrence Erlbaum Associates Publishers.
Derogatis, L.R., & Melisaratos, N. (1983). The Brief Symptom Inventory: an introductory report. Psychological Medicine, 3, 595-605.
Donnelly, A., Fitzgerald, A., Shevin, M., & Dooley, B. (2019). Investigating the psychometric properties of the revised child anxiety and depression scale (RCADS) in a non-clinical sample of Irish adolescents. Journal of Mental Health, 28(4), 345-356.
Duncan, C., Cooper, M., & Saxon, D. (2023). Test-retest stability, convergent validity, and sensitivity to change for the Goal-Based Outcome tool for adolescents: Analysis of data from a randomized controlled trial. Journal of clinical psychology, 79(3), 683–696. https://doi.org/10.1002/jclp.23422
Edbrooke-Childs, J., Jacob, J., Law, D., Deighton, J., & Wolpert, M. (2015).
Interpreting standardized and idiographic outcome measures in CAMHS: what does change mean and how does it relate to functioning and experience? Child and Adolescent Mental Health, 20 (3), 142-148.
Egan, R., Long, E., McElvaney, J., & Booth, R. (2022). Group radical openness: A feasibility study. Counselling and Psychotherapy Research, 22(4), 913-924.
Elliott, R., Watson, J. C., Goldman, R., & Greenberg, L. S. (2004). Learning emotion-focused therapy: The process-experiential approach to change. Washington, DC, US: American Psychological Association.
Esbjørn, B. H., Somhovd, M. K., Turnstedt, C., Reinholdt-Dunne, M. L. (2012). Assessing the revised child anxiety and depression scale (RCADS) in a national sample of Danish youth aged 8–16 years. PLoS One, 7, e37339.
Farrelly J, Kiernan G, Finnerty S, Stepala P, Costigan D, Chrzanowska P, Carney M, Mahon P (2023) The National Quality Framework: Driving Excellence in Mental Health Services. Dublin: Mental Health Commission.
Fairburn CG & Beglin SJ. (1994) Assessment of eating disorder psychopathology: interview or self-report questionnaire? International Journal of Eating Disorders, 16, 363-370.
Fairburn, C. G., Cooper, Z., & O’Connor, M. (1993). The eating disorder examination. International Journal of Eating Disorders, 6(1), 1-8.
Flynn, D., Joyce, M., Spillane, A., Wrigley, C., Corcoran, P., Hayes, A., ... & Mooney, B. (2019). Does an adapted Dialectical Behaviour Therapy skills training programme result in positive outcomes for participants with a dual diagnosis? A mixed methods study. Addiction science & clinical practice, 14, 1-10.
Foa, E. B., Ehlers, A., Clark, D. M., Tolin, D. F., & Orsillo, S. M. (1999). The posttraumatic cognitions inventory (PTCI): Development and validation. Psychological Assessment, 11(3), 303.
Ford, P. (2003). An evaluation of the Dartmouth Assessment of Lifestyle Inventory and the Leeds Dependence Questionnaire for use among detained psychiatric inpatients.
Fresco, D.M., Mennin, D.S., Heimberg, R.G., & Turk, C.L. (2003). Using the Penn State Worry Questionnaire to identify individuals with generalised anxiety disorder: a receiver operating characteristic analysis. Journal of Behaviour Therapy and Experimental Psychiatry, 34(3-4), 283-291.
Garety, P. A., Freeman, D., Jolley, S., Dunn, G., Bebbington, P. E., Fowler, D. G., ... & Dudley, R. (2005). Reasoning, emotions, and delusional conviction in psychosis. Journal of abnormal psychology, 114(3), 373.
Garralda, M.E., Yates, P. & Higginson, I. (2000). Child and adolescent mental health service use: HoNOSCA as an outcome measure. British Journal of Psychiatry, 177, 428-431.
Gendlin, E. T. (1996). Making concepts from experience. Focusing Institute.
Giannakopoulos, G., Dimitrakaki, C., Papadopoulou, K., Tzavara, C., Kolaitis, G., Ravens-Sieberer, U. & Tountas, Y. (2013). Reliability and validity of the Strengths and Difficulties Questionnaire in Greek adolescents and their parents. Health, 5(11), 1774-1783.
Giffort, D., Schmook, A., Woody, C., Vollendorf, C., & Gervain, M. (1995). The recovery assessment scale. In R.O. Ralph & K.A. Kidder (Eds.), Can we measure recovery? A compendium of recovery and recovery relatedrelated instruments. (pp. 7–8). Cambridge, MA: Human Services Research Institute.
Gilbert, P. (2009). An introduction to Compassion Focused Therapy. Advances in Psychiatric treatment, 15, 199-208.
Gilbert, P. (2010). An introduction to compassion focused therapy in cognitive behavior therapy. International journal of cognitive therapy, 3(2), 97-112.
Gilbert, P. (2014). The origins and nature of compassion focused therapy. British Journal of Clinical Psychology, 53, 6-41.
Gilbert, P., Catarino, F., Duarte, C., Matos, M., Kolts, R., Stubbs, J., ... & Basran, J. (2017). The development of compassionate engagement and action scales for self and others. Journal of Compassionate Health Care, 4(1), 1-24.
Gilbert, P., Clarke, M., Hempel, S., Miles, J. N., & Irons, C. (2004). Criticizing and reassuring oneself: An exploration of forms, styles and reasons in female students. British Journal of Clinical Psychology, 43(1), 31-50.
Gilbert, P., McEwan, K., Matos, M. & Rivis, A. (2011). Fears of compassion: Development of a self-report measure. Psychology & Psychotherapy: Theory, Research and Practice, 84(3), 239-255.
Gilbert, P., McEwan, K., Mitra, R., Richter, A., Franks, L., Mills, A., Bellew, R. & Gale, C. (2009). An exploration of different types of positive affect in
students and patients with bipolar disorder. Clinical Neuropsychiatry, 6135-143.
Gloster, A. T., Walder, N., Levin, M. E., Twohig, M. P., & Karekla, M. (2020). The empirical status of acceptance and commitment therapy: A review of meta-analyses. Journal of Contextual Behavioral Science, 18, 181–192. https://doi.org/10.1016/j.jcbs.2020.09.009
Goodman, W.K., Price, L.H., Rasmussen, S.A., Mazure, C., Fleischmann, R.L., Hill, C.L., Heninger, G.R., & Charney, D.S. (1989). The Yale-Brown Obsessive-Compulsive Scale. I. Development, use, and reliability. Archives of General Psychiatry, 46(11), 1006-11.
Gowers, S., Levine, W., Bailey-Rogers, S., Shore, A. & Burhouse, E. (2002). Use of a routine, self-report outcome measure (HoNOSCA-SR) in two adolescent mental health services. British Journal of Psychiatry, 180, 266269.
Graham, J. M., & Unterschute, M. S. (2015). A reliability generalization meta-analysis of self-report measures of adult attachment. Journal of personality assessment, 97(1), 31-41.
Gratz, K.L., & Roemer, L. (2004). Multidimensional assessment of emotion regulation and dysregulation: development, factor structure, and initial validation of the difficulties in emotion regulation scale. Journal of Psychopathology and Behavioural Assessment, 26(1), 41-54.
Greenberg, L. S. (1979) Resolving splits: The two-chair technique. Psychotherapy: Theory, Research & Practice, 16, 316-24
Greenberg, L. S. (1984) Task analysis: The general approach. In LN Rice & LS Greenberg (eds) Patterns of Change New York: Guilford Press.
Greenberg, L. S. (2011). Emotion-focused therapy. American Psychological Association.
Greenberg, L. S. (2016). Emotion-focused therapy. 2nd ed. Washington, DC: American Psychological Association
Greenberg, L. S., & Watson, J. C. (2006). Emotion-focused therapy for depression. American Psychological Association.
Greenberg, L.S., & Safran, J.D. (1987). Emotion in Psychotherapy. New York: Guilford Press.
Greenberg, L.S., & Watson, J.C. (2005). Emotion-Focused Therapy for depression. Washington, D.C. American Psychological Association.
Griffin, S. A., Suzuki, T., Lynam, D. R., Crego, C., Widiger, T. A., Miller, J. D., & Samuel, D. B. (2018). Development and examination of the five-factor obsessive-compulsive inventory–short form. Assessment, 25(1), 56-68.
Griner, D., Beecher, M. E., Burlingame, G. M., Erekson, D. M., & Cattani, K. (2022). Compassion focused therapy in groups. In Compassion focused therapy (pp. 413-426). Routledge.
Gross, J.J., & John, O.P. (2003). Individual differences in two emotion regulation processes: Implications for affect, relationships, and well-being.
Journal of Personality and Social Psychology, 85, 348-362.
Guest, T. (2000). Using the Eating Disorder Examination in the assessment of bulimia and anorexia: Issues of reliability and validity. Social Work in Health Care, 31(4), 71-83.
Hamtiaux, A., & Houssemand, C. (2012). Adaptability, cognitive flexibility, personal need for structure, and rigidity. Psychology Research, 2(10), 563.
Harned, M. S., Korslund, K. E., & Linehan, M. M. (2014). A pilot randomized controlled trial of Dialectical Behavior Therapy with and without the Dialectical Behavior Therapy Prolonged Exposure protocol for suicidal and self-injuring women with borderline personality disorder and PTSD. Behaviour research and therapy, 55, 7-17.
Hayes, S. C., & Strosahl, K. D. (Eds.). (2004). A practical guide to acceptance and commitment therapy. Springer.
Herman, J. L. (1992). Complex PTSD: A syndrome in survivors of prolonged and repeated trauma. Journal of Traumatic Stress, 5(3), 377-391.
Hofmann, S.G., & Smits, J.A.J. (2008). Cognitive-behavioural therapy for adult anxiety disorders: a meta-analysis of randomized placebo-controlled trials. Journal of Clinical Psychiatry, 69(4), 621-632.
Jacobson, N. S., & Truax, P. (1991). Clinical significance: A statistical approach to defining meaningful change in psychotherapy research. Journal of Consulting and Clinical Psychology, 59(1), 12–19. https://doi.org/10.1037/0022-006X.59.1.12
Jazaeir, H., McGonigal, K, Jinpa, T., Doty, J.R., Gross, J. & Goldin, P.R. (2012). A randomised control trial of compassion focusd therapy: Effects on mindfulness, affect and emotion regulation. Retrieved http://ccare.stanford.edu/wp-content/uploads/2013/07/Jazaieri-et-al.2013.pdf.
Jennings, K. M., & Phillips, K. E. (2017). Eating Disorder ExaminationQuestionnaire (EDE-Q): Norms for clinical sample of female adolescents with anorexia nervosa. Archives of Psychiatric Nursing, 31(6), 578–581. https://doi.org/10.1016/j.apnu.2017.08.002
Kanter, J. W., Mulick, P. S., Busch, A. M., Berlin, K. S., & Martell, C. R. (2007). The Behavioural activation for depression scale (BADS): Psychometric properties and factor structure. Journal of Psychopathology and Behavioural Assessment, 29, 191-202.
Kanter, J.W., Rusch, L. C. Busch, A.M., & Sedivy, S.K. (2009). Confirmatory factor analysis of the Behavioural Activation for Depression Scale (BADS) in a depressed sample. Journal of Psychopathology and Behavioural Assessment, 31, 36-42
Kells, M., Joyce, M., Flynn, D., Spillane, A., & Hayes, A. (2020). Dialectical behaviour therapy skills reconsidered: applying skills training to emotionally dysregulated individuals who do not engage in suicidal and self-harming behaviours. Borderline personality disorder and emotion dysregulation, 7, 1-8.
Kelly, A. C., & Tasca, G. A. (2016). Within-persons predictors of change during eating disorders treatment: An examination of self-compassion, self-criticism, shame, and eating disorder symptoms. International Journal of Eating Disorders, 49(7), 716-722.
Kelly, J.F, Magill, M., Slaymaker, V. & Kahler, C. (2010). Psychometric Validation of the Leeds Dependence Questionnaire (LDQ) in a young adult clinical sample. Addictive Behaviours, 35, (4): 331-336.
Kolts, R. L. (2016). CFT Made Simple: A Clinician’s Guide to Practicing Compassion Focused Therapy. New Harbinger Publications.
Koons, C. R., Robins, C. J., Tweed, J. L., Lynch, T. R., Gonzalez, A. M., Morse, J. Q., ... & Bastian, L. A. (2001). Efficacy of dialectical behavior therapy in women veterans with borderline personality disorder. Behavior therapy, 32(2), 371-390.
Kroenke, K., Spitzer, R. L., & Williams, J. B. (2001). The PHQ-9: validity of a brief depression severity measure. Journal of General Internal Medicine, 16(9), 606-613.
Lamers, F., van Oppen, P., Comijs, H. C., Smit, J. H., Spinhoven, P., van Balkom, A. J. L. M., Nolen, W. A., Zitman, F. G., Beekman, A. T. F., & Penninx, B. W. J. H. (2011). Comorbidity patterns of anxiety and depressive disorders in a large cohort study: The Netherlands Study of Depression and Anxiety (NESDA). Journal of Clinical Psychiatry, 72(3), 341–348. https://doi.org/10.4088/JCP.10m06176blu
Lang, A. J., & Stein, M. B. (2005). An abbreviated PTSD checklist for use as a screening instrument in primary care. Behaviour Research and Therapy, 43(5), 585-594.
Leaviss, K. & Uttley, L. (2014). Psychotherapeutic benefits of compassion focused therapy: An early systematic review. Psychological Medicine, 119.
Lesinskiene, S., Senina, J. & Ranceva, N. (2007). Use of the HoNOSCA scale in the teamwork of inpatient child psychiatry unit. Journal of Psychiatric and Mental Health Nursing, 14, 727-733.
Li, C. (2013). Little's test of missing completely at random. The Stata Journal, 13(4), 795-809.
Linehan, M. M., Armstrong, H. E., Suarez, A., Allmon, D., & Heard, H. L. (1991). Cognitive-behavioral treatment of chronically parasuicidal borderline patients. Archives of general psychiatry, 48(12), 1060-1064.
Linehan, M. M., Comtois, K. A., Murray, A. M., Brown, M. Z., Gallop, R. J., Heard, H. L., ... & Lindenboim, N. (2006). Two-year randomized controlled trial and follow-up of dialectical behavior therapy vs therapy by experts for suicidal behaviors and borderline personality disorder. Archives of general psychiatry, 63(7), 757-766.
Linehan, M.M. (1993). Cognitive-behavioral treatment of borderline personality disorder. New York: Guilford Press.
Long, E., Skelly, T., Ryan, H., et al. (2026). Personal recovery in substance use disorder: A “best fit” framework synthesis systematic review. Community Mental Health Journal. Advance online publication. https://doi.org/10.1007/s10597-025-01578-2
Lovibond, P. F., & Lovibond, S. H. (1995). The structure of negative emotional states: Comparison of the Depression Anxiety Stress Scales (DASS) with the Beck Depression and Anxiety Inventories. Behaviour research and therapy, 33(3), 335-343.
Löwe, B., Decker, O., Müller, S., Brähler, E., Schellberg, D., Herzog, W., & Herzberg, P. Y. (2008). Validation and standardization of the Generalized Anxiety Disorder Screener (GAD-7) in the general population. Medical Care, 266-274.
Luce, K. H., & Crowther, J. H. (1999). The reliability of the eating disorder examination—Self-report questionnaire version (EDE-Q). International Journal of Eating Disorders, 25(3), 349-351.
Lucre, K.M. & Corten, N. (2012). An exploration of group compassion focused therapy for personality disorders. Psychology and Psychotherapy: Theory, research and practice, 86(4), 387-400.
Lykins, E.L.B., & Baer, R.A. (2009). Psychological functioning in a sample of long-term practitioners of mindfulness meditation. Journal of Cognitive Psychotherapy, 23, 226-241
Lynch, T. R. (2018). Radically open dialectical behaviour therapy: Theory and practice for treating disorders of overcontrol. New Harbinger Publications.
Lyng, J., Swales, M. A., Hastings, R. P., Millar, T., Duffy, D. J., & Booth, R. (2020). Standalone DBT group skills training versus standard (ie all modes) DBT for borderline personality disorder: a natural quasiexperiment in routine clinical practice. Community mental health journal, 56(2), 238-250.
Marks, I.M. & Matthews, A.N. (1979). Brief standard self-rating for phobic patients. Behaviour Research and Therapy, 17, 263 -267.
McMain, S. F., Chapman, A. L., Kuo, J. R., Guimond, T., Streiner, D. L., Dixon-Gordon, K. L., ... & Hoch, J. S. (2018). The effectiveness of 6 versus 12-months of dialectical behaviour therapy for borderline personality disorder: the feasibility of a shorter treatment and evaluating responses (FASTER) trial protocol. BMC psychiatry, 18, 1-16.
Mental Health Commission (2025). Judgement Support Framework. https://www. mhcirl.ie/sites/default/files/2025-02/Judgement%20Support %20Framework %20Version%206.1%20%282025%29.pdf.
Mernagh, M., Baird, K., & Guerin, S. (2020). Subjective changes in mindbody attunement associated with transdiagnostic group–based compassion-focused therapy. Mindfulness
Meyer, T.J., Miller, M.L., Metzger, R.L., & Borkovec, T.D. (1990). Development and validation of the Penn state worry questionnaire. Behaviour Research and Therapy, 28(6), 487-495.
Mieloo, C., Raat, H., van Oort, F., Bevaart, F., Vogel, I., Donker, M. & Jansen, W. (2012). Validity and Reliability of the Strengths and Difficulties Questionnaire in 5–6 Year Olds: Differences by Gender or by Parental Education? Plos One, 7(5): e36805.
Mirowsky, J., & Ross, C. E. (1992). Age and depression. Journal of health and social behavior, 187-205.
Mond, J. M., Hay, P. J., Rodgers, B., Owen, C., & Beumont, P. J. V. (2004a). Beliefs of the public concerning the helpfulness of interventions for bulimia nervosa. International Journal of Eating Disorders, 36, 62−68.
Mullen, G., Dowling, C., Doyle, J. and O’Reilly, G. (2019). Experiences of compassion focused therapy in eating disorder recovery: A qualitative model. Journal of Counselling and Psychotherapy Research, 00, 1–15.
Mundt, J.C., Marks, I.M., Shear, M.K., & Greist, J.H. (2002). The Work and Social Adjustment Scale: a simple measure of impairment in functioning. British Journal of Psychiatry, 180, 461-4.
Neacsiu, A.D., Rizvi, S.L., Vitaliano, P.P., Lynch, T.R., & Linehan, M.M. (2010). The Dialectical Behaviour Therapy Ways of Coping Checklist: Development and psychometric properties. Journal of Clinical Psychology, 66, 6, 1-20.
Neff, K. D. & Germer, C. (2017). Self-Compassion and Psychological Wellbeing. In J.Doty (Ed.) Oxford Handbook of Compassion Science, Chap. 27. Oxford University Press.
Neff, K. D. (2003). Development and validation of a scale to measure selfcompassion. Self and Identity, 2, 223-250.
Neuberg, S.L. & Newsom, J.T. Newsom (1993). Personal need for structure: individual differences in the desire for simple structure. Journal of Personality and Social Psychology, 65(1), 113-131.
National Institute for Health and Care Excellence. (2022). Depression in adults: Treatment and management (NICE guideline NG222). https://www.nice.org.uk/guidance/ng222
Oei, T.P.S, Moylan, A., & Evans, L. (1991). The validity of Fear Questionnaire in anxiety disorders. Psychological Assessment: A Journal of Consulting and Clinical Psychology, 29, 429-452.
Olantunji, B.O., Cisler, J.M., Deacon, B.J. (2010). Efficacy of cognitive behavioural therapy for anxiety disorders: a review of meta-analytic findings. The Psychiatric Clinics of North America, 33(3), 557-577.
Osman, A., Kopper, B. A., Barrios, F. X., Osman, J. R., & al., et. (1996). The Brief Reasons for Living Inventory for adolescents (BRFL-A). Journal of Abnormal Child Psychology, 24, 433 –443.
Palmieri, G., Evans, C., Hansen, V., Brancaleoni, G., Ferrari, S., Porcelli, P., ... & Rigatelli, M. (2009). Validation of the Italian version of the clinical outcomes in routine evaluation outcome measure (CORE-OM). Clinical Psychology & Psychotherapy: An International Journal of Theory & Practice, 16(5), 444-449.
Pasieczny, N., & Connor, J. (2011). The effectiveness of dialectical behaviour therapy in routine public mental health settings: An Australian controlled trial. Behaviour research and therapy, 49(1), 4-10.
Pascual-Leone, A., & Greenberg, L. S. (2007). Emotional processing in experiential therapy: Why" the only way out is through.". Journal of Consulting and Clinical Psychology, 75(6), 875.
Passi, V. A., Bryson, S. W., & Lock, J. (2003). Assessment of eating disorders in adolescents with anorexia nervosa: Self-report questionnaire versus interview. International Journal of Eating Disorders, 33(1), 45-54.
Pearlin, L. I., Menaghan, E. G., Lieberman, M. A., & Mullan, J. T. (1981). Sense of mastery scale [Database record]. APA PsycTests. https://doi.org/10.1037/t15814-000
Perry, T., Barkham, M., & Evans, C. (2013). The CORE-OM and CORE-OM (SV) in secure settings: a template analysis of the experiences of male patients and their staff. The Journal of Forensic Practice.
Pinto-Gouveia, J., Ferreira, C., & Duarte, C. (2014). Thinness in the pursuit for social safeness: An integrative model of social rank mentality to explain eating psychopathology. Clinical Psychology & Psychotherapy, 21(2), 154-165.
Plummer, F., Manea, L., Trepel, D., & McMillan, D. (2016). Screening for anxiety disorders with the GAD-7 and GAD-2: A systematic review and diagnostic meta-analysis. General Hospital Psychiatry, 39, 24–31. https://doi.org/10.1016/j.genhosppsych.2015.11.005
Porges, S. W. (2011). The polyvagal theory: Neurophysiological foundations of emotions, attachment, communication, and self-regulation. W. W. Norton & Company
Preece, D. A., Becerra, R., Robinson, K., & Gross, J. J. (2019). The Emotion Regulation Questionnaire: Psychometric Properties in General Community Samples. Journal of personality assessment, 102(3), 348–356.
Priebe, S., Bhatti, N., Barnicot, K., Bremner, S., Gaglia, A., Katsakou, C., ... & Zinkler, M. (2012). Effectiveness and cost-effectiveness of dialectical behaviour therapy for self-harming patients with personality disorder: a pragmatic randomised controlled trial. Psychotherapy and psychosomatics, 81(6), 356-365.
Raistrick, D., Bradshaw, J., Tober, G., Weiner, J., Allison, J., & Healey, C. (1994). Development of the Leeds Dependence Questionnaire (LDQ): a questionnaire to measure alcohol and opiate dependence in the context of a treatment evaluation package. Addiction, 89 (5), 563-572.
Rice, L. N., & Greenberg, L. (Eds.) (1984). Patterns of change. New York: Guilford Press.
Rizvi, S. L., & Sayrs, J. H. (2020). Assessment-driven case formulation and treatment planning in dialectical behavior therapy: Using principles to guide effective treatment. Cognitive and Behavioral Practice, 27(1), 4-17.
Robins, C. J. (2002). Zen principles and mindfulness practice in dialectical behavior therapy. Cognitive and behavioral practice, 9(1), 50-57.
Roger, D., & Najarian, B. (1989). The construction and validation of a new scale for measuring emotion control. Personality and individual differences, 10(8), 845-853.
Rogers, C. R. (1957). The necessary and sufficient conditions of therapeutic personality change. Journal of Consulting Psychology, 21(2), 95.
Ruggiero, J., Ben, D., Scotti, R., & Rabalais, E. (2003). Psychometric properties of the PTSD Checklist—Civilian version. Journal of Traumatic Stress, 16(5), 495-502.
Rush, A. J., Trivedi, M. H., Ibrahim, H. M., Carmody, T. J., Arnow, B., Klein, D. N., ... & Keller, M. B. (2003). The 16-Item Quick Inventory of Depressive Symptomatology (QIDS), clinician rating (QIDS-C), and self-report (QIDSSR): a psychometric evaluation in patients with chronic major depression. Biological psychiatry, 54(5), 573-583.
Rush, A., Gullion, C., Basco, M., Jarrett, R., & Trivedi, M. (1996). The Inventory of Depressive Symptomatology (IDS): Psychometric properties. Psychological Medicine, 26(3), 477-486. doi:10.1017/S0033291700035558.
Rush, A.J., Carmody, T. and Reimitz, P.-E. (2000), The Inventory of Depressive Symptomatology (IDS): Clinician (IDS-C) and Self-Report (IDSSR) ratings of depressive symptoms. Int. J. Methods Psychiatr. Res., 9: 4559. https://doi.org/10.1002/mpr.79.
Samuel, D. B., Riddell, A. D., Lynam, D. R., Miller, J. D., & Widiger, T. A. (2012). A five-factor measure of obsessive–compulsive personality traits. Journal of Personality Assessment, 94(5), 456-465.
Schmitt, D. P., & Allik, J. (2005). Simultaneous administration of the Rosenberg Self-Esteem Scale in 53 nations: exploring the universal and culture-specific features of global self-esteem. Journal of personality and social psychology, 89(4), 623.
Seow, L. L., Collins, K. R., Page, A. C., & Hooke, G. R. (2022). Outcomes of brief versions of Dialectical Behaviour Therapy for diagnostically heterogeneous groups in a routine care setting. Psychotherapy Research, 32(2), 179-194.
Simons, J.S., & Gaher, R.M. (2005). The Distress Tolerance Scale: Development and validation of a self-report measure. Motivation and Emotion, 29(2), 83-102.
Sinclair, S. J., Blais, M. A., Gansler, D. A., Sandberg, E., Bistis, K., & LoCicero, A. (2010). Psychometric properties of the Rosenberg SelfEsteem Scale: Overall and across demographic groups living within the United States. Evaluation & the health professions, 33(1), 56-80.
Spitzer, R. L., Kroenke, K., Williams, J. B., & Löwe, B. (2006). A brief measure for assessing generalized anxiety disorder: the GAD-7. Archives of Internal Medicine, 166(10), 1092-1097.
Steer, R. A., Kumar, G., Beck, J. S., & Beck, A. T. (2001). Evidence for the construct validities of the Beck Youth Inventories with child psychiatric outpatients. Psychological reports, 89(3), 559-565.
Steindl, S. R., Tellegen, C. L., Filus, A., Seppälä, E., Doty, J. R., & Kirby, J. N. (2021). The Compassion Motivation and Action Scales: a self-report measure of compassionate and self-compassionate behaviours. Australian Psychologist, 56(2), 93-110.
Storebø, O. J., Stoffers-Winterling, J. M., Völlm, B. A., Kongerslev, M. T., Mattivi, J. T., Jørgensen, M. S., ... & Simonsen, E. (2020). Psychological therapies for people with borderline personality disorder. Cochrane Database of Systematic Reviews, (5).
Stratton, P., Lask, J., Bland, J., Nowotny, E., Evans, C., Singh, R., Janes, E., & Peppiatt, A. (2014) Validation of the SCORE-15 Index of Family Functioning and Change in detecting therapeutic improvement early in therapy. Journal of Family Therapy, 36, 3-19.
Taylor, P. J., Pyle, M., Schwannauer, M., Hutton, P., & Morrison, A. (2015). Confirming the structure of negative beliefs about psychosis and bipolar disorder: A confirmatory factor analysis study of the Personal Beliefs about Experience Questionnaire and Personal Beliefs about Illness Questionnaire. British Journal of Clinical Psychology, 54(4), 361-377.
Taylor, S. (1995). Assessment of obsessions and compulsions: reliability, validity, and sensitivity to treatment effects. Clinical Psychology Reviews, 15, 261–296.
Telch, C. F., Agras, W. S., & Linehan, M. M. (2001). Dialectical behavior therapy for binge eating disorder. Journal of Consulting and Clinical Psychology, 69(6), 1061.
Thompson, M., Naccarato, M., Parker, K., & Moskowitz, G. (2001). The personal need for structure and personal fear of invalidity measures: Historical perspectives, current applications, and future directions. In G. B. Moskowitz (Ed.), Cognitive social psychology: The Princeton Symposium on the Legacy and Future of Social Cognition (pp. 19–39). Lawrence Erlbaum Associates Publishers.
Thompson, S., & Girz, L. (2018). Taming your critic: A practical guide to EFT in group settings. Transforming Emotions
Thompson, S., & Girz, L. (2020). Overcoming shame and aloneness: Emotion-focused group therapy for self-criticism. Person-Centered & Experiential Psychotherapies, 19(1), 1-11.
Timulak, L. (2015). Transforming emotional pain in psychotherapy: An emotion-focused approach. Routledge.
Timulak, L., & Keogh, D. (2020). Emotion-focused therapy: A transdiagnostic formulation. Journal of Contemporary Psychotherapy, 50, 1-13.
Timulak, L., & McElvaney, J. (2016). Emotion-focused therapy for generalized anxiety disorder: An overview of the model. Journal of Contemporary Psychotherapy, 46, 41-52.
Timulak, L., & Pascual-Leone, A. (2015). New developments for case conceptualization in emotion-focused therapy. Clinical Psychology & Psychotherapy, 22(6), 619-636.
Tober, G., Brearley, R., Kenyon, R., Raistick, D. & Morley, S. (2000). Measuring outcomes in a health service addiction clinic. Addiction Research, 8(2), 169-182.
Torrey, W. C., Mueser, K. T., McHugo, G. H., & Drake, R. E. (2000). Selfesteem as an outcome measure in studies of vocational rehabilitation for adults with severe mental illness. Psychiatric Services, 51(2), 229-233.
Twohig, M. P., & Levin, M. E. (2017). Acceptance and commitment therapy as a treatment for anxiety and depression: A review. Psychiatric Clinics of North America, 40(4), 751–770. https://doi.org/10.1016/j.psc.2017.08.009
Velkoff, E. A., Brown, T. A., Kaye, W. H., & Wierenga, C. E. (2023). Using clinical cutoff scores on the Eating Disorder Examination-Questionnaire to evaluate eating disorder symptoms during and after naturalistic intensive treatment. Eating Disorders, 31(5), 464–478. https://doi.org/10.1080/10640266.2023.2191488
Vrabel, K. R., Waller, G., Goss, K., Wampold, B., Kopland, M., & Hoffart, A. (2024). Cognitive behavioral therapy versus compassion focused therapy for adult patients with eating disorders with and without childhood trauma: A randomized controlled trial in an intensive treatment setting. Behaviour Research and Therapy, 174, 104480.
Ware, J. E., Kosinski, M., & Keller, S. D. (1996). A 12-Item Short-Form Health Survey: construction of scales and preliminary tests of reliability and validity. Medical care, 34(3), 220-233.
Weathers, F. W., Litz, B., Herman, D., Juska, J., & Keane, T. (1994). PTSD checklist—civilian version. Journal of Occupational Health Psychology.
Wilfley, D. E., Schwartz, M. B., Spurrell, E. B., & Fairburn, C. G. (1997).
Assessing the specific psychopathology of binge eating disorder patients: 435
interview or self-report?. Behaviour Research and Therapy, 35(12), 11511159.
Willis, N., Dowling, C., & O'Reilly, G. (2022). Stabilisation and PhaseOrientated Psychological Treatment for Posttraumatic Stress Disorder–A Systematic Review and Meta-Analysis. European Journal of Trauma & Dissociation, 100311.
Yang, Y., Perkins, D.R. & Stearns, A.E. “I Started to Feel Better now”: Qualitative Findings from Client Narratives on Early Recovery in Inpatient Substance Use Treatment. Int J Ment Health Addiction 18, 1048–1066 (2020). https://doi.org/10.1007/s11469-019-00107-z
Yalom, I. D., & Leszcz, M. (2005). The theory and practice of group psychotherapy (5th ed.). Basic Books.
Yusoff, M. S. B. (2013). Psychometric properties of the Depression Anxiety Stress Scale in a sample of medical degree applicants. International Medical Journal, 20(3), 295–300.