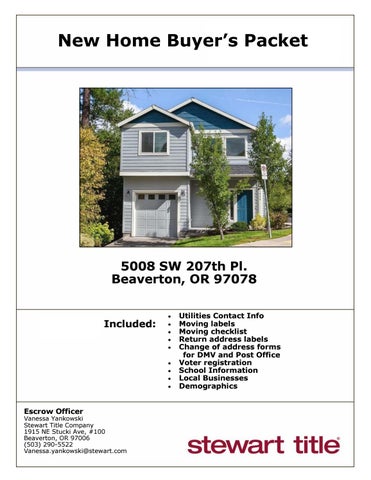
New Home Buyer’s Packet
5008 SW 207th Pl. Beaverton, OR 97078
Included:
Escrow Officer
Vanessa Yankowski Stewart Title Company 1915 NE Stucki Ave, #100 Beaverton, OR 97006 (503) 290-5522 Vanessa.yankowski@stewart.com
Utilities Contact Info Moving labels Moving checklist Return address labels Change of address forms for DMV and Post Office Voter registration School Information Local Businesses Demographics
School Information
3
2
! !" # $ 3 !! " # % & ' 3 ( * ' ) 3 * + , 3 !
3 $ % &
"' ( ) & ' 3 )
+ , 3 !## # +-$ ' . ' 3
+ $ ,
- . / 00
" 1#2
/ 0 ' ( !/ # $ 3 !! " 1 % & ' 3 1
+ , 3 ###
3 $ % &
"' ( ) & ' 3
+ , 3 1"
# +-$ ' . ' 3
$ ,
$ ,
" 12
0 1 ' ( !/ # $ 3 ! ) % & ' 3 #
+ , 3 " !## # +-$ ' . ' 3
3 $ % &
"' ( ) & ' 3 " + , 3 ")) 2' ' , 3 *
Customer Name : Customer Resources Customer Company Name : Stewart Title Prepared On : 11/05/2019 Š 2019 CoreLogic. All rights reserved
Butternut Creek Elementary School 20395 SW Florence Street Aloha, OR 97007-2243
Principal: Dani Johnson Office Hours:
Opened in 1977
7:00 a.m. to 3:30p.m. Phone: 503-844-1390 FAX: 503-844-1397 Attendance Line: 503-844-1393
School Schedule GRADES 1-6 Regular Schedule (M,T,Th,F)
Wednesday Academic Seminar
Inclement Weather 2-Hour Late Start
Start Time
7:45 a.m.
Start Time
7:45 a.m.
Start Time
9:45 a.m.
End Time
2:05 p.m.
End Time
1:35 p.m.
End Time
2:05 p.m.
AM KINDERGARTEN Regular Schedule (M,T,Th,F)
Wednesday Academic Seminar
Start Time
7:45 a.m.
Start Time
7:45 a.m.
End Time
10:35 a.m.
End Time
10:20 a.m.
Inclement Weather No AM Kindergarten
PM KINDERGARTEN Regular Schedule (M,T,Th,F)
Wednesday Academic Seminar
Inclement Weather (regular schedule)
Start Time
11:15 a.m.
Start Time
11:00 a.m.
Start Time
11:15 a.m.
End Time
2:05 p.m.
End Time
1:35 p.m.
End Time
2:05 p.m.
Standard Weekly Schedule Monday
Tuesday
Regular Schedule
Wednesday Academic Seminar
Thursday
Friday
Regular Schedule
OREGON AT-A-GLANCE SCHOOL PROFILE Butternut Creek Elementary School
2018-19
PRINCIPAL: Dani Johnson | GRADES: K-6 | 20395 SW Florence St, Aloha 97007 | 503-844-1390
Students We Serve
School Environment
388
Academic Progress INDIVIDUAL STUDENT PROGRESS
CLASS SIZE
REGULAR ATTENDERS
Median class size.
Students who attended more than 90% of their enrolled school days. Decrease from previous year
Student Enrollment
Increase from previous year
2
DEMOGRAPHICS American Indian/Alaska Native Students
0%
Teachers
0%
26.5
Year-to-year progress in English language arts and mathematics.
2%
88%
Asian Students
6%
Teachers
0%
Oregon average
25
Black/African American Students
1%
Teachers
0%
Hispanic/Latino Students
30%
Teachers
4%
Students
8% 0%
Native Hawaiian/Pacific Islander Students
2%
Teachers
0%
80%
Academic Success ENGLISH LANGUAGE ARTS
MATHEMATICS
SCIENCE
Students meeting state grade-level expectations.
Students meeting state grade-level expectations.
Students meeting state grade-level expectations.
Multiracial Teachers
Oregon average
Decrease from previous year
Decrease from previous year
1%
6%
42%
Coming in 2019-20
30%
White Students
53%
Teachers
96%
28%
18
Ever English Learners
Languages Spoken
21% 98% >95% Students with Disabilities
Required Vaccinations
Free/ Reduced Price Lunch
*<10 students or data unavailable
Oregon average
Oregon average
51%
42%
School Goals
State Goals
Safe & Welcoming Environment
At Butternut Creek Elementary, we believe that all students can successfully achieve when they are held to high expectations and are properly supported. We strive to know each student by name, strength, and need so we can close the achievement gap and prepare all students for career and college readiness and success in a global society. This year, our areas of focus include communicating reasoning in mathematics, writing, decreasing discipline referrals, increasing parent engagement, and improving attendance.
The Oregon Department of Education is partnering with school districts and local communities to ensure a 90% ontime, four year graduation rate by 2025. To progress toward this goal, the state will prioritize efforts to improve attendance, provide a well-rounded education, invest in implementing culturally responsive practices, and promote continuous improvement to close opportunity and achievement gaps for historically and currently underserved students.
We recognize the diversity and worth of all students, individuals and groups, and are committed to both educating and providing a safe and inclusive space for everyone, regardless of their race, color, religion, immigration status, or any other basis. We believe that students learn best when they feel safe and valued. Our staff members are skilled, caring, and dedicated to fostering each student’s academic and personal growth in a supportive and welcoming environment. We are continuing our work in culturally responsive classrooms and trauma responsive care.
School Website: schools.hsd.k12.or.us/butternut/Home/tabid/2263/Default.aspx
For more information please visit: www.oregon.gov/ode/reports-and-data/
OREGON AT-A-GLANCE SCHOOL PROFILE CONTINUED Butternut Creek Elementary School
2018-19
PRINCIPAL: Dani Johnson | GRADES: K-6 | 20395 SW Florence St, Aloha 97007 | 503-844-1390
Our Staff (rounded FTE)
20 Teachers
Outcomes REGULAR ATTENDERS
ENGLISH LANGUAGE ARTS
American Indian/Alaska Native <10 students or data unavailable
<10 students or data unavailable
>95%
Asian Black/African American <10 students or data unavailable
12
Educational assistants
1
Counselors
13% Average teacher turnover rate
95% % of licensed teachers with more than 3 years of experience
No
Same principal in the last 3 years
Multiracial
85%
53% <10 students or data unavailable
25%
22%
82%
59%
Native Hawaiian/Pacific Islander <10 students or data unavailable
<10 students or data unavailable
White
90%
Free/Reduced Price Lunch
88%
Ever English Learner
85%
Students with Disabilities
85%
Migrant <10 students or data unavailable
47% <10 students or data unavailable
47%
31%
42%
30%
32%
27%
18%
6%
<10 students or data unavailable
83%
Talented and Gifted
<10 students or data unavailable
59% <10 students or data unavailable
Hispanic/Latino
MATHEMATICS
<10 students or data unavailable
>95%
<10 students or data unavailable
Female
87%
Male
89%
Non-Binary <10 students or data unavailable
46% 38% <10 students or data unavailable
31% 30% <10 students or data unavailable
About Our School BULLYING, HARASSMENT, AND SAFETY POLICIES
EXTRACURRICULAR ACTIVITIES
PARENT ENGAGEMENT
COMMUNITY ENGAGEMENT
Student safety is one of the top priorities at Butternut Creek. To that end, we have a network of adults, systems, structures, protocols, and other supports we leverage to keep our school as safe as possible. To learn more, please visit www.hsd.k12.or.us/keepingstudentssafe. Ensuring safety also means that positive, respectful, and responsible behavior is expected at all times. We do not tolerate bullying or harassment. To learn more about the District’s definition and response to bullying and/or harassment, please see Board Policies JFCF and JFCF-AR: Hazing, Harassment and Bullying, as well as the Standards of Student Conduct.
At Butternut Creek we provide Trauma Responsive Care, Child Care, Leadership, Chess for Success, Singing Club, Poetry Club, Bulldog Yoga, Battle of the Books, Young Rembrandts, Mad Science, Student Council, TAG (Talented and Gifted), AVID (Advancement Via Individual Determination), Right Brain Initiative, STEAM (Science, Technology, Engineering, Arts & Math), LEGO Robotics, and 6th Grade Band.
Butternut Creek encourages and appreciates partnership in education. We are fortunate to have parent volunteers that help in various ways in and out of the classroom. Some of they ways we facilitate partnership include our Parent Teacher Committee (PTC), Parent Advisory Committee (PAC), Dia de los Niños, Backto-school night/Ice cream social, Bulldog Family Night, AVID Parent Night, College Knowledge Day, and Cultural Fair.
Community members are welcomed and encouraged to visit and participate in any and all of our activities, including our Parent Teacher Community Committee (PTCC), Cultural Fair, Bulldog Family Night, AVID Nights, Dia de los Niños, and so on. We are also fortunate to have volunteers from various churches and businesses that partner with us to provide their time and resources.
Data are suppressed to protect confidential student information.
For more information please visit: www.oregon.gov/ode/reports-and-data/
R. A. Brown Middle School 1505 SW Cornelius Pass Road Hillsboro, OR 97123-6727
Principal: Roger Will
Opened in 1963
Office Hours: 8 a.m. to 4 p.m. Phone: 503-844-1070 FAX: 503-844-1071 Attendance Line: 503-844-1075
School Schedule Regular Schedule (M, T, Th, F) Start Time 8:45 a.m. End Time 3:15 p.m.
Wednesday Academic Seminar Start Time 9:15 a.m. End Time 3:15 p.m.
Standard Weekly Schedule Monday Tuesday Regular Schedule
Wednesday Academic Seminar
Inclement Weather 2-Hour Late Start Start Time 10:45 a.m. End Time 3:15 p.m.
Thursday
Friday
Regular Schedule
OREGON AT-A-GLANCE SCHOOL PROFILE R A Brown Middle School
2018-19
PRINCIPAL: Roger Will | GRADES: 7-8 | 1505 SW Cornelius Pass Rd, Hillsboro 97123 | 503-844-1070
Students We Serve
School Environment
729
Academic Progress INDIVIDUAL STUDENT PROGRESS
CLASS SIZE
REGULAR ATTENDERS
Median class size.
Students who attended more than 90% of their enrolled school days. Increase from previous year
Student Enrollment
Decrease from previous year
1
DEMOGRAPHICS American Indian/Alaska Native Students
<1%
Teachers
0%
31
Year-to-year progress in English language arts and mathematics.
2%
84%
Asian Students
12%
Teachers
3%
Oregon average
25
Black/African American Students
2%
Teachers
3%
Hispanic/Latino Students
29%
Teachers
3%
Students
8% 3%
Native Hawaiian/Pacific Islander Students
2%
Teachers
0%
80%
Academic Success ENGLISH LANGUAGE ARTS
MATHEMATICS
SCIENCE
Students meeting state grade-level expectations.
Students meeting state grade-level expectations.
Students meeting state grade-level expectations.
Multiracial Teachers
Oregon average
Decrease from previous year
Decrease from previous year
4%
3%
65%
Coming in 2019-20
47%
White Students
46%
Teachers
89%
26%
29
Ever English Learners
Languages Spoken
13% 98% 48% Students with Disabilities
Required Vaccinations
Free/ Reduced Price Lunch
*<10 students or data unavailable
School Website: hsd.k12.or.us/brown/
Oregon average
Oregon average
55%
40%
School Goals
State Goals
Safe & Welcoming Environment
Through our focus on effective student engagement practices, we set goals to increase the growth rate for our students with disabilities and for those who represent underserved races and ethnicities in both Math and Language Arts during the 2018-19 school year. Although we did not meet our goals, we will continue to use language scaffolds, differentiated instruction, and professional learning communities to strengthen our instructional system to promote increased growth during the 2019-20 school year.
The Oregon Department of Education is partnering with school districts and local communities to ensure a 90% ontime, four year graduation rate by 2025. To progress toward this goal, the state will prioritize efforts to improve attendance, provide a well-rounded education, invest in implementing culturally responsive practices, and promote continuous improvement to close opportunity and achievement gaps for historically and currently underserved students.
R.A. Brown Middle School recognizes the diversity and worth of all students, individuals and groups, and is committed to both educating and providing a safe and inclusive space for everyone, regardless of their race, color, religion, immigration status, or any other basis. We believe that students learn best when they feel emotionally and physically safe. Our staff is skilled, caring, and dedicated to fostering each student’s academic and personal growth in a supportive and welcoming environment.
For more information please visit: www.oregon.gov/ode/reports-and-data/
OREGON AT-A-GLANCE SCHOOL PROFILE CONTINUED R A Brown Middle School
2018-19
PRINCIPAL: Roger Will | GRADES: 7-8 | 1505 SW Cornelius Pass Rd, Hillsboro 97123 | 503-844-1070
Our Staff (rounded FTE)
30 Teachers
Outcomes REGULAR ATTENDERS
ENGLISH LANGUAGE ARTS
American Indian/Alaska Native <10 students or data unavailable
94%
Asian Black/African American
7
Educational assistants
3
Counselors
12% Average teacher turnover rate
84% % of licensed teachers with more than 3 years of experience
Yes
Same principal in the last 3 years
25%
49%
30%
85%
81%
92%
Native Hawaiian/Pacific Islander White
81%
Free/Reduced Price Lunch
82%
31% 70%
82%
31%
53%
36%
19%
13% 36%
14%
93%
Talented and Gifted Female
83%
Male
84%
54%
52% 87%
Students with Disabilities
54%
39%
85%
Ever English Learner
63%
38%
84%
Multiracial
<10 students or data unavailable
84%
81%
Hispanic/Latino
Migrant
MATHEMATICS
<10 students or data unavailable
Non-Binary <10 students or data unavailable
>95% 73% 58% <10 students or data unavailable
>95% 50% 45% <10 students or data unavailable
About Our School BULLYING, HARASSMENT, AND SAFETY POLICIES
EXTRACURRICULAR ACTIVITIES
PARENT ENGAGEMENT
COMMUNITY ENGAGEMENT
Our number one priority is to ensure that every student feels emotionally and physically safe at all times in our school. To that end, we have a network of adults, systems, structures, protocols, and other supports we leverage to keep our school as safe as possible. To learn more, please visit www.hsd.k12.or.us/keepingstudentssafe. Ensuring safety also means that positive, respectful, and responsible behavior is expected at all times. We do not tolerate bullying or harassment. To learn more about the District’s definition and response to bullying and/or harassment, please see Board Policies JFCF and JFCF-AR: Hazing, Harassment and Bullying, as well as the Standards of Student Conduct.
Extracurricular activities are one of the many ways students increase their connectedness to our school. Here are the activities students can choose from at R.A. Brown Middle School: After-School Sports, Band & Choir, Oregon Battle of the Books, Career-Technical Education (CTE) Courses at Century High School, Homework Club, MESA, Vex Robotics, Dance Team, and Girls in STEAM.
El involucramiento y la asociación con los padres es uno de los pilares del éxito en la escuela secundaria. Animamos a nuestros padres para que se comuniquen con nosotros de las siguientes maneras: Noche AVID, Noche de Regreso a la Escuela, Become a Panther Night, Noche de Matemáticas, oportunidades para padres de ser voluntarios, Club de Padres, charlas mensuales con el director, comunicaciones de los maestros y el boletín semanal del director.
Our school engages our parents and community by hosting a variety of events intended for their attendance and participation: AVID Nights, Become a Panther Night, Back to School Night, Parent Conferences, and Principal Chats. In addition, our leadership students support the community by volunteering at a local nursing home and at our feeder elementary schools.
Data are suppressed to protect confidential student information.
For more information please visit: www.oregon.gov/ode/reports-and-data/
Century High School 2000 SE Century Blvd. Hillsboro, OR 97123-8390
Opened in 1997
Principal: Martha Guise Office Hours: 8 a.m. to 4 p.m. Phone: 503-844-1800 FAX: 503-844-1825 Attendance Line: 503-844-1821
School Schedule Regular Schedule (M, T, Th, F)
Wednesday Academic Seminar
Inclement Weather 2-Hour Late Start
Start Time
8:30 a.m.
Start Time
9:00 a.m.
Start Time
10:30 a.m.
End Time
3:30 p.m.
End Time
3:30 p.m.
End Time
3:30 p.m.
Standard Weekly Schedule Monday Tuesday Regular Schedule
Wednesday Academic Seminar
Thursday
Friday
Regular Schedule
OREGON AT-A-GLANCE SCHOOL PROFILE Century High School
2018-19
PRINCIPAL: Martha Guise | GRADES: 9-12 | 2000 SE Century Blvd, Hillsboro 97123 | 503-844-1800
Students We Serve
School Environment
1,526
Academic Progress
CLASS SIZE
REGULAR ATTENDERS
ON-TRACK TO GRADUATE
Median size of classes in core subjects.
Students who attended more than 90% of their enrolled school days.
Students earning one-quarter of graduation credits in their 9th grade year.
Increase from previous year
Student Enrollment
Increase from previous year
Decrease from previous year
1%
>1%
1
DEMOGRAPHICS American Indian/Alaska Native Students
1%
Teachers
1%
32
78%
94%
Asian Students
14%
Teachers
0%
Oregon average
25
Black/African American Students
3%
Teachers
0%
Hispanic/Latino Students
29%
Teachers
5%
Multiracial Students
7%
Teachers
1%
Native Hawaiian/Pacific Islander Students
1%
Teachers
1%
Oregon average
Oregon average
80%
85%
Academic Success ON-TIME GRADUATION
FIVE-YEAR COMPLETION
COLLEGE GOING
Students earning a diploma within four years. Cohort includes students who were first-time ninth graders in 2014-15. Decrease from previous year
Students earning a high school diploma or GED within five years.
Students enrolling in a two or four year college within one year of completing high school, as reported by the National Student Clearinghouse.
Increase from previous year
Decrease from previous year
3%
3%
3%
89%
95%
63%
White Students
45%
Teachers
91%
26%
37
Ever English Learners
Languages Spoken
13% 98% 43% Students with Disabilities
Required Vaccinations
Free/ Reduced Price Lunch
*<10 students or data unavailable
Oregon average
Oregon average
79%
85%
Oregon average
62%
School Goals
State Goals
Safe & Welcoming Environment
Our goals for 2019-20 are: 1) Create a consistent, trauma informed response to student behavior to see a 5% increase in student attendance and engagement in class; 2) Use effective WICOR (AVID) practices school-wide, increasing rigor across all classrooms, to engage all students, resulting in a 5% increase in reading and writing practices; and 3) Provide all students with supports to access content specific language of rigor in instruction, supporting college and career readiness for all.
The Oregon Department of Education is partnering with school districts and local communities to ensure a 90% ontime, four year graduation rate by 2025. To progress toward this goal, the state will prioritize efforts to improve attendance, provide a well-rounded education, invest in implementing culturally responsive practices, and promote continuous improvement to close opportunity and achievement gaps for historically and currently underserved students.
A safe, positive and supportive school is the foundation of success for our students and is a priority at Century. Supports for students include positive relationships between students and staff; Care Team; Graduation Coaches; Wellness Counselor; Trauma Informed Care practices; clubs, activities and sports; and academic supports. We are also fortunate to have safety improvements in our building from bond funding: main entrance renovated to enhance entry security, interior door locks, security cameras, card key access, and local door alarms on outside doors.
School Website: schools.hsd.k12.or.us/century/Home/tabid/1087/Default.aspx
For more information please visit: www.oregon.gov/ode/reports-and-data/
OREGON AT-A-GLANCE SCHOOL PROFILE CONTINUED Century High School
2018-19
PRINCIPAL: Martha Guise | GRADES: 9-12 | 2000 SE Century Blvd, Hillsboro 97123 | 503-844-1800
Our Staff (rounded FTE)
69 Teachers
Outcomes REGULAR ATTENDERS
ON-TRACK TO GRADUATE 55%
American Indian/Alaska Native
93%
Asian
82%
Educational assistants
70%
Hispanic/Latino
79%
Multiracial Native Hawaiian/Pacific Islander
38%
Counselors
15% Average teacher turnover rate
82% % of licensed teachers with more than 3 years of experience
Yes
Same principal in the last 3 years
88%
85%
>95%
96% 100%
89%
68%
Students with Disabilities
88% 88% Data not available
83%
54%
82%
69% 91%
Talented and Gifted
Male
88%
92%
76%
Ever English Learner
Female
97%
90%
>95%
69%
Free/Reduced Price Lunch
6
>95%
<10 students or data unavailable
79%
White
Migrant
100%
<10 students or data unavailable
Black/African American
28
ON-TIME GRADUATION
75% 80%
Non-Binary <10 students or data unavailable
92% >95%
100%
>95%
90%
92% Coming in 2019-20
89% Coming in 2019-20
About Our School ADVANCED COURSEWORK
CAREER & TECHNICAL EDUCATION
EXTRACURRICULAR ACTIVITIES
PARENT & COMMUNITY ENGAGEMENT
We offer several Advanced Placement (AP) Courses at Century: Studio Art, Biology, Calculus, Chemistry, Computer Science, Economics, Environmental Science, European History, Government, Human Geography, Language and Composition, Literature and Composition, Music Theory, Physics, Psychology, Spanish Language, Spanish Literature, Statistics, U.S. History, and 3-D Studio Art. Last year, 459 students took 614 AP exams, and 80% of seniors had taken one or more dual credit courses during their time at Century.
Courses offered include: Business Education and Marketing, Drafting, Engineering Prep, Introduction to Digital Technology, Advanced Technology Lab, Programming, Web Design, Applied Web Design, Child Development, Culinary Arts, Health Services, and Graphic Design. Additionally, students have access to Automotive Technology, Welding, and Fire Science at other HSD high school campuses. After-school CTE programs include Software Entrepreneurs Club and Family, Career and Community Leaders of America (FCCLA).
Century offers 18 OSAA Sports and four interscholastic clubs; 30 academic clubs; 5 service clubs; drama and thespians; marching band, color guard and drumline; a variety of choirs; and a leadership program.
Parent involvement and support is crucial to the success of our students. We work to reach and involve all members of our school community using surveys, parent nights (AVID, Back-to-School, award nights, Parent Conferences, Incoming Freshmen Night, Latino Parent information nights, PCA events, etc.), outreach to middle school families, newsletters, and principal emails. We also encourage the use of our online gradebook, ParentVue. We continue to increase communication about opportunities and rigor for students. Our Booster Club and Site Council offer additional opportunities to provide input to our school.
Data are suppressed to protect confidential student information.
For more information please visit: www.oregon.gov/ode/reports-and-data/
Hillsboro School District is the fourth-largest public school district in the state of Oregon. Currently, we serve over 20,290 students in grades K-12 who reside in the cities of Hillsboro, North Plains and other parts of Washington County. We are committed to providing quality schools to the students and families we serve. We strive for educational excellence by engaging our students in a challenging, personalized instructional program that prepares them for success in post-high school studies or the world of work. Strong business and community partnerships provide additional resources for our schools and students.
Hillsboro School District and Community Points of Pride ● Only K-12 public school district in the State of Oregon to receive systems accreditation ● Student-centered five-year Strategic Plan that focuses on maximizing the student experience and ensuring our graduates are prepared for success in life and post-secondary endeavors ● 80.42% graduation rate and 2.9% dropout rate - far outpaces state ● Clean feeder patterns - all elementary schools feed to a single middle and high school ● Only public, non-charter online school in the State of Oregon: Hillsboro Online Academy ● More than 2,400 students becoming bilingual and biliterate through Dual Language (English-Spanish) programs in 10 of our schools (8 ES, 1 MS, 1 HS) ● Six STEM Transformation elementary school sites - Quatama, Tobias, Farmington View, Groner, Imlay and McKinney ● After-school STE(A)M programming at ALL schools ● Right Brain Initiative partnership at 12 ES, 1 K-8, 2 MS ● Confucius Classrooms at 2 elementary schools and 2 middle schools: Jackson and Ladd Acres Elementary Schools; Brown and Evergreen Middle Schools ● AVID (Advancement via Individual Determination) at all middle and high schools to encourage academic achievement and college readiness ● AP offered at 3 high schools, IB offered at 1 high school ● Renowned Career and College Pathways program in which we partner with the City of Hillsboro, Chamber of Commerce, higher education and local businesses to offer robust opportunities to students to gain dual credit, participate in career-related learning opportunities, and select focused programs of study to prepare them for their next steps after high school ○ 1,139 students earned dual credit in 2015-16, saving $767,977 in college expenses ● Award-winning community vision plan: Hillsboro 2035 ● Growing, thriving community - home to Intel, Synopsys, Solarworld, Genentech, and many other companies ● Collaborative, planful, forward-thinking government structure that believes in the “Hillsboro Way” of getting things done ● Broad network of parks, cultural arts, and community education opportunities ● Urban renewal and enterprise zone projects to revitalize our community and attract new business investments ● Numerous events to foster community-building: Farmers Markets, Tuesday Night Markets, free concerts in the park, Celebrate Hillsboro, Latino Festival, Proud to be HSD Festival, Hillsboro Hollydays, OrenKoFest, and many more
Facts & Figures District: Fourth-largest of 197 districts in Oregon
(after Portland Public Schools and Salem-Keizer and Beaverton School Districts)
Students
Operations
Washington County
20,293 students* (as of Oct. 7, 2016)
35 schools
574,326 residents (U.S. Census est., July 1, 2015)
4 support sites, 2 athletic fields
65,272 median household income ($)
91 countries of origin represented
3,019,273 square feet of facilities
12.5 percent persons below poverty level
29.9 percent language other than English
554 developed acres
28.6 percent language other than English
46.8 percent non-Hispanic white
155 acres for future school sites (6 properties)
36.7 percent Hispanic (any race)
199 school buses
67.3 percent non-Hispanic white
42.9percent eligible for free and
13,483 average daily student ridership
10,924 in grades K-6; 9,205 in grades 7-12, 164 online (grades 3-12)
spoken at home (89 world languages)
reduced-priced meals
1,665 receive TAG services 2,876 receive special education services 81.7 percent 4-year graduation rate (2015-16) 2.94 percent dropout rate 60.5 percent take at least one AP/IB credit by the end of 11th grade (2015-16)
38.2 percent earned two or more AP/IB
spoken at home
16.4 percent Hispanic (any race) 70.5 percent some college or higher
13,771 miles traveled daily by buses
724 square miles of land
7 communities served: Aloha (partial), Beaverton
2.2 square miles of water
(partial), Cornelius (partial), Hillsboro, North Plains, Portland (partial), Sherwood (partial)
HSD Budget 2016-17 210.7 million operating budget 295.3 million total budget (all funds)
16 cities and towns plus unincorporated areas: Aloha, Banks, Beaverton, Cornelius, Durham,
Forest Grove, Gaston, Hillsboro, King City, Lake Oswego (partial), North Plains, Portland (partial), Sherwood, Tigard, Tualatin (partial), Wilsonville (partial)
222,015 housing units 17.3 percent mobility rate (did not reside in
credits by the end of 12th grade (2015-16)
70 million in state cuts since 2010-11
1,139 earned dual credit (2015-16)
124.3 million in revenues from State School Fund
Employment
67.2 million in revenues from local tax levy
53,392 educational, health,
767,977 dollars in college expenses saved by dual credits earned (2015-16)
STAFF
57.8 percent of operating budget goes
same house as last year)
social services
toward instruction
46,263 manufacturing
2,571 employees (2,384.15 full-time equivalents)
37.1 percent of operating budget goes
36,350 professional and other services
1,168 licensed (1,155.4 full-time equivalents)
82.5 percent of operating budget allocated
(as of Oct.7, 2016)
1,295 classified (1,120 full-time equivalents) 108 administrative, supervisory/technical
(includes 49 principals/assistant principals; total 108.75 full-time equivalents)
99 percent of classes are taught by
highly-qualified staff
toward support services
to staff salaries and benefits
Sources: Hillsboro School District (unless otherwise stated, student data is as of Oct. 7, 2016) American Community Survey (2015 estimate) Oregon Employment Department The Oregonian/Oregonlive.com U.S. Census Bureau Quick Facts (County statistics) 2015-2020 Washington County Consolidated Plan
28,739 retail trade 25,429 arts, entertainment, recreation 3,911 agricultural 4.9 percent unemployment rate (Sept.. 2016) Top 5 private-sector employers: Intel, Nike, Tektronix, Providence St. Vincent Hospital, Columbia
updated Feb. 15, 2017
OVERALL PROGRESS Closing the Gap
targets met
Benchmark Reading - 3rd
47.7%
targets met
Board Priorities at a Glance
➜
4/5 ➜
6/7
This graphic shows the indicators that are School Board priorities and whether performance for each indicator increased or decreased in 2015-16 from the previous school year. In addition, we are measuring the progress in achievement of Hispanic/Latino students in “closing the gap” with all students in the priority areas.
Advanced Diplomas
27.5%
➜
4th Year Cohort Grad
59.6%
➜
Benchmark Math - 8th
81.7%
➜
Benchmark Reading - 5th
45.9%
6 HS Credits - 9th
➜
86.4%
➜
The District uses Key Academic Achievement Indicators to measure students’ progress and to determine how well students are prepared for careers and college upon graduation. Each Indicator represents a snapshot of student achievement. Using the information presented by these snapshots, comprising data from several sources, we create a more meaningful evaluation of how well we serve our students and reach our local and state objectives.
2015-16 Office for School Performance Dayle Spitzer, Assistant Superintendent spitzerd@hsd.k12.or.us Administration Center 3083 NE 49th Place #200 Hillsboro, Oregon 97124-6009 Phone: 503-844-1500 Fax: 503-844-1782 www.hsd.k12.or.us Updated: February 22, 2017
Report of Student
Achievement
Key Academic Achievement Indicators « indicates a School Board priority
« Closing
the Gap
Parity in achievement and on-time graduation between Hispanic/Latino students and all students combined is a strategic priority of the District. Key Indicators are the percentage gaps between all students and Hispanic/ Latino students within the School Board's academic priorities.
Benchmark ELA Throughout the entire K-12 experience, English language arts (ELA) achievement is the essential skill upon which all other academic learning relies. Achievement is measured using the Smarter Balanced test, which replaced OAKS testing in 2014-15.
Benchmark Math Students who are prepared for a high-wage career after high school demonstrate advanced aptitude in mathematics, creative problem solving and critical thinking. Achievement is measured using the Smarter Balanced test, which replaced OAKS testing in 2014-15.
Key Indicators are the achievement scores at all tested grade levels.
Key Indicators are the math achievement score at all tested grade levels. Solid ovals indicate growth from the previous year.
Being in school every day ready to learn is an essential characteristic of a successful student. A Key Indicator is an attendance rate of 94.5% or more at all grade levels. Solid ovals indicate meeting or exceeding the 94.5% rate.
Solid ovals indicate growth from the previous year.
Hispanic/Latino students English Lang. Arts
3rd
2014-15 2015-16
2014-15 2015-16
20.6
18.3
3rd
19.9
16.6
4th
Math
20.6
20.4
5th
9th
14.6
12.0
4-Year Cohort Graduation
6.12
7.60
8th 6 credits
2013-14 2014-15 2015-16
School Year
English Lang. Arts
5th
School Year
School Year
An example of an achievement gap is shown in 3rd-grade ELA, where Hispanic/ Latino students scored 18.3 percentage points below all students in 2015-16. Solid ovals indicate improvement in closing the gap (shown by smaller gap data) compared to the previous year.
«
49.6
47.7
School Year 2014-15 2015-16
3rd
48.8
48.1
K
94.6
94.1
94.1
1st
95.0
94.7
94.7
2nd
95.6
95.2
95.0
3rd
95.7
95.6
95.6
Students taking accelerated or advanced coursework put themselves in a more advantageous position for college acceptance, success and career advancement. Key Indicators are the percentage of students: • Earning six high school credits by the end of 9th grade • Taking at least one AP/IB course by the end of 11th grade • Taking a year of math beyond Algebra 2 by the end of 12th grade • Taking a third-year second language course by the end of 12th grade • Earning two or more high school credits for AP/IB courses by the end of 12th grade.
In addition, we now track the number of students who complete dual credit courses in high school and the amount of college credits earned.
«
6 credits
29.0
22.0
21.0
Aspire English
58.0
56.0
Aspire Math
26.0 74.1
58.4
10th
94.7
2nd Lang 25.1
31.5
28.9
10th
94.2
12th
18.7
32.1
38.2
12th
# students earning
735
996
1139
12th
52.0
47.9
49.6
Total credits earned
NA
5374
5576
Internship #s
321
507
595
39.5
40.7
5th
95.7
95.5
95.6
11th
6th
60.2
56.7
6th
45.8
43.3
6th
95.9
95.6
95.6
7th
58.9
59.1
7th
49.8
48.9
7th
94.8
94.7
8th
55.3
59.0
8th
42.7
45.9
8th
93.7
93.9
31.3
9th
94.4
93.7
94.3
Dual Cr.
43.7
11th
93.0
91.2
92.1
Dual Cr.
43.0
Aspire Math
55.2
5th
Total
64.0
54.6
59.6
57.5
66.0
8th
55.2
57.1
58.0
60.5
9th
Total
Aspire English
49.0
95.7
1+ AP/IB course
Beyond Algebra 2
Math
Third-year
2+ AP/IB credits
Successful students not only commit to high school completion, they do so with detailed plans for post-graduation. College and career-bound students begin planning for their futures when they start school. Key Indicators are the rates at which students: • Graduate high school in four years • Complete high school within five years • Earn a chancellor's diploma • Enroll in post-secondary education within 16 months of graduation. Solid ovals indicate growth from the previous year.
School Year
46.8
95.6
High School Graduation
2013-14 2014-15 2015-16
8th
95.9
11th
Solid ovals indicate growth from the previous year.
86.4
4th
67.5
• Complete a career-related internship.
83.2
47.3
67.4
and the number of students who:
83.3
46.2
11th
• Perform at a college-ready level on standardized college readiness tests at 8th and 10th grades • Complete ACT/SAT testing by the end of 12th grade • Complete the Free Application for Federal Student Aid (FAFSA) by the end of 12th grade.
School Year
4th
27.0
Key Indicators are the percentage of students who:
2013-14 2014-15 2015-16
53.4
«
College preparatory exams, careertechnical programs, and real-life job experience are academic “extensions” of the high school curriculum.
Solid ovals indicate growth from the previous year.
53.8
«
Academic Extensions
Strong Advanced Attendance Coursework
ACT/SAT FAFSA
School Year
2013-14 2014-15 2015-16
«
56.0
4-Year Cohort Graduation 5-Year HS Completion
23.0
20.0
Chancellor's Diploma
«
74.1
78.0
80.7
80.4
81.7
88.4
85.1
85.2
19.2
20.6
27.5
Grad Year
2012-13 2013-14 2014-15 Post-Secondary Enrollment
52.1
54.3
59.3
updated February 22, 2017
2015-16 Hillsboro School District Annual State Report Card Data Summary
English Learners (Students who have ever been eligible for or participated in a program to acquire academic English)
Enrollment
Hillsboro School District Elementary Schools
Economically Disadvantaged (Free/Reduced Lunch qualification; school-wide designations [>95%] based on Provision 2 standards, which remain in place for 3 years)
State Rating (Rating based on
Students with Disabilities
Number of Languages Spoken
K-3
4-5
6-8
9-12
Total
K-3
4-5
6-8
9-12
K-3
4-5
6-8
9-12
K-3
4-5
6-8
9-12
K-3
6,317
20,501
32%
28%
30%
24%
44%
48%
50%
47%
13%
15%
15%
15%
83
4-5
6-8 9-12
52
57
English Language Arts Meets/Exceeds
Overall State Rating
Rating in Comparison to Similar Schools
3-5
6-8
N/A
N/A
53.6%
58.3%
Math Meets/Exceeds
Science Meets/Exceeds
11
3-5
6-8
11
5
67.5%
45.4%
46.0%
31.3%
8
11
Report Card Rating Details
Academic Achievement
Academic Growth
Student Group Growth
6,429
3,163
4,592
Multiple
Multiple
Multiple
Brookwood1
215
118
55
388
22%
100% (CEP)◊
15%
13
48.1%
35.6%
49.1%
Level 3
Level 4
Level 3
Butternut Creek City View Charter
236 97
115 48
53 50
404 195
29% 10%
100% (CEP)◊ 7%
17% 17%
21 9
41.7% 53.1%
38.4% 39.8%
80.8% 69.2%
Level 3 Level 4
Level 3 Level 3
Level 2 Level 2
50% 13%
◊
12% 15%
7 12
40.2% 73.2%
27.6% 61.5%
54.4% 81.1%
Level 3 Level 4
Level 4 Level 5
Level 4 Level 4
◊
Level 4
Eastwood Farmington View Free Orchards
294 173
147 81
65 37
506 291
100% (CEP) 39%
59
a combination of standardized test scores in reading and math; student achievement; student growth; growth of underserved groups)
66.6% 59.0% 57.5%
139
49
403
44%
100% (CEP)
17%
7
42.1%
30.9%
47.4%
Level 3
Level 4
Groner
84
41
31
156
31%
100% (CEP)◊
20%
6
42.9%
34.5%
77.8%
Level 3
Level 4
Level 4
Henry (W.L.) Imlay Indian Hills Jackson Ladd Acres Lenox
201 297 274 303 320 291
87 164 148 166 145 121
57 86 78 65 72 58
345 547 500 534 537 470
76% 19% 21% 6% 20% 19%
100% (CEP)◊ 35% 43% 21% 43% 40%
13% 12% 16% 13% 12% 13%
5 24 22 19 17 24
28.2% 58.7% 68.7% 73.0% 67.7% 69.1%
21.4% 53.8% 59.2% 64.0% 58.3% 63.0%
54.1% 80.0% 78.8% 66.7% 90.0% 77.4%
Level 1 Level 4 Level 4 Level 4 Level 4 Level 4
Level 4 Level 4 Level 4 Level 5 Level 5 Level 4
Level 4 Level 4 Level 4 Level 4 Level 4 Level 4
Lincoln Street
298
166
77
541
62%
100% (CEP)◊
15%
3
27.7%
15.9%
48.8%
Level 2
Level 3
Level 3
McKinney (W.V.)
270
127
63
460
40%
100% (CEP)◊
12%
9
52.2%
42.7%
80.7%
Level 4
Level 4
Level 4
34%
◊
9%
12
50.7%
31.5%
65.0%
Level 3
Level 4
Level 3
◊
6 5 29 11 26
38.3% 71.0% 64.9% 76.0% 63.9%
33.6% 64.2% 51.5% 60.2% 60.1%
55.7% 87.5% 73.6% 88.5% 65.2%
Level 3 Level 4 Level 4 Level 4 Level 4
Level 4 Level 5 Level 3 Level 4 Level 5
Level 4 Level 4 Level 2 Level 4 Level 4
Minter Bridge Mooberry North Plains Orenco Patterson Quatama
215
313 260 171 388 257 278
121
73
143 81 164 123 140
54 50 85 87 63
507
100% (CEP)
457 302 637 467 481
50% <5% 21% 10% 19%
100% (CEP) 34% 35% 28% 41%
11% 16% 10% 11% 17%
Not calculated this year due to the passage of the Every Student Succeeds Act (ESSA) and the expiration of Oregon's ESEA flexibility waiver on August 1, 2016
Reedville1
152
59
36
247
77%
100% (CEP)◊
15%
8
26.2%
20.5%
37.5%
Level 2
Level 4
Level 4
Rosedale Tobias (L.C.) West Union
242 248 206
120 133 102
42 54 53
404 435 361
33% 20% 19%
100% (CEP)◊ 44% 36%
22% 14% 13%
16 17 28
53.9% 63.1% 65.9%
43.1% 59.0% 60.0%
50.9% 70.8% 63.0%
Level 4 Level 4 Level 4
Level 4 Level 4 Level 4
Level 4 Level 4 Level 4
Witch Hazel Middle Schools Brown Evergreen Poynter South Meadows High Schools Century Glencoe Hillsboro (Hilhi) Liberty Alternative Hillsboro Online Academy Miller Education Center
340
141
83
564
54%
100% (CEP)◊
14%
42.4%
31.9%
51.3%
712 798 722 712
27% 28% 27% 41%
1,552 1,586 1,323 1,485 192
47% 45% 51% 59% 21% 22% 33% 22%
13 10% 17% 16% 15%
43% 43% 58% 45%
6%
33%
26 15 20 16 14% 14% 15% 12%
13%
Not calculated this year (see above)
34 16 32 23
Not calculated this year (see above)
69.0% 55.6% 63.3% 50.8%
51.7% 48.2% 52.7% 40.7% 74.8% 68.9% 72.4% 58.5%
60.9% 64.6% 69.3% 41.1% 35.9% 30.4% 30.5% 32.5%
70.4% 46.1% 43.6% 69.0%
5 Not calculated 77.8% 25.8% 62.8% *No report card is generated for Miller Education Center - students' information is reported with their home high school
Student Group Graduation Graduation
Freshmen on Track to Graduate within 4 years
Graduation Completion Dropout Rate Rate Rate
Continuing Education
Multiple
Multiple
86.2%
80.4%
85.1%
2.9%
57.0%
Level 3
Level 4
Level 3
Level 4 Level 4 Level 4 Level 3
Level 4 Level 3 Level 4 Level 3
Level 4 Level 2 Level 4 Level 2
Level 4 Level 4 Level 4 Level 4
Level 4 Level 4 Level 4 Level 3
Level 3 Level 3 Level 3 Level 2
Level 4 Level 4 Level 3 Level 4
Level 4 Level 3 Level 2 Level 4
83.6% 91.1% 83.3% 92.3%
87.1% 85.4% 75.9% 81.7%
90.3% 88.6% 82.0% 91.6%
0.4% 0.5% 0.5% 0.7%
58.9% 63.4% 51.9% 56.0%
Level 4
Level 3
Not Rated
Level 2
Level 2
23.1%
64.8%
69.2%
9.6%
40.0%
1 These schools received a Federal Title I designation of "Focus" in 2011-12. Focus Schools are high poverty schools that were ranked in the bottom 5%-15% of Title I-A schools in the state with a significant achievement gap based on Oregon's rating formula. These schools received additional support to close the achievement gap among historically underserved student populations. In the 2015-16 school year, both received a Tier 2 designation, meaning they have demonstrated moderate improvement since identification and are currently receiving adaptive supports and monitoring from ODE. ◊
CEP stands for Community Eligibility Provision, which is a key provision of The Healthy, Hunger Free Kids Act (HHFKA, Public Law 111-296; December 13, 2010). CEP allows the nation's highest poverty schools and districts to serve meals at no cost to all enrolled students without collecting household applications.
Key to color-coding Overall State Rating and Rating Details
Level 1 = Falls into the bottom 5% of schools Level 2 = Falls between 5% and 15% of schools Level 3 = Falls between 15% and 44% of schools Level 4 = Falls between 44% and 90% of schools Level 5 = Falls into the top 10% of schools
Rating in Comparison to Similar Schools
All other scores
Below average = Falls into the bottom third of comparison schools About average = Falls into the middle third of comparison schools Above average = Falls into the top third of comparison schools
Lower than those of schools with similar demographics Higher than those of schools with similar demographics No color for a data point means that comparison data was not available or not provided
Metadata (data about data, providing additional insights and compilations that highlight important information) Considering categories for which there is comparison data, Hillsboro School District outscores similar districts/schools in ... 2012-13 2013-14 * 2014-15*** 2015-16* District-level categories 12 of 15 (80%) 10 of 16 (62.5%) (-17.5 pts) 5 of 15 (33.3%) (-29.2 pts) 6 of 14 (42.6%) (+9.3 pts) Elementary school categories 54 of 78 (69.2%) 55 of 78 (70.5%) (+1.3 pts) 60 of 78 (76.9%) (+6.4 pts.) 48 of 78 (61.5%) (-15.4 pts) Middle school categories 4 of 12 (33.3%) 5 of 12 (41.7%) (+8.4 pts) 7 of 12 (58.3%) (+16.6 pts.) 7 of 12 (58.3%) (Flat) High school categories 28 of 36 (77.8%) 38 of 47 (80.9%) (+3.1 pts.) 30 of 45 (66.7%) (-14.2pts.) 23 of 40 (57.5%) (-9.2 pts)
*New district-level category for 2013-14: Freshmen on Track; # of students taking SAT not on report in 2015-16
Overall State Rating 2012-13 Level 5 schools: 0 Level 4 schools: 13 Level 3 schools: 19 Level 2 schools: 0 Level 1 schools: 2
2013-14 ** Level 5 schools: 0 ( - ) Level 4 schools: 17 (+4) Level 3 schools: 14 (-5) Level 2 schools: 3 (+3) Level 1 schools: 1 (-1)
2014-15 & 2015-16 Not calculated Not calculated Not calculated Not calculated Not calculated
**Hillsboro Online Academy Information added in 2013-14
Rating in comparison to similar schools 2012-13 2013-14 ** Above Average: 10 Above Average: 13 (+3) Average: 13 Average: 13 ( - ) Below Average: 11 Below Average: 9 (-2)
2014-15 & 2015-16 Not calculated Not calculated Not calculated
***No writing exam for 11th grade in 2014-15
To see the report cards for Hillsboro School District and each school, please visit our website at www.hsd.k12.or.us and select School & District Report Cards under the Academics drop-down menu. Alternatively, you may visit the Oregon Department of Education website at www.ode.state.or.us, select Reports then Report Cards. There, you can also find additional information on terminology, calculations, answers to frequently asked questions, and more.
October 14, 2016
STUDENT
Student Achievement Recap & Highlights
Students
All students are engaged and challenged throughout their K-12 experience and leave our system fully prepared for their next step in life, be that career, college, military, or other educational or civic opportunity. Situational analysis: The needs assessment conducted in 2015-16 revealed that our students want more from us. They come to school wanting to learn, needing to build relationships and feel valued, and seeking the support they need to make significant life decisions around post-secondary options. Our first year of SBAC testing (in 2015) was challenging, but we’re hopeful that 2016 results will show improvement and that students feel they’re able to demonstrate their knowledge and skills through the test. Key focus areas: • Share needs assessment results with staff and building administrators
• Ensure students are at the center of all work being done
• Make relevant connections between what is being learned in the classroom and how that is important in the “real world” • Ensure students are engaged in their coursework and have the opportunity to learn at the rate and level that is appropriate for them.
• Have students in grades 6-12 write, then review and revise their Career and College Plan (via Naviance) at least twice yearly
• Infuse practical teaching to academic learning whenever possible (e.g. how will this help a student function in society?)
Strategic Plan bit.ly/1boYIso Hillsboro students are graduating at approximately the same rate as they have been in past years: 80.42%. However, more of those students are leaving our system prepared for future success. In 2015, 936 student earned 5374 college credits through dual credit courses, as compared to 735 students earning 4326 credits in 2014. We also saw a 1.2 percentage point increase in the number of students enrolling in a post-secondary program (54.3% for 2013-14 grads vs. 52.1% for 2012-13 grads) in the most recent years information is available. The 2014-15 school year was the first in which Smarter Balanced tests replaced OAKS tests for English language arts and Math. In most categories, Hillsboro students outperformed the state average, with 8th grade performance being a notable exception in both categories. Math performance in 11th grade is also a concern. We’re hopeful that 2016 results will show improvement and that students feel they’re able to demonstrate their knowledge and skills through the test.
• Continue to focus on regular attendance
Annual Work Plan & SMART Goals
STUDENT
EQUITABLE Experience & Outcomes
In str TM
Lea r ni
• Work toward every student having a specified adult advocate to support their school success—every child is known by name, strength, need, interest, and aspiration
• Increase opportunities for college and career planning, and career-related learning; continue to seek feedback from students about their experiences in school
2016-2021
uct
ion
ng E
n
nm vir o
en
ts
ing arn e L r p fo rshi Leade tion niza a g r O
3083 NE 49th Place Hillsboro, OR 97124 503.844.1500
www.hsd.k12.or.us 081716
nce rna Gove
Strategic Planning Page
bit.ly/21HcVcB
2016-2017 Implementation Plan Introduction The vision for the District’s 2016-2021 Strategic Plan is to have it encompass three elements: 1) The overarching plan, which should remain consistent over the five years; 2) The annual Report of Student Achievement (Key Academic Achievement Indicators); and 3) The Annual Work Plan and SMART Goals. Taken together, these three documents should provide a comprehensive snapshot of the District’s mission, strategic objective, beliefs, key initiatives, student achievement progress, and implementation plans and goals at any given time.
Key District Initiatives Of course there are many aspects to the work at hand in a school district; however, the following represent our primary focus areas. • 5 Dimensions of Teaching and Learning: Purpose; Student Engagement; Curriculum and Pedagogy; Assessment for Student Learning; Classroom Environment and Culture. • Professional Learning Communities: Purposeful collaboration around specific topics to analyze data and implement positive change. • Bilingual Program Model: Dual Language, schoolwide English language development, and sheltered instruction. • Inclusion of diverse learners. • Equity: Ensuring there are equitable practices in place to affect equitable outcomes for all students. • Career & College Pathways: Ensuring students are aware, eligible, and prepared for opportunities after high school. • Technology: Building our technology infrastructure so students have access to 21st century tools to prepare them for their future. • Clear, consistent communications. • Responsible budgeting and long-range planning. • Hiring and retaining the highest quality staff possible.
Layers of Focus What follows is additional information about each of our six layers of focus as we strive to maximize the outcomes and educational experience of our students. Each area will feature a situational analysis and executive summary of the work that will take place over the coming year.
STUDENT
Instruction
Highly qualified staff deliver relevant, rigorous, and engaging curriculum; and students have access to a variety of meaningful co- and extracurricular activities Situational analysis: There are exceptional things happening in our district, but they are not consistent and predictable. Effective differentiation and personalized learning remain key skills and strategies to be fostered to meet the needs of all learners. Key focus areas: • Continue focusing on effective Professional Learning Community (PLC) practices and improving outcomes for diverse learners • Align instructional practices K-12 to the Five Dimensions of Teaching and Learning • Evaluate and support the implementation of key instructional strategies • Support PLCs in using assessments to evaluate and drive instructional decisions • Offer a variety of professional development opportunities to support staff in their delivery of high quality, highly engaging curriculum • Increase opportunities for students to participate in school- or community-based clubs, activities, or athletics
SMART Goals Though there is much work to be done in all areas of the District to ensure we continually maximize the educational experience of our students, the following represent the top system objectives for the 2016-17 school year.
Key (goal connects to the focus areas indicated) SO Strategic Objective IN Instruction LE Learning Environment
LL Leadership-Learning OR Organization GV Governance
STUDENT
LEARNING ENVIRONMENT
STUDENT
Leadership for Learning
All students feel valued, appreciated, and safe at school, both physically and emotionally. They have access to engaging and relevant curriculum, and are presented with clear pathways and multiple opportunities to develop skills and identify interests for their future careers.
Building administrators are instructional leaders who ensure that all staff members are continually learning, growing, and developing their skills so they can deliver instruction in the most effective and engaging manner possible.
Situational analysis: Student learning environments should be relevant, culturally-responsive, and support clear pathways to career. Additionally, they should be safe spaces where students feel accepted and comfortable making and learning from mistakes. There are student-led anti-bullying teams at each middle school and high school, and there are an increasing number of staff members utilizing PAX Good Behavior Game, Positive Behavior Support, Growth Mindset, or a combination of these approaches to ensure students learn and grow in respectful environments that help them flourish and achieve at high levels.
Situational analysis: Our building principals are the key instructional leaders in their schools. Therefore, time spent at K-12 meetings, in administrative PLCs, and hosting building-level classroom walkthroughs and observations enhance their ability to lead for increased student achievement.
Key focus areas: • Strengthen student-led efforts to improve positive culture and climate at the middle and high school levels
• Have principals present their academic conference materials and accountability reports to peers and district-level administrators annually
• Support and enhance the Positive Behavior Systems at elementary schools • Ensure staff increasingly reflect the racial and ethnic diversity of students • Support and offer professional development for teachers to create relevant, culturally responsive lessons and units to engage all students
Quantitative Goals
• Increase SBAC math scores by 3% for all students,
and by 5% for underserved students (Latino students, English learners, and/or students with special needs), as measured by 2016 SBAC scores (vs. 2015) SO, IN
• Increase cohort graduation rate from 80.42% to 82% for all students, as measured by 2016 graduation rates SO, IN
• Increase by 10% the number of prioritized highlyeffective strategies utilized by teachers in the
Key focus areas: • Implement best practices: University of Washington Center for Educational Leadership (CEL), Oregon Center for Educational Equity, AVID, and understanding quality instruction through the lens of the Five Dimensions of Teaching and Learning
• Ensure that four identified high-level instructional strategies in the areas of purpose, engagement, and assessment are consistent throughout the District’s classrooms • Ensure teacher leaders affect instructional improvement through PLCs and site-based instructional trainings • Provide classified staff opportunities to improve their skills in support of students’ differentiated needs
classroom, as measured by the pre and post districtwide walkthrough data from spring 2016 and winter 2016 LE, LL
• Increase by 10% each the number of students partic-
ipating in community-based internships and earning dual credit by the end of their 12th grade year, using data gathered as of June 2016 IN, LL
• Increase by 5% the number of English learners
earning six high school credits by the end of their 9th grade year, using data gathered as of June 2016 IN, LL
STUDENT
Organization
All internal elements of the system function as responsibly and efficiently as possible. From budgeting to long-range planning to facility maintenance to human resources management to nutrition services to technology to communications and transportation, the strength of these organizational elements is critical to creating an environment where effective teaching and learning can occur. Situational analysis: Each department strives to function effectively and efficiently to provide the best possible support to schools. Key focus areas: • Maximize budget allocations to support student and staff needs • Plan for a future bond • Strengthen technology infrastructure and replace aging hardware—specifically, increase wireless access point density at half of our elementary schools • Hire and retain high quality staff members, with an eye toward increasing racial, cultural, and linguistic diversity • Conduct meaningful professional development • Provide relevant, timely and accurate information to stakeholders and provide multiple opportunities for them to share their feedback • Conduct a community analysis to learn more about what patrons need and expect from schools, as well as their willingness to support tax increases for schools (in the form of a local option levy and/or a construction bond)
• Increase by 100 the number of staff who have participated in equity-focused professional development in 2016-17 vs. 2015-16 OR, GV
• Achieve a 5% increase in highly-qualified multilin-
gual/multicultural staff hired in 2016-17 vs. 2015-16 OR, GV
Process Goals
• Strengthen student-led efforts to improve positive culture and climate at the middle and high school levels as evidenced by establishing a student-led
STUDENT
Governance
Public schools are a resource and responsibility of the people, and therefore require the support and oversight of the communities in which they exist. Situational analysis: Elected school board members represent the governing body of school districts and positively affect equitable student experiences and outcomes by creating the conditions necessary for success through the setting of policy and vision, appointing the superintendent, allocating resources through budgeting, and continually reviewing data. They also commission committees to provide additional citizen input to items or projects of critical importance such as the Citizens Curriculum Advisory, Budget, and Long Range Planning Committees. Key focus areas: • Stay abreast of all key initiatives of the District • Act as champions of the District and help share accurate information with stakeholders • Approve the District’s Facilities Plan • Commission the creation of a Citizen Bond Oversight Committee to review and assess District facility and infrastructure needs in preparation for a future bond request • Decide when and how to approach the community about supporting a future bond request(s)
social media governance team by the end of February 2017 LE, OR
• Convene a citizen bond oversight committee and
develop at least two versions of a bond package for District residents to consider by the spring of 2017 (for a fall 2017/spring 2018 ballot) OR, GV
• Hold a Schools Summit in March 2017 to share
the District’s annual report and achievement metrics with a broad representation of stakeholders OR, GV
NW No
NW
lvetia Rd
Co rne lius
4
Bu rkh
35
Miller Education Ctr. West 440 SE Oak St. Hillsboro, OR 97123 503.844.1680
Hilhi 3285 SE Rood Bridge Rd. Hillsboro, OR 97123 503.844.1980
36
Miller Education Ctr. East 215 SE 6th Ave. Hillsboro, OR 97123 503.844.1000
OTHER DISTRICT BUILDINGS
Map B 8
Tualatin Valley Hwy
S Alpine St S Beech St
S Cherry St
Administration Center 3083 NE 49th Place Hillsboro, OR 97124 503.844.1500
40
Facilities & Support Services 4901 SE Witch Hazel Rd. Hillsboro, OR 97123 503.844.1320
41
Hare Field 1151 NE Grant St. Hillsboro, OR 97124 503.844.1320
10
Rd ton ming S W Far
eF lat R d
S Dogwood St
Hillsboro Online Academy (HOA, grades 3-12) and Peter Boscow Conf. Ctr. 42 City of Hillsboro 452 NE 3rd Ave. Parks & Recreation/ Hillsboro, OR 97124 Hillsboro Stadium 503.844.1050 4450 NW 229th Ave. Hillsboro, OR 97124 503.681.6120
Cornelius
5
Free
E Baseline
Orchards SW Laurel Rd
NW 206th Ave
NW 185th Ave SW 185th Ave
206th
ama
2
n
Butternut Creek
Ave
SW 198th Ave
S
n Rd
ingto
rm W Fa
S
SW 185th Ave
McInnis
10
Gassner Kemmer
SW Tile Flat Rd
S Alpine St
SW
Riv
S Beech St
er R
d 210
Groner 6 Rd
Glencoe 2700 NW Glencoe Rd. Hillsboro, OR 97124 503.844.1900
S 23rd
32
Blanton
10
10
219
S 21st
Liberty 21945 NW Wagon Way Hillsboro, OR 97124 503.844.1250
S 20th Ave
34
Aloha
8 Blanton
alter Rd
Til
Century 2000 SE Century Blvd. Hillsboro, OR 97123 503.844.1800
SW Johnson
Reedville
SW Rosedale Rd
SW
31
SW Rock
Indian Hills
Kinnaman Kinn
Farmington View SW Unger Rd
HIGH SCHOOLS
9
190th
SW
Tobias
SW Grabhorn Rd
Miller Education Ctr. (7/8) 560 SE 3rd Ave. Hillsboro, OR 97123 503.844.1240
W Baseline
SW 209th
30
y
SW Clark Hill Rd
Groner K-8 23405 SW Scholls Ferry Rd. Hillsboro, OR 97123 503.844.1600
26
Pkw
Tanasbourne
21
SW 229th Ave
6
SW Rosa Rd
een
Beaverton
toddard
22
SE 67th Ave
Witch Hazel
25
rgr
23
SE Johnson
SE Davis Rd
33
lvd
Eve
SW 198th
CENTURY Ladd Acres 42 8
Scholls Ferry
South Meadows 4690 SE Davis Rd. Hillsboro, OR 97123 503.844.1220
219
NW Cornelius Pass Rd
225th
NE
Century Croeni
31
Cree
W Baseline
ny tho An
S E Ce ntury Blvd
SE Imlay
wy
Brown 26
SE Frances
o ck
NW Co rnell Rd
Orenco
n Rd
Portland
SW 205th
NE Shute Rd
B rook w
29th NW2 18
Dogwood
Facilities
South 29 Meadows
NW Cornelius Pass
235th
NW 231st Ave
Birch
gville Sprin
st Unio
NW
Quatama
SE Lois
Imlay 8
8 Tualatin Valley H el Rd 38 Haz itch
20
C ampus
NE Brookwood
Bentley
NW
Cen tury
NW H e
NW G
NE 25th Ave
Orenco Station
SE Borwick
SW Brookwood
NE 15th Ave
17th
17th
NE 28th Ave
SE 32nd
SE 24th
10th
on School Rd
3rd
a c ks
10th
18th
que
Minter Bridge HILHI
J.W. Poynter 1535 NE Grant St. Hillsboro, OR 97124 503.844.1580
Old Corne l ius Pass
d Dic kR
d nd R rovela
NW Jackson School Rd
18th
SE Cedar St 1
NW
NE Butler St
SE Baseline St
Brookwood
Rd
NW We
Lenox
12
42 Hillsboro Stadium
d
29
Transportation Services 1220 SW Walnut St. Hillsboro, OR 97123 503.844.1123
SE Riv er R
15 lin
Admin. Center
SW Rive rR
Evergreen 29850 NW Evergreen Rd. Hillsboro, OR 97124 503.844.1400
39
7 Spruce Cypress
Jac
SW Hillsboro Hwy
27
38
W.L. Henry
Dr
wy
37
E Main St
aks
LIBERTY
Ben nett
Rosedale
28
37
Eastwood
5O
SW Tongue Ln
Brown 1505 SW Cornelius Pass Rd. Hillsboro, OR 97123 503.844.1070
33
Maple
Hillsboro
219
3
Oak
MEC 7/8 MEC MEC West East
Witch Hazel 4950 SE Davis Rd. Hillsboro, OR 97123 503.844.1610
Lincoln Street 801 NE Lincoln St. Hillsboro, OR 97124 503.844.1160
Grant
Lincoln
Cedar
30
Poynter
Wago 34
26
SW Cornelius Pass Rd
lencoe Rd
ordon Rd NW G
West Union 23870 NW West Union Rd. Hillsboro, OR 97124 503.844.1620
MIDDLE SCHOOLS 26
Walnut
Cornell Rd
W
25
39
28
13 Street E Main St 36
35
Transportation
L.C. Tobias 1065 SW 206th Ave. Aloha, OR 97003 503.844.1310
40
Pk ood
Pa
NW Jacobson Rd
nell Rd N E Cor
SW Rood B ridge Rd
Lenox 21200 NW Rock Creek Blvd. Portland, OR 97229 503.844.1360
41 HOA
Baseline
Map B
Field
Lincoln St
8 Oak
Mooberry
21st
24
E Main St
16
Arrin gto n Hare
Gran t St
y
Hobbs
13
Ladd Acres 2425 SW Cornelius Pass Rd. Hillsboro, OR 97123 503.844.1300
14
Darnielle
t K athryn S Sunrise Ln
d
12
23
Rosedale 3901 SE 67th Ave. Beaverton, OR 97078 503.844.1200
d rewo o Ha
Griffin Oaks
SW Minte r Br idge Rd
11
Jackson 675 NE Estate Dr. Hillsboro, OR 97124 503.844.1670
McKinney
Reedville 2695 SW 209th Ave. Aloha, OR 97003 503.844.1570
Jackson
Hillsboro Airport
S 28th Ave
10
22
Cory
Quatama 6905 NE Campus Way Hillsboro, OR 97124 503.844.1180
10
Estate
32
6th
21260 SW Rock Rd. Aloha, OR 97003 503.844.1350
GLENCOE
St Len ox
Hw
NW Evergreen Rd
Evergreen
S 27th Ave
9 Indian Hills
21
Patterson
27
19
NE J
5900 SE Lois St. Hillsboro, OR 97123 503.844.1090
NW Hornecker Rd
NW Evergreen Rd
3rd 4th 5th
8 Imlay
Paul L. Patterson 261 NE Lenox St. Hillsboro, OR 97124 503.844.1380
set
ss
Huffman
SW Minter Bridge Rd
1060 SE 24th Ave. Hillsboro, OR 97123 503.844.1690
20
Orenco 22550 NW Birch St. Hillsboro, OR 97124 503.844.1370
N 26th
7 W.L. Henry
NW Wren Rd
S Webb Rd
23405 SW Scholls Ferry Rd. Hillsboro, OR 97123 503.844.1600
19
Sun
24
Germantown
kB
6 Groner K-8
18
West Union
R
2499 S Beech St. Cornelius, OR 97113 503.844.1140
26
NW Meek Rd
Connell Ave
5 Free Orchards
y
NW Scotch Church
Mooberry 1230 NE 10th Ave. Hillsboro, OR 97124 503.844.1640 North Plains 32030 NW North Ave. North Plains, OR 97133 503.844.1630
Hw
ay nW
8300 SW Hillsboro Hwy. Hillsboro, OR 97123 503.844.1735
17
NW Zion Church
N 1st Ave
4 Farmington View
16
set
SW Hillsboro Hwy
2100 NE Lincoln St. Hillsboro, OR 97124 503.844.1725
Sun
S 25th
3 Eastwood
Minter Bridge 1750 SE Jacquelin Dr. Hillsboro, OR 97123 503.844.1650
26
NW Glencoe Rd
20395 SW Florence St. Aloha, OR 97078 503.844.1390
15
W. Verne McKinney 535 NW Darnielle St Hillsboro, OR 97124 503.844.1660
NW G
2 Butternut Creek
14
d nR
3960 SE Cedar St. Hillsboro, OR 97123 503.844.1715
nio tU
1 Brookwood
NW Phillips Rd
es W
ELEMENTARY SCHOOLS
NW West Union Rd
NW
North Plains
NW Dick Rd
North Plains
Jac kso n
Qu
arr
y
rth Ave
17
219
SW
219
210
SW Scholls Ferry Rd
Scholls Century Feeder Group Glencoe Feeder Group Hilhi Feeder Group Liberty Feeder Group updated 4/16/15
OREGON AT-A-GLANCE DISTRICT PROFILE Hillsboro SD 1J
2018-19
SUPERINTENDENT: Mike Scott | 3083 NE 49th Pl, Hillsboro 97124 | 503-844-1500
Students We Serve
Start Strong
20,221 Student Enrollment
Academic Progress
Grades K-2 REGULAR ATTENDERS
Grade 3 ENGLISH LANGUAGE ARTS
Grades 3-8 INDIVIDUAL STUDENT PROGRESS
Students who attended more than 90% of their enrolled school days.
Students meeting state grade-level expectations.
Year-to-year progress in English language arts and mathematics.
DEMOGRAPHICS
Decrease from previous year
Decrease from previous year
2%
2%
American Indian/Alaska Native Students
1%
Teachers
1%
Asian Students
7%
Teachers
3%
87%
44% Oregon average
Black/African American
Oregon average
83%
47%
Students
2%
Teachers
1%
High School Success
Students
38%
Teachers
10%
Grade 8 MATHEMATICS
Grade 9 ON-TRACK TO GRADUATE
Grade 12 ON-TIME GRADUATION
Students meeting state grade-level expectations.
Students earning one-quarter of graduation credits in their 9th grade year.
Hispanic/Latino
Multiracial Students
7%
Teachers
1%
Native Hawaiian/Pacific Islander Students
1%
Teachers
1%
White Students
45%
Teachers
85%
30%
Languages Spoken
16% 13% 57% Students with Disabilities
Mobile Students
Free/ Reduced Price Lunch
Increase from previous year
1%
3%
1%
38%
92% Oregon average
135
Ever English Learners
Decrease from previous year
Students earning a diploma within four years. Cohort includes students who were first-time ninth graders in 2014-15. Increase from previous year
39%
85% Oregon average
85%
Oregon average
79%
District Goals
State Goals
HSD's goal is to ensure that all students graduate with career and college-readiness skills. We will do this by: knowing each student by name, strength, and need so they can benefit from supports, enrichments, and opportunities; fostering a positive, supportive, and inclusive school and classroom culture that enables learning; and providing learning experiences with clear purpose, engagement, and assessment to encourage students' active participation and to provide them with an opportunity to demonstrate their knowledge and skills.
The Oregon Department of Education is partnering with school districts and local communities to ensure a 90% on-time, four year graduation rate by 2025. To progress toward this goal, the state will prioritize efforts to improve attendance, provide a wellrounded education, invest in implementing culturally responsive practices, and promote continuous improvement to close opportunity and achievement gaps for historically and currently underserved students.
*<10 students or data unavailable
District Website: www.hsd.k12.or.us
For more information please visit: www.oregon.gov/ode/reports-and-data/
OREGON AT-A-GLANCE DISTRICT PROFILE CONTINUED Hillsboro SD 1J
2018-19
SUPERINTENDENT: Mike Scott | 3083 NE 49th Pl, Hillsboro 97124 | 503-844-1500
Our Staff (rounded FTE)
54
Administrators
Outcomes
79%
American Indian/Alaska Native
Teachers
83%
Hispanic/Latino
Educational assistants
Ever English Learner
83%
Students with Disabilities
83%
86%
Non-Binary <10 students or data unavailable
9
81%
Average Average Average
13%
Average 86% 46%
Average <10 students or data unavailable
Grade 9 ON-TRACK TO GRADUATE 64%
93%
Hispanic/Latino
21%
88% 49%
33% 49%
90% 90%
93% 88%
Ever English Learner
22%
88%
15%
Data are suppressed to protect confidential student information.
Female Male
86% 81% Data not available
83% >95%
Talented and Gifted
% of licensed teachers with more than 3 years of experience
86% 80%
>95%
22% 14%
93%
94%
Free/Reduced Price Lunch
Migrant
75%
>95%
21%
Students with Disabilities
Grade 12 ON-TIME GRADUATION
93%
Black/African American
White
High Average
42%
30%
Asian
Multiracial
Psychologists
31%
<10 students or data unavailable
Grade 8 MATHEMATICS
Native Hawaiian/Pacific Islander
Licensed Librarians
Average
>95% 88%
1
59%
27%
Male
American Indian/Alaska Native
Average
22%
Female
Counselors
Average
58%
86%
Migrant Talented and Gifted
67
58%
84%
Free/Reduced Price Lunch
High Average
89%
White
466
44%
80%
Native Hawaiian/Pacific Islander
High
23% 89%
Multiracial
Average
60%
95%
Black/African American
Grades 3-8 INDIVIDUAL STUDENT PROGRESS
<10 students or data unavailable
92%
Asian
973
Grade 3 ENGLISH LANGUAGE ARTS
Grades K-2 REGULAR ATTENDERS
41%
85%
>95%
99%
93%
36%
Non-Binary <10 students or data unavailable
71% 89%
86%
91% Coming in 2019-20
83% Coming in 2019-20
Seismic Safety: http://www.oregongeology.org/sub/projects/rvs/activity-updates/status.html
Utilities Local Business Medical Recreation Restaurants Shopping Social Services
Utilities
5008 SW 207th Pl. Beaverton, OR. 97078 ELECTRICITY Portland General Electric
800-542-8818
https://portlandgeneral.com
NATURAL GAS NW Natural
800-422-4012
http://nwnatural.com/
TV/INTERNET/PHONE BUNDLES Comcast/Xfinity
800-934-6489
http://www.xfinity.com
Verizon
800-483-4100
http://www.verizon.com
DirectTV Programming
877-952-6072
https://www.directv.com/
UNITED STATES POSTAL SERVICE General
800-ASK-USPS
https://www.usps.com
Change-of-Address
800-ASK-USPS
https://moversguide.usps.com/ mgo/move-info
GARBAGE/RECYCLING Waste Management
800-808-5901
WATER SERVICE Tualatin Valley Water
SEWER SERVICE
503-848-3000
COUNTY RESOURCES https://sos.oregon.gov/blue-book/ Pages/local-county.aspx
Clean Water Services
503-681-3600
CITY RESOURCES http://www.oregoncities.us/
Informa on deemed reliable but is not guaranteed
Directory of Services Major Airlines Serving Portland Interna onal Airport Alaska……………………………...….1-800-252-7522 American…………………………....1-800-433-7300 Delta……………………………….....1-800-221-1212 Hawaiian……………………….…...1-800-367-5320 Horizon……………………………....1-206-241-6757 Jet Blue……………………………....1-800-538-2583
Major Area A(rac ons Bonneville Dam………………………………(541) 374-8442 Children’s Museum…………………………(503 223-6500
9200 SE Sunnybrook Blvd, Suite 180
Columbia Gorge Interpre ve Ctr……..(800) 991-2338
Clackamas, OR 97015
The Gro>o Sanctuary………………………(503) 254-7371
Telephone:……………(503) 290-5510
Japanese Gardens……………………………(503) 223-1321 Mt Hood Scenic Railroad…………………(541) 386-3556 Mt. St Helen’s Visitor’s Center………...(360) 274-0962
United………………………...……...1-800-241-6522
Mt. Hood Meadows…………………………(503) 337-2222
Malls & Shopping Centers
Mt. Hood Ski-Bowl……………………….…1(800) 754-2695
Columbia Gorge Outlet Mall...(503) 669-8060 Clackamas Town Center….......(503) 653-6913 Jantzen Beach Center…………...(503) 286-9103 Lloyd Center…………………….…..(503) 282-2511
Clackamas Office
City of Portland Informa on……………(503) 823-4000
Southwest……………………..…...1-800-435-9792
Beaverton Mall……………………..(503) 643-6563
Stewart Title Loca ons
Services
Downtown Office
Compliments of
1000 SW Broadway, Suite 1600
Oregon historical Society Museum….(503) 222-1741 Oregon Symphony Orchestra…………..(503) 228-1353
Portland, OR 97205
Pearson Air Museum……………………….(360) 693-0115
Telephone…………….(503) 290-5500
Pi>ock Mansion……………………………….(503) 823-3623
Fax………………………..(866) 557-1353
Portland Art Museum………………………(503) 226-2811
Pioneer Place………………….…...(503) 228-5800
Portland Saturday Market……………….(503) 222-6072
Lake Oswego Office
Washington Square………........(503) 639-8860
Rose Garden Arena………………………….(503) 235-8771
5005 SW Meadows Rd, Suite 120
Major Hospitals & Medical
Skamania Lodge Hotel……………………..(509) 427-7700
Lake Oswego, OR 97035
Good Samaritan………………….(541) 768-5111 Kaiser Permanente……………..(503) 652-2880
Sternwheeler Columbia Gorge………..(503) 224-3900 Timberline Lodge & Ski Area…………..(503) 272-3158 World Forestry Center…………………….(503) 228-1367
Experience the difference
Fax………………………..(866) 605-8319
Clackamas………………...(503) 290-5510
The Oregon Zoo……………………………...(503) 226-7627
Downtown………………..(503) 290-5500 Sunset Office
Oregon Health Sciences ……...(503) 494-8311
Broadmoor Golf Course…………….…….(503) 281-1337
1915 NW Amberglen Pkwy #100
Portland Adven st……………...(503) 257-2500
Claremont Golf Club………………........…(503) 690-4589
Portland VA………………………...(503) 220-8262
East Moreland…………………………….…..(503) 775-2900
Providence…………………………..(503) 215-1111
Local Community Centers East PDX Community Ctr……..(503) 823-3450
Stewart is here.
Telephone…………….(503) 290-5590
Public Golf Courses & Ranges
Legacy Emanuel…………………..(503) 413-2200
For every step of the real estate transac on
Portland Ctr for Performing Arts……..(503) 248-4335
Doernbecher Childrens….…....(503) 494-8811
Of
Fax………………………..(866) 605-8313
Nike Town……………………….…..(503) 221-6453
Centers
Directory
Lake Oswego……..……..(503) 290-5590
Beaverton, OR 97006
Sunset…………….…….…..(503) 290-5522
Evergreen Golf Course…………………....(503) 845-9911
Telephone…………….(503) 290-5522
Customer Resources….(503)-290-5555
Glendoveer Golf Course………………....(503) 253-7507
Fax………………………..(866) 605-8319
www.Stewart.com/Portland
Heron Lakes Golf Course………………...(503) 289-1818
YMCA…………………………………..(503) 492-9890
Lake Oswego Golf Course……………....(503) 636-8228
Oak Hills Recrea on Ctr.………(503) 645-4303
Springwater Golf Course………………...(503) 630-4586
Shute Park Aqua c & Rec Ctr.(503) 681-6127
Stone Creek Golf Club……………………..(503) 518-4653
Directory of Services Cable Providers
Water/Sewer
Comcast…………………………….1(888) 824-8264
Aloha (clean water services)………(503) 681-3600
Beaverton…………………………………..503) 591-8000
DISH…………………………………..1(800) 823-4929
Beaverton………………………………….(503) 526-2257
Canby………………………………………..(503) 266-7861
Fron er……………………………..1(877) 529-3319
Clackamas………………………………….(503) 742-4567
Centennial………………………………….(503) 760-7990
Verizon……………………………...1(800) 837-4966
Colton……………………………………….(503) 824-3535
Wave Broadband……………….1(866) 209-3123
Public School Districts Banks………………………………………….(503) 324-8591
Corbe>………………………………………(503) 695-3636
Tax Assessors
Culver…………………………………………(541) 546-2541 David Douglas…………………………….(503) 256-6500
Clackamas…………………………….(503) 655-8671
City Offices
Post Office
Aloha
(503) 846-8611
(503) 848-3919
Beaverton
(503) 526-2222
(503) 643-5263
Damascus…………………………………..(503) 742-4567
Clackamas
(503) 742-4400
(503) 657-9358
Fairview……………………………………..(503) 674-6215
Damascus
(503) 658-8545
(503) 663-0289
Fairview
(503) 665-7929
(503) 669-3010
Forest Grove
(503) 992-3200
(503) 357-7247
Forest Grove………………………………(503) 992-3221 Gladstone…………………………………..(503) 557-2771 Gresham…………………………………….(503) 618-2373
Estacada…………………………………….(503) 630-6871
Multnomah……………………………(503) 988-3326
Happy Valley (Sunrise Water).……(503) 761-0220
Gresham
(503) 618-2660
(503) 665-2663
Forest Grove………………………………(503) 357-6171
Washington…………………………..(503) 846-5800
Hillsboro………………………………….…(503) 681-6163
Happy Valley
(503) 783-3800
(503) 657-9358
Gaston……………………………………….(503) 985-7516
Electricity
Lake Oswego………………………….…..(503)635-0265
Hillsboro
(503) 681-6100
(503) 614-9516
Gresham-Barlow………………………..(503) 618-2450
*Two providers service Clackamas/Multnomah/ Washington Coun es
Milwaukie………………………………….(503) 786-7525
Lake Oswego
(503) 635-0270
(503) 675-4500
Hillsboro…………………………………….(503) 844-1500
North Plains……………………….………(503) 647-5555
Lake Oswego……………………………..(503) 534-2000
PGE……………………………………1(800) 542-8818
Oregon City………………………………..(503) 657-8151
North Plains
(503) 647-5555
(503) 647-2612
Molalla River……………………………..(503) 829-2359
Pacific Power……………………..1(888) 221-7070
Portland…………………………………….(503) 823-7770
Oregon City
(503) 657-0891
(503) 722-2086
West Oregon Electric…………..(503) 429-3021
Rockwood…………………………………(503) 665-4179
Portland
(503) 823-4444
(503) 282-0950
Sandy…………………………………………(503) 668-7449
Sandy
(503) 668-5533
(503) 668-4055
Sherwood
(503) 625-5522
(503) 625-2512
Tigard
(503) 639-4171
(503) 968-6763
Tuala n……………………………………..(503) 692-2000
Troutdale
(503) 618-0529
(503) 661-5490
Multnomah……………………………….(503) 255-1841 North Clackamas……………………….(503) 353-6000 Oregon City……………………………….(503) 785-8000 Oregon Trail………………………………(503) 668-5541
Natural Gas Services
Parkrose…………………………………….(503) 408-2100
NW Natural………………………1(800) 422-4012
Sherwood…………………………………..(503) 925-2315 Tigard…………………………………………(503) 639-4171 Troutdale…………………………………..(503) 665-5175
Portland…………………………………….(503) 916-2000 Reynolds……………………………………(503) 661-7200
Phone Services:
Vernonia……………………………………(503) 429-5291
Tuala n
(503) 692-2000
(503) 692-6846
Sherwood…………………………..……..(503)825-5000
AT&T………………………………..1(800) 222-0300
West Linn………………………………….(503) 656-4261
West Linn
(503) 657-0331
(503) 650-1863
Qwest/Century Link………….1(800) 244-1111
Wilsonville………………………….…….(503) 682-4092
Wilsonville
(503) 682-1011
(503) 570-7703
Verizon……………………………..1(800) 483-4000
Wood Village…………………………….(503) 667-6211
Wood Village
(503) 667-6211
(503) 661-5490
Tigard-Tuala n………………………….(503) 431-4000 West Linn-Wilsonville………………..(503) 673-7000
Voter Registra on Clackamas County……………..….....(503) 655-8570 Multnomah County……………….....(503) 988-3720 Washington County…………..........(503) 846-5800
Transporta on
Sanita on & Recycling
Tri-met…………………………(503) 238-7433
Clackamas………………………………...(503) 557-6363 Columbia…………………………………..(503) 249-8078
Animal Services Clackamas County…………………....(503) 722-6519 Multnomah County…………..……...(503) 988-7387 Washington County……………….....(503) 846-7041
Multnomah……………………………....(503) 823-7202
Newspapers Portland Tribune…………………(503) 226-6397 Oregonian…………………………..(503) 221-8327
Washington……………………………...(503) 846-8609
-
! " "
#$
% &
' $ ( )
! $$
# "
) ( *
'$! + * , ) (
! ! ''
'#
)( ( % &
'$ + * , ) (
"-!
'# -
, . / 0 1
"$ ( )
!" $' '
'#'!
2 * 3 , 4 & . 3
2
- 5
, 1
-' "! !!
'#'!
3 6
$- - ( ) 7 - 1
" '"
'# !
2 5 0 * 2 ) 8 (
-' 9 4 : 1
-'
$
'#"
4( ) (
'-$
+ * , ) (
- $! "
'#"
5 6 . 4 %
$
/ 1( ,
! !
'#"
; 6 <
$
/ 1( ,
!" '! "
'#"
2 6,
'-" = * 2 , 7 ) ( !" -
'# $
5 , . : 2
! ! ) > , 1
!" '!'
'# $
< 9 , 3 )
- , 7 ' 1
!" '
'#!'
( 1 3 2 * ? 4
'$" ! + : &
''''
'#!
-
< 4 4 ( 2 2
' - ) (
$
!! !
#$-
) )* 4 46 .
' -
!" $"
'#
: 4( 1
' '
( 7
' ' "
'#
5 & /
: 4
'$ 71
-'$ -!
'#'
) ( /
'$ $ ) > , !" $'
'#'$
Customer Name : Customer Resources Customer Company Name : Stewart Title Prepared On : 11/05/2019 Š 2019 CoreLogic. All rights reserved
, (
- ' 1
' -
'#
-!
- ' 1
' -
'#
3 6
$- - ( ) 7 - 1
" '"
'# !
< 4 4 ( 2 2
'- = * 2 , ) (
$$$ $ "!
'#
? 4
'-$
' '
'# !
! "
-
@ 6
' '
' $$-$
'# -
@ 6
'$"$ = * 2 ,
!" "
'# !
9 = 2 6
" '$ , )
!" $$
'#"
+ 6
$ $ !- ( ) 1
' '$!
'#"
( 6
'-" = * 2 , 7 ) ) (
! '
'#!
( 6
!" 1
$"$ -"-
'#!
= * 2 3 (
'- = * 2 , ) (
!" - '
'#!!
5 , 5
- ,
! -"
#'-
( 46*
$ " ( %
!"
#"
= 4( ? 4 4
' , %
#$
= 4( 2 , @
' , %
!"" " "
#$
)*&*
'"
! '$!
# $
9 = 2 6
!' " 3 ,
!-
#'-
6 0 )* 4
'""
) ,
!"' $ -!
#'
( . /
' A '$ ( )
! "$"
#
# $ ! $
5( && 3 6
"$ ' - ( 5
"
-
#"$
Customer Name : Customer Resources Customer Company Name : Stewart Title Prepared On : 11/05/2019 Š 2019 CoreLogic. All rights reserved
3 B 0 ) (
"'
' !
#$
% = 2 ,C 5 1
"'
' !!
#$
% 4 = 2 ,C 5 1
"'
' !!
#$
00 (
"'
!" "
#$
B + 4(
" '
$"$ $'
#$
5 & 3 &( C 6 C C 6
""
' '$$$
#$
) ( + 6 6
" -
!" " -
#$
0
'$
#$
5 & : + 4(
' '' !
#$
% C
-'
' " !
#$
( D
!
!" -"
#$
5 B : 2 . /
' ' -
#$
; 2 9 2( :
! " "
#$
) , / 4 : 9
!" ' -!
#$
"
-
, . / 0 1
"$ ( )
!" $' '
'#'!
) ( = , / , . 5
'$$" ) > , !" !-
'# '
:, 4( : 4
-$ " ( ) 1
!" "$-
'# "
& 3 ,
'
: , : !"
-
#
Customer Name : Customer Resources Customer Company Name : Stewart Title Prepared On : 11/05/2019 Š 2019 CoreLogic. All rights reserved
% & '
-
= %
!!
! "-
# -
= . 4
!!
!" $ --
# -
( , =
!!
!" $ --
# -
= . 4
! $ ( )
!" ''
#!"
( )
-
3 ,* 4 : 4
'
#$
& ( & 4 4
' !! 7 ) ( !" "
#
* 3
"- '$" ( )
- -
'#'!
2 * 3 , 4 & . 3
2
- 5
, 1
-' "! !!
'#'!
( *
-
E ? ? ) (
' $ ( ) ) (
!" '' "
#
)* 4 C ?
' $ ( ) ) (
!" '' "
#
; 6 < *& ,
" = * 2 ,
' '
'#
<> , , )* 4
$- ' $ ( )
! !
#'$
+ $ ,
-
( 4( 0 ; ( 0 :,
'- ( )
! $ ""
#
: 0 ( 4(
$ ( ) ) (
!" """"
# $
* 0 : 0 4 ( 4(
$ ( )
- " $'
# $
) ( = F ( 4(
-
$"$ !$$'
#$
Customer Name : Customer Resources Customer Company Name : Stewart Title Prepared On : 11/05/2019 Š 2019 CoreLogic. All rights reserved
&
-
9 , =
"
!"
#$
@"
" '
!" " "-
#$
< 2 4
"-
' '" -
#$
& A
' $ $
#$
&
-
: C 2 5
' ( )
"'
#$
9 +
!! ; (
!" -'
'#'
( ) * 2 =
" " '$ ( )
-"- -$'$
'#'-
) ( = , / , . 5
'$$" ) > , !" !-
'# '
$
-
9 , * 9
- 9 ,
$"$ -
#
* 4( * ? 4
;
!" -!
#
= <> 2 ( 4
"! ( )
'
#-
% ) : ( : 4
- $ *
- '$"$
#-!
, ? 9 , 5 , 4
"
( ) ) (
!" '"'!
#-
9 , =
"
!"
#$
6 3 @&
""
"!$ - !-
#$
0
'$
#$
/ *
!-
! ! !
#$
) ,
!" ' -!
#$
Customer Name : Customer Resources Customer Company Name : Stewart Title Prepared On : 11/05/2019 Š 2019 CoreLogic. All rights reserved
9 2
' -
$"$ - -
#$-
&
"
!" '
#$
= 4 2 : 4
!-' ,
!" '
#
A ( 4 . 44
!-- '
$
#
3 / 6
' !!
"- " !
#
6 C % 4 ? 4
' ( ) (
!" --
#
. 9 &
'
$ - '! "
# !
< (
'
) > , ) (
$"$ $
'# "
<>4 1 5 , 4
'-$ 7 E
"
'# $
= 1 #4 *
'-$ ) (
!" "'
'# $
-
< & 4
' -
!"
# "
: 4( 1
' '
( 7
' ' "
'#
) ( <>&
) & &
" '- ( )
! $$"$
'#!'
/ &
'$! ' ,
!"! ' -
'#!"
Customer Name : Customer Resources Customer Company Name : Stewart Title Prepared On : 11/05/2019 Š 2019 CoreLogic. All rights reserved
10 Closest Neighbors
+ + +
! "+ # % + #$ ' ! ()) ' + "
5 + + + ! " # $ + # & $ + "" $ + % ""
* & + $& $ ' ""
+ () *( + (, + " " +
! "+ " # % + #$ ' ! ()) ' +
5 + " " + + # $ + # & $ + !! $ + % "" "
* & + $& $ '
+ -./0 ( + ! + "
! "+ # % + #$ ' ! ()) ' +
5 + + ! + " # $ + # & $ + $ + % ""
* & + $& $ '
Customer Name : Customer Resources Customer Company Name : Stewart Title Prepared On : 11/05/2019 Š 2019 CoreLogic. All rights reserved
" !
+ $. () . + ! + "
! "+ # % + #$ ' ! ()) ' + "
5 + + " " + " " # $ + # & $ + $ + % "
* & + $& $ '
+ 1$, ( + ' + +
! "+ " # % + #$ ' ! ()) ' +
5 + + " + ! # $ + # & $ + $ + % ""
* & + $& $ '
+ $./ +$ ( + +
! "+ " # % + #$ ' ! ()) ' +
5 + + + ! # $ + # & $ + $ + % ""
* & + $& $ '
Customer Name : Customer Resources Customer Company Name : Stewart Title Prepared On : 11/05/2019 Š 2019 CoreLogic. All rights reserved
!
+ & (( ( *2 , + + "
! "+ # % + #$ ' ! ()) ' + "
5 + + " + " ! # $ + # & $ + $ + % "
* & + $& $ '
+ .,(+ +, + " +
! "+ " # % + #$ ' ! ()) ' +
5 + " + + # $ + # & $ + !! $ + % ""
* & + $& $ ' "
+ 3.& & +0 '+ 4 + + !
! "+ " # % + #$ ' ! ()) ' +
5 + " + + # $ + # & $ + $ + % ""
* & + $& $ '
Customer Name : Customer Resources Customer Company Name : Stewart Title Prepared On : 11/05/2019 Š 2019 CoreLogic. All rights reserved
Demographics & Community Profile
22222 ! "
! " # $%
!"#
"
$
!
&"'
( )
!
%
&' (
"
% %!
%! %
"
% %
#
"
% %
) * + , *
&- ' %
. * + , *
) 0 + ,*
3 0 + ,*
&' ( / *0 1 2
% # #
" % * " * % % #)
) +
3 0 %!
4 * %
%! % ##
% %
% % ###
#
% %
5' %
% %!
) 0 / 6 *
%
%! %
3 522 , 0 5
&- ' %
) 0 ) ( (
%
Customer Name : Customer Resources Customer Company Name : Stewart Title Prepared On : 11/05/2019 Š 2019 CoreLogic. All rights reserved
, #)
- "
3 522 , 0 7
!
###
) 0 7
%#
## ##
## ##
% % #
!
# # #
% %###
!
# # #
% 0 5'
# # #
+ -* 2 + + 9 :2 *
; ** 0 :2 *
+ ' + + 9 :2 *
!
; & / ( :2 * 0
+ -* 2 :2 *
0 5< / ( :2 *
+ ' :2 *
& 0 0 : ** (
#
+ -* 2 ** (
** ( 0
!
+ ' ** (
0 = (
) ( >+ <
#
+ ' ? @
8 2 2 *
' ? @
: *
!
: *< ,* 9 0 ? @
&0 '
!
3 , 0 . *9 ? @
+ ' / / *0
. (
: ' 2
!
:@ ** 0
+ 2 ' : ' 2
4* **
8 % ##
. " . )
/ 0 1 ! "
)) ")
8 )
!
!
5'
Customer Name : Customer Resources Customer Company Name : Stewart Title Prepared On : 11/05/2019 Š 2019 CoreLogic. All rights reserved
Customer Name : Customer Resources Customer Company Name : Stewart Title Prepared On : 11/05/2019 Š 2019 CoreLogic. All rights reserved
Customer Name : Customer Resources Customer Company Name : Stewart Title Prepared On : 11/05/2019 Š 2019 CoreLogic. All rights reserved
Customer Name : Customer Resources Customer Company Name : Stewart Title Prepared On : 11/05/2019 Š 2019 CoreLogic. All rights reserved
Beaverton Spotlight Tualatin Hills Nature Park The Tualatin Hills Nature Center is the jumping-off point for visitors entering from the SW Millikan Way parking lot entrance and sits as a gateway to the 222-acre Tualatin Hills Nature Park and a lifetime of connections with nature. Stop by the Nature Center to check out the exhibits, have your wildlife questions answered, find out about nature programs or use the restrooms. Dogs and other pets are prohibited for the protection of wildlife.
Cooper Mountain Nature Park Overlooking the Tualatin River Valley, Cooper Mountain Nature Park is located on the edge of Beaverton. The 230-acre park offers visitors 3.5 miles of trails that traverse the park and pass through each of its distinct habitats from conifer forest to prairie to oak woodlands. Visitors will be rewarded with grand views of the Chehalem Mountains and more. Pets prohibited.
Art On Broadway We are an art gallery specializing in original fine art by award-winning local artists. The gallery is under the direction of acting partners Bert Cohen and Donna Sanson; both of whom are participating artists as well as gallery directors. In addition to the directors, the gallery represents eighteen artists who work in a wide range of materials and styles. Each month Art On Broadway hosts a free reception to celebrate new work.
Cooper Mountain Vineyards In 1987, the winery opened to offer its first vintage to the public. We now farm more than 100 acres, grow five varietals and are committed to sustainability; organic and biodynamic farming and winemaking and dry farming. Located 15 miles southwest of Portland, OR, enjoy the tasting room.
Red Tail Golf Course From 18-Holes, short game areas, junior golf, private lessons, RedTail Jr Camps, and custom fitting, and Pro Shop, this golf course has it all. Our commitment is to provide every customer who visits RedTail Golf Center with an enjoyable, friendly, and customer service oriented experience.
Many Surprises Await in Beaverton, Oregon
Beaverton is Washington County’s second-largest city, with a population of more than 90,000. Nestled in the eastern edge of the Tualatin Valley, Beaverton is surrounded by farmlands and natural resources, and boasts 30 miles of hiking trails and a 25-mile network of bike paths. Beaverton has the distinction of being the state’s most ethnically diverse city in the state. Several events throughout the year celebrate this diversity, including the International Celebration, Fiesta Latina and Ten Tiny Dances, a showcase of dances from across the globe.
Beaverton’s Historic Downtown District offers many surprises, including history and art and culture, where quaint antique and specialty shops dot the area, and highly acclaimed restaurants and shops attract food lovers from around the Greater Portland area. This growing city also is home to a variety of attractions, family entertainment centers, and arts and cultural offerings. In recent years, Beaverton has gained recognition in culinary circles and has attracted many foodies to the area with the Beaverton Farmers Market—the largest “allagricultural” market in the region—and its collection of acclaimed restaurants, specifically its variety of authentic Korean eateries. In the agricultural region of Beaverton, visitors can visit u-pick farms and farm stores during summer harvest season. Two wineries–Cooper Mountain Vineyards and Ponzi Vineyards’ Historic Estate–also are located in this lush agricultural area. Want to learn more about Beaverton? Visit the Beaverton Area Chamber of Commerce or the City of Beaverton for more information. https://tualatinvalley.org/cities-towns/beaverton/