









Arizona and the Greater Phoenix’s economies are experiencing a slower increase in employment rates and nonfarm payroll jobs compared to the previous 12 months. This pace is also reflected in the overall US economy.
From 2023 to 2024, Arizona’s real personal income grew faster than the U.S. overall (3.3% vs 2.9%) .However, real per capita personal income growth was slightly lower than the national rate (1.8% vs 1.9%).
Inflation rose to 4.2% nationally in May; up from 3.8% in April. Greater Phoenix recorded a rate of 3% for the two months ended in April; an increase of 1.3 percentage points from February. Despite regional Inflation rates slowing down, the nation is still experiencing high interest rates, implying a tighter monetary policy, which is likely contributing to slower economic growth in Arizona and the US.
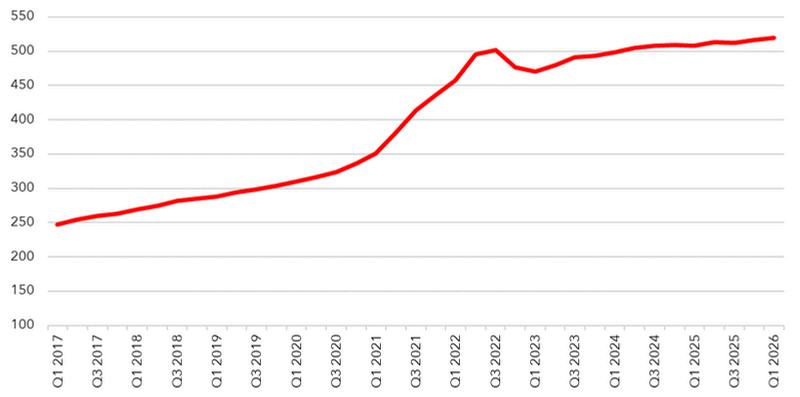
The House Price Index percentage change for the Greater Phoenix region from Q1 2025 is at 2.39%; home prices have been on the rise since Q1 2023.
Over the last 12 months, the Consumer Price Index for all Urban Consumers (CPI-U) in Greater Phoenix increased by 3%. Food prices rose 2.3% while Energy prices increased 22.9%. The index for all other items less food and energy rose 1.7% over the year.
Arizona’s annual per capita disposable personal income is currently $61,400; a 31% increase from 2020 when personal disposable income was $46,951. Despite this growth, increase in disposable income is still lagging the inflation rates.


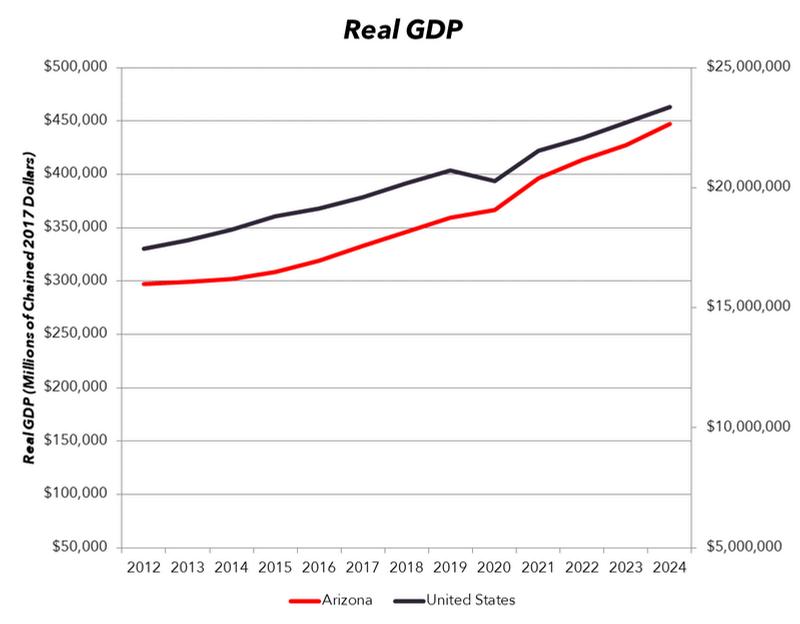
Arizona real GDP in 2024 was $446.97 billion, expanding by 4.5% over the previous year
U.S. real GDP grew 2.8% from 2023 to 2024
Recent estimates show that annual real GDP growth accelerated nationally from 0.5% in Q4 2025 to 2.1% in Q1 2026. On the other hand, the state’s economy held steady in Q1 2026 at 0.4% from Q4 2025


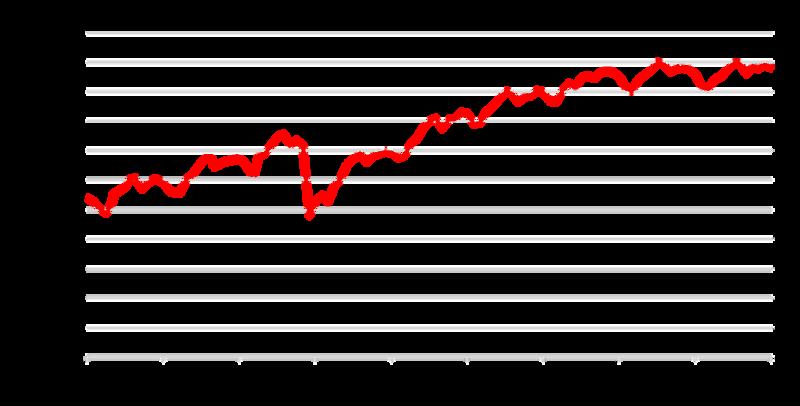
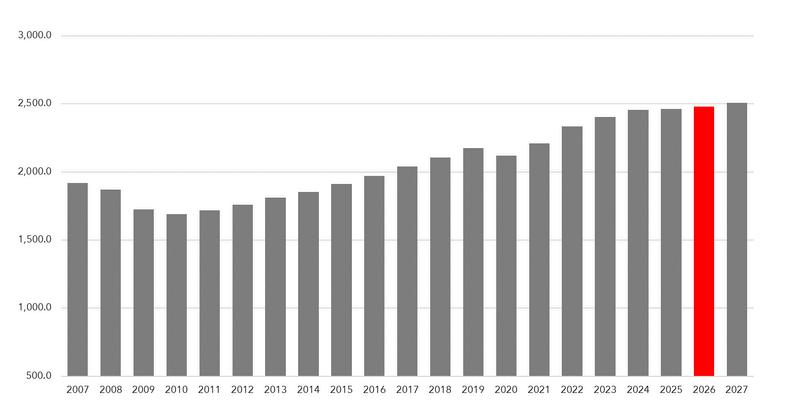
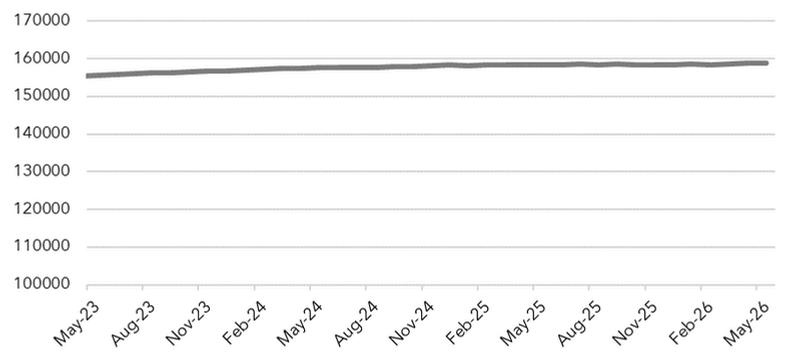
Current total nonfarm payroll employment is 2,480,800 jobs; unemployment rate is 4.1%
Jobs have decreased by 10,600 compared to April, and increased by 23,600 year over year

Greater Phoenix Job Growth
Following an end-year peak of 2,496,000 nonfarm jobs, Greater Phoenix employment declined in January before rebounding by March
The largest industries in Greater Phoenix are professional and business services and healthcare and social assistance
There has been significant growth in the healthcare and social assistance sector following the 2008 recession. Conversely, construction is experiencing very slow but gradual growth while there is a decline in retail trade as a share of total employment

The competitive effect measures the job change that occurs within an occupation and indicates how much of the job change within a given region is the result of some unique competitive advantage of the region
The occupational mix effect is the number of jobs we would expect to see added or lost within an occupation in our region, based on its national growth/decline
To measure the competitive effect, we subtract the expected change from the actual regional job change NB; This effect can be positive even if regional employment is declining
The occupational mix effect is calculated by subtracting the national growth rate of the overall economy from the national growth rate of the specific occupation
degree


Greater Phoenix job growth is projected to be 1.17% from 2026 to 2027 Arizona job growth is projected to be 1.04% from 2026 to 2027

Greater Phoenix is expected to outpace the state in job growth and overall employment activity
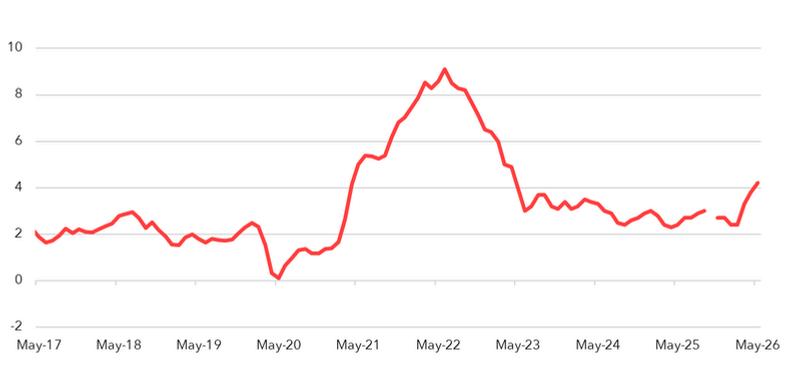
Inflation reflects the annual percentage change in the cost to an average consumer of acquiring a standard market basket of goods and services. The inflation rate presented below is the year-over-year percentage change which is a measure of the average monthly change in the overall price for goods and services paid by urban consumers
The most recent inflation rate was 4.2%, up from 3.8% in April
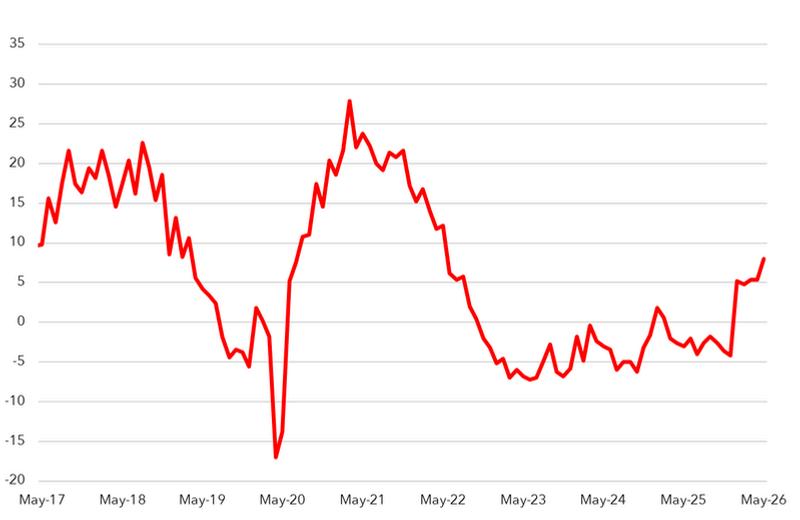
The Composite Business Confidence is an indicator for business tendencies, based on surveys measuring developments in production, orders and stocks of finished goods in the manufacturing sector. The indicator is exhibited as the percentage of net balances.
The net balances were at 8.0 in May, indicating slight optimism towards economic activity in the future
Note:
The Composite Business Confidence (CBC) for the manufacturing sector has replaced the Business Confidence Index (BCI ) which used to measure the overall perception of businesses on the economy The percentage of net balances quantifies the overall sentiment or trend among respondents; A negative net balance indicates that more respondents are experiencing or expecting declines rather than improvements in the economy while a net balance of zero means that the percentage of positive and negative responses are equal, indicating a neutral outlook Source: OECD, June 2026
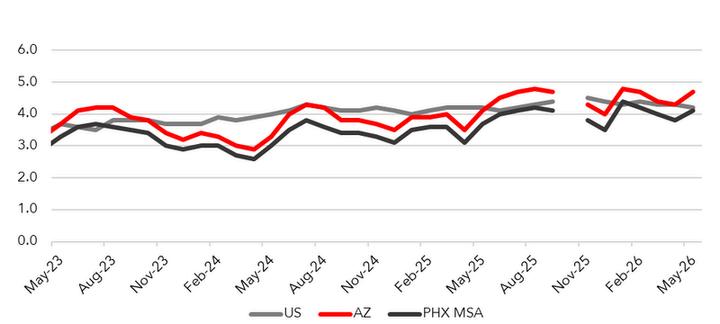
Presently, Greater Phoenix exhibits a lower unemployment rate compared to the State and the United States. Employment rates follow a consistent trend at the metro, state and national level
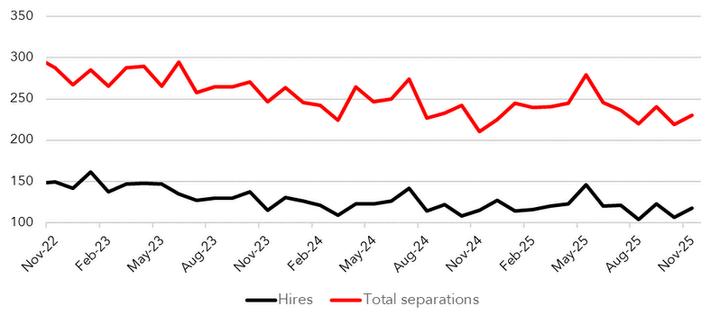
Among the November separations in Arizona, 73,000 were quits and 33,000 were layoffs and discharges compared to October’s 65,000 quits and 39,000 layoffs and discharges
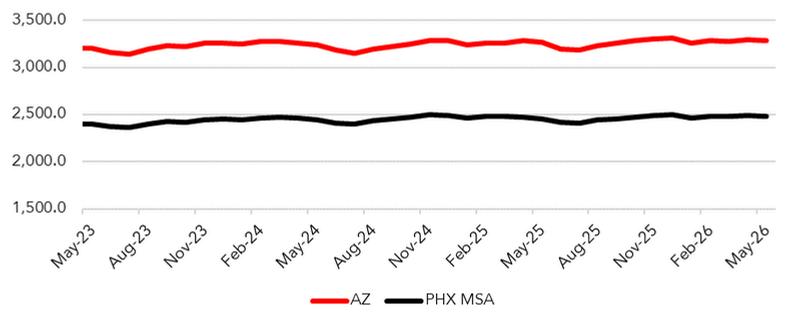
The overall cost of living in Greater Phoenix is % above the national average.
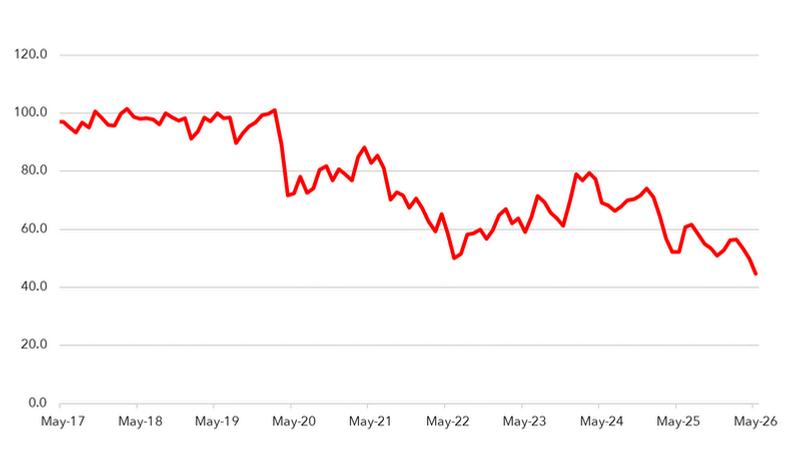
Consumer sentiment remains at or near its lowest level in the past decade
The Index decreased to 44.8 in May from 49.8 in April
Source: University of Michigan, June 2026
Consumer Sentiment


After peaking in Q3 2022 with the index at 501.74, Greater Phoenix home prices briefly softened in 2023, rose steadily through 2024, and set a new high in Q1 2026 at 519.93
The YoY change compared to Q1 2025 is 2.39% .
Greater Phoenix Home Price Index
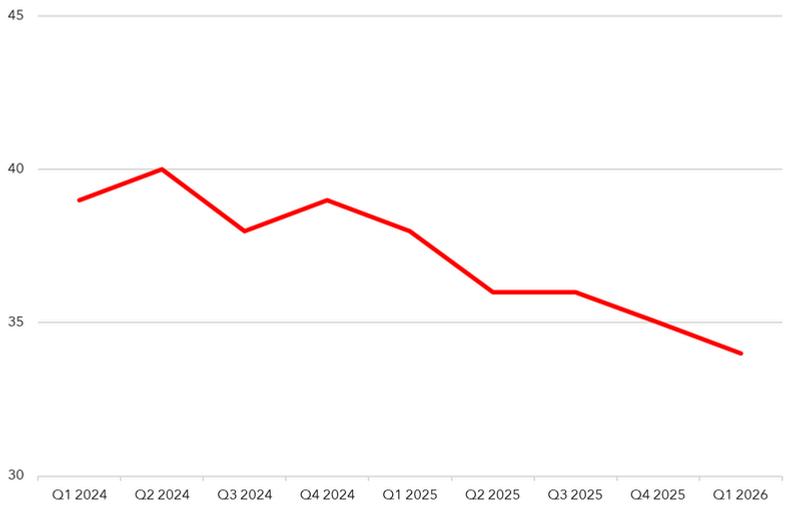
This index shows the portion of a typical family’s income needed to make a mortgage payment on a median-priced home
The Q1 2026 reading for the Phoenix MSA indicates that 34% of a typical median family’s income of $112,400, was needed, to make a mortgage payment on a median-priced new single-family home of $479,600 Nationally, 32% of a typical family’s median income of $106,800 was needed to make a mortgage payment on a median-priced new singlefamily home of $403,200
Cost of Housing Index