Tourism Statistics Summary - February 2021
FEBRUARY 2021/2020 ARRIVAL ANALYSIS
GOVERNMENT OF ANGUILLA Anguilla Statistics - Department
Visitors - ↓93.2% Tourists - ↓88.6%
Tourism Statistics Summary February 2021
Excursionists –↓99.95%
OVERVIEW 2021 visitor arrivals during Anguilla’s
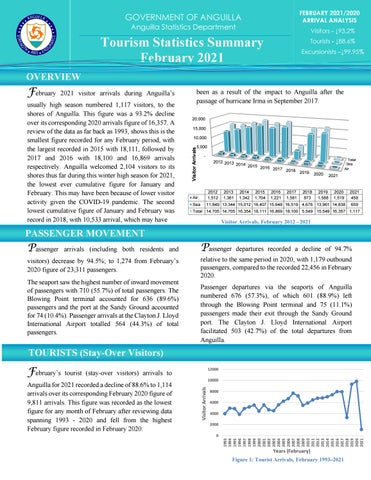
usually high season numbered 1,117 visitors, to the shores of Anguilla. This figure was a 93.2% decline over its corresponding 2020 arrivals figure of 16,357. A review of the data as far back as 1993, shows this is the smallest figure recorded for any February period, with the largest recorded in 2015 with 18,111, followed by 2017 and 2016 with 18,100 and 16,869 arrivals respectively. Anguilla welcomed 2,104 visitors to its shores thus far during this winter high season for 2021, the lowest ever cumulative figure for January and February. This may have been because of lower visitor activity given the COVID-19 pandemic. The second lowest cumulative figure of January and February was record in 2018, with 10,533 arrival, which may have
been as a result of the impact to Anguilla after the passage of hurricane Irma in September 2017. 20,000 15,000 10,000 5,000
Visitor Arrivals
February
2012 2013 2014 2015 2016 2017 2018
2013 1,361
2014 1,342
2015 1,704
2016 1,221
2017 1,581
Total Sea Air
2019
2018 873
2020
2019 1,588
2021
Air
2012 1,512
2020 1,519
2021 458
Sea
11,849 13,344 15,012 16,407 15,648 16,519 4,676 13,961 14,838
659
Total 14,705 14,705 16,354 18,111 16,869 18,100 5,549 15,549 16,357 1,117
Visitor Arrivals, February 2012 - 2021
PASSENGER MOVEMENT
Passenger
arrivals (including both residents and
visitors) decrease by 94.5%; to 1,274 from February’s 2020 figure of 23,311 passengers. The seaport saw the highest number of inward movement of passengers with 710 (55.7%) of total passengers. The Blowing Point terminal accounted for 636 (89.6%) passengers and the port at the Sandy Ground accounted for 74 (10.4%). Passenger arrivals at the Clayton J. Lloyd International Airport totalled 564 (44.3%) of total passengers.
Passenger
departures recorded a decline of 94.7%
relative to the same period in 2020, with 1,179 outbound passengers, compared to the recorded 22,456 in February 2020. Passenger departures via the seaports of Anguilla numbered 676 (57.3%), of which 601 (88.9%) left through the Blowing Point terminal and 75 (11.1%) passengers made their exit through the Sandy Ground port. The Clayton J. Lloyd International Airport facilitated 503 (42.7%) of the total departures from Anguilla.
TOURISTS (Stay-Over Visitors) 12000
tourist (stay-over visitors) arrivals to
10000 8000 6000 4000
2000 0
1993 1994 1995 1996 1997 1998 1999 2000 2001 2002 2003 2004 2005 2006 2007 2008 2009 2010 2011 2012 2013 2014 2015 2016 2017 2018 2019 2020 2021
Anguilla for 2021 recorded a decline of 88.6% to 1,114 arrivals over its corresponding February 2020 figure of 9,811 arrivals. This figure was recorded as the lowest figure for any month of February after reviewing data spanning 1993 - 2020 and fell from the highest February figure recorded in February 2020.
Visitor Arrivals
February’s
Years (February) Figure 1: Tourist Arrivals, February 1993–2021
Tourism Statistics Summary - February 2021
TOURISTS (Stay-Over Visitors) continued
A review of the source markets for tourists visiting Anguilla during February 2021 showed that all ten (10) source markets contributed to the recorded decrease in the tourist arrivals figure. The largest decrease was experienced in the ‘French West Indies’ market with 98.6%, followed by the ‘Italian’ and ‘Caribbean’ markets, with 97.6% and 96.9% respectively.
The average intended length of stay of tourists in Anguilla for the period under review increased to 9.3 days from the 7.1 days recorded in February 2020. Most tourists, more than half, 55.7% intended to spend 4-7 days in Anguilla. 18.6% of tourists planned to stay 8-15 days, followed by 13.6% who stated they intended to stay 23 or more days, 8.1% for 1-3 days and 4.1% intended to stay 16-22 days. 46, 4.1%
151, 13.6%
Anguilla’s major source market, the USA, recorded 904 arrivals, held an 81.1% share of the tourist arrivals; this was.an 87.1% decrease over the corresponding 2020 figure.
90, 8.1%
8,000
February 2020 February 2021
Tourism Arrivals
7,000 207, 18.6% 620, 55.7%
1-3 days
6,000
5,000 4,000
3,000 2,000
1,000
4-7 days
0
8-15 days 16-22 days
23+ days
Source Market Figure 3: Tourist Arrivals by Source Market, February 2021 February 2020 and 2021
Figure 2: Tourist Arrivals by Length of Stay, February 2021
EXCURSIONISTS (Day Trippers) arrivals for the month under review
Excusionist Arrivals
numbered three (3); the lowest based on data as far back as 1993. This type of visitor to Anguilla is usually a tourist visiting St. Maarten/St. Martin who travels to Anguilla on a day trip to enjoy our beaches and hospitality for a day and usually. Anguilla has implemented precautionary measures to ensure the safety of its habitants with mandatory screening and a quarantine period, which may have inhibit day-trippers from visiting.
These three arrivals originated from the ‘USA’ and ‘Other’ source markets; the USA accounted for two of the excursionists and one excursionist from the ‘Other’ source market. Both source markets recorded a decline of 99.6%, over there corresponding 2020 figures. 3,000
February 2020 February 2021
2,500
Excursionist Arrivals
Excursionist
12,000 11,000 10,000 9,000 8,000 7,000 6,000 5,000 4,000 3,000 2,000
2,000 1,500 1,000 500 0
Source Market Years (February) Figure 4: Excursionist Arrivals, February 1993 – 2021
+
Figure 5: Excursionist Arrivals by Country of Residence, February 2020 and 2021
This report, along with other Tourism Data, is available at the Government of Anguilla Statistics Department’s website: http://gov.ai/statistics/tourism.htm ANGUILLA STATISTICS DEPARTMENT P.O.BOX 60 | THE VALLEY | ANGUILLA BRITISH WEST INDIES Telephone: + (264) 497-5731 | Fax: + (264) 497-3986 Email: statistics@gov.ai 'Sound Statistics for Sustainable Development'