SRS REAL ESTATE PARTNERS
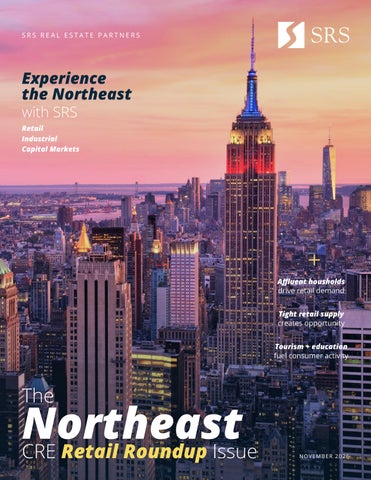
Experience the Northeast with SRS
Retail Industrial Capital Markets
Affluent housholds drive retail demand Tight retail supply creates opportunity Tourism + education fuel consumer activity
The
Northeast CRE Retail Roundup Issue
NOV EM BER 2026
Robust retail abounds throughout
THE NORTHEAST SRS and Northeastern energy For 40 years, SRS has recognized the power of retail, providing tenant, owner, and investment services throughout the U.S. In the Northeast, we see robust retail at its finest - New England, Boston, New York, Philadelphia, and Washington, D.C. flourishing from high population density, affluence, and economic diversity. These areas account for millions of residents and a steady stream of tourism, creating boundless retail opportunities.
Historical & cultural attractions
Iconic destinations such as Boston’s Freedom Trail and New York’s Times Square draw millions of visitors and create year-round foot traffic, supporting retail, dining, entertainment, and experiential concepts.
Strong purchasing power
Affluent households across the Northeast provide strong consumer spending potential, supporting a diverse retail landscape ranging from luxury and specialty concepts to everyday goods and services. 2
NOR THE AS T
B Y T H E N U MBERS
$5.9 trillion economic output
annually contributed to the U.S. GDP, 19.3% of the national economy
91.5%
of the Northeast lives in urban areas making it the most densely populated U.S. region, ideal for concentrated retail activity
2 of top 5
busiest U.S. airports
(JFK and Newark), facilitate domestic and international retail activity
Highly educated, diverse consumer base
World-class universities, major employment centers, and a highly educated workforce bring together students, professionals, residents, and visitors, creating a dynamic and diverse customer base for retailers.
Diversified economic base
From New York’s finance, media, and technology industries to Boston’s healthcare, life sciences, and education sectors and Washington, D.C.’s government and professional services, the Northeast benefits from a broad economic foundation that supports consistent consumer activity. 3
NEW ENGLAND
prime market for retail investment
Historic downtowns, coastal destinations, and communityoriented neighborhoods create distinctive retail opportunities across New England’s established markets.
New England’s mix of historic character, affluent households, and compact metropolitan markets creates a distinctive environment for retail investment. Across Providence, Portland, Hartford, Burlington, and Manchester, the region includes more than 4 million residents, with 2026 median household incomes ranging from approximately $87,800 to $112,300. These established markets provide a strong foundation for neighborhood retail, dining , services, specialty concepts, and experiential uses. Availability also remains limited across these metros. Q2 2026 vacancy ranged from just 2.6% in Portland to 4.4% in Hartford and Manchester, with occupancy above 95% in all five markets. Together, the markets contain more than 256 million SF of retail inventory, while comparatively limited new construction continues to constrain additional supply. The region’s smaller-scale cities, historic downtowns, coastal destinations, and community-oriented neighborhoods give retailers an operating environment that differs from larger gateway markets. Combined with strong household incomes and limited available space, these characteristics favor concepts seeking established trade areas with both purchasing power and a strong sense of place.
4
High incomes
Impactful tourism
Low vacancy
New England has some of the highest average household incomes in the U.S., with NH MSA leading at $112K+
This area attracts 60M+ tourists annually, generating billions in revenue
Retail vacancy remains tight, due to constrained supply and strong leasing demand
Market Statistics Vacancy Rate
Market Asking Rent Growth
SF of Inventory
SF Under Construction
12-Month Net Absorption SF
Market Cap Rate
Providence, RI
3.6%
-0.3%
101,154,534
73,058
-191,472
7.8%
Portland, ME
2.6%
3.6%
40,174,341
135,790
-168,020
8.4%
Hartford, CT
4.4%
-0.5%
76,941,279
132,926
-403
8.5%
Burlington, VT
3.3%
-13.2%
10,749,469
0
-26,518
8.5%
Manchester, NH
4.4%
-1.4%
27,810,510
3,206
-427,361
8.9%
Market
Source: CoStar Retail Markets
Demographics Total Employment
Prj. Job Growth (5-yr)
Population
Prj. Population Growth (5-yr)
Median HHI
Prj. Median HHI Growth (5-yr)
Providence, RI CBSA
748,800
5.3%
1,690,796
0.5%
$87,805
17.1%
Portland, ME CBSA
307,900
7.9%
577,766
2.4%
$100,347
19.1%
Hartford, CT CBSA
628,000
7.5%
1,152,809
-0.5%
$99,348
13.2%
Burlington, VT CBSA
124,700
5.6%
232,050
1.7%
$99,849
14.2%
Manchester, NH CBSA
205,300
2.3%
428,579
0.6%
$112,297
18.7%
Market
Source: U.S. Bureau of Labor Statistics Metro Areas, Esri Metro Areas
Recent SRS Activity
Partial client & project representation lists
Tenant Services (throughout New England, Upstate NY, and Boston)
Owner Services
Capital Markets
Merchants Way Concord, NH
Cedar Landing Rochester, NH
TJ Maxx Plaza Manchester, NH
Bath Shopping Center Bath, ME
Killingly Commons Dayville, CT
ON MARKET Staples
Rochester, NH
UNDER LOI Starbucks
Middletown, CT
5
BOSTON retail soars
Boston remains one of the Northeast’s most compelling retail markets, anchored by an affluent, highly educated population, dense urban neighborhoods, and a steady influx of visitors, students, and professionals. The Boston-CambridgeNewton metro is home to more than 5.0 million residents and has a 2026 median household income of $125,208, creating significant purchasing power across established districts such as Back Bay, Harvard Square, and Seaport.
World-class universities, a highlyeducated workforce, and a diverse economy anchored by technology, healthcare, and life sciences support Boston’s dynamic retail and dining scene.
Space remains especially tight. Boston’s retail vacancy rate was just 2.8% in Q2 2026, with 97.2% occupancy across nearly 239 million SF of inventory. The market recorded approximately 284,000 SF of positive net absorption during the quarter, while only about 616,000 SF was under construction, reinforcing competition for well-located space.
Boston’s economy is anchored by healthcare, technology, life sciences, finance, and higher education, while tourism and Boston Logan bring additional spending into the market. Continued mixed-use development is creating walkable destinations where retail, dining, entertainment, residential, and office uses converge, broadening the range of customers and activity throughout the region. 6
Top 5 in the nation for an educated population 54.9% of residents 25+ hold a bachelor’s degree or higher
#1
state for economic performance and strength in the U.S. in 2026 by WalletHub
$125K+ median household income in Boston, up 5.7% year over year
Recent SRS Activity
Partial client & project representation lists
Tenant Services (throughout Boston, New England, and Upstate NY)
Owner Services
Capital Markets
Sunnyside Plaza Natick, MA
ON MARKET
Barrington Plaza Great Barrington, MA Randolph Village Randolph, MA
Dollar General Hyannis, MA ESCROW
CVS Lowell, MA
Lincoln Plaza Worcester, MA
Vacancy Rate
2.8%
Market Asking Rent Growth
-1.6%
SF of Inventory
238,834,977
SF Under Construction
615,992
12-Month Net Absorption SF
-125,504
Market Cap Rate
6.7% Source: CoStar Retail Markets
DE MOGR A PHI CS
M AR KET ST A T IST ICS
Post Office Square Lynnfield, MA
Total Employment Prj. Job Growth (5-yr) Population Prj. Population Growth (5-yr) Median HHI Prj. Median HHI Growth (5-yr)
2,782,100 5.2% 5,009,371 1.1% $125,208 15.8%
Source: U.S. Bureau of Labor Statistics Metro Areas, Esri Metro Areas
7
NEW YORK
powers retail growth
From world-renowned shopping districts to established Upstate communities, New York offers exceptional market diversity, scale, and a broad range of occupancy costs.
2.9%
real GDP growth in New York in 2025
20M+
NY state residents
4.2%
NYC metro retail vacancy 8
New York City and Upstate New York offer distinctly different advantages for retail commercial real estate, pairing NYC’s extraordinary scale with Upstate’s lower occupancy costs and established local markets. The New York-NewarkJersey City metro is home to an estimated 20.2 million residents in 2026, with a median household income of approximately $105,100. High-profile districts such as Fifth Avenue, SoHo, and the Meatpacking District give retailers access to an exceptional mix of residents, workers, and domestic and international visitors. Supply remains constrained in the New York metro. Overall retail vacancy stood at 4.2% in Q2 2026, with 95.8% occupancy and positive quarterly net absorption. More than 1 million SF of retail space was under construction, while overall asking rents averaged approximately $47.59 per square foot. Upstate New York offers a lower-cost alternative across Buffalo, Rochester, Syracuse, and Albany, where overall asking rents ranged from approximately $13.50 to $15.80 per square foot in Q2 2026. Conditions varied by market: Albany recorded just 3.5% vacancy and strong positive absorption, while Rochester also posted positive absorption. Buffalo and Syracuse experienced softer quarterly demand, illustrating the more localized nature of Upstate performance. Together, these markets give retailers a broad spectrum of options, ranging from high-density global shopping destinations to lower-cost regional markets and community-oriented centers.
Market Statistics Vacancy Rate
Market Asking Rent Growth
SF of Inventory
SF Under Construction
12-Month Net Absorption SF
Market Cap Rate
New York City
4.2%
0.7%
452,339,641
1,012,839
-602,537
6.2%
Buffalo
6.6%
-3.5%
76,174,153
104,250
-781,737
8.8%
Rochester
4.6%
-4.0%
73,750,270
10,443
170,927
9.0%
Syracuse
4.7%
-4.2%
50,990,679
57,068
155,670
8.9%
Albany
3.5%
-4.0%
64,136,596
360,109
102,984
8.6%
Market
Source: CoStar Retail Markets
Demographics Total Employment
Prj. Job Growth (5-yr)
Population
Prj. Population Growth (5-yr)
Median HHI
Prj. Median HHI Growth (5-yr)
10,169,000
11.8%
20,246,348
0.7%
$105,111
12.9%
Buffalo CBSA
567,700
6.8%
1,162,531
-0.1%
$75,586
8.9%
Rochester CBSA
524,800
6.6%
1,048,750
-0.7%
$78,762
9.7%
Syracuse CBSA
324,900
8.4%
649,615
-1.4%
$79,091
9.5%
Albany CBSA
487,400
9.8%
905,148
0.3%
$90,023
11.2%
Market New York City CBSA
Source: U.S. Bureau of Labor Statistics, U.S. Census Bureau, Esri
S R S RECEN T ACTI V I TY
New York Tenant Services
Partial client & project representation lists
Owner Services
Capital Markets
Tower Plaza Norwalk, CT
ON MARKET
Flanders Plaza East Lyme, CT Clinton Plaza Clinton, CT 4 MetroTech Center Brooklyn, NY Throggs Neck Shopping Center Bronx, NY
Walgreens Poughkeepsie, NY Multi-Tenant Retail Center Corning, NY White Castle Brooklyn, NY CLOSED
Texas Roadhouse Cheektowaga, NY Sherwin-Williams Newburgh, NY
9
PHILADELPHIA consumer base fuels retail demand
9th
largest metro in the U.S.
$81B+ in annual retail sales
130+
new Center City businesses opened in 2025
22%
of residents are millenials
Philadelphia’s scale, diverse economy, and cultural and historic appeal provide retailers with access to a wide range of customers. The Philadelphia-Camden-Wilmington metro is home to nearly 6.4 million residents, with a 2026 median household income of $97,272. High-traffic destinations such as Center City and Rittenhouse Square draw residents, workers, students, and visitors throughout the year.
Expanding mixeduse districts, major universities, and comparatively affordable occupancy costs create opportunities for retailers across the Philadelphia metro.
Philadelphia’s extensive university network, including the University of Pennsylvania and Temple University, adds a young, educated demographic, while tourism and the region’s many cultural attractions generate additional spending across retail and dining. Availability remains limited across the metro. Retail vacancy was 4.3% in Q2 2026, representing 95.7% occupancy across nearly 340 million SF of inventory. The market recorded positive net absorption during the quarter, while only about 733,000 SF was under construction, keeping additions to supply relatively modest.
Ongoing investment in mixed-use districts, residential development, and commercial corridors is further expanding the region’s retail landscape. Combined with its population density and comparatively affordable occupancy costs, Philadelphia offers retailers access to Northeast scale without the cost profile of some larger gateway markets. 10
S R S RECEN T ACTI V I TY
Philadelphia, PA
Partial client & project representation lists
Tenant Services
Owner Services
Capital Markets
Freestanding Fresenius Building Scranton, PA
ON MARKET
CLOSED
7-Eleven Lock Haven, PA
Starbucks Shops Altoona, PA
Fresenius Sublease Grundy, VA
USLI HQ King of Prussia, PA
7-Eleven Mars, PA
Fresenius Sublease Baltimore, MD
Dollar Tree Rochester, PA
Dollar General Farrell, PA
Freestanding Fresenius Building Lynchburg, VA
WellNow Urgent Care St. Marys, PA
Texas Roadhouse Indiana, PA
Vacancy Rate
4.3%
Market Asking Rent Growth
0.7%
SF of Inventory
339,664,327
SF Under Construction
733,235
12-Month Net Absorption SF
292,731
Market Cap Rate
7.7% Source: CoStar Retail Markets
DE MOGR A PHI CS
M AR KET ST A T IST ICS
WellNow Urgent Care Bradford, PA
Total Employment Prj. Job Growth (5-yr) Population Prj. Population Growth (5-yr) Median HHI Prj. Median HHI Growth (5-yr)
3,162,100 10.5% 6,387,167 1.1% $97,272 14.3%
Source: U.S. Bureau of Labor Statistics Metro Areas, Esri Metro Areas
11
WASHINGTON, D.C. diverse retail landscape
Washington, D.C. combines high household incomes, a large regional population, and steady visitor activity to create a diverse retail landscape. The Washington-Arlington-Alexandria metro is home to more than 6.5 million residents, with a 2026 median household income of $134,515, among the highest of the major Northeast markets. Established destinations such as Georgetown, CityCenterDC, the Wharf, and Navy Yard attract residents, professionals, students, and visitors across luxury, dining, service, and experiential concepts.
A strong employment base, substantial daytime population, and significant visitor spending support D.C.’s diverse retail landscape.
The regional economy includes more than 3.3 million jobs, with government, professional services, technology, education, and healthcare contributing to a stable and highly educated workforce. Population is projected to grow about 3.0% through 2031, while median household income is forecast to increase more than 15%, further strengthening the region’s spending potential. Retail space remains relatively tight, with metro vacancy at 4.5% in Q2 2026 across approximately 259 million SF of inventory. More than 1.1 million SF was under construction, reflecting continued investment in mixed-use and neighborhood retail environments throughout the region.
12
Solid Employment
1M Daytime Pop
D.C. Spends
High Wages
3.3M jobs across the Washington metro in 2025
Daytime population rises to nearly 1M as people commute to the city
$11.9B in visitor spending, included roughly $1.7B spent on shopping
$44.20/hr average metro wage is 32% above the U.S. average
S R S RECEN T ACTI V I TY
Washington, D.C.
Partial client & project representation lists
Tenant Services
Owner Services
Capital Markets
Central Armature Works Washington, D.C.
ON MARKET
Sprouts Haymarket, VA
District Center Washington, D.C.
Bank of America Glen Allen, VA
The Eaton Hotel Washington, D.C.
Wawa Manassas, VA
1350 Eye Street NW Washington, D.C.
Raising Cane’s Forestville, MD
4.5%
Market Asking Rent Growth
0.8% 259,301,799
SF Under Construction
1,098,435
12-Month Net Absorption SF
-328,680 7.0% Source: CoStar Retail Markets
Chase Bank Washington, D.C.
ALDI Glen Allen, VA
Wawa College Park, MD
Sheetz Richmond, VA
DE MOGR A PHI CS
M AR KET ST A T IST ICS
Vacancy Rate
Market Cap Rate
Giant Fort Washington, MD
CLOSED
Collection 14 Washington, D.C.
SF of Inventory
The Learning Experience Fredericksburg, VA
Total Employment Prj. Job Growth (5-yr) Population Prj. Population Growth (5-yr) Median HHI Prj. Median HHI Growth (5-yr)
3,330,300 4.2% 6,552,975 3.0% $134,515 15.2%
Source: U.S. Bureau of Labor Statistics Metro Areas, Esri Metro Areas
13
ABOUT SRS
transforming retail nationwide
A leader in consumer-driven real estate, SRS delivers best-in-class tenant, owner, and investment services across our national Retail, Industrial, and Capital Markets platforms.
14
Transactions since 2020
Retail + Industrial: A Natural Fit • Today, retailers need a myriad of industrial facilities to serve their rising e-commerce and distribution needs. • Retail owners and landlords are finding it increasingly important to embrace non-traditional retail tenants to remain relevant. • Net lease investors are finding industrial a lucrative option to diversify their asset portfolio.
30
Offices
350+
Team Members
1,270+ Clients in 2025
We’re always looking for top talent at SRS. Reach out to any member of our leadership team for more information on joining SRS Real Estate Partners.
Veteran Experience in the Northeast L E ADE R S H IP Andrew Fallon
Kyle Fant
EVP & Managing Principal 703.787.4733 | andrew.fallon@srsre.com CAPITAL MARKETS Washington, D.C.
EVP & Managing Principal 929.229.2613 | kyle.fant@srsre.com CAPITAL MARKETS New York
Britt Raymond
Neill Kelly
EVP & Managing Principal 929.229.2614 | britt.raymond@srsre.com CAPITAL MARKETS New York
SVP & Managing Principal 929.445.4974 | neill.kelly@srsre.com RETAIL New York
Jonathan Lapat
Arris Noble
SVP & Managing Principal 978.579.4112 | jonathan.lapat@srsre.com RETAIL Boston
Managing Principal 202.503.2195 | arris.noble@srsre.com RETAIL Washington, D.C.
Jon Spadafino Vice President & Market Leader 212.710.5257 | jon.spadafino@srsre.com RETAIL New York
BR OKE R AG E TE AM Hugh Kelly
Dan Richman
Brian Nadler
Rick Fernandez
David Wirth
EVP & Principal 212.710.5252 hugh.kelly@srsre.com RETAIL New York
Managing Director 212.710.5253 dan.richman@srsre.com RETAIL New York
Senior Vice President 617.665.7395 brian.nadler@srsre.com RETAIL Boston
Senior Vice President 703.787.4732 rick.fernandez@srsre.com CAPITAL MARKETS Washington, D.C.
Senior Vice President 484.883.7537 david.wirth@srsre.com RETAIL Philadelphia
Christian Janelle
Bryan Wright
Jordan Yarosh
Lili Chen
Rachel Callender
Vice President & Principal 857.263.3812 chris.janelle@srsre.com RETAIL Boston
Vice President & Principal 617.245.0671 bryan.wright@srsre.com RETAIL Boston
Vice President & Principal 332.238.0025 jordan.yarosh@srsre.com CAPITAL MARKETS New York
Director, Cross Border Retail 214.560.3204 lili.chen@srsre.com RETAIL New York
Vice President 202.503.3540 rachel.callender@srsre.com RETAIL Washington, D.C.
Richard Dorfman
Benjamin Gould
Michael Grunberg
Philip Wellde
Thomas Sansone
Vice President 646.453.7786
Vice President 929.445.6952
Vice President 646.491.6974
First Vice President 202.552.0092
Senior Associate 212.710.5255
richard.dorfman@srsre.com CAPITAL MARKETS New York
benjamin.gould@srsre.com RETAIL New York
mike.grunberg@srsre.com CAPITAL MARKETS New York
philip.wellde@srsre.com CAPITAL MARKETS Washington, D.C.
thomas.sansone@srsre.com CAPITAL MARKETS New York
William Donlon
Samantha Mazza
Joe Quinn
Nick Santagata
Associate 929.201.0196 william.donlon@srsre.com
Associate 617.880.7618 samantha.mazza@srsre.com
Associate 781.690.5199 joe.quinn@srsre.com
Associate 929.594.2946 nick.santagata@srsre.com
CAPITAL MARKETS New York
RETAIL Boston
RETAIL Boston
CAPITAL MARKETS New York
15
S RS RE.COM