4 minute read
Understanding an Audiogram and Hearing Test Results


BY ANGIE ARLINGTON
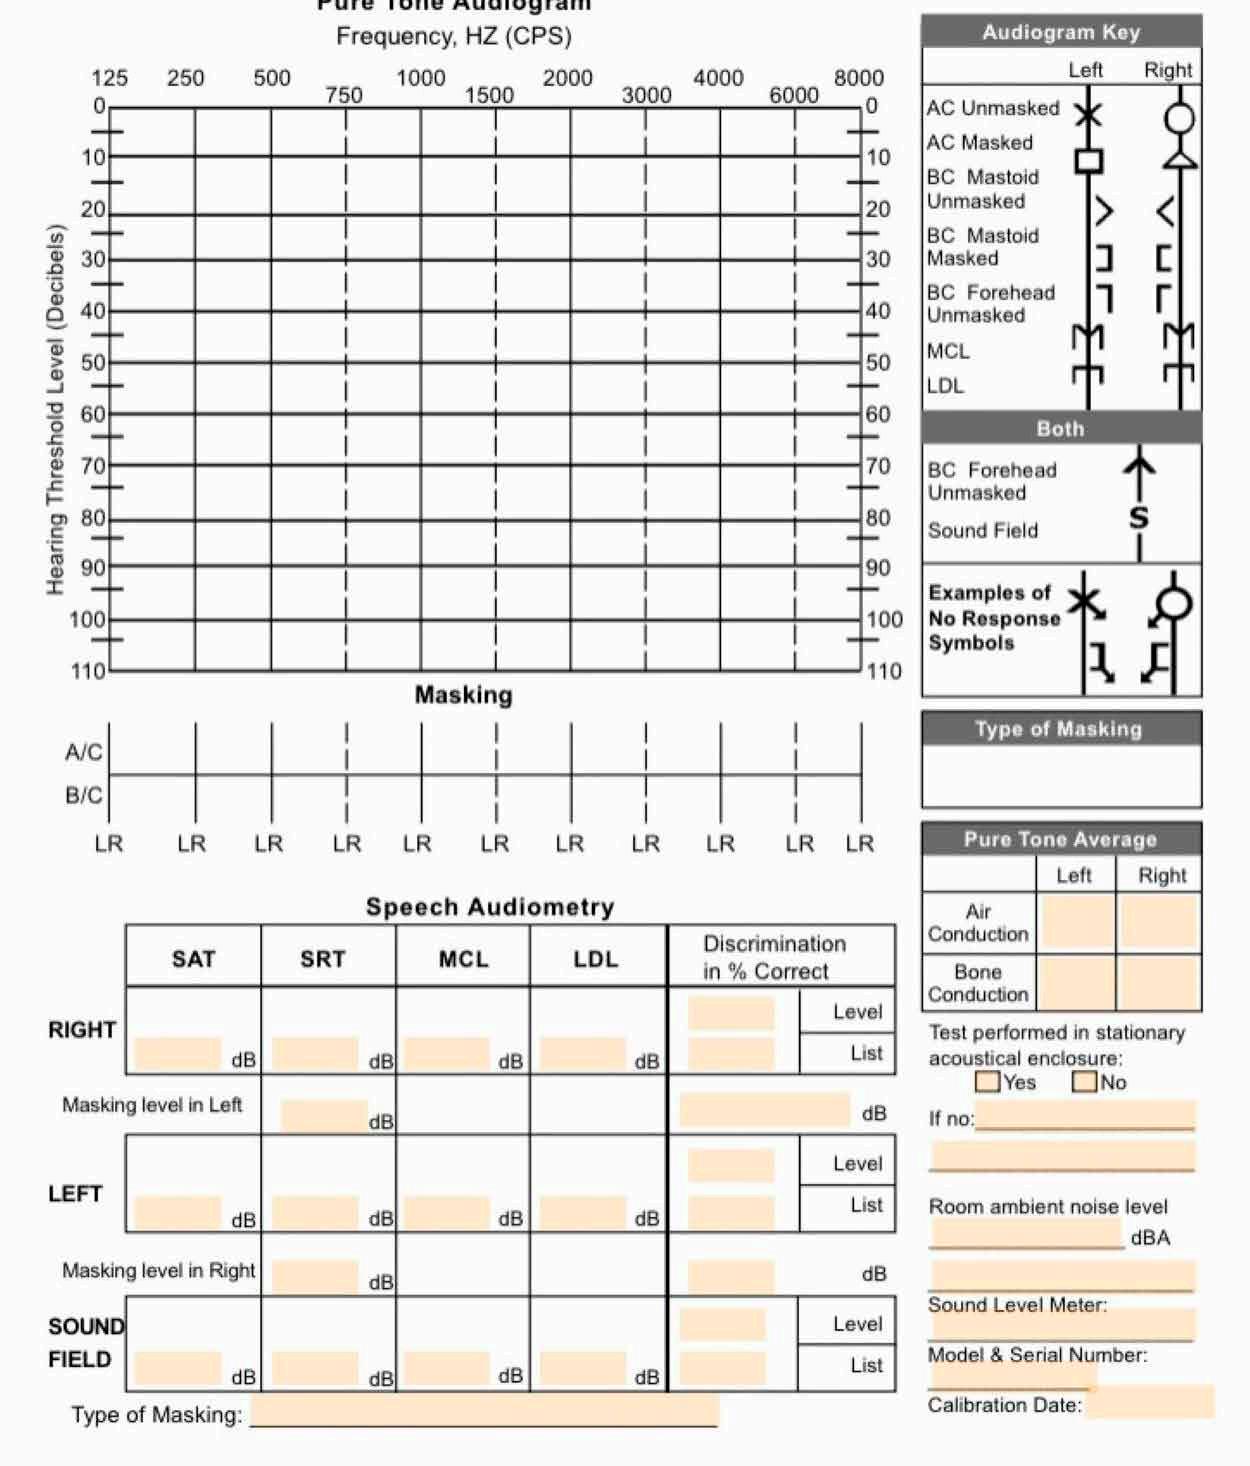
Audiogram Testing-During testing, the audiometer delivers various “pure tone” sounds at particular frequencies and intensities, from low to high.The hearing test results are plotted on a graph with the y-axis representing hearing threshold and the x-axis representing frequency.
1. The right ear is generally plotted with an O and the left ear with an X.
2. Bone conduction is also plotted (to allow for differentiation of conductive and SNHL). The right ear is plotted as < and the left ear as >.
3. Air conduction: The results for each ear, measured using headphones or earphones.
4. Bone conduction: The results for each ear, measured using a special headband.
5. Threshold shifts: The patterns of threshold shifts between air and bone conduction.
Decibel (dB)- A decibel, or its abbreviation dB, is a measurement of loudness that ranges from the threshold of hearing. To put decibels in context, the volume of normal conversation is about 60dB and the roar of a jet engine is at least 120dB.
Frequency: The pitch of a sound, measured in Hertz (Hz). Low-pitched sounds are on the left side of the graph, and high-pitched sounds are on the right side. The average human can hear between 20 and 20,000 Hz and speech usually falls between 250Hz and 6,000 Hz. Audiograms typically test frequencies between 250 Hz and 8,000 Hz.

Speech Audiometry- measures a person’s ability to understand speech. Wearing headphones in a soundproof room, a person listens to a list of words spoken at different volumes and repeat what is heard.
• Speech reception threshold (SRT): The lowest volume at which a person can understand 50% of words.
• Speech discrimination: Ability to understand speech at a comfortable listening level.
• Speech banana- used on audio-gram to show problems with speech clarity due to hearing loss.
Tympanometry- diagnostic test that measures the function of the middle ear, specifically the eardrum (tympanic membrane). A small probe is inserted into the ear canal and generates a series of air pressure changes, and the eardrum’s response. The results are displayed as a graph called a tympanogram. The shape of the graph indicates the condition of the middle ear:
• Normal tympanogram: A peak is present, indicating that the eardrum is moving normally in response to pressure changes.
• Flat tympanogram: This may indicate fluid buildup in the middle ear.
• Stiff tympanogram: This may indicate scarring or other conditions that restrict the eardrum’s movement.
DEGREE OF HEARING LOSS FOR ADULTS
0-25 Normal: Able to hear sounds and speech sounds in the “banana”.
20-40 Mild: Unable to hear soft sounds. Can hear conversations in a quiet setting, but may have difficulty in noisy environments.
41-55 Moderate: difficulty hearing some quieter conversations.
56-70 Moderately Severe: difficulty hearing normal conversation. may lip-read or use hearing aids.
71-90 Severe: can understand speech only if the speaker is very close.
>90 Profound: typically cannot understand speech and unable to hear ‘loud’ stimuli such as lawn mowers.
TYPES OF HEARING LOSS
Conductive hearing loss- hearing loss arising in the external ear canal, ear drum or middle ear. It refers to anything that blocks the passage of sound through the outer and/or middle ear. Conductive hearing losses are more likely to be correctable with surgery, than sensorineural hearing loss.
Midrange hearing loss- when a person can’t hear mid-pitch sounds, also called “cookie-bite” hearing loss.
Mixed hearing loss - hearing loss that has both conductive and sensorineural components.
Sensorineural hearing loss- hearing loss caused by damage to the sensory cells and/ or nerve fibers of the inner ear. The most common type of hearing loss in adulthood. In the United States, the most common cause is due to chronic noise exposure.
Unilateral hearing loss- Hearing loss in one ear only.