21 minute read
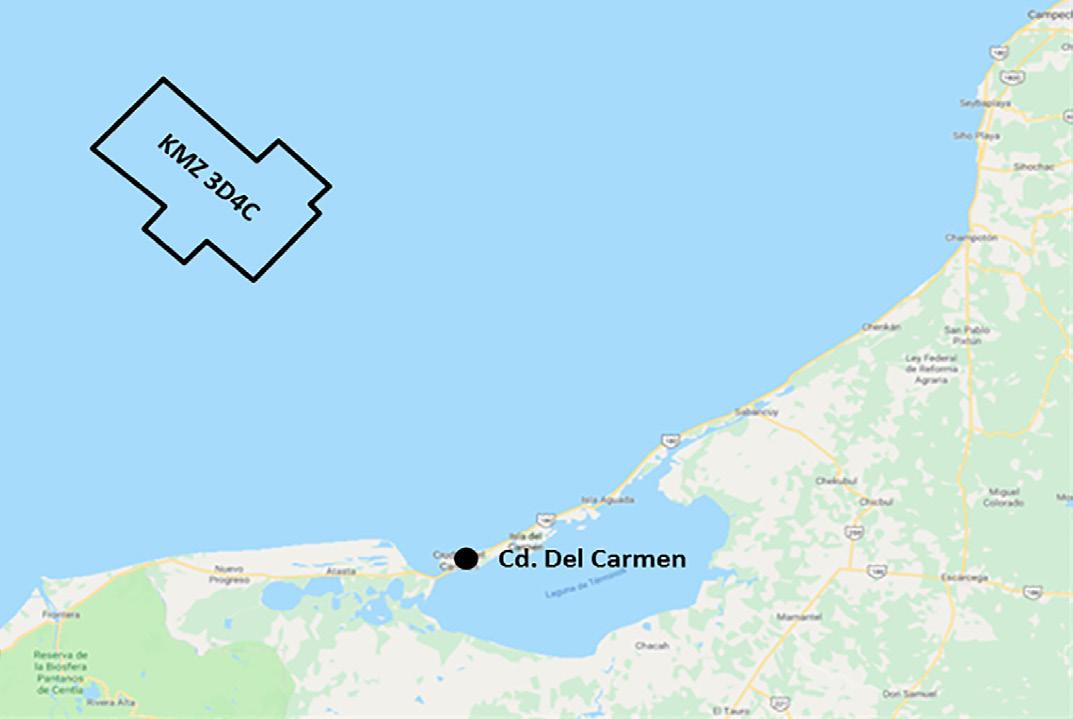
Application of Time Lag Fwi for Velocity Model Building in Perdido: A Southern Gom Deepwater Case Study

from Boletín 4, Vol.3

Ravi Kumar (CGG), Vivek Vandrasi (CGG), Don Dobesh (CGG), Huifeng Zhu (CGG), Alfredo Vázquez (PEMEX), Karla Rosas (PEMEX)
CMP2019_546 Artículo presentado en el CMP / 2019
Advertisement
Summary
In past decade we have seen many successful examples of Full Waveform Inversion (FWI), on a wide range of datasets. All the previous examples using FWI focused on the improvements to overburden sediment sections and typically, an interpretive approach is taken for identifying the salt bodies. In complex geological setting where there is a lack of clear sediment–salt interface, this interpretive approach is prone to error and often multiple scenarios of salt shapes are interpreted and evaluated using Reverse Time Migration (RTM). FWI for salt shape suffers due to amplitude inconsistency and lack of low frequencies in data needed to overcome large scale velocity errors. Till recently salt shape update using FWI has been limited only to 2D synthetic studies when extremely low frequency (0.5 Hz), is present. Recently, FWI results from Shen et al, 2017 using OBN with ultra-long offsets with low frequency proved that FWI could effectively update salt shape with appropriate data, good starting model and good FWI algorithm.
In this abstract we show our data driven approach for model building using time-lag FWI (TLFWI), algorithm which promises to update salt shape based on the algorithm presented by Zhang et al., 2018. This novel technique of FWI minimizes two known problems of FWI – cycle skipping and amplitude leakage when reflection data is used for inversion. Please refer to Zhang et al., 2018 for details of the implementation. For the study area, we use two orthogonal WAZ surveys which provides better illumination compensation in complex geological setting and show how TLFWI can be used to update salt shape and other large velocity errors, thus improving subsalt image.
For depth beyond any diving wave penetration, we used reflection FWI (RFWI), to further extend the reach of FWI and resolve the kinematic errors for deeper events. Our examples use a data driven velocity update flow from Perdido survey of Mexican waters of Gulf of Mexico (GoM).
Geology of the study area
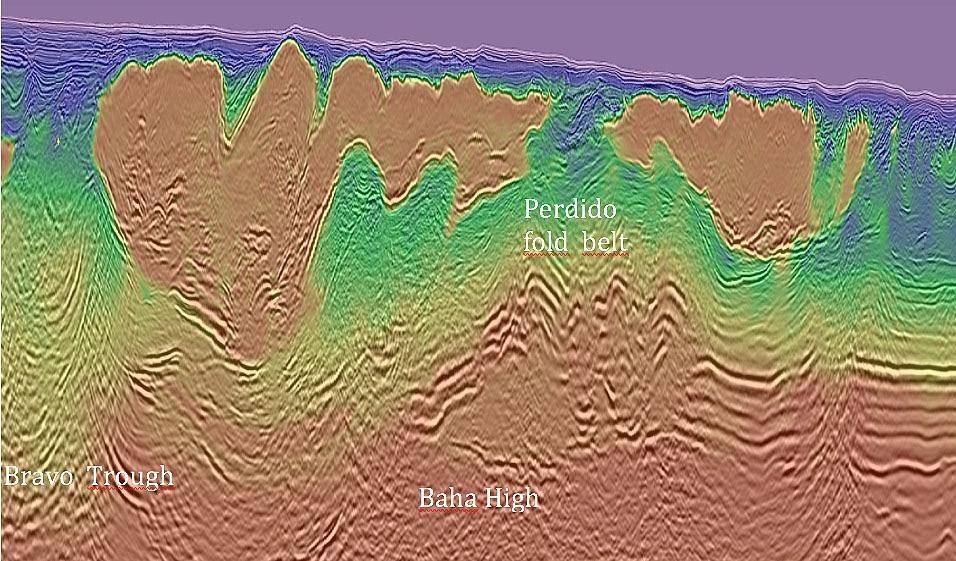
The Centauro MAZ area is characterized by a certain number of key features that separate the survey into distinctly different geologic domains but are all linked closely together. Moving from west to east is the shelf edge with pro-grading sediment wedges and extensional features followed eastward by the Bravo Trough (Hudec et al, 2017, 2018 AGL). Further east is the Baha High (Hudec et al, 2017, 2018 AGL), which is a NE-SW trending basement high that extends into US waters and is named after the Baja discovery. This feature gives rise to the easternmost structure, the Perdido fold belt. Starting from the Bravo trough are a number of salt nappes that originate from large scale sediment deposition to mobilize salt out of what used to be an extension of the great salt wall in US waters, the Bravo salt diaper. So, the Bravo trough could be a large scale bucket mini-basin or multiple mini-basins and the source of most if not all of the allocthonous salt to the east. Much of the Mesozoic section that once was deposited on the Bravo diaper was rafted on top of the salt nappes and flowed eastward leaving a corresponding gap in the section to the west in the Bravo trough. There may be some small amount of Mesozoic section remaining but seismic evidence for it is very minimal at best. The thickness and composition of the rafts varies greatly and poses challenges to model building.
Relief on the Baha high varies with many areas seeing 2+ kms relief which forms a buttress to translation into the basin. Most of the Perdido fold belt forms along and to the east of this high. The western step up is clearly visible throughout the area, but we do not always see the eastern step down and in many areas is assumed and not mapped as it may be further east out of the survey limits.
The Perdido area is characterized by extreme shortening with large scale folds trending NE-SW and large scale thrusting. This
38
geologic setting is ideal for the accumulation of hydrocarbons in the area. The shallower salt nappes have their advances slowed by the relief of the Perdido fold belt as they try to climb above it while also bulldozing sediment imbricate wedges at their fronts. This creates a thin salt nappe front often with ramp and flat base of salt geometry and a ponding and thickening of salt back to the west as salt is continuing to be pumped from autochthonous levels.
The geology of the area presents numerous challenges to velocity model building and imaging. Above salt, there are numerous transported mini-basins some of which are created by rafted carbonate which acts as a “seed” to basin formation with subsidence due to density differences and subsequent additional sedimentation. Mini-basin geometry and velocity modeling are not best suited to be resolved with conventional tomography. The extent of carbonate rafting also plays a part in salt body interpretation as many times there is no clearly defined top of salt reflector due to lack of contrast in velocity between carbonates and salt. The complexity of the top of salt reflector can also be extreme in some areas due to shortening as the nappe tries to advance eastward, but is slowed by bulldozed sediment wedges and the Perdido fold belt. This can create a rugose top of salt geometry with many small overhangs.
Within the salt bodies there are numerous inter-salt reflectors related to allo-suturing and auto-suturing of salt nappes as well as inclusions. Inclusions can be related to rafted carbonates that have subsided into salt, sediments trapped along suturing, and roof material related to over-run diapirs. It is important to identify the most likely source of the reflectivity in order to model the velocity correctly.
Subsalt challenges include over-pressured sediments, encased mini-basins and bulldozed sediments that form the ramp and flat geometries of base of salt.
At greater subsalt depths the extremely tight folding and thrusting of the Perdido fold belt presents a challenge to image steep subsalt dips while also trying to resolve lateral velocity variations.
Figure 1, shows 3 of the major components of the Centauro MAZ (CMAZ) area. The Bravo Trough being the source of the allochthones salt nappes, the western side of the step up onto the Baha High , possibly a ramp down off the high to the east and the Perdido fold belt above as a shortening result of the collision into the Baha High.
39
Survey
The study area consists of two orthogonal WAZ surveys which were acquired in 2011 and 2017, respectively. Earlier survey was conventional four sources and two streamer boat setting with 8 Km streamer length. As shown in figure 2, 2011 East-West (EW) survey lacks good offset coverage in North-South (NS) direction and the 8km offsets limits the penetration depth of diving energy for FWI. The study area falls in the Mexican waters of Gulf of Mexico where water bottom depth can range from 1000 to 3000 m. Deep water bottom further limits any reach of diving energy for a sediment velocity update using FWI. NS survey was acquired in 2017 to fill the gaps of missing azimuth coverage in EW survey and extends offset to help improve the penetration depth of diving wave energy. Figure below also shows the combined coverage of offset and azimuth in the rose diagram for NS and EW surveys. It can be seen that inner red circle which demarcates 8 km offset shows good coverage in most azimuths. For offset beyond 8 km, coverage is mostly in the NS direction. In the following examples we show how both WAZ survey helps in model building and providing better illumination for complex area for RTM image.
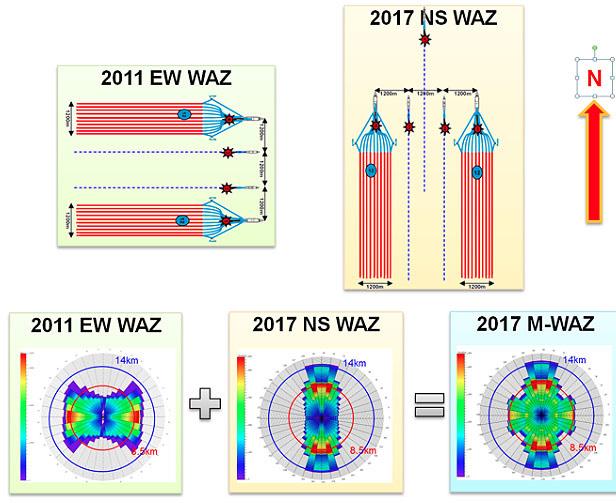
Figure 2, Shows acquisition configuration for NS and EW WAZ surveys. Their corresponding rose diagram can be seen in the diagrams below. As it can be seen from combined NS and EW survey’s rose diagram, a good coverage in around the azimuth is seen up to 8 km.
Impact of Multi- WAZ data on model building
As earlier seen from the rose diagrams, two orthogonal WAZ surveys provide good azimuthal coverage up to 8 km as well as extra-long offset which is helpful for FWI update as well as imaging. Figure 3A shows Multi-WAZ RTM image with our initial model. Images 3B and 3C shows model update using FWI with EW and NS survey respectively. Although subsalt image is improved, some discontinuity is still present at the cretaceous layer. Model update with NS survey shows slightly better image below the Cretaceous and this may be attributed to a combination of different azimuth and extra-long offset from 2017 acquisition which helped with model update. Since two surveys are
40
orthogonal to each other we expect them to hold common and complimentary information about the velocity error which can be helpful for model building. Image from figure 4D shows that discontinuity at cretaceous layer is healed when both the datasets are jointly used for FWI.
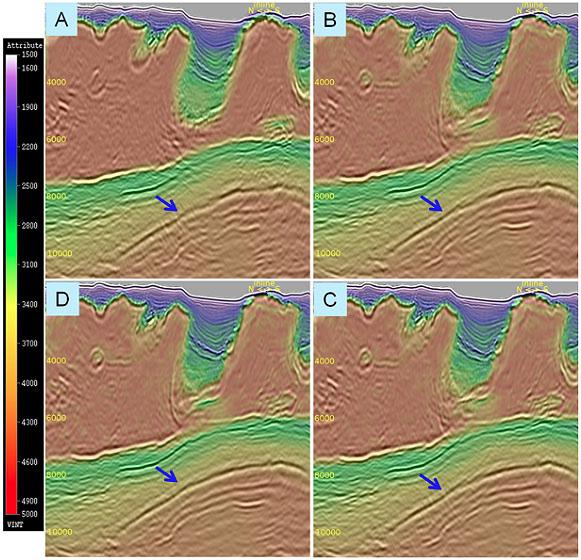
Figure 3, Shows impact of multi Multi-WAZ on velocity update using FWI. Figure A shows RTM image with initial model whereas B and C shows RTM image with velocity model update using NS and EW data respectively. We see improvement in subsalt image with image D due to model update achieved using NS and EW jointly.
Model building: A data driven approach
Typical workflow to update velocity consists of ray based tomography either by Kirchhoff or RTM Surface Offset Gathers (SOG), gathers along with salt interpretation to define salt body. Image based ray tomography works well in area with simple geology, but faces challenges in complex geological setting such as overhangs, shale where input model and image does not provide a suitable gathers for tomography due to the presence of large scale velocity errors.
In the complex geological setting of Perdido fold belt area, subsalt image can be extremely sensitive to the accuracy of salt shape and lateral velocity of shallow sediments especially, salt overhangs. In many areas due to presence of rafted carbonate and thin narrow basins the lack of good quality sediment–salt reflection poses a challenge to get an accurate salt shape through interpretation. All these challenges in the image domain made us rely on an FWI based data-driven iterative approach.
Contrary to image domain approach for model building such as reflection tomography, FWI promises to provide detailed velocity models. It works by iteratively minimizing the least-square error between modeled and real seismic data (Tarantola, 1984; Pratt, 1999; Sirgue and Pratt, 2004). It’s widely used acoustic implementation provides promising results in the shallow overburden. In the past half a decade we have seen many successful stories (Ratcliffe et al., 2011, Mothi et al., 2013, Zhu et al., 2014). FWI has its own challenges due to insufficient low frequencies and lack of offsets large enough to extend the reach of refracted energies. Thus, a reasonable accurate input model is needed which can avoid local minimum and cycle skipping problem. Least squares cost function based FWI is also prone to put
41
amplitude differences of data misfit in velocity which limits its use to diving wave only and salt update remained a challenge.
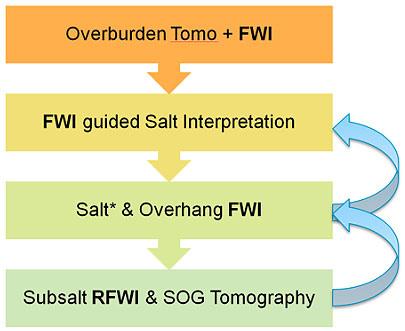
Figure 4, shows model building flow used for centauro project. Two stage iterative update was applied for velocity. TLFWI was initially used to help improve salt interpretation in shallow . Subsalt RFWI and SOG update was done iteratively along with salt and overhang FWI.
Earlier attempts to invert salt velocity using FWIs were limited to synthetic datasets where frequencies as low as 0.5 Hz were available (Brenders and Pratt, 2007) . Success for FWI to update salt in a real data did not come until very recently using OBN data for the Atlantis field ( Shen et al.(2017), and Michell et al. (2017)). In both the abstracts, they stressed the importance of long offsets from OBN data and usable frequencies as low as 1.6 Hz to start the FWI inversion. Resulting update for salt shape, overhang and subsalt velocity greatly improved the image. Zhang et al. (2018), recently developed time lag FWI to use frequency-dependent time windows for time lag measurements and cross correlation coefficients between recorded and synthetic data to mitigate density leakage and cycle skipping issues in FWI. The new technique is called Time-lag FWI (TLFWI), which mostly uses diving energy to update the model, but also works well with reflection data when model is reasonably good or diving energy is available to provide long wavelength background update. They demonstrated with multiple real data examples that TLFWI can be used to update complex salt velocity models which results in improved subsalt image
In this survey, we are encouraged by better penetration depth provided by NS survey along with orthogonal azimuth coverage from EW survey and apply a data domain approach for velocity model building as shown in figure 4. We start by building a good initial model for TLFWI using conventional model building flow which included conventional FWI and tomography for the shallow sediments followed by salt body interpretation. TLFWI is used iteratively as shown in figure 4 to update salt and shallow sediment using both diving and reflection energy. In presence of diving energy, which helps to update background model, TLFWI extract kinematic errors and help in updating locations with complex salt geometries and overhang mini basins. It should be noted that current implementation of TLFWI although well suited for transmission energy also uses reflection energies to update velocity given a reasonably good initial model.
In deeper locations with limited diving energy penetration and larger velocity error, TLFWI did not resolve the salt or carbonate velocity completely but provided crucial hint for those geobodies. Using those crucial hints input model for TLFWI was further updated. This process was done iteratively till a desired result was achieved. For subsalt and deeper location we still relied on reflection energies. Reflection FWI (RFWI), is utilized to update the subsalt velocity after we exhaust the information provided by TLFWI in shallow. Nicholas and Gomes (2017), showed an RFWI flow that successfully separates low wavenumber component from reflection FWI gradient to update velocity as outlined by Mora (1989). Density and velocity are updated from the high- and low-wavenumber components of the gradient respectively. The high-wavenumber update introduces the sharp contrasts needed to generate back-scattered energy for
42
the low-wavenumber velocity update. RFWI improves the match between synthetic and real data with updated velocities of relatively good lateral resolution (high kx, ky), and poor vertical resolution (low kz).
In the deep-water regions of the Gulf of Mexico, our ability to image subsalt structures has improved significantly with wide-azimuth data, reverse time migration, anisotropic imaging and tomography. However, subsalt velocity updating remains difficult in areas with complex salt geometry. Features like steeply dipping salt flanks and subsalt three-way closures create scenarios where limited incident angles are available for residual curvature analysis and velocity updating. Long-offset and full-azimuth acquisition configurations are the latest acquisition technology designed to address these subsalt challenges.
This paper presents improved tomography update and subsalt imaging from a staggered acquisition, which provides both ultra-long offset and full-azimuth data coverage.
TLFWI update for supra salt errors, salt/carbonate hints and iterative TLFWI
As shown in figure 5 we can see evolution of model with iterative TLFWI and salt shape update. Figure 5(A) clearly shows some of the locations in subsalt which lacks event continuity even though no obvious salt body error is observed. Initial TLFWI not only resolves shallow salt body but provides crucial hint for deeper salt and rafted carbonate bodies (figure 5B). Utilizing hints from initial FWI and updated input model for FWI is created as shown in (figure 5C). TLFWI is run iteratively by improving input model for inversion and thus resolving velocity errors pertaining to salt and carbonate. This data driven approach not only enhances the subsalt image as shown in figure 5D but it is less interpretation intensive. Figure 5 also shows that initial model is still crucial for time lag FWI but it belter handles amplitude and cycle skipping issues from conventional FWI when reflection energy is used.
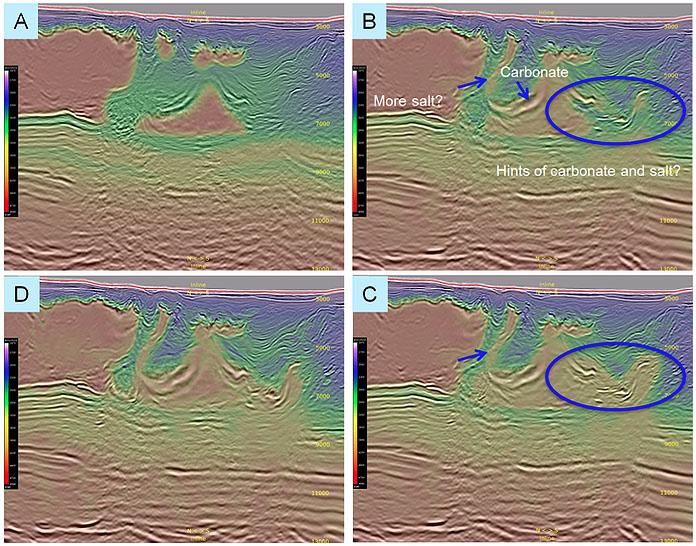
Figure 5, Above figure shows iterative TLFWI to update salt, carbonate and overhang velocities. (A) shows initial model after conventional ray based tomography update and salt interpretation. Intial TLFWI not only updates shallow salt velocity errors but gives hint for salt and carbonate beyond diving wave update in deep (B). Initial model updated after hints from initial TLFWI (C) and process is repeated to achieve model (D).
43
Model update in complex overburden setting and beyond diving energy penetration depth
Region shown in figure 6 is highly faulted and folded shallow sediments along with severe folding of the Mesozoic section and below, the rafted sections of Wilcox and carbonates have all resulted in little to no resolution of the area with the starting model. This prevented tomography to work well in this area since it relies on good gather quality.
For example shown in figure 6, even though the diving waves reached the top of the reservoir, the lack of good low frequency signal (less than 3.0Hz), resulted in cycle skipping in the case of Conventional FWI, due to starting model that is far off from the complex model which is required to resolve the section. TLFWI, on the other hand, was able to utilize even the poor quality signal at 3Hz. This has helped in attaining a better background velocity update and a high resolution model down to the level shown by blue arrow in figure 6, using refraction data.
Beneath the diving wave penetration, TLFWI used dominant reflection data and the resultant update is geological with good lateral resolution in the Mesozoic section and below, which was essential in achieving significant uplift to the complex underlying structure. This has made way for better interpretation and understanding of the geology. TLFWI update using reflection energy is available to resolve the lateral velocity errors. The regions marked in blue and green color are updated using TLFWI. Most of the shallow overburden details showing folded wilcox section had good illumination with diving energy (depth shown by blue arrow in figure 6B). Below the depth marked by blue arrow, diving energy depth gets slowly depleted and TLFWI is more driven by reflection with multiple iterations of inversion and updating initial model. Those locations are shown by green arrows. In the subsalt section reflection based FWI is better suited when initial model may have larger error in velocity. In such location as seen by red arrows , model lacks vertical resolution but have lateral resolution to improve the image.
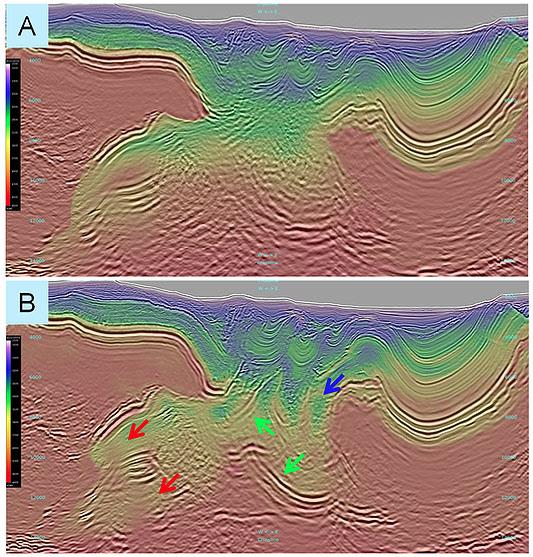
Figure 6, shows the impact of TLFWI in complex overburden location. Figure 6A shows model and image before time lag FWI. Blue arrow in figure 6B shows a depth up to which refracted energies has good contribution. A detailed resolution in the model is observed in all the direction. Green arrows shows update with TLFWI but lacks the same resolution in shallow. Regions shown by red arrows were updated by reflection only and lacks vertical resolution.
44
Figure 7 shows another example where we successfully applied data driven FWI approach. Mid-section of the legacy image in figure 7A, shows interpretation of Wilcox layer based on RTM image using least squares FWI, tomography and interpretation driven model building. Poor image for the entire Mesozoic section below the black interpreted horizon (in figure 7a), is the result of reflection tomography failing to invert velocities of the complex fold and FWI fails to give any reasonable update below the shallow Paleocene layer. This complex geology is way too difficult for interpretation driven velocity re-trends and scans to resolve. Resulting image in such regions clearly shows model errors in the shallow – many broken events and regions of extremely low reflectivity
Figure 7B image on the right show the impact of lateral and vertical resolution resulting from TLFWI. The legacy interpretation is completely changed with new image which shows extremely folded section too deep to be resolved by conventional FWI algorithms. The deeper sections shown by red arrows took multiple iterations of iterative the data driven approach using TLFWI. This example clearly shows that TLFWI can successfully use reflection data along with diving energy to extend the depth of high resolution velocity model and thus improving image significantly.
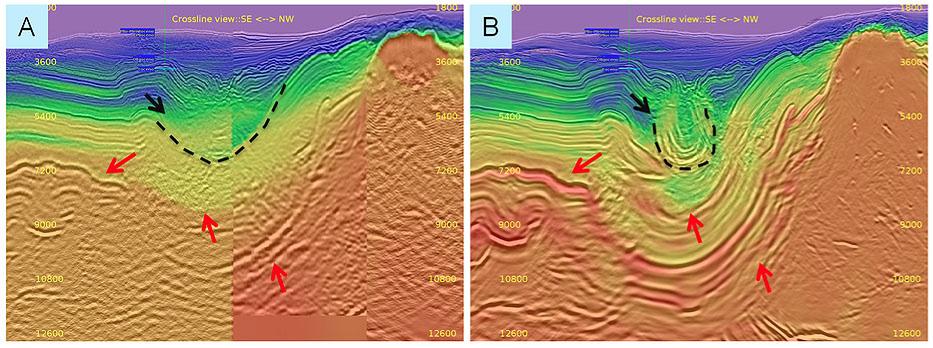
Figure 7 (A-B), shows the impact of TLFWI even beyond the diving energy penetration depth. Figure 7A in left shows model and image with conventional approach while on the right figure 7B shows improved model and image with details provided from data driven model building approach.
Reflection FWI for subsalt update
TLFWI brings uplift in subsalt image by improving salt shape and resolving lateral and vertical complexities which were never seen before. For the deeper and subsalt image where TLFWI update was limited due to lack of diving energy we relied on reflection energies to update velocity model using FWI. Usefulness of ray based tomography using SOGs are also limited due to weak or lack of usable reflectors on gathers to work on. We used RFWI to update the subsalt velocity by reducing the kinematic errors using reflection energy. After RFWI, subsalt events are more continuous. As shown in figure 8, RFWI brings needed lateral resolution which improves subsalt image. The updated model from RFWI can be combined with SOG gathers based reflection tomography to further update velocity errors.
45
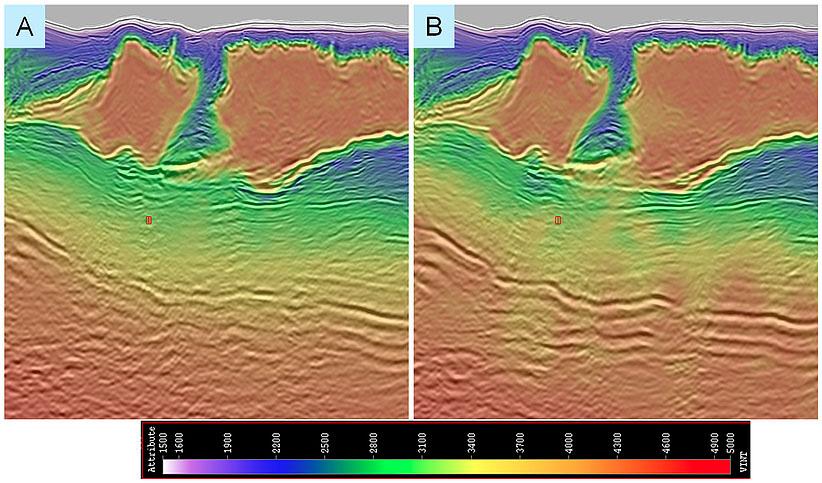
Figure 8, shows the velocity models before and after RFWI update: a) initial model for RFWI which has iterative TLFWI update applied. B) Model and image after RFWI update shows good lateral resolution but poor vertical resolution.
Conclusion and Discussion
NS and EW survey provides good azimuthal coverage which helps in solving illumination issue in complex geological setting and thus improving model and subsalt image. NS survey from 2017 with leading boat acquisition extended the reach of diving energy with available offsets as long as 14 km, a crucial for FWI update.
In this study, we presented an iterative velocity update flow which is mostly data driven for WAZ data. We showed how TLFWI can minimize the impact of amplitude leakage and cycle skipping and can be iteratively used for salt update. TLFWI can use information from both diving and reflection energy and guide salt interpretation by providing crucial hints where large velocity errors are present. In subsalt section with lack of diving energy and large velocity error, reflection based FWI can provide a better model. It helps in by providing lateral resolution in model. RFWI was used in conjunction with salt shape and carbonate update iteratively too which helps improve subsalt image.
If the acquired data consisted of good low frequencies energy, longer offset and full azimuth, the dependence on an iterative approach can be reduced. Time Lag FWI could potentially invert the velocity model directly when the starting model is close enough.
References
Ahmed, I., 2018, Diving wave illumination using RTM to analyze acquisition geometries for FWI: 88th Annual International Meeting, SEG, Expanded Abstracts, 1299-1303.
Brenders, A.J., Pratt,A.K, 2007,Full waveform tomography for lithospheric imaging: results from a blind test in a realistic crustal model, Geophysical Journal International 168(1), 133-151.
Chazalnoel, N., Gomes, A., Zhao, W. and Wray, B. [2017] Revealing shallow and deep complex geological features with FWI: Lessons learned. 79th EAGE Conference & Exhibition, Extended Abstracts, We A3 02.
Michell, S., X. Shen, A. Brenders, J. Dellinger, I. Ahmed, and K. Fu, 2017, Automatic velocity model building with complex
46
salt: Can computers finally do an interpreter’s job?: 87th Annual International Meeting, SEG, Expanded Abstracts, 5250-5254.
Mora, P. [1989] Inversion = migration + tomography. Geophysics, 54(12), 1575-1586.
Mothi, S., Schwarz, K., and Zhu, H., [2013] Impact of Fullazimuth and Long-offset Acquisition on Full Waveform Inversion in Deep Water Gulf of Mexico. SEG Technical Program Expanded Abstracts 2013: pp. 924-928.
Ratcliffe, A., Win, C., Vinje, V., Conroy, G., Warner, M., Umpleby, A., Stekl, I., Nangoo, T., and Bertrand, A. (2011) Full waveform inversion: A North Sea OBC case study. SEG Technical Program Expanded Abstracts 2011: pp. 2384-2388.
Shen, X., I. Ahmed, A. Brenders, J. Dellinger, J. Etgen, and S. Michell, 2017, Salt model building at Atlantis with full-waveform inversion: 87th Annual International Meeting, SEG, Expanded Abstracts, 1507-1511.
Tarantola, A. [1984] Inversion of seismic reflection data in the acoustic approximation. Geophysics, 49(8), 1259-1266.
Zhang, Z., J. Mei, F. Lin, R. Huang, and P. Wang, 2018, Correcting for salt misinterpretation with full-waveform inversion: 88th Annual International Meeting, SEG, Expanded Abstracts, 1143-1147.
Zhu, Huifeng & Chazalnoel, N & Zhao, W. (2014). Building a High-resolution Model with Full Waveform Inversion in Deep Water West Africa. 10.3997/2214-4609.20141416.
Professional career of the author and co-authors
Ravi Kumar. M.S. in Geological and Earth Sciences from Rice University With 10 years of experience. He currently holds the position of Imaging team Leader at CGG.
Vivek Vandrasi. M.S. in Electrical Engineering from Texas A&M University With 8 years of experience. He currently holds the position of Sr. Project Leader at CGG.
Huifeng Zhu. PhD. in Physics from University of Houston With 9 years of experience. He currently holds the position of Sr. Supervisor at CGG.
Don Dobesh B.S. Geology from S.U.N.Y at Stony Brook with 37 years of experience. He currently holds the position of Depth Imaging Interpretation Supervisor.
47