&
Wetland Science Practice published by the Society of Wetland Scientists
Vol. 44, No. 4 October 2026 ISSN: 1943-6254
FROM THE EDITOR'S DESK
Chris Craft WSP Editor
The days are shorter, the nights are longer, and the leaves are falling ... in most places. The growing season ends as plants and animals seek dormancy in preparation for winter. Fall is a season of change. Just like the color palette of the changing leaves, the fall issue of WSP offers an assortment of articles describing basic, applied, and historical wetland science.
In The Beast in the Mosquito: Malaria and the Pontine Marshes of Italy, van der Valk gives us another excellent article, this one describing the history of malaria and its relationship with mosquitoes, wetlands, and people. In Early Indications of Salt Marsh Migration in Northern New England, Peter and coworkers describe the consequences of rising tides and saltwater encroachment on tidal marsh vegetation. Sparrow et al. discusses data integration in NOAA’s National Water Model Streamflow Data into the US Army Corps of Engineers’ Antecedent Precipitation Tool to improve the ability to predict wetland hydrology across a range of climate conditions and geographic regions of the United States. Jog and co-workers describe a rapid assessment method (RAM) for wetlands in the Midwest (Illinois), complementing other RAMs in the region. We conclude with an opinion piece by Gupta that makes the case for the unappreciated role of constructed floating wetlands for enhancing biodiversity.
274 Wetland Science & Practice OCTOBER 2026
In SWS News, we are excited to publish abstracts from the Student Chapter Virtual Meeting held earlier this summer and look forward to regular contributions from our future leaders. On a somber note, we are saddened by the loss of Richard Chinn, who taught countless members about jurisdictional delineation and who, until his untimely death, spearheaded the planning of the 2027 annual meeting in Savannah, Georgia. Last but not least, in Notes from the Field, take a visit to the Green Swamp and enjoy the diversity of insectivorous plants there. Chris Emeritus Professor and PWS
CONTENTS Vol. 44, No. 4 OCTOBER 2026 ISSN: 1943-6254 274 / From the Editor's Desk 276 / President's Message 278 / SWS Webinars 278 / What's New 280 / Advertising Prospectus 281 / SWS News Abstracts from the 2026 SWS Student Section Virtual Conference 289 / In Memoriam: Richard Chinn (1959-2025) ARTICLES 290 / The Beast in the Mosquito: Malaria and the Pontine Marshes. Arnold van der Valk. 301 / Early Indications of Salt Marsh Migration in Northern New England from 2014 to 2019. Christopher R. Peter, Susan C. Adamowicz, Ralph Tiner, Taylor Leitch, Kathleen M. O’Brien, Nancy Pau, Rachel A. Stevens, and Bri Benvenuti. 316 / Evaluating NOAA's National Water Model v3.0 Streamflow Data for Integration into the US Army Corps of Engineers' Antecedent Precipitation Tool. Kent Sparrow, Stephen Brown, Christopher French. 328 / Development and Validation of a Wetland Rapid Assessment Method for Illinois, USA. Suneeti K. Jog, Matthew M. Finzel, Rohini Vembar, and Jason T. Bried. 338 / Opinion Paper: Reassessing Artifical Floating Wetlands: Overemphasis on Bioremediation with an Understudied Potential for Biodiversity and Habitat Enhancement. Ashwin Rajesh Gupta. 343 / Notes from the Field 347 / Wetlands in the News 349 / Wetlands Bookshelf 350 / WSP Submission Guidelines
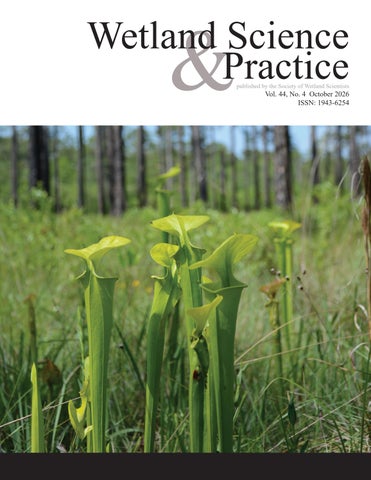
COVER PHOTO: Pitcher plants (Sarracenia flava) against the backdrop of pine flatwoods in the Green Swamp. (Photo by Chris Craft)
SOCIETY OF WETLAND SCIENTISTS 1660 INTERNATIONAL DRIVE, SUITE 600 MCLEAN, VA 22102 (608) 310-7855 WWW.SWS.ORG
Note to Readers: All State-of-the-Science reports are peer reviewed, with anonymity to reviewers.
&
Wetland Science Practice PRESIDENT / Andy Baldwin, Ph.D. IMMEDIATE PAST-PRESIDENT / Becky Pierce SECRETARY GENERAL / Loraé Simpson, Ph.D. TREASURER / Yvonne Vallette, SPWS PRESIDENT-ELECT / William Morgante EXECUTIVE DIRECTOR / Marla Stelk MARKETING MANAGER / Simeonne Bookal WETLAND SCIENCE & PRACTICE EDITOR / Chris Craft CHAPTERS ASIA / Seung Oh Suh CANADA / Susan Glasauer, Ph.D. CENTRAL / Darren Mitchell CHINA / Ming Jiang EUROPE / Columba Martinez-Espinosa INTERNATIONAL / Alanna Rebelo, Ph.D. and Roman A. Canul Turriza MID-ATLANTIC / Michael Gaul NEW ENGLAND / Timothy Twohig NORTH CENTRAL / Matt Van Grinsven OCEANIA / Jeff Kellaway PACIFIC NORTHWEST / Shelby Petro ROCKY MOUNTAIN / Jeremy Sueltenfuss SOUTH ATLANTIC / Katie Bowes SOUTH CENTRAL / Eric Fuselier WESTERN / Richard Beck, PWS, CPESC, CEP SECTIONS BIOGEOCHEMISTRY / Anthony Mirabito EDUCATION / Lynn Corliss GLOBAL CHANGE ECOLOGY / Owen McKenna PEATLANDS / Rod Chimner PUBLIC POLICY AND REGULATION / John Lowenthal, PWS RAMSAR / Nicholas Davidson, Ph.D. RIGHTS OF WETLANDS / Gillian Davies STUDENT / Alexis Jackson WETLAND RESTORATION / Goldin Quadros WILDLIFE / Andy Nyman WOMEN IN WETLANDS / Chelsea Nitsch and Angeline Mano COMMITTEES AWARDS / Jillian Olsen EDUCATION AND OUTREACH / Jodie Burns FUTURE MEETINGS / Yvonne Vallette, SPWS GLOBAL REACH / Marinus Otte, Ph.D. GRANTS / Rachel Schultz HUMAN DIVERSITY / Rebecca Milano MEMBERSHIP / Lorae Simpson, Ph.D. PUBLICATIONS / Keith Edwards WAYS & MEANS / Yvonne Vallette, SPWS and Lori Sutter WETLAND CONCERNS / Max Finlayson WETLANDS OF DISTINCTION / Roy Messaros, Ph.D., Jason Smith, PWS, Colin MacLaren, and Brian Matthews Charles REPRESENTATIVES PCP / Ellen Hartig WETLANDS / Tatiana Lobato de Magalhães WETLAND SCIENCE & PRACTICE / Chris Craft
Meet Our New Leadership Team
Besides presenting PRESIDENT'S MESSAGEinformation on wetland science, policy, and education/outreach at our annual meeting, it is th time for new leadership and changing in roles within the Society. All Wetlands, All the Time
All wetlands, all the time.
PRESIDENT For those of us who love
Each of you has your own version of these wetlands and work in wetlands— experiences—which I would presume to understandchapter Andy Baldwin is the SWS President for 2026-2027. Andy is not from the Mid-Atlantic as scientists, from myHe own some things seem and served asconsultants, SWS President in 2009-10. is perspective. currently aBut professor and extension specialis managers, regulators, educators, nearly universal in today’s world: work can be at the University of Maryland. policymakers, organizers, or hard, complicated, and physically and emotionally volunteers—we are fortunate exhausting. to do work that we care deeply Andy Baldwin I find that when I keep the larger purpose in mind, I feel about. We love our jobs. But, of President better not only about my work but about my life outside course, every job has parts that of work as well. I find myself drawn to wetlands even PRESIDENT-ELECT are not so much fun. when I am not working—to look at the plants, to enjoy Bill Morgante is the President-elect 2026-2027. served as President of the I’m thinking of too many emails. Bureaucratic red thefor quiet and solaceBill of these places, and to reflect on Midtape. Controversies surrounding wetlandand restoration, howWetlands remarkableofitDistinction is to considerInitiative. the diversity Atlantic Chapter championed the Heofislife thethat Wetlands protection, research findings, or new initiatives. a wetland can support. Administrator for tidal wetlands at Maryland's Board of Public Works in Annapolis. Changes in government policies regulating impacts to I’ve even written a song about wetlands—although I wetlands. Long field days. Successes, but also failures. should admit that I love music too, for better or worse, Zoom meetings one after another, with little time for a lot of the music I enjoy has absolutely nothing to do thought—or even a restroom break. Strong feelings with wetlands. :-) about what is right, sometimes SECRETARY coming GENERALfrom people who also care deeply about wetlands, but whose views So whether you work in policy, engineering, law, conflict with your own. research, education, outreach,Kai economics, restoration, Lorae Simpson serves as the Secretary General, succeeding as Secretary General. She is or any of the myriad areas involved in the wise use, Many of us have experienced someEnvironmental or all of these Scientist at St. Johns River Water Management District Supervising in Fort restoration, management, protection, and understanding things, and yet we still love wetlands. of wetland ecosystems, perhaps this mantra can help the Pierce Florida. I once had a mentor who said they enjoyed what they next time you feel tired, frustrated, worn out, or burned did 90 percent of the time. I remember thinking, “Wow. out: I’m probably closer to 60 percent.” All wetlands, all the time.
But something I haveTREASURER kept in mind over the years is that That is the mission. nearly all of those challenging or frustrating activities YvonnetoValette will continue her role as SWS Treasurer. She served this role in 2024-25. relate, directly or indirectly, wetlands. And it is noble.
also better is Chair of the SWS Meetings Committee. She is a retired Aquatic Ecologist at When I consider this,Yvonne I feel a little responding --Andy Baldwin to yet another email.the I feel better navigating an online U.S. Environmental ProtectionPresident, Agency. SWS bureaucratic system. I feel better about a journal rejection notice or a project that didn’t turn out the way I had hoped. The frustrating things become easier to put into perspective when I remember why I am doing PAST-PRESIDENT them. Becky Pierce previously served as SWS President in 2024-25 and SWS President-Elect in 2023-24. Becky served as President of the Rocky Mountain Chapter. She is a Wetland Program Manager for the Colorado Department of Transportation.
276 Wetland Science & Practice OCTOBER 2026
Find Your Place in the SWS Community New membership rates. More ways to connect. One global community advancing wetland science. The Society of Wetland Scientists has introduced updated membership rates designed to make SWS membership accessible at every stage of your career.
NEW & UPDATED MEMBERSHIP OPTIONS Early Career Professional $59/year
Join the SWS Community
Available to professionals earning less than $40,000 annually.
Emeritus $65/year
Available to members age 65+ who have been part of SWS for at least 10 years.
Lifetime Membership $2,125
Stay connected to SWS for a lifetime with a one-time membership.
Student Members Get Connected from Day One
Students who join or renew are automatically enrolled in both the SWS Student Section and their geographic chapter, opening the door to networking, mentorship, professional development, and connections with fellow students.
MAY 18–21, 2027 SAVA NNA H, GEORGIA
Tides of Change: Advancing Wetland Science to Solve Global Issues
Join wetland scientists, practitioners, researchers, students, and partners from around the world in historic Savannah for the 2027 Society of Wetland Scientists Annual Meeting.
Connect with wetland scientists around the world and access opportunities to learn, collaborate, and grow throughout your career. Scan the QR code to explore membership options
Marriott Savannah Riverfront The official SWS 2027 hotel room block is now available. Scan the QR code to book your room
Put Your Organization in Front of 400+ Wetland Professionals Interested in sponsoring or exhibiting at SWS 2027? Connect with SWS Executive Director Marla Stelk at marla.stelk@sws.org to be among the first to hear about opportunities to showcase your organization to the global wetland science community.
Together, we’ll explore the science, ideas, and collaborations helping our community respond to changing environments and address the global challenges facing wetlands.
Wetland Science & Practice OCTOBER 2026 277
SWS WEBINARS
Thursday, October 15, 2026 | 1:00 PM (Eastern)
Thursday, November 19, 2026 | 1:00 PM (Eastern)
Thursday, December 17, 2026 | 1:00 PM (Eastern)
Title: Advancing Rights of Wetlands to Transform Wetland Futures
Title: Hunting, Gathering, and So Much More: Wetland Prairie Prioritization for the Quinault Indian Nation
Title: TBD
Speaker: Gillian T. Davies, PWS, RSS
Speaker: Janice Martin
SWS WEBINAR SPONSORS THANK YOU, SPONSORS!
WHAT'S NEW Latest from the Journal Wetlands To find the latest technical articles on wetlands from our companion journal Wetlands, go to https://link.springer.com/journal/13157.
278 Wetland Science & Practice OCTOBER 2026
Speaker: TBD
SOLUTIONS Constructed Wetlands Dune Rehabilitation & Restoration Ecosystem Restoration Green Roofs & Rooftop Gardens Habitat Preservation & Restoration Boulder County Flood Recovery and Ecosystem Restoration / Boulder, Colorado
NATURE-BASED SOLUTIONS As one of the world’s leading planning, engineering and consulting firms, Michael Baker International believes in the power of naturebased solutions to reduce risk and improve infrastructure for a more resilient and sustainable future.
For more information, contact Richard Beck, PWS, Michael Baker Practice Executive P: 949-855-3687 E: rbeck@mbakerintl.com
Hybrid Green-Gray Solutions Living Shorelines Mitigation Offsets & Banking Phytoremediation Recreational Resources Regulatory Processing Riparian Habitat Creation & Restoration Shoreline Restoration Stream & Floodplain Restoration
Westside Creeks Restoration / San Antonio, Texas
Bow Creek Stormwater Park Flood Mitigation Improvements / City of Virginia Beach, Virginia
Watershed Restoration Wetland Delineation
PROUD SUPPORTER OF THE SOCIETY OF WETLAND SCIENTISTS
Wetland Science & Practice OCTOBER 2026 279
ADVERTISING PROSPECTUS
2026 Advertising Prospectus
Coastal Wetlands of the Wilderness Lakes System, South Africa, Photographed by Douglas Macfarlane.
Monthly Newsletter The SWS monthly newsletter is sent to approximately 3,000 members around the world, and enjoys an open rate between 40-50%, which is well above industry average. Place your organization in front of leading environmental scientists monthly with an ad that links to your website.
Price (per ad)
1x
3x
6x
12x
$100
$90 ($270 total)
$80 ($480 total)
$70 ($840 total)
• Ad Format: .jpeg or .png • Ad Due Date: Artwork and link URL due on the first of the month in which the ad is to run.
• Size Specifications: 300 pixels wide x 250 pixels tall, 72 dpi • Distribution Date: On or around the 15th of each month
Website The SWS website boasts nearly 200 daily visitors annually and is a user-friendly, engaging, and SEO optimized format. By purchasing ad space on sws.org, you will increase the visibility of your product or service directly to our audience of wetland professionals, academics, and other science-based fields that will benefit the most from what your company has to offer.
Quarter 1
Quarter 2
Quarter 3
Quarter 4
Ad Due Date
January 2
March 27
June 24
Sept 25
Ad Begins
January 9
April 3
July 1
October 2
• Pricing: $300 quarterly; $1,000 yearly • Ad Format: .jpeg or .png • Size Specification: 300 pixels wide x 250 pixels tall, 72 dpi
• Ad Due Date: Artwork and link URL due one week prior to beginning run date • Ad Begin Date: Ad uploaded the first day of the first month of the quarter
Wetland Science & Practice (WSP) WSP is the SWS quarterly publication aimed at providing information on select SWS activities (technical committee summaries, chapter and section workshop overview/abstracts, and SWS-funded student activities); brief summary articles on current or recently completed wetland research, restoration, or management projects; information on the general ecology and natural history of wetlands; and highlights of current events. It is distributed digitally, with over 2,000 impressions and more than 300 reads in the first six months after release. • Ad Format: Press quality .pdf with images rendered at 300 or higher dpi • Ad Due Date: Artwork is due on the 15th of the month prior to the month of publication • Distribution Date: WSP is published on or around the middle of the month of publication
Pricing and Print Specifications
1x
2x
3x
4x
Full page (7.5” x 10” tall)
$275
$250
$225
$200
Half page (7.5” x 4.625” tall)
$175
$160
$145
$130
Quarter page (3.625 ” x 4.625” tall)
$120
$110
$100
$90
January issue
April issue
July issue
October issue
Ad Due Date
December 15
March 15
June 15
September 15
Issue Published
January 3
April 3
July 5
October 4
Interested in targeted exposure to SWS members? Contact info@sws.org | www.sws.org
SWS NEWS
Abstracts from the 2026 SWS Student Section Virtual Conference July 31 - August 1, 2026
This year was our third annual Student Section Virtual Conference, which we hope to continue to host each year. The goal of the virtual conference is to provide student members with a platform to share their research and connect with other students in wetland science. The student virtual conference is organized and designed by students with the intention of having the entire conference tailored toward student and early career members. The conference is hosted on the virtual platform Gather to encourage student participation from across the globe. Attendees of the conference are able to participate in plenary talks, workshops, socials and win awards for student oral/poster presentation competitions. Anthony J. Mirabito, Ph.D. Postdoctoral Scholar Aquatic Biogeochemistry Lab Department of Biology, University of Central Florida
Student Poster Presentations Abigail Adjei (Poster 1) Kwame Nkrumah University of Science and Technology The Effect of Land Use on Heavy Metal Contamination: Insights from Water Quality Assessments and Public Health Risks in the Keta Wetland Complex. The Keta Wetland Complex, aside from its ecological significance, provides surface water (SW) and groundwater (GW) for surrounding communities. However, human activities over the past few decades threaten these life-supporting resources. While many studies have focused on the hydrochemistry of water resources in the area, few have investigated heavy metal (HM) concentrations and the effects of land use on their levels in water sources. This study assessed 16 HMs and hydrochemical parameters in GW and SW sources across 79 locations. HM levels were below the WHO benchmark; conversely, arsenic exceeded the safe limits for HQ and LCR indices. Cumulative toxicity assessment showed potential health risks for 50% GW / 49% SW in
adults and 75% GW / 61% SW in children. Correlation and spatial analyses identified HM sources associated with land uses, including agriculture, improper sewage and human waste disposal. Findings suggest strategic plans for sustainable water management and public health protection I am Abigail Adjei, a PhD candidate in Water Resource Engineering and Management at KNUST, Ghana. I am very concerned and enthusiastic about environmental issues, conservation, and sustainability.
William Arian Latson (Poster 2) University of Central Florida Understanding cellulose-lignin controls on nitrogen stabilization pathways in marsh and mangrove soils through Acid Detergent Fiber analysis. While recent research has shifted soil organic matter (SOM) theory from chemical recalcitrance toward mineral association as a driver of long-term persistence, the mechanisms linking organic matter (OM) quality to nitrogen (N) stabilization remain unclear in coastal wetlands. This study evaluates how cellulose- and ligninrich inputs regulate whether newly added N is retained in particulate organic matter (POM) or transferred to mineral-associated organic matter (MAOM). Marsh and mangrove soils receiving N fertilization were fractionated into POM and MAOM pools, and acid detergent fiber analysis quantified cellulose and lignin to examine how OM quality influences partitioning of a ^15N tracer among SOM fractions. We hypothesize that lignin-rich mangrove soils retain more ^15N in POM, whereas cellulose-rich marsh soils promote microbial processing and greater N stabilization in MAOM. We further hypothesize that a higher cellulose-to-lignin ratio increases N stabilization in MAOM, linking OM chemistry to vegetation-driven differences in soil N retention. William Arian Latson is an undergraduate student in the Department of Biology at UCF. His research focuses on soil biogeochemistry, nutrient cycling, and organic matter dynamics in coastal wetlands. He conducts research in the laboratory of Dr. Lisa Chambers, currently within a project overseen by graduate student Mercedes Pinzon, of where he investigates the mechanisms governing
Wetland Science & Practice OCTOBER 2026 281
nitrogen stabilization in marsh and mangrove soils using artificial intelligence are transforming how wetland ecosystems can be monitored. This proposal explores the stable isotope tracers and soil fractionation techniques. potential for benthic diatoms to serve as an additional line of biological evidence within this evolving landscape of Camille Mench (Poster 3) wetland assessment. Widely used as sensitive bioindicators University of Central Florida in streams, rivers, and lakes, diatoms respond rapidly Biogeochemical impact of non-plastic coastal restoration to environmental change and may strengthen wetland materials monitoring by providing complementary insights into Coastal wetland restoration projects often include ecosystem condition. This proposal considers how nature-based shoreline protection, such as the placement established ecological assessment concepts, including of oyster shell bags to act as wave-breaks, reduce multi-metric indices (MMIs), biological condition erosion, and facilitate oyster recruitment and growth. gradients (BCGs), and trait-based approaches, might be Historically, inexpensive and durable polyethylene (PE) thoughtfully integrated with diatom ecology and adapted mesh bags were widely used as shell bags, but release of for wetland systems. It seeks to stimulate discussion microplastics has become a concern for the environment among wetland scientists, managers, and practitioners to and public health. This research investigated impacts of refine this conceptual framework, identify opportunities three alternative materials (basalt fiber mesh bags, BESE for collaboration, and guide future funding initiatives. biopolymer mesh bags, cement-infused jute rings) and Ultimately, the long-term vision is to contribute to the traditional PE mesh bags over a 6-month period. Initial development of a flexible, modular wetland assessment compositions of the three alternative materials were architecture capable of incorporating both established quantified, including total metal content for basalt fiber. indicators and emerging ecological data streams to After six months, mass loss was analyzed for deployed support more resilient conservation, restoration, and material. The field study was complemented by a ecosystem stewardship. laboratory incubation to quantify the release of nutrients from each material into surrounding surface water. Findings will help inform restoration practitioners of Kara Bowles (Poster 5) Northern Michigan University the best non-plastic materials to use for coastal shoreline Impact of Climate Change on Arthropod Abundance Along the protection.
Lower Branch of the Rouge River
Camille is an undergraduate student moving into her The Great Lakes region is experiencing climatemaster’s degree at the University of Central Florida in driven shifts in precipitation, with more frequent the Aquatic Biogeochemistry Lab. extreme rainfall and drought. These shifts can alter arthropod population size, distribution, physiology, Nesy Oja (Poster 4) feeding behavior, species interactions, migration, and Ecosystem Scientist based in New England, US. communication. Because arthropods are a primary food Expanding the Wetland Assessment Toolbox: Integrating Diatoms source for many insectivores and provide key ecosystem into Next-Generation Wetland Monitoring services, declines in their abundance and biomass could Wetlands are among the world’s most productive and have cascading trophic effects. This study examines how threatened ecosystems, providing essential services precipitation patterns affect arthropod communities by that support biodiversity, ecological integrity, and measuring both abundance and biomass, offering a more human well-being. As these ecosystems face increasing complete picture of community structure and energy pressures from changes in hydrology, land-use, and availability. Using a standardized protocol, we deployed climate, effective monitoring is critical for informing malaise traps at two sites on the Lower Rouge River conservation, restoration, and long-term ecosystem each May through July over three years, recording total stewardship. Wetland assessment is entering an era arthropod abundance and biomass. Additionally, DNA of rapidly expanding ecological data. Advances in sequencing was conducted on a subset of specimens to be environmental DNA (eDNA), remote sensing, and submitted to GenBank. Both metrics varied across years 282 Wetland Science & Practice OCTOBER 2026
and sites: Site A, located over open water, consistently yielded greater abundance and biomass than Site C, on the riverbank. Following drought periods, Site A also showed only a small decline in abundance and biomass, compared to a larger decline at Site C, suggesting that emergent insect populations are less vulnerable to drought than terrestrial ones. However, precipitation alone did not clearly explain differences in abundance or biomass across the three years, indicating that other factors, such as temperature, should be considered to fully understand how climate change is reshaping arthropod communities.
I graduated with my Bachelor of Science in Biology in December 2021 from the University of South Florida. I subsequently worked for two years in a private lake and wetland management company and for one year at the Florida Department of Agriculture, Division of Plant Industry. I returned to school to pursue my Master of Science in Environmental Science and Policy in January 2025 and am a research assistant with the University of South Florida Ecohydrology Research Group.
Dhrubo Barua (Poster 7) University of South Florida I am currently an undergraduate student at Northern Michigan University majoring in Fisheries and Wildlife Setting Baseline Conditions for Land Cover Change Analyses Through Digitization of Symbology on Historical Mid-20th Century Management with a minor in GIS. This summer I have USGS Topographic Maps been work as a student researcher at the University of Michigan-Dearborn in their National Science Foundation Research Experience for Undergraduates program on urban watershed science. I am passionate about freshwater ecology and conservation!
Bethany Odonnell (Poster 6) University of South Florida Reconstructing Historical Wetlands: Replacing Heads Up Digitization With Geospatial Datasets Wetlands play a critical role in protecting the integrity of downstream waters. Despite their importance, >50% of wetlands in the conterminous US have been lost since colonial times. Quantifying wetland loss requires spatially explicit maps of historical wetland distributions, but creating these through heads-up digitization is laborintensive and time-consuming. Automated mapping approaches are being developed, but they require advanced GIS and machine-learning expertise that may not be available to land managers.
Land use and land cover (LULC) is changing rapidly worldwide and with that change often comes a loss in ecosystem services and functions. Effective conservation and restoration strategies require knowledge of where LULC change has occurred, but digitized maps to establish baseline conditions are often lacking. Scanned historical USGS topographic maps are readily available and contain symbology reflective of mid-century LULC, but this symbology has not been digitized. We have developed a streamlined workflow based on automated extraction of wetland symbology from a historical set (mid-20th century) of USGS topographic maps of the Indian River Lagoon Watershed, Florida, a region which has experienced wetland loss and deteriorating water quality. Our procedure is based on U-net CNN architecture and is conducted within ArcGIS Pro environment. We created training and testing datasets by heads-up digitization of wetland symbology on historical USGS topographic maps followed by export as binary image–mask pairs. We trained the U-net classifier (RasNet-34 backbone) with a max epoch size 30 and a batch size of 8 and split the data into 90:10 for training and testing. The model achieved an overall accuracy of 0.88 and F1 score of 0.83. Our general workflow is transferable to wherever USGS topographic maps are available. The baseline maps resulting from this study will be incorporated into a wetland loss base layer included in a geospatial tool for enhancement of water quality in the Indian River Lagoon.
We aim to develop a practical method for mapping historical wetlands and lakes using readily available geospatial datasets. Using heads-up digitization, we created a reference dataset of historical wetlands and lakes in St. Lucie Co, Florida. Individual datasets moderately agreed with the reference dataset. To improve accuracy, datasets were combined using the ArcGIS Pro ForestBased and Boosted Classification and Regression tool. Results show integrating multiple datasets improves predictions of historical wetlands and lakes than any PhD Student & Research Assistant at Ecohydrology individual dataset alone. Research Group, University of South Florida
Wetland Science & Practice OCTOBER 2026 283
Clement Issaka Anaba (Poster 8) University of Energy and Natural Resources (UENR), Sunyani, Ghana Causal Drivers, Future Projections, and Co-Management Pathways of Urban Wetland Loss in Ghana’s Secondary Cities: A Three-Decade Analysis Urban wetlands in Ghanaian secondary cities are being lost at alarming rates, threatening ecosystem services and climate resilience. This study provides a comprehensive three-decade (1994-2024) assessment of wetland degradation in the Sunyani and Dormaa Central municipalities, integrating Landsat imagery, ERA5 climate data, and advanced causal inference Convergent Cross Mapping (CCM) and Geographical CCM (GCCM). Results reveal severe wetland losses of 41.5% in Sunyani and 62.7% in Dormaa, while builtup areas expanded by 154% and 171%, respectively. Causal analysis established unidirectional links from urban expansion, agricultural encroachment, and rising land surface temperatures (+3.1°C) to wetland loss, with precipitation and forest cover as sustaining factors. Field validation confirmed direct conversion, pollution, and hydrological disruption. Under business-as-usual, wetlands could decline to <2% of land area by 2054, exacerbating flood risk and urban heat island effects by up to 3.0°C. Community surveys (n=341) revealed high wetland awareness (68.91%) and strong support (70%) for involving traditional authorities in co-management. Policy analysis identified critical governance gaps: Sunyani has no published by-laws; Dormaa lacks wetland-specific provisions. Only 4.40% are aware of wetland laws. We argue that governance failures, not lack of scientific evidence, constitute the primary barrier to conservation. The CCM/GCCM framework offers a replicable approach for diagnosing environmental change beyond correlation. Recommendations include enforceable wetland zoning, integration of traditional authorities in co-management, and targeted restoration. This research provides actionable evidence for achieving SDGs such as goals 3, 6, 11, 13, and 15.
of professional experience as Environment Officer at Ghana’s Environmental Protection Authority, where he leads environmental impact assessment, compliance enforcement, and climate policy implementation. His research integrates remote sensing, convergent cross mapping, and community-based methods to examine wetland loss drivers, future climate risks, and comanagement pathways in Ghanaian secondary cities. Some of his works have been published in Wetlands and Urban Ecosystems (Springer Nature). He is also a PhD student in 3S Integration and Meteorological Applications at Nanjing University of Information Science and Technology, China, under a Chinese Government Scholarship.
Eliza Tseleng (Poster 9) Historical Ecosystem Changes and Economic Valuation of Hydrological Ecosystem Changes in the Dinizulu Montane Palustrine Wetland, Senqunyane Subcatchment Lesotho
Wetlands remain undervalued in Sub-Saharan African water governance because their benefits are rarely expressed in measurable economic terms, leaving natural infrastructure structurally disadvantaged relative to engineered solutions. This study focused on the Dinizulu Wetland in Lesotho’s Senqunyane Sub-Catchment, upstream of Mohale Dam. It assessed historical changes in wetland extent, vegetation cover, and erosion risk (1995–2025), quantified three regulating ecosystem services (water purification, sediment retention, flow regulation), and estimated their economic value using the Avoided Cost Method. Multi-decadal Landsat imagery (TM/ETM+/OLI) and GIS-based RUSLE traced spatial-temporal dynamics over the 30-year period. Water purification parameters (nitrates, phosphates, turbidity) were assessed through paired inlet–outlet sampling (before and after peak flow), analysed in situ and in the laboratory using a turbidimeter and spectrophotometer, with two-way ANOVA applied for statistical analysis. Secondary data from the Lesotho Highlands Development Authority (LHDA) supported Clement Issaka Anaba is a PhD Candidate in Sustainable the avoided-cost valuation. Results showed wetland Land Management at the University of Energy and extent increased by +6.06 percentage points (pp), Natural Resources, Ghana, investigating urban wetland degraded vegetation cover decreased by −3.03 pp, while degradation and climate resilience using geospatial erosion risk expanded by +8.14 pp over the 30 years, analysis and causal inference. He holds an MPhil in changes attributed mainly to ENSO-driven rainfall and a Climate Change from UENR and brings over 12 years 2020/2021 rehabilitation rather than genuine ecological 284 Wetland Science & Practice OCTOBER 2026
recovery. Regulating services nonetheless remained strong: turbidity removal 88.9–93.9%, phosphate 69.9– 81.5%, nitrate 51.3–62.5%, sediment retention 5.64 t/ yr (90.65% of catchment retention), and an event-based discharge ratio of 0.64 m³/s. Combined annual value was approximately LSL2,931,581.56 (~USD180,516.11), disproportionately large given the wetland’s 10.2% share of the upstream complex. Findings support outlet stabilisation, controlled grazing, and integrating this valuation into ReNOKA and LHDA planning, offering a transferable model for embedding wetland natural infrastructure into water governance across similarly data-scarce Southern and Eastern African catchments.
seining method, extracted PFAS using a blood methanol crash, and ran our analysis using liquid chromatography tandem mass spectrometry (LC-MS/MS). Of the 21 PFAS investigated in this analysis, we identified 6 PFAS above the limit of quantitation in all samples analyzed (PFOS, PFUnDA, PFOA, PFDA, PFHxS, PFNA). These concentrations will be compared to environmental and morphometric data to assess potential developmental associations and bioaccumulation factors.
Dorothy is a Master’s student at Clemson University researching contaminants of emerging concern in coastal wetland habitats and wildlife. She is especially interested in wetland habitat restoration, ecotoxicology, Eliza is a motivated natural resources management and herpetofauna. professional with a Bachelor’s degree in Geography and postgraduate, MSc Integrated Catchment and Mandy Edinam Dzomeku Water Resources Management. Obtained experience in Kwame Nkrumah University of Science and Technology hands-on field supervision experience in soil and water Water Balance Responses to LULC Changes in Ghana’s Keta conservation. Skilled in supervising erosion-control Lagoon Ramsar Site works, engaging rural communities and livestock herders 10:15-10:30 on wetland and catchment conservation, applying GIS Dzomeku M.E.1, Awotwi A.2, Egbi C.D.1,3, Nyatuame M.4, and remote sensing to natural resources problems, and Anornu G.K. 1 reporting on field activities. Committed to supporting Contact: mandydzomeku@gmail.com sustainable watershed management and improved rural The Keta Wetland Complex, a West African livelihoods in Lesotho. transboundary coastal Ramsar site, faces escalating threats from land use changes, notably salt extraction. Student Oral Presentations To quantify hydrological impacts, SWAT was integrated with MLR across 269 sub-basins (2015–2023). Saltpans Dorothy Aldridge, Clemson University and settlements expanded by 131% and 71%, while dense vegetation declined by 61%. Evapotranspiration Per- and polyfluoroalkyl substances (PFAS) in Diamondback (ET) was the sole water balance component significantly terrapin blood (Malaclemys terrapin). linked to LULC, positively with water bodies (r=+0.50) 10:00-10:15 Contaminants of emerging concern that resist and negatively with saltpans (r=−0.51). Sub-basins degradation, such as per- and polyfluoroalkyl substances with >5% anthropogenic gain showed near-complete (PFAS), persist and accumulate in wetland environments LULC control of ET (R²=0.93) versus vegetation and wildlife. Diamondback terrapins (Malaclemys gain areas (R²=0.23). This study provides the first terrapin) are a species of turtle endemic to salt marshes, quantitative evidence that salt extraction suppresses coastal areas, and tidal creeks along the Atlantic and Gulf ET. We recommend integrating this effect into Ramsar Coasts. The objective of this study was to compare PFAS management and water allocation frameworks to support concentrations in M. terrapin plasma to morphometric SDG 6.6.1 data and environmental contamination. We collected blood from M. terrapin (n=20) captured using a serial 1 2 3 4
KNUST, Ghana Nottingham Trent Univ, UK GAEC, Ghana UDS, Ghana Wetland Science & Practice OCTOBER 2026 285
Keywords: Evapotranspiration, Saltpan, Coastal wetland, SWAT, Transboundary Ramsar Site
goethite substantially reduced CO2 emissions while increasing MAOC by 57% and 347% at the low and high application rates, respectively, suggesting greater potential for long-term C stabilization in organic-rich soils. This research informs land management strategies aimed at improving C stability and resilience in drained wetland systems. Additional field-based research is required to validate these findings and ensure their applicability across broader environmental conditions.
Mandy Edinam Dzomeku is a PhD candidate at the Regional Water and Environmental Sanitation Centre Kumasi (RWESCK), Department of Civil Engineering, Kwame Nkrumah University of Science and Technology, Ghana. Her research focuses on hydrological responses to land use and land cover changes in coastal wetland systems. She currently investigates water balance dynamics in the Keta Lagoon Complex using integrated Mumtahina Riza is a Trustees Doctoral Fellow and a PhD Candidate in Integrative and Conservation Biology hydrological modeling approaches. at the University of Central Florida. She earned her MS in Biology from North Carolina State University. Her Mumtahina Riza, University of Central Florida research focuses on soil carbon stabilization, particularly Effects of Soil Amendment Applications on Mineral-Associated mineral-associated organic matter (MAOM) formation Organic Carbon Formation in a Drained Wetland in organic-rich soils of Florida’s Everglades Agricultural 10:30-10:45 Area. She is a member of SWS (including Student A drained wetland, Everglades Agricultural Area (EAA), Section and South Atlantic Chapter). Riza also serves Florida, USA, undergoes substantial organic matter as a Grad Student Representative on the Board of the loss due to drainage-induced mineralization. Enhancing SSSA. mineral-associated organic carbon (MAOC) formation may improve long-term carbon (C) stabilization in these degraded organic-rich soils. This study evaluated Daniela Guadalupe López Villalpando the potential of four soil amendments, goethite, NPK A Lake’s Memory: Reconstructing Millennia of Vegetation Change fertilizer, lime, and biochar, to promote MAOC in Oaxaca, Mexico. formation and influence microbial mineralization and 10:45-11:00 carbon use efficiency (CUE). A 3-month laboratory Lake Lávalo in Oaxaca, a paleomeander of the Río microcosm incubation was conducted using EAA Verde periodically flooded by the river, provides an Histosols (organic-rich soils) maintained at a 1:1 field- exceptional archive for reconstructing Late Holocene moist soil-to-water ratio. Amendments were applied environmental change in Oaxaca Coast, Mexico. A at two rates, and sugarcane litter was incorporated sediment core spanning ~688 calibrated years BP, as a standardized C substrate. Regular gas C flux was analyzed through multi-elemental geochemistry, measurement was conducted using gas chromatography, palynology, and sedimentary charcoal. Charcoal results and post-incubation determinations of MAOC and indicate predominantly regional fire activity throughout CUE were completed. After 3 months, NPK produced the record. Organic and inorganic geochemical proxies the highest MAOC concentration (6.8 ± 1.6 g C kg-1 reveal that vegetation in the lower, older section of the soil), significantly exceeding all other amendments (p < core experienced significant stress, with pollen indicators 0.05). In contrast, lime (3.1 ± 0.07), goethite (0.8 ± 0.2), suggesting anthropogenic disturbance. Toward the upper, and biochar (0.6 ± 0.09) g C kg-1 soil showed limited more recent section, vegetation shows a progressive increases relative to the control (0.3 ± 0.03 g C kg-1 soil). recovery, transitioning into a more mature tropical Soil CO2 flux (µg CO2-C g1 soil day-1) was highest under dry forest. Notably, the record captures a hydroserial NPK (4254.9 ± 482.2) and lowest under goethite (110.9 succession within the Arecaceae family, offering a rare ± 14.5). In addition, MAOC was negatively correlated paleoecological perspective on palm dynamics in this with CO2 flux under goethite (r = −0.67, p < 0.05) but region. These findings contribute to understanding positively correlated under NPK and biochar. Although human-environment interactions in pre-Hispanic and NPK resulted in the greatest MAOC accumulation, it was colonial Oaxaca. accompanied by the highest CO2 emissions. In contrast, 286 Wetland Science & Practice OCTOBER 2026
Daniela López Villalpando is a graduate with a degree in Biology from the Autonomous University of Querétaro (UAQ), with a focus on the conservation of freshwater ecosystems. She completed a Diploma in Ecological Restoration with a Socio-environmental Approach (UAQ) and is currently a research assistant at the Institute of Geosciences, UNAM, where she contributes to the project Reconstruction of Late Holocene Vegetation on the Coast of Oaxaca — bridging historical ecology with present-day environmental challenges. She is also an active member of the Cascadas Collective, a transdisciplinary youth initiative working on communitybased water management and advocacy
Chelsea Braz, University of South Florida Cumulative Effects on Wetland Area, Function, and Services, St. Lucie County, FL 11:00-11:15
Advances in remote sensing and GIS have facilitated numerous studies on the cumulative loss of wetland area throughout the US, including Florida. Less common are studies of how the cumulative loss of wetland area has simultaneously led to cumulative effects on functions, like surface-water storage, and services, like flood control. Previously, we quantified the cumulative loss of wetland area in St. Lucie County, Florida, between the 1850s-1950s-2000s-2020s. In this study, we further estimated the corresponding cumulative effects on functions and services. We estimated functions using the Landscape Development Intensity index, a geospatially and computationally efficient metric shown to be correlated with the Uniform Mitigation Assessment Method. We further estimated services with a method we are developing with funding from the US Environmental Protection Agency and in cooperation with numerous states, including Florida. Results indicate cumulative losses of wetland area and functions but modest increases in wetland services as population increased and more people became available to benefit from the services the remaining wetlands provide.
and frequency, which have contributed to impaired waterbodies and harmful algal blooms. Addressing these complex issues requires interdisciplinary thinking and innovative solutions. I aim to contribute to this effort by developing data-driven strategies to mitigate water impairments.
Fatima Tanveer, Australian National University Wetland conservation policy in Australia’s Murray–Darling Basin: Gaps, misalignments, and pathways forward under climate change 11:15-11:30
Conservation policy frameworks often fail to capture the full complexity of threats to wetlands. Australia’s Murray–Darling Basin (MDB) wetlands face mounting pressures from water over-allocation amid accelerating climate change, testing the Basin Plan’s $13 billion investment in environmental water recovery. The Murray–Darling Basin Plan (the Plan), designed to recover water for the environment, provides a suitable case study for understanding how policy design influences conservation outcomes. I recently published a policy analysis of wetland conservation policies across the Commonwealth and three states within the MDB. I analysed 43 conservation policies using six indicators covering planning comprehensiveness, cross-scale alignment, climate adaptation, stakeholder participation, administration and funding, and monitoring and evaluation. I mapped policy hierarchies across jurisdictional scales and identified two prevailing delivery pathways: strategic frameworks (biodiversity plans) and ecohydrological measures (environmental watering). There were disconnects in cross-scale alignment of goals and objectives from international to regional levels, and weak linkages between the two delivery pathways. Wetlands are often treated as terrestrial subsets, with no explicit conservation targets. Climate adaptation remains limited, with only 42% of mechanisms setting adaptation targets, despite CSIRO projections of a 50year drying trend. Indigenous participation remained largely tokenistic, with consultation rarely progressing to co-governance. With the strongest alignment between international commitments and regional targets, one state could lead the necessary reform.
I am a graduate student researcher at the University of South Florida. My research interests lie in the intricacies of water law and in using geospatial analysis to address water infrastructure and water quality challenges. Like many regions in the United States, Florida faces Reform priorities include landscape-scale measures, aging infrastructure and increasing flood intensity governance coherence, streamlined laws and balancing
Wetland Science & Practice OCTOBER 2026 287
irrigation against environmental needs. Amid worldwide Aquatic Biogeochemistry Laboratory at the University allocation–climate tensions, this policy evaluation offers of Central Florida. lessons for conservation policy design applicable well beyond the MDB. Maya Taib, Australian National University I am an environmental researcher and PhD candidate with over 10 years of experience in environmental assessment, project coordination, and policy analysis across university, consultancy, and not-for-profit settings. My research focuses on wetland conservation policy, environmental governance, and the ways crossscale policy design shapes outcomes for wetlands under increasing climate and water allocation pressures. I have also worked extensively on multidisciplinary environmental projects, stakeholder engagement, and environmental reporting, which has strengthened my interest in practical, policy-relevant conservation solutions. My current work examines the Murray– Darling Basin Plan as a case study to understand how conservation policy frameworks can be improved to better support wetland protection and climate adaptation.
Sophia Canabal, University of Central Florida Evaluating Permanganate Oxidizable Carbon as a Proxy for Nitrogen Loading in Coastal Wetlands 11:30-11:45
Permanganate oxidizable carbon (POXC) is a convenient soil productivity metric that was previously thought to represent labile carbon, but its true function in soils has not been identified. Recent studies revealed that bioactive compounds of varying lability involved in reactive nitrogen cycling are also highly POXC-reactive, highlighting its potential as an indicator for nitrogen loading.Its role in soils containing high levels of organic matter, particularly wetland soils, is also unknown. This study aims to characterize POXC concentration to anthropogenic nitrogen loading over time in upland and wetland soils. Upland and wetland soils sampled from the northern sector of the Guana-Tolomato Matanzas Research Reserve received either no enrichment or a solution of 5 ppm ammonium nitrate enrichment. POXC was measured after sampling, then after two and four weeks of incubation. Establishing POXC as an indicator of nitrogen loading will make it easier to detect anthropogenic nutrient pollution in coastal wetlands. I am a fourth year biology major and am currently an undergraduate research assistant at the Chambers 288 Wetland Science & Practice OCTOBER 2026
Transforming wetland monitoring with SWOT satellite data 11:45-12:00
Wetlands are critical ecosystems that are extremely vulnerable to changing water flows. Monitoring the extent, depth and frequency of water within wetlands is therefore important for preserving their biodiversity and ecological functioning. However, current hydrological monitoring relies on sparse, in situ water level gauges or satellite data limited by cloud cover and instrumental capabilities. The Surface Water and Ocean Topography (SWOT) satellite mission provides unprecedented, high accuracy water height measurements across wetlands every ~11-21 days using Ka-band radar interferometry. We show that this new information can transform the monitoring of Ramsar-listed wetlands. However, the ability of SWOT to detect water may be affected by vegetation, potentially impacting its use in wetland environments. We investigated this effect by analysing SWOT data over large, vegetated farm dams in Australia. By comparing simulated water extents, independent Sentinel 2 satellite data and SWOT water extents, we found that in some cases, increased vegetation height above the water caused losses in the coherent radar power received from the water surface, which resulted in missed SWOT water detections. Our study provides a valuable test case for elucidating the constraints on SWOT water detection in vegetated environments. This is crucial for understanding the full capabilities of the SWOT satellite for aiding with the monitoring of diverse wetlands globally. Maya is a final-year undergraduate student at the Australian National University. She is researching satellite remote sensing methods for monitoring wetlands at the Research School of Earth Sciences. She was a lead author on a paper recently published in Communications Earth and Environment, presenting the first analysis of SWOT satellite data for monitoring water in Australian Ramsar-listed wetlands. She is passionate about applying spatial analysis to help with the management of vulnerable wetlands globally.
IN MEMORIAM: RICHARD CHINN (1959-2025)
PROFESSIONAL WETLAND SCIENTIST AND TRAINER, AND SWS CHAPTER CHAIR The Society of Wetland Scientists (SWS) recognizes the rich life and scientific contributions of Richard Chinn to the Society and to wetland science in general. Richard passed unexpectedly and suddenly in September 2025, during which time he was acting as Chair of the South Atlantic Chapter (SAC). We extend deep sympathy to Richard’s family, friends, and colleagues for his loss. Richard made a lasting impact on wetland science and SWS as one of the early non-agency providers of wetland delineation training courses that reached thousands of participants over a period of 30 years. As a strong supporter of SWS Annual Meetings, he frequently donated a registration for his 40-hour Wetland Delineation course to the Silent Auction fundraiser, with the winning bidder getting a substantial discount and the proceeds going to support the SWS. Richard also brought a lot of energy to the SAC and sought to raise participation and membership within the chapter, encouraging people from underrepresented universities and diverse backgrounds to join. While he was a champion for all, often quite animated and vocal in most interactions, the depth of his support extended to the good deeds he did silently. To boost membership in 2024, his company supported a membership boost raffle to which they gifted multiple Yeti coolers randomly to members of the SAC, encouraging new members with a chance to win as well. As Chair of the SAC, Richard continued to support the student research grants as we had historically, and specifically created an award for a student enrolled in a historically black college and university whose proposed science met the established peer-review standards. In all his actions as SAC Chair, he applied rigorous standards and often contributed the lion’s share of effort to new initiatives. That was indeed the case with the nomination of the SAC to help host the 2027 SWS Annual Meeting in Savannah, Georgia—the effort associated with that proposal was undertaken entirely by Richard, and apparently well received.
Richard Chinn at an on-site training session. (Photo: Richard Chinn Environmental Training, Richardchinn.com)
Richard’s legacy lives on. The Richard Chinn family has offered to continue to host virtual courses containing the same lectures as if Richard was present in person, including some of his anecdotes as well as field exercise demonstrations. You can find the virtual course registration information here: https:// www.richardchinn.com/store/Virtual-WetlandTraining-c137133515 Submitted by Jamie Duberstein and Diane De Steven.
Wetland Science & Practice OCTOBER 2026 289
NEWS ARTICLES
The Beast in the Mosquito: Malaria and the Pontine Marshes Arnold van der Valk, Professor Emeritus1
Abstract Malaria has been associated with wetlands for thousands of years. As a result, people living near wetlands feared them. Malaria became established in the Pontine Marshes in Italy during Roman times. This led to these wetlands being largely abandoned by people for the next two thousand years. Multiple efforts to drain the Pontine Marshes from Roman times to the early twentieth century mostly failed due to inadequate drainage technology. Until the late nineteenth and early twentieth century, malaria was believed to be caused by a vapor emanating from wetlands, the so-called miasma. In 1880, Alphonse Laveran, a French Army physician, discovered that a protozoan parasite caused malaria. Subsequent studies by Ronald Ross, a British Army physician, in India, and by Giovanni Grassi and colleagues in Italy showed that this protozoan parasite was transmitted from person to person via bites from Anopheles mosquitoes. The discovery that malaria was a mosquito-borne disease refocused malaria control efforts on mosquito control. In the 1920s and 1930s, the fascist government of Italy implemented a massive public works project to drain the Pontine Marshes, eliminate malaria, and convert the area to agriculture. This project was successful, and the Italian government resettled people in the drained areas. In 1943, the Germans, who occupied Italy, reflooded the Pontine Marshes to hinder an Allied invasion. This reflood of the marshes triggered a malaria epidemic. Some historians consider this to be an act of biological warfare by the Germans.
INTRODUCTION Until the mid-twentieth century, wetlands in many parts of the world were perceived as unhealthy places that caused diseases in nearby human populations. Consequently, it was widely advocated that wetlands be drained or filled to control these diseases. According to Horwitz and Finlayson (2011), there is "a persistent negative view of wetland ecosystems … held by the 1.
public in general and the public-health profession in particular." Although malaria is not the only human disease associated with wetlands (Dale and Connelly 2012; Carver et al. 2015; Anthonj 2025), malaria has been and remains one of the most widespread and important. Although today malaria is a preventable and treatable disease, it remains one of the most devastating diseases in parts of the world. Quinine, derived from the bark of the Cinchona tree, has been used as an antimalarial drug since the seventeenth century, long before the disease’s cause was identified. Nevertheless, according to the World Malaria Report 2024 of the World Health Organization (WHO), in 2023, there were an estimated 263 million cases of malaria and over half a million malaria-related deaths. Most of these cases (94%) and deaths (95%) occurred in Africa. Children less than 5 years of age are most susceptible to malaria; in 2023, they accounted for 76% of all malaria deaths in Africa. Although today malaria is primarily a significant health problem in Africa, it was reported to be endemic in 83 countries in 2023, down from 93 countries in 2015. For a detailed account of malaria around the world, see Packard’s (2007) The Making of a Tropical Disease: A Short History of Malaria. Until recently, the United States had been free of endemic malaria for at least two decades. However, according to the US Centers for Disease Control and Prevention (CDC), between May and December 2023, ten people in southern states contracted malaria from local mosquitoes. According to a 2025 CDC online report on the recent increase in cases of malaria contracted in the US, the recurrence of endemic malaria was due to multiple interacting factors: (1) record-warm temperatures; (2) wetter conditions resulting in more flooding, (3) an increase in international travel, which resulted in more people with malaria coming to the US, and (4) a reduction in mosquito control programs. A significant complicating factor was the inability of local doctors to diagnose malaria.
Department of Ecology, Evolution, and Organismic Biology, Iowa State University, Ames, IA 50011. Corresponding author email address: valk@iastate.edu
290 Wetland Science & Practice OCTOBER 2026
The periodic fever suffered by people living near wetlands was initially called swamp or marsh fever in English. It eventually came to be called malaria, most likely from the Italian mal aria (bad air). This malady has been known to physicians since ancient Greek (Baron and Hamlin 2015) and Roman (Sallares 2002) times. Ancient physicians recognized that this malady was often associated with wetlands, as its English common names suggest. To explain this association, the ancient Greeks theorized that a poisonous vapor or miasma arising from wetlands caused malaria (Poser and Bruyn 1999). The idea that miasmatic exhalations from wetlands caused malaria was not discredited until the early twentieth century, as described below. The discovery that malaria was a parasitic disease rather than an inherent property of wetlands eventually helped reduce the worldwide fear of wetlands. The primary reason malaria became an important research issue in France and Britain in the late nineteenth century was their colonies in tropical areas, where malaria was the most serious and debilitating of parasitic diseases faced by colonial administrators and military forces. These diseases limited colonial exploitation of natural resources and thus profits. Malaria research also flourished in Italy, but for a different reason. For French and British researchers, malaria was mainly a "tropical disease." For Italians, it was a domestic disease that hindered the development of parts of their country. Even Rome, the capital, was plagued by malaria during the summer and autumn. To illustrate the impacts of malaria on human health and efforts to reduce it, I will discuss the history of the Pontine Marshes (near Rome, Italy) before and after the discovery that malaria is a parasitic disease transmitted by mosquitoes. The 2,500-year history of attempts to drain the Pontine Marshes (Linoli 2005), mostly for malaria control, makes them an exceptional case study. Because it is such an important milestone in the history of wetland science, I will also briefly outline the principal discoveries that proved that malaria is a parasitic disease.
THE PONTINE MARSHES – BEFORE 1900 The Pontine Marshes lie on a large, low coastal plain about 50 kilometers (km) (30 miles [mi]) south of
Rome, Italy (Figure 1). Its roughly rectangular area ranges from 15 to 25 km (9.5 to 15.5 mi) in width and covers about 80,000 hectares (200,000 acres). It is bounded by a series of marine terraces and sand dunes along the Mediterranean coast and on the other side by the Volscian Mountains. There is a low depression on this coastal plain, a graben. Due to a combination of sea level rise, geomorphology, and sediment subsidence, the Pontine Marshes are mostly below sea level. This made them difficult to drain.
Figure 1. The Agro Pontino. The dashed line is the southwestern boundary and the base of the Volscian Mountains (Monti Lepini and Monti Ausoni) the southeastern boundary of the Pontine Marshes. (Adapted from Sevink et al. 2023)
The Holocene history of the Pontine Marsh has been reconstructed by Sevink et al. (2023). Natural processes controlled the early hydrology of the Pontine Marshes until the onset of the Iron Age (around 950 BCE). Eventually, sediment from erosion in the Volscian Mountains on the eastern boundary of the coastal plain built up the Amaseno River deltaic fan as the river’s base level rose. This dammed the river system at its mouth and hampered the draining of the Pontine Marshes into the Mediterranean Sea. Sea level rise during the Holocene also increasingly hindered early efforts to drain the marshes. Ineffective attempts to reverse the increasing flooding of the coastal plain began before the Early Bronze Age with the digging of small canals and ditches. During the early Roman Republic, various drainage projects were initiated, but Wetland Science & Practice OCTOBER 2026 291
these triggered soil subsidence in the marshes. The combination of sea level rise and soil subsidence made it increasingly difficult to drain the Pontine Marshes, as did the wetter climate after 50 BCE. The early Romans and their predecessors, the Volsci, considered the Pontine Marshes a valuable natural resource to be exploited. Historical records and archaeological studies of the Pontine Marsh indicate that the area had permanent settlements and seasonal inhabitants who utilized it for grazing and, in higher areas, farming before the establishment of the Roman Republic, circa 500 BCE (Walsh et al. 2014; de Haas 2017; Tol and de Haas 2022). During the mid-Roman Republic, the late fourth and third centuries BCE, there were larger-scale settlements in the area and extensive land reclamation to create more arable land. However, by the second century BCE, many settlements had been abandoned. Still, the Pontine Marshes were exploited to some extent, especially along the newly constructed Via Appia, or Appian Way. The Appian Way was constructed in 312 BCE to connect Rome to the port of Brindisi, and from there it connected Rome by sea to Athens and the Near East. It runs along the eastern edge of the Pontine Marshes. Consequently, it was frequently flooded, and eventually a canal was constructed parallel to the road to prevent this. Malaria was probably introduced to the Pontine Marshes by travelers on the Appian Way (Frost 1934). In any case, malaria was well established in the marshes by the first century BCE. For the next two millennia, kings, princes, and popes attempted to eradicate malaria by draining the marshes (Linoli 2005). One example of a post-Roman drainage project is that of Pope Pius VI. He was pope from 1775 till his death in 1799. Within months of becoming pope, he began evaluating the feasibility of draining the Pontine Marshes by consulting with hydraulic engineers and other experts. He decided that such a project was both desirable and feasible. Landowners in the Pontine region were to pay for the project. However, Pius later changed his mind and decided the Papacy would pay for it. In the reclamation plan, the Pontine Marshes were divided into two zones, each to be drained by its own canal system. Minor canals and ditches were also planned to drain water into the larger canals. 292 Wetland Science & Practice OCTOBER 2026
Preliminary work on the reclamation began in 1777, and on the canals in 1778. As many as 3,500 workers toiled on the project at times. The French invaded Italy in 1798, and Pius VI died in 1799. This ended the Pontine Marsh reclamation before it was completed. Over 10 times the original estimated project cost had been spent on it when it was discontinued (Linoli 2005). The efforts of two popes, Sixtus V (1520–1590) and Pius VI (1717–1799), to drain the Pontine Marshes were commemorated in a series of postage stamps issued by the Vatican in 1962. The 40L stamp (Figure 2) honors Pope Pius VI. The 40L stamps feature an ancient map of the area. The inscription at the top of each stamp reads, POPULI OMNES CONTRA FEBRES PALUSTRES (All People Against Malaria). Inadequate drainage technologies hampered the efforts of the Romans and their successors to drain the Pontine Marshes. Consequently, the scourge of malaria remained, and humans largely abandoned the region till it was finally drained in the twentieth century.
Figure 2. Postage stamp issued by the Vatican in 1962 to celebrate Pope Pius VI's efforts to drain the Pontine Marshes. (Courtesy of the Smithsonian Institution)
FROM MIASMA TO MALARIA The discovery that malaria was caused by a protozoan parasite and how this parasite was transmitted from human to human was a significant event in medical history. As a result, there is an extensive literature on the subject. A detailed account of the malaria story is found in Poser and Bruyn (1999), An Illustrated History of Malaria. Other important sources are Manson-Bahr (1961), Packard (2007), Cox (2010), Tyagi (2020), and Verhave (2022). For a detailed description of the Plasmodium parasite’s life cycle, see Sato (2021). Because it had been of interest to physicians for thousands of years, a lot of information about malaria had accumulated in medical circles by the nineteenth century. Although malaria was mostly associated with wetlands, it was recognized that not all wetlands caused malaria, and malaria sometimes was acquired in areas without wetlands. Physicians also knew that there was more than one kind of malaria because malaria symptoms differed in severity and time between outbreaks of fever. It had also been observed that people in areas where malaria was rampant could develop a resistance to the disease. Most importantly, it was well known that malaria was not transmitted directly from one person to another. In other words, it was not a contagious or communicable disease, and encountering someone with malaria was not a human health hazard. The latter observation provided strong, if circumstantial, support for the miasma theory of malaria.
Charles Louis Alphonse Laveran (1845–1922) (Figure 3) was born in Paris and studied medicine in Strasbourg. From 1870 to 1896, he was a French army physician. While serving in Algeria on November 6, 1880, using a primitive microscope, he detected movement in a fresh blood sample from a malarial patient. He observed some waving, hairlike projections, or flagella, emerging from pigmented spherical bodies. Laveran concluded that he was observing a living parasite. He named this parasite Oscillaria malariae. (Unknown to Laveran, the genus name Oscillaria was already in use for a filamentous alga. Laveran’s protozoan parasite was later renamed Plasmodium in 1885.) Initially, Laveran’s discovery of the malaria parasite was met with skepticism. Eventually, his peers acknowledged it as one of the most important medical breakthroughs of the nineteenth century. Laveran left the French Army in 1896 and joined the Pasteur Institute, where he studied protozoa, the organisms responsible for malaria. He was awarded the Nobel Prize in Physiology and Medicine in 1907 for his pioneering work on protozoa.
The first major challenge to the miasma theory came from germ theory. By the 1880s, the research of Louis Pasteur and Robert Koch had definitively demonstrated that microorganisms (germs) were the cause of many common diseases. In 1879, Edwin Klebs and Corrado Tommasi-Crudeli claimed they had isolated a bacterium, Bacillus malariae, from the water of the Pontine Marshes (Cox 2010). They reported that when the bacteria were injected into rabbits, they caused malaria. Other scientists could not reproduce their results, and the germ theory of malaria was eventually abandoned. Although it proved incorrect, their germ theory was the first scientific alternative to the miasma theory. Figure 3. Charles Louis Alphonse Laveran (1845–1922). (Courtesy of the Institut Pasteur) Wetland Science & Practice OCTOBER 2026 293
Sir Patrick Manson (1845–1922) graduated in medicine from the University of Aberdeen in 1865. In 1866, he received three additional degrees (Master of Surgery, Doctor of Medicine, and Doctor of Law). He then worked in China for 23 years. In 1879, he discovered that mosquitoes transmitted the nematode parasite that causes human filariasis (elephantiasis). The filaria parasite has two hosts: humans and mosquitoes. Adult female worms live in the human lymphatic system, producing microfilariae that enter the bloodstream. These are ingested by mosquitoes when they bite infected humans. In the mosquitoes, the parasites develop into infective larvae that are transmitted to humans through mosquito bites. Because of his studies on filariasis transmission, Manson proposed in 1894 that malaria was also transmitted from human to human by mosquitoes. Although Manson himself did not work on malaria, his mosquito-malaria theory was investigated by his protégée Ronald Ross. Sir Ronald Ross (1857–1932) (Figure 4) was born in India. His father, Sir Campbell Ross, was a general in the British Indian Army. Ronald Ross was sent to England at the age of eight to be educated. As a youngster, Ross developed keen interests in music, literature, and mathematics. Although he wanted to be a writer, his father had him enrolled at St Bartholomew’s Hospital Medical College in London in 1874. In 1879, he passed the examinations of the Royal College of Surgeons. After completing his medical qualification, Ross spent four months at the Army Medical School and was then appointed a surgeon in the Indian Medical Service. He worked in the Indian Medical Service for 25 years. After resigning from the Indian Army, he joined the faculty of the Liverpool School of Tropical Medicine. In 1926, Ross became Director-in-Chief of the Ross Institute and Hospital for Tropical Diseases, established in his honor, and worked there until his death. Ross was the most controversial and contentious person who contributed to proving Manson’s mosquitomalaria theory. For more information about Ross and his conflicts with other pioneering malaria researchers, see Ross (1923), Chernin (1988), Bynum and Overy (1998), Guillemin (2002), Bacan (2011), and Tyagi (2020).
294 Wetland Science & Practice OCTOBER 2026
Figure 4. Sir Ronald Ross (1857–1932). (Courtesy of the Wellcome Collection)
In India, Ross became aware of the devastating effects of malaria on the Indian people. He estimated that malaria was responsible for 1,300,000 deaths annually. While on leave in London in 1894, Ross visited Patrick Manson, the leading expert on tropical diseases, and learned about Manson’s mosquito-malaria theory. When Ross returned to India in 1895, he was determined to test Manson’s theory. On August 20, 1897, after two years of frustrating efforts and numerous dissections of various mosquito species, Ross finally saw a pigmented malaria parasite growing in the stomach wall of a mosquito that had fed on a patient with malaria. Ross had confirmed that mosquitoes could acquire the malaria parasite from humans. After Ross made this discovery, he was transferred to locations where he could not conduct any experiments on human malaria. Instead, he began working on bird malaria in sparrows. By 1898, Ross had worked out the entire life cycle of the bird malaria parasite. Most importantly, he had demonstrated that the parasite was transmitted from bird to bird by mosquitoes. Ross concluded from his bird studies that human malaria
parasites were also transmitted from person to person by mosquitoes. Ross, however, had not demonstrated this. Giovanni Battista Grassi (1854–1925) (Figure 5) was an Italian physician and zoologist. After completing his university training in medicine and zoology, Grassi became the Professor of Comparative Zoology at the University of Catania in 1883. He then became the Professor of Comparative Anatomy at Sapienza University of Rome from 1895 until his death.
on the volunteer, and the volunteer developed clinical signs of malaria. A positive blood smear confirmed the volunteer’s malaria. (The volunteer was treated with quinine when the inoculation study was completed.) On November 28, 1898, the Italian scientists reported to the Accademia dei Lincei that they had observed the development of the malaria parasite in the gut wall of an Anopheles mosquito. More importantly, they reported that they had demonstrated, under strict experimental conditions, that Anopheles mosquito bites transmitted human malaria. Further experiments followed, and Grassi and his colleagues proved that Anopheles mosquitoes became infected with malaria after biting a diseased person. In short, they had definitively demonstrated how Anopheles mosquitoes transmitted human malaria. They also worked out the complete life cycle of the malaria parasite. To confirm their discovery, Bastianelli and Bignami sent infected Anopheles mosquitoes from Italy to London in July 1900. These mosquitoes had previously fed on a malaria patient at the Santo Spirito Hospital. Manson’s son, a healthy young student, allowed himself to be bitten by the imported mosquitoes, and fifteen days later, he developed malaria. The experiment was repeated with a laboratory assistant at the London School of Tropical Medicine, who developed malaria 14 days later. Both volunteers were cured with quinine.
Figure 5. Giovanni Battista Grassi (1854–1925). (Courtesy of the Wellcome Collection)
It was Italian scientists, led by Grassi, who identified the mosquito that transmitted human malaria and demonstrated human-to-human transmission of the parasite by mosquito bites. In 1898, Grassi, Amico Bignami (1862–1929), and Giuseppe Bastianelli (1862–1959) started transmission experiments using Anopheles mosquitoes. In the autumn, Grassi collected Anopheles mosquitoes in a highly malarious area and took them to the Santo Spirito Hospital in Rome. There, Bignami released them into the room of a hospital patient who had never had malaria. The mosquitoes fed
Ross and Grassi worked at a time when malaria was a major global health problem. It was endemic in parts of Europe and North America and throughout tropical and subtropical Africa, Asia, and South America. Their discovery of how the malaria parasite was transmitted from person to person by mosquitoes was one of the most significant medical advances of the nineteenth century. A nasty struggle to establish who should get credit for proving Manson’s mosquito-malaria hypothesis quickly developed between Ross and Grassi (Guillemin 2002; Capanna 2006). Ross won. In 1902, he was the only recipient of the Nobel Prize in Physiology and Medicine. In 1907, Laveran belatedly received the Nobel Prize for his discovery that a parasite was the causative agent of malaria. Grassi, who first identified Anopheles mosquitoes as the vector of human malaria transmission and worked out the entire life cycle of the Plasmodium parasite, never received Wetland Science & Practice OCTOBER 2026 295
a Nobel Prize. Chaudhury (2021) called Grassi the forgotten malariologist. The discovery that mosquitoes transmitted malaria initiated a new era of malaria control. This ranged from encouraging the use of window and door screens to prevent mosquitoes from entering homes to promoting the use of quinine and other antimalarial drugs to various means (hydrological, chemical) to eliminate or reduce mosquito populations. Ronald Ross promoted vector control by eliminating mosquito breeding habitats, and he believed that malaria could be eliminated quickly through this approach (Ross 1923). Grassi favored the use of antimalarial drugs. Although the cause of malaria was now understood to be a mosquito-borne parasite, it did not eliminate wetland drainage. Instead, draining wetlands was now promoted to eliminate mosquitoes. For more information on mosquito control in wetlands, see Konradsen et al. (2004), Keiser et al. (2005), Rey et al. (2012), Dale and Knight (2012), Smith et al. (2013), Benelli (2015), Webb (2022), and Haas-Stapleton and Rochlin (2022).
THE PONTINE MARSHES – AFTER 1900 The Pontine Marshes (Figure 6) were never drained by the Romans (Sallares 2002), by various popes (Koot 1991), or by the post-unification governments of Italy. The latter passed several laws aimed at reclaiming them from 1868 to the fascist takeover in 1922 (Ghirardo 1989).
The discovery that mosquitoes spread malaria led to efforts to reduce mosquito-borne malaria in the Pontine Marshes. These included promoting the use of window and door screens and treating sufferers with quinine. Nevertheless, by 1928, the population of the Pontine Marshes was still only around 1,600 people, who eked out a meager living through woodcutting, charcoal burning, fishing, shepherding, buffalo herding, and limited wheat production. These ventures were carried out by illiterate, nomadic people who lived in squalor and who were generally in poor health because most had malaria. Under Benito Mussolini’s fascist regime, starting in 1922, planning began on massive land reclamation projects (Schmidt 1937; Stewart-Steinberg 2016). For the Pontine Marshes, the Italian Department of Health developed a new initiative to combat malaria called the bonifica integrale (integrated remediation). It had three stages. The first was draining the marshes (bonifica idraulica). This stage was called "the battle of the swamps" in fascist propaganda. The second phase (bonifica agraria) was to resettle the drained areas by building houses and public utilities that would attract settlers. The third phase (bonifica igienica) involved mosquito control (e.g., window screening) and the establishment of improved public health services to treat individuals who contracted malaria. In 1929, after approval by the Italian parliament, reclamation of the Pontine Marshes began.
Figure 6. The Pontine Marshes in the 1860s. Photograph by Robert Macpherson. (Courtesy of the Collection Centre Canadien d'Architecture/Canadian Centre for Architecture, Montréal) 296 Wetland Science & Practice OCTOBER 2026
The bonifica idraulica constructed 16,500 km (10,300 mi) of canals, dredged the rivers and diked their banks, and constructed pumping stations. At its peak in 1933, 124,000 men worked on the project. About 2,000 settler families moved into the drained area. Each settler family got a farmhouse, an oven, a plow and other agricultural tools, a stable, some cows, and several hectares of land. A series of new towns was also established in the 1930s.
World War II In 1943, when Italy changed sides in World War II, Mussolini was ousted and arrested. However, he was rescued by the Germans and became the head of a puppet regime, the Republic of Salò, in northern Italy. The Germans remained in Italy and initially fought off Allied armies at the heavily defended "Gustaf Line," which ran across Italy south of the Pontine Marshes. When Allied forces landed near Anzio, west of the former Pontine Marshes (now the Agro Pontino), to outflank the Germans, they needed to cross the Agro Pontino to get to Rome. To hinder the Allied advance, the Germans decided to reflood the Pontine Marshes. Malaria had already been on the increase in the Agro Pontino because quinine was in short supply, in part because the Germans withheld it. See Snowden (2002, 2008) for a detailed account of the German reflooding of the Pontine Marshes and its consequences. To reflood the Pontine Marshes, the Germans stopped the pumps and opened the dikes. They then reversed the pumps to refill the marshes with brackish water. The Germans knew that refilling the marshes would cause a major malaria outbreak. They also knew it would destroy its agriculture, eliminating essential food and fresh water supplies. Military historians believe that the reflooding of the marshes had minimal military consequences, except for impeding the movement of heavy equipment. This flooding of the marshes is considered to be an act of biological warfare by some historians, most notably Frank Snowden, and it was opposed by Italians who were former colleagues of the Germans. As the marshes reflooded with brackish water, mosquitoes thrived, leading to a public health crisis as malaria spread. By refilling the Pontine Marshes, the Germans hoped not only to impede the Allied forces
but also to punish their traitorous former allies by unleashing a malaria epidemic. Brackish water entering the marshes caused severe environmental damage, making the soil unsuitable for crop production and destroying animal husbandry. It also killed the larvae of nearly all mosquito species. Most mosquitoes are unable to breed in brackish water, except for Anopheles labranchiae, the most important vector of malaria in Italy. The Germans knew this. Anopheles labranchiae accounted for only 20 percent of the mosquito population in 1940, but by the summer of 1944, it accounted for nearly 100 percent. To make matters worse, the Germans also confiscated all the quinine held by the Italian Department of Health. The German reflooding of the Pontine Marshes led to a significant upsurge in malaria. Between 1944 and 1946, the number of malaria cases rose nearly tenfold from those in 1939 and 1940. Whether the German decision to reflood the Pontine Marshes was an act of biological warfare, as claimed by Snowden (2002, 2006, 2008), is disputed. Geissler and Guillemin (2010) agree with Snowden (2002, 2008) that the 1943 reflooding of the Pontine Marshes caused a major malaria epidemic, but dispute Snowden’s claim that this was an act of biological warfare and bioterrorism, i.e., a violation of the 1925 Geneva Protocol prohibiting chemical and biological warfare. However, Geissler and Guillemin agree that the environmental destruction of the reclaimed Pontine Marshes was banned by the 1899 and 1907 Hague Conventions and other treaties to which the Germans were signatories. The major water-control structures and pumps used to drain the Pontine Marshes survived World War II, and after the war, the marshes were again drained. Today, wheat, fruit, and wine grapes are cultivated in the Agro Pontino region, and it is flourishing. By 2000, around 520,000 people lived in the area. However, without constant dredging of the drainage canals, the repair and updating of the pumps, the Pontine Marshes could eventually return. Ongoing rising sea levels will also make it more difficult to prevent their reflooding.
Wetland Science & Practice OCTOBER 2026 297
SUMMARY The association between wetlands and human diseases has been observed for millennia. One of the most widespread of these diseases is malaria. The earliest theory to account for this association was the miasma theory. For thousands of years, it was believed that the release of a malignant vapor from wetlands made people ill. The result was a widespread fear of wetlands. Only in the late nineteenth and early twentieth centuries was it discovered that miasmas did not cause malaria, but that a protozoan parasite transmitted by mosquitoes from human to human did. Medical doctors in France (Laveran), England (Manson and Ross), and Italy (Grassi and colleagues) collectively determined that Anopheles mosquito bites transmitted the Plasmodium parasite from an infected person to another person. This major medical breakthrough won Laveran and Ross Nobel Prizes. The discovery that malaria was a parasitic disease, however, did not stop wetland drainage, which was now promoted for mosquito control. As seen in the history of the Pontine Marshes in Italy, malaria, after it reached them in Roman times, caused people to abandon the marshes for over 2,000 years. Numerous projects to drain the marshes to eliminate malaria were unsuccessful. Often, the projects were counterproductive because they led to sediment consolidation and, in turn, the deepening of the marshes. It was not until the 1920s that Mussolini’s fascist government developed and implemented a largescale public works project, the bonifica integrale, that successfully drained the Pontine Marshes and largely eliminated malaria. The success of this project enabled the resettlement of the area and its development into an important farming area. After the Italians switched sides during World War II, the former German allies reflooded the Pontine Marshes to hinder the Allied invasion of Italy and to punish the Italians, whom they felt had betrayed them. The reflooding of the Pontine Marshes caused a major malaria epidemic. Some historians consider the German reflooding of the Pontine Marshes to be an act of biological warfare.
DECLARATION OF ORIGINALITY This is an original work that has not been previously published. Images, figures, and quotations included 298 Wetland Science & Practice OCTOBER 2026
in the article are either in the public domain or, when not, have been properly cited and permission has been granted for any that are not those of the author.
REFERENCES Anthonj, C. 2025. Wetlands: A blessing and a curse for human health. In the Routledge Handbook of Wetlands. Abington, VA: Routledge. doi. org/10.4324/9781003219644-25 Bacan, N. 2011. Ross and Malaria (1911). A Short History of Mathematical Population Dynamics. London: Springer-Verlag. doi.org/10.1007/978-085729-115-8 Baron, C. and C. Hamlin. 2015. Malaria and the Decline of Ancient Greece: Revisiting the Jones Hypothesis in an Era of Interdisciplinarity. Minerva 53:327–358. doi.org/10.1007/s11024-015-9280-7 Benelli, G. 2015. Research in mosquito control: current challenges for a brighter future. Parasitology Research 114:2801–2805. doi.org/10.1007/s00436-015-4586-9 Bynum, W. E. and C. Overy, eds. 1998. The Beast in the Mosquito: The Correspondence of Ronald Ross and Patrick Manson. Amsterdam: Rodopi. Capanna, E. 2006. Grassi versus Ross: who solved the riddle of malaria? International Microbiology 9:69-74. https://scielo.isciii.es/pdf/im/v9n1/10capanna.pdf Caprotti, F. 2006. Malaria and technological networks: medical geography in the Pontine Marshes, Italy, in the 1930s. Geographical Journal 172:145-155. jstor.org/ stable/i371606 Carver, S., D. P. Slaney, P. T. Leisnham, and P. Weinstein. 2015. Healthy wetlands, healthy people: Mosquito borne disease. In C. Max Finlayson, Pierre Horwitz, and Philip Weinstein (eds), Wetlands and Human Health. Dordrecht, The Netherlands: Springer. Chaudhury, Abhijit. 2021. The forgotten malariologist: Giovanni Battista Grassi (1854–1925). Tropical Parasitology 11:16-18 Chernin, E. 1988. Sir Ronald Ross, malaria, and the rewards of research. Medical History 32:119-141. doi. org/10.1017/S0025727300047967
Cox, F. E. G. 2010. History of the discovery of the malaria parasites and their vectors. Parasites & Vectors 3:5-14. doi.org/10.1186/1756-3305-3-5 Dale, P. E. R. and R. Connelly. 2012. Wetlands and human health: an overview. Wetlands Ecology and Management 20:165–171. doi.org/10.1007/s11273-0129264-4 2:65–171. Dale, P. and J. Knight. 2017. Mosquito control: Perspectives on current issues and challenges. Annals of Community Medicine and Practice 3:1023-2027. De Haas, T. 2017. Managing the marshes: An integrated study of the centuriated landscape of the Pontine plain. Journal of Archaeological Science: Reports. 15:470481. doi.org/10.1016/j.jasrep.2016.07.012 Finlayson, C. M., Pierre Horwitz, and Philip Weinstein, eds. 2015. Wetlands and Human Health. Dordrecht, The Netherlands: Springer. doi.org/10.1007/978-94-0179609-5 Frost, R. S. 1934. The Reclamation of the Pontine Marshes. Geographical Review 24:584-595. jstor.org/ stable/208848 Geissler, E. and J. Guillemin. 2010. German flooding of the Pontine Marshes in World War II: Biological warfare or total war tactic? Politics and the Life Sciences 29:2-23. doi.org/10.2990/29_1_2 Ghirardo, D. Y. 1989. Building New Communities. New Deal America and Fascist Italy. Princeton, NY: Princeton University Press. Guillemin, J. 2002. Choosing scientific patrimony: Sir Ronald Ross, Alphonse Laveran, and the mosquitovector hypothesis for Malaria. Journal of the History of Medicine and Allied Sciences. 57:385-409. doi. org/10.1093/jhmas/57.4.385
resource management. BioScience 61:678–688. doi. org/10.1525/bio.2011.61.9.6 Konradsen, F., W. van der Hoek, F. P. Amerasinghe, C. Mutero, and E. Boelee. 2004. Engineering and malaria control: learning from the past 100 years. Acta Tropica 89:99-108. doi.org/10.1016/j.actatropica.2003.09.013 Koot, C. W. 1991. Marching through marshes: an historical survey of the Agro Pontino. In A. Voorrips, S. H. Loving and H. Kamermans, ed., The Agro Pontino Survey Project: Methods and Preliminary Results. Instituut Voor Pre- en Protohistorische Archeologie, Amsterdam 9-20. https://openlibrary.org/books/ OL841362M/The_Agro_Pontino_survey_project Keiser, J., B. H. Singer, and J. Utzinger. 2005. Reducing the burden of malaria in different eco-epidemiological settings with environmental management: a systematic review. The Lancet Infectious Diseases 5:695-708. doi. org/10.1016/S1473-3099(05)70268-1 Linoli, A. 2005. Twenty-six centuries of reclamation & agricultural improvement on the Pontine Marshes. In Christof Ohleg, ed., Integrated Land and Water Resources Management in History, Schriften der Deutschen Wasserhistorischen Gesellschaft Sonderband 2. Manson-Bahr, P. 1961. The malaria story. Proceedings of the Royal Society of Medicine 54:91-100. doi. org/10.1177/003591576105400202 Packard, R. M. 2007. The Making of a Tropical Disease: A Short History of Malaria. Baltimore, MD: Johns Hopkins University Press. Poser, C. M. and G. W. Bruyn. 1999. An Illustrated History of Malaria. New York: Parthenon Publishing.
Haas-Stapleton, E. and I. Rochlin. 2022. Wetlands and mosquito control in the twenty-first century. Wetlands Ecology and Management 30:899–905. doi. org/10.1007/s11273-022-09860-w
Rey, J. R., W. E. Walton, R. J. Wolfe, C. R. Connelly, S. M. O’Connell, J. Berg, G. E. Sakolsky-Hoopes, G. E. and A. D. Laderman. 2012. North American Wetlands and Mosquito Control. International Journal of Environmental Research and Public Health. 9:45374605. doi.org/10.3390/ijerph9124537
Horwitz, P. and C. Max Finlayson. 2011. Wetlands as settings for human health: Incorporating ecosystem services and health impact assessment into water
Ross, Ronald. 1923. Memoirs, With a Full Account of the Great Malaria Problem and its Solution. London: John Murray. https:// Wetland Science & Practice OCTOBER 2026 299
archive.org/details/memoirswithfulla00rossuoft/ memoirswithfulla00rossuoft/ Sallares, R. 2002. Malaria and Rome: A History of Malaria in Ancient Italy. New York, NY: Oxford University Press. https://bookreadfree. com/211307/5233429 Sato, S. 2021. Plasmodium—a brief introduction to the parasites causing human malaria and their basic biology. Journal of Physiological Anthropology 40:113. doi.org/10.1186/s40101-020-00251-9 Schmidt, C. T. 1937. Land Reclamation in Fascist Italy. Political Science Quarterly 52:340-363. doi. org/10.2307/2143381 Sevink, J., T. C. de Haas, L. Alessandri, C. C. Bakels, and F. D. Mario. 2023. The Pontine Marshes: An integrated study of the origin, history, and future of a famous coastal wetland in Central Italy. The Holocene 33:1087-1106. doi.org/10.1177/09596836231176495 Smith, M. W., M. G. Macklin, and C. J. Thomas. 2013. Hydrological and geomorphological controls of malaria transmission. Earth-Science Reviews 116:109-127. doi. org/10.1016/j.earscirev.2012.11.004 Stewart-Steinberg, S. 2016. Grounds for reclamation: fascism and postfascism in the Pontine Marshes. differences: A Journal of Feminist Cultural Studies. 27:94–142. doi.org/10.1215/10407391-3522769 Snowden, F. M. 2002. From triumph to disaster: Fascism and malaria in the Pontine Marshes, 19281946. In John Dickie, John Foot, and Frank N. Snowden, eds., Disastro: Disasters in Italy Since 1860. New York, NY: Palgrave Macmillan. Snowden, F. M. 2006. The Conquest of Malaria: Italy, 1900–1962. New Haven: Yale University Press. jstor. org/stable/j.ctt1npf50 Snowden, F. M. 2008. Latina Province, 1944-1950. Journal of Contemporary History 43:509-526. doi. org/10.1177/0022009408091838 Tol, G. and T. de Haas. 2022. Ephemeral Economies? Investigating Roman Wetland Exploitation in the Pontine Marshes (Lazio, Central Italy). In D. Van 300 Wetland Science & Practice OCTOBER 2026
Limbergen, A. Hoffelinck, and D. Taelman, eds., Reframing the Roman Economy. Palgrave Studies in Ancient Economies. Palgrave Macmillan. doi. org/10.1007/978-3-031-06281-0_9 Tyagi, B. K. 2020. Dr. Ronald Ross Mosquito, Malaria, India, and the Nobel Prize. Jodhpur, India: Scientific Publishers. Verhave, J. P. 2022. Robert Koch, malaria pioneer. Malaria World Journal 13:1-24. doi.org/10.5281/ zenodo.8205289 Walsh, K., P. Attema, and T. de Haas. 2014. The Pontine Marshes (Central Italy): a case study in wetland historical ecology. Babesch 89:27-46. doi.org/10.2143/ BAB.89.0.3034668 Webb Jr., J. L. 2022. The long arc of mosquito control. In Marcus Hall and Dan Tamïr, eds., Mosquitopia: The Place of Pests in a Healthy World. New York, NY: Routledge.
Early Indications of Salt Marsh Migration in Northern New England from 2014 to 2019 Authors: Christopher R. Peter,1* Susan C. Adamowicz,2 Ralph Tiner,3 Taylor Leitch,4 Kathleen M. O’Brien,5 Nancy Pau,6 Rachel A. Stevens,7 and Bri Benvenuti8
Keywords: tidal marsh, sea level rise, Spartina, ecotone, marine transgression, marsh migration
change can be critical to predicting impacts/offsets to a variety of marsh to upland ecosystem services.
Abstract
Introduction
Salt marshes in New England are undergoing rapid ecological change in response to accelerating sea level rise and associated hydrological stressors. Marsh migration—the landward transgression of salt marsh plant communities into adjacent uplands—is a key mechanism by which marshes respond to increased tidal inundation and ‘push-pull’ stressors (e.g., sea level rise and storm surge, respectively), yet few studies in the region have documented vegetation change in these marsh-upland ecotones. Our study assessed plant community dynamics along marsh-upland gradients at four coastal sites in Maine and New Hampshire using permanent plots surveys in 2014 and 2019. Across all sites, we found marked declines in the marsh-upland ecotone for several metrics regarding tree and shrub cover and canopy condition, whereas in the marsh platform, Spartina alterniflora increased in a majority of plots where it had occurred in 2014 or newly colonized in 2019. Freshwater species increased in the herbaceous strata, while decreasing in the shrub and tree strata. Overall, migration indicators were stronger in Maine compared to New Hampshire, although sites in New Hampshire displayed similar directional shifts in vegetation changes. Differences between states may be influenced by extreme flooding events (i.e., tidal flooding exceeding the highest predicted astronomical tide), which were more frequent in Maine. As climate change continues to influence rising seas and storm surges, understanding the nature and rate of vegetation
Salt marshes in New England are dynamic coastal habitats characterized by distinctive plant communities that tolerate varying degrees of tidal inundation (Niering and Warren 1980; Tiner 2009, 2013). Accelerating sea level rise has the potential to change these plant communities in a given location as well as across the landscape. For example, sea level rise results in longer and more frequent submergence of high marsh vegetation and the incursion of salt water into freshwater wetlands and/or adjacent uplands. Under excessively saturated soil conditions, high marsh vegetation dies off and Spartina alterniflora often colonizes these areas, resulting in landward transgression of low marsh plants (Adamowicz et al. 2020; Burdick et al. 2020; Gonneea et al. 2019). Consequently, high marsh plants also can migrate to locations with more favorable soil salinity and saturation conditions further upslope. This landward advancement of plant communities due to increased flooding with saltwater is an example of marine transgression, often called "marsh migration." While this phenomenon is a natural response of salt marshes to sea level fluctuations, high marsh plants in New England have been observed to be unable to cope with modern sea level rise rates, potentially resulting in general losses of high marsh vegetation communities (Payne et al. 2019). Sea level rise effects also may be exacerbated by other natural processes, such as the 18.6-year lunar metonic cycle and stochastic storm surges. These hydrologic-influencing processes inhibit
1. 2. 3. 4. 5. 6. 7. 8.
Great Bay National Estuarine Research Reserve, New Hampshire Fish and Game, 89 Depot Road, Greenland, NH 03840, christopher.r.peter@wildlife.nh.gov; *corresponding author Rachel Carson National Wildlife Refuge, 188 Brown St., Kennebunk, ME 04043, susan_adamowicz@fws.gov U.S. Fish and Wildlife Service (retired), P.O. Box 612, Leverett, MA 01054, ralphtiner83@gmail.com University of Rhode Island, Graduate School of Oceanography, 215 S Ferry Road, Narragansett RI 02882, taylor.leitch@uri.edu U.S. Fish and Wildlife Service, Division of Natural Resources and Planning, Northeast Region. 188 Brown St., Kennebunk, ME 04043, kate_obrien@fws.gov U.S. Fish and Wildlife Service, Parker River National Wildlife Refuge, 6 Plum Island Turnpike, Newburyport, MA 01950, nancy_pau@fws.gov Great Bay National Estuarine Research Reserve, New Hampshire Fish and Game, 89 Depot Road, Greenland, NH 03840, rachel@birchtreecc.com (current address: Birch Tree Conservation Consulting, 99 Dame Road, Durham, NH 03824) Ducks Unlimited, Inc., Memphis, TN, 38120 USA, bbenvenuti@ducks.org Wetland Science & Practice OCTOBER 2026 301
coastal forest growth and can induce upland and forest habitats to transition into salt marsh (Sacatelli et al. 2023). The importance of marsh migration and potential marsh loss centers on the myriad of highly valuable ecosystem services they provide, including protection from waves and storm surge (Leonardi et al. 2018), removing pollutants such as excess nitrogen from groundwater (Tobias et al. 2001), and providing habitat for salt marsh fauna, including species that are threatened, endangered, or of economic importance (Bilkovic et al. 2021; Field et al. 2016). Despite the ecological and economic value of these services and the risk of loss or impairment from marsh migration, there is a lack of long-term studies and research on this topic in New England (McKown and Burdick 2024). The goal of this study was to document potential plant community shifts over a five-year period from 2014–2019 using permanent plots established at multiple locations in New Hampshire and Maine. Plant communities were assessed along tidal elevation gradients from low marsh into the marsh-upland ecotone. We wished to determine if marsh migration was occurring in a measurable manner over such a relatively brief time frame and, if so, to identify the most dramatic changes. Early insights into marsh migration across northern New England can help further understand drivers (e.g., sea level rise, storm surges), spatial patterns of transformation, and species and resources at risk within the changing landscape.
Methods Long-term monitoring sites were established at four locations in Maine and New Hampshire on state and federally protected lands (Figure 1; Supplemental 1) to document changes in vegetation over time using methods developed by Tiner and Veneman (2014). Sites in Maine are situated in two separate estuaries at the Rachel Carson National Wildlife Refuge: Stevens Brook in Wells ("Furbish Road") and Little River in Kennebunk ("Little River"). Tidal range at the Maine locations were approximately 3–4 meters (m). Tidal water salinities ranged from 20 to 25 parts per thousand (ppt) (Mikula et al. 2024). The two New Hampshire sites were located at the Great Bay National Estuarine 302 Wetland Science & Practice OCTOBER 2026
Research Reserve (NERR) in Greenland ("Discovery Center") and Great Bay National Wildlife Refuge in Newington ("Woodman Point"). Tidal water salinities ranged from 1 to 32 ppt, with the vast majority of readings (10th and 90th quantiles) falling between 19 and 31 ppt (NOAA NERRS). Tidal ranges at the New Hampshire locations were approximately 2–3 meters (Peter et al. 2022). Like all marshes in the northeast, these sites bear the remnants of prior alterations, including ditching and embankments from past agricultural practices (Adamowicz et al. 2020). The Woodman Point site also received mosquito control measures in the form of open marsh water management (Wolfe 1996). Permanent plots were established along survey transects, which ran along an elevation gradient perpendicular from each site’s main tidal source (e.g., channel, bay, or river), across the marsh and into the bordering woodlands. Plots were located along the transect to capture existing plant communities, resulting in a total of 7–9 plant communities per transect. Circular vegetation survey plots were located in each plant community (e.g., low marsh, high marsh, marsh border, and shrub/forest). Plant communities with multiple strata had multiple plots (i.e., one plot for each plant stratum or life form). Three differently sized circular plots were used to assess vegetation strata: the herbaceous layer was sampled at 1.5 m (5 foot [ft]) radius plots, and the shrub and tree canopy layers were sampled at 4.6 m (15 ft) radius plots (U.S. Army Corps of Engineers 2012). If, for example, a plot contained all three strata (herbaceous, shrub and tree), three separate sub-plots were measured to separately assess each strata. All plots were marked in the field with permanent stakes (at circle center) and GPS coordinates were recorded. All live vegetation was identified to species and percent cover through ocular cover estimation. Tree and shrub canopy condition (e.g., for rate of ghost forest formation) was assessed while standing at the plot center with the following categories: 1) extremely poor – very little live woody material (>90% dieback), 2) poor – major dieback (>50% to 90% dieback), 3) somewhat poor – significant dieback (>25-50% dieback), 4) fair – some sign of dieback (up to 25%
Figure 1. Locator map and transect layouts for each marsh site. Note that DC5.5 is not shown; it is contiguous with DC6. (Base imagery courtesy of Esri, Garmin, NOAA, NGDC, and other contributors) Wetland Science & Practice OCTOBER 2026 303
dieback), 5) good – no sign of dieback but some stress noted (e.g., chlorosis), and 6) excellent – no sign of dieback. Baseline estimates were made in 2014 with follow-up assessments in 2019. Tidal data was sourced from the nearest NOAA Center for Operational Oceanographic Products and Services (CO-OPS) to examine extreme flood events and longterm sea level rise trends. For analyzing extreme flood events, data was sourced from the nearest stations to the salt marshes in Maine (Wells Harbor #8419317) and New Hampshire (Fort Point # 8423898), which are more appropriate for understanding local tidal flooding. For analyzing sea level rise rates, data was sourced from the Portland (#8418150) and Boston (#8443970) stations, which are the closest NOAA National Water Level Observation Network stations that are designed to track long-term changes in sea levels. Data were downloaded in the high tide/low tide data format (i.e., four data points per day, two high tides and two low tides). To determine extreme flood events, the number of high tides exceeding the elevation of the highest predicted astronomical tide (HAT) expected to occur at a specific tide station over the time period of 40 years was calculated for each tide station. For New Hampshire sites, the HAT was 3.52 m (11.54 ft) to mean lower low water (MLLW). The HAT for Maine sites was 3.51 m (11.55 ft) to MLLW.
Statistical Analyses Because plots along each transect spanned 7–9 plant communities with few overlapping species across plots, marsh and adjacent forest ecotone community data were analyzed by "guilds" representing the two dominant species (i.e., Spartina alterniflora and S. patens), other halophytes, and species characteristic of brackish, freshwater ("fresh") and upland (i.e., non-tidal) habitats to look at broad changes over time. Guild groupings were based on regional resources with habitat descriptions (Burdick et al. 2020; Tiner 2009; Supplement 2). To visualize species and community change on a whole, stacked bar charts representing the percent change in cover between 2014 and 2019 were used for each plot at each site. Each stacked bar represents a single plot, whereas each portion of a stacked bar represents the 304 Wetland Science & Practice OCTOBER 2026
change of each species or aggregated guild data for that specific plot. Plots labeled with a "H" represent the herbaceous stratum; "S," the shrub stratum; and "T," the tree stratum. "Other halophytes" consist of characteristic halophytic salt marsh species except S. alterniflora and S. patens, so that these species were not doubly represented. Our statistical approach was designed to test our primary research hypothesis: vegetation (dominant species, community guilds) will change on the marsh and adjacent upland ecotone over time (2014–2019) due to increases in tidal flooding and/or subsurface water tables from sea level rise. Due to large differences in plant communities that may have unique responses to sea level rise depending upon elevation (e.g., low marsh, high marsh, upland forest), a paired plot approach was implemented to capture change within plots over time. As such, the paired design of the paired t-test and Wilcoxon signed-rank test (depending upon residual distributions) were run for several metrics across all four sites, as well as parsed out by state (two sites in Maine, two sites in New Hampshire). Dependent vegetation metrics analyzed using the paired design were analyzed within plant strata (herbaceous, shrub, tree) to maintain independence among replicates. For all paired tests, residuals were examined for homogenous, normally distributed error. The dependent metrics, including canopy condition, total live cover and tree and shrub cover, were normally distributed and analyzed using a paired t-test. In contrast, dependent metrics that included S. alterniflora, S. patens, halophytes, brackish, fresh, and upland percent cover were non-normally distributed despite common transformations (e.g., square root, log, inverse), and thus analyzed with a non-parametric Wilcoxon signedrank test.
Results Survey results from 2014 and 2019 revealed a complex pattern of species transitions. Qualitative changes are summarized in Table 1 and Supplemental 3. Shifts in dominant species were observed in some places in the marshes. The Furbish Road site showed the most significant vegetation changes overall, including the following: 1) all the trees in the Red Maple-White Pine Swamp plot died and that area is now a Dead Forest/
Study Location Observed Changes from 2014 Discovery Increase in Spartina alterniflora into high marsh; increase in Distichlis spicata in mid-marsh at expense of Spartina patens and Juncus Center gerardii; the appearance of Iva frutescens in mid-marsh; increase in Agrostis stolonifera and Distichlis and reduction of Solidago sempervirens and loss of Argentina anserina in upper marsh border; trees in bordering forested wetland community are dead (2014–their condition was poor); canopy condition of the uppermost forest was fair in 2014, yet trees exhibited growth due to increase in dbh values since then. Woodman Pannes appear to be forming in the mid marsh; slight decrease in Distichlis and significant increase in Agrostis and the appearance of Point Spartina patens in upper high marsh plot; significant increase in Typha latifolia and Agrostis, with reduction in Spartina pectinata in the brackish marsh border. Furbish Road Large increase in Juncus and loss of S. patens in one plot, Salicornia depressa is gone, much more Spartina patens, more Juncus, and new occurrence/co-dominance of Spartina alterniflora-short form; Slough Grass- Switchgrass (Former Red Maple Swamp) Community is now High Salt Meadow (more salt-tolerant plants); former Shrub/Emergent Marsh (with dead trees/stressed shrubs) is now Salt Meadow, the occurrence of Teucrium canadense and Juncus in this former freshwater community suggest more saline conditions, also of note: a sizeable area of Scotch Lovage (Ligusticum scoticum) was seen outside of this plot (it has moved into the area and is now a dominant species locally); former Red Maple Swamp has become a Dead Forest/Wet Meadow (all trees are dead); former Red Maple-White Pine Swamp (>100% cover; excellent canopy condition) in 2014 has become a more open stressed forest of Acer rubrum (30% cover; poor condition) and herbs (mostly Osmunda cinnamomea in plot). Little River Glaux maritima became more abundant near creek; former Salt Hay-Common Three-square Community converted to Salt Hay-Smooth Cordgrass (loss of Schoenoplectus pungens); occurrence of Agrostis noted in S. patens community; S. patens and Symphyotrichum novibelgii are now important associates in S. pectinata community; former Grass-Forb-Shrub border (shrubs in poor condition) converted to Mixed Salt Meadow (shrubs dead); Shrub Thicket (>100% cover but canopy condition somewhat poor) with few trees (lost all but one tree with canopy extremely poor); White Pine-Black Spruce Forest (>100% cover; excellent canopy) transitioned to Dying Forest (30% cover; poor canopy; all spruce dead but still standing; maple saplings colonized); uppermost community - Red Maple-Black Spruce Wetland Forest did not appear to have any change due to saltwater, yet some dead spruce saplings were observed (death possibly due to elevated water table or shading) while Acer rubrum exhibited growth (increase in dbh). Table 1. Summary of qualitative observations at each study location 2014–2019.
Wet Meadow community; 2) characteristic high marsh species (e.g., Juncus gerardii, Spartina patens, and Glaux maritima) migrated landward into the marsh border zone that was dominated by Spartina pectinata and Panicum virgatum; and 3) the abundance of Ligusticum scoticum and the occurrence of Teucrium canadense and Juncus gerardii in a former freshwater shrub-emergent community indicate saltwater influence. Plots at the marsh-forest border and further inland showed decreased cover in the tree and shrub vegetative plots, with all but two plots declining over time (increases occurred at Discovery Center plot 6T, Woodman Point plot 7S; Figure 2). This decreasing trend found in the tree and shrub plots is further supported by the paired analysis, comparing the change of percent cover over time within all plots containing each respective strata. On average, shrubs and trees both declined by more than half in just five years (p<0.05; Figure 4). In addition, canopy condition of trees also significantly decreased over time (p = 0.014), whereas shrub canopy condition neared significant decreases (p
= 0.111; Table 2). Finally, percent cover of fresh species significantly declined in the shrub strata, and upland species saw declines in all three strata; however, they were not significant (Tables 2 and 3). For marsh plots, percent cover data also revealed consistent increases in S. alterniflora. The majority of plots (85%) with existing or newly colonized S. alterniflora increased over time (Figures 2-3). These observed increases in S. alterniflora from 2014 (7.8% ± 2.4) to 2019 (10.4% ± 3.6) were nearly significant using the Wilcoxon signed-rank test (p = 0.051; Table 2). In addition to trends seen across all sites, there were notable trends seen within states. In Maine, S. patens increased at both the Furbish Road and Little River sites, increasing in cover in 66 percent and 75 percent of the plots where it existed or in newly colonized plots, respectively (Figure 3). In New Hampshire, the two sites had differing responses of S. patens cover. At the Discovery Center site, S. patens decreased at multiple plots, whereas the Woodman Point site increased in Wetland Science & Practice OCTOBER 2026 305
All Sites 2014 Mean
SE
Total Live Cover Spartina alterniflora Spartina patens % Halophytes % Brackish % Fresh % Upland
116.4 12.6 26.1 80.9 18.0 14.2 3.3
10.2 5.2 7.1 11.1 6.8 5.3 1.8
Canopy Condition % Fresh % Upland
4.0 55.3 16.3
0.7 14.6 8.2
Canopy Condition % Fresh % Upland
3.7 58.8 40.1
0.6 18.2 14.1
2019 Mean Herbaceous strata 139.7 16.6 25.3 94.0 25.0 19.2 1.6 Shrub strata 2.5 20.0 4.4 Tree strata 2.0 22.9 22.7
SE
p value 10.7 5.5 6.1 12.4 8.3 5.6 0.8
0.003 0.051 0.535 0.029 0.336 0.139 0.499
0.6 8.5 3.6
0.111 0.031 0.188
0.4 8.0 13.1
0.014 0.074 0.063
Table 2. Paired analysis including all four sites in New Hampshire and Maine. Canopy condition and total live were analyzed using a paired t-test, whereas all other dependent metrics listed were analyzed using a non-parametric equivalent, the Wilcoxon signed-rank test. Shaded cells indicate significance (p < 0.05). D.f. for all herbaceous strata metrics is 29, shrub strata metrics is 6 for canopy condition, 8 for % fresh and % upland, and tree strata metrics is 9. Two shrub plots did not contain any live shrubs.
2014 Mean
SE
New Hampshire 2019 Mean
2014 SE
Total Live Cover Spartina alterniflora Spartina patens % Halophytes % Brackish % Fresh % Upland
129.8 21.1 25.5 89.0 22.1 17.4 1.3
11.5 10.3 10.4 11.6 9.6 9.2 1.3
145.0 23.2 19.0 97.0 28.7 17.8 1.5
15.6 10.6 8.0 16.9 13.6 9.2 1.5
Canopy Condition % Fresh % Upland
4.0 74.5 19.0
0.0 34.5 5.0
3.5 62.8 16.0
0.5 2.8 16.0
Canopy Condition % Fresh % Upland
3.7 26.3 83.0
0.9 4.7 21.5
3.3 30.7 73.8
1.2 15.5 26.6
p value Mean Herbaceous strata 0.121 104.8 1.000 5.2 0.865 26.6 0.469 73.8 0.656 14.5 0.813 11.3 1.000 5.1 Shrub strata na 4.0 na 49.9 na 15.6 Tree strata na 3.7 na 72.7 na 21.7
SE
Maine 2019 Mean SE
p value
15.9 3.2 10.0 18.3 9.9 5.9 3.1
135.1 10.8 30.8 91.3 21.7 20.5 1.6
15.2 4.5 9.0 18.4 10.3 6.9 0.8
0.015 0.063 0.391 0.034 0.443 0.106 0.469
0.9 16.9 10.6
2.2 7.8 1.1
0.8 3.6 1.1
0.178 0.035 0.250
0.9 24.5 13.2
1.4 19.6 0.7
0.2 9.8 0.7
0.015 0.056 0.250
Table 3. Paired analysis by state. Canopy condition and total live cover were analyzed using a paired t-test, whereas all other dependent metrics listed were analyzed using a nonparametric equivalent, the Wilcoxon signed-rank test. Shaded cells indicate significance (p < 0.05). D.f. for all herbaceous strata metrics is 13 for New Hampshire and 15 for Maine, shrub strata metrics is 4 for canopy condition and 6 for % fresh and % upland for Maine, and tree strata metrics is 6 for Maine. ‘na’ indicates no tests were run for New Hampshire shrub and tree metrics because of low replication, n < 4. Two shrub plots in Maine did not contain any live shrubs.
306 Wetland Science & Practice OCTOBER 2026
Figure 2. Percent change in plant guild cover 2014–2019 by plot for a) Discovery Center and b) Woodman Point, New Hampshire. Plots 8 and 9 at Woodman Point site were not sampled again in 2019; therefore, changes could not be calculated at these plots. Plots are oriented seaward to upland from the left to the right side of the x-axis. Plots with multiple strata (herbaceous, shrub, and tree) have more than one bar per year, with each bar representing the dominant plant community guilds in each plant strata. Wetland Science & Practice OCTOBER 2026 307
Figure 3. Percent change in plant guild cover 2014–2019 by plot for a) Furbish Road and b) Little River, Maine. Plots are oriented seaward to upland from the left to the right side of the x-axis. Plots with multiple strata (herbaceous, shrub, and tree) have more than one bar per year, with each bar representing the dominant plant community guilds in each plant strata. 308 Wetland Science & Practice OCTOBER 2026
Figure 4. Percentage of a) shrub and b) tree cover for all four sites 2014–2019 using a paired t-test, d.f. = 8 and 9, respectively. Letters denote significant differences between years.
Fort Point, NH Wells Harbor, ME
2014 1 6
2015 1 7
2016 10 15
2017 5 12
2018 9 22
2019 1 8
Total 27 70
Table 4. Number of high tides per year that exceeded the highest astronomical tide (HAT) for each station in New Hampshire and Maine.
cover in 75 percent of the plots where S. patens existed or in newly colonized plots (Figure 2). When examining the data for larger scale trends, however, no significant patterns were detected in S. patens cover across all sites (Table 2) or when split by state (Table 3). Further analysis indicates that the statistical results in Table 2 are driven by changes occurring in the Maine marshes, with 4 of 13 dependent vegetation metrics (‘+’ Total Live Cover, ‘-’ % Halophytes, ‘-’ % Fresh, ‘-’ Canopy Condition) in Maine showing a significant change over the course of the study (Table 3). In contrast, New Hampshire did not register any significant changes in the 13 metrics over time. However, most metrics in New Hampshire display a similar directional shift in percent cover as the Maine sites with exception to S. patens, % upland herbaceous and % fresh tree (Table 3). Both states saw increases in total live herbaceous plant cover. The frequency of extreme high tide events, defined as flooding events exceeding the elevation of the HAT expected to occur at a specific tide station over the time period of 40 years, was also different between the two states. Maine experienced greater frequency of flooding above HAT (70 high tides, 1.69% of the tidal record)
compared to Great Bay (27 high tides, 0.69% of the tidal record) across the duration of the study, 20142019 (Supplemental 4). Furthermore, tidal flooding exceeding HAT occurred more frequently overall in later years (2016–2018) than earlier years (2014–2015; Table 4). Both tide stations had gaps in coverage with more data gaps at Great Bay (519 of 4,380 high tides, 11.9%), distributed in February 2015, December 2017, and throughout January–March 2019 than at Wells Harbor (237 of 4,380 high tides, 5.4%), concentrated in April–May 2019 (Supplemental 4). However, using calculated exceedance rates for Maine and New Hampshire tide stations, the difference in missing high tide data between the tide stations calculates out to 2.0 to 4.8 high tides exceeding HAT, which is considerably lower than the total difference between the two tide stations (n = 43 high tides).
Discussion Survey results reported here are part of a five-year northeast study of salt marsh migration (Tiner and Veneman 2014). While our results represent only two points in time, Maine marshes are already undergoing significant changes. Respective ecotone locations from the marsh interior to the upland demonstrated a shift Wetland Science & Practice OCTOBER 2026 309
away from upland and freshwater species coverage at the upland border into the upland. This transition was represented by shrub and tree strata declines with a concurrent increase in coverage by halophytes and S. alterniflora in the marsh and upland edge. The New Hampshire marshes generally follow these trends, though not as strongly nor as significantly. The New Hampshire sites consist of fringing marshes with fewer wooded plots; therefore, significant changes in shrub and tree strata were undetectable (Table 3). Burdick et al. (2020) found similar results from 2010 to 2018 at four sites from Rhode Island to Maine, reporting increases in brackish and halophytic cover in the upland ecotone and increases in S. alterniflora on the marsh platform. Their study, however, did not evaluate tree and shrub communities, examining only the border of the marsh-upland ecotone for herbaceous species using 1 m2 plots. In a review of marsh migration literature, McKown and Burdick (2024) identified a two-pronged push/pulse migration model (Sacatelli et al. 2023; Fagherazzi et al. 2019a, 2019b). "Push" parameters are those that provide a steady, though perhaps incrementally small, stress to plant communities. Gradually increasing sea and water table levels are push examples. "Pulse" parameters are stochastic events, such as storms, that can provide a physical breakthrough (e.g., breaching a dike) or physiological tipping point (e.g., exceeding soil salinity tolerance levels). For example, Hurricane Sandy brought salt water to an Atlantic white cedar swamp through tidal flooding and salt spray, on the Forsythe National Wildlife Refuge along the Bass River in Burlington County, New Jersey, which eventually converted the swamp into a "ghost forest" (Doyle et al. 2021, Tiner pers. obs.; Supplemental 5). Our study examined several parameters for potential "push/pull" dynamics. Sea level data during our study period of 2014–2019 shows a flat to slightly decreasing trend in sea level rise at the nearest NOAA National Water Level Observation Network stations in Boston, MA, and Portland, ME (Figure 5), suggesting that a different "push" stressor may be involved. One alternative could be the 18.6 year lunar cycle (i.e., metonic cycle), which crested in 2015 manifesting in peak tidal range values (i.e., higher high tides and lower 310 Wetland Science & Practice OCTOBER 2026
low tides). In 2019, seas were on the falling side of the metonic cycle with diminishing tidal ranges. Vegetation surveys presented here were conducted near the height (2014) and upper half (2019) of the metonic cycle, so the largest tidal ranges (higher highs) may have pushed up the groundwater lens in adjoining uplands and delayed surface water drainage, particularly in the presence of barriers to ebb flow such as embankments and clogged ditches (Adamowicz et al. 2020; Mora and Burdick 2013). "Pulsed" factors also might be influencing plant community change in our study. Because the data show the most dramatic changes (decreases) to the upland edge and upland plots, as indicated by declines in shrub and tree canopy condition and cover (Table 2 and Figure 4), it is hypothesized that storm surges or freshwater flood events likely would have affected upland trees and shrubs more than marsh halophytes/ brackish plants since they are adapted to flooding and saltwater conditions (Vince and Snow 1984). Furthermore, freshwater flooding would have released salt marsh plants from any salinity stress, while it would have stressed trees and shrubs. Evidence for storm surges may be obtained from photo documentation, nearby tide stations or data sondes. For example, Figure 6 shows the marsh and upland area adjacent to the Furbish transect on December 14, 2019, with a peak flood of 3.72 m MLLW. The HAT is 3.52 m relative to the MLLW for this area; peak tides beyond this point clearly flood into the tree and shrub zone. NOAA Tides and Currents for Wells Harbor, Maine, verified tide levels that exceeded 3.66 m MLLW on January 1, March 22, October 28, and December 14, 2019 (NOAA Tides & Currents). For comparison’s sake, there was only one event at or above that level in 2014 (January 1, 2014). While Wasson et al. (2013) found ecotone plant communities resistant to change, studies in salt marsh ecology, particularly with perennial grasses, show that pulsed events from a previous year (e.g., drought resulting in salinity stress) or early in the growing season (e.g., abundant rainfall) can influence productivity levels for the current year (Lu et al. 2025). Rainfall records from Eliot, Maine (located between our New Hampshire and Maine study sites), documented
Figure 5. Average sea level data at NOAA’s National Water Level Observation Network Boston, MA (a) and Portland, ME (b) locations. Study years are framed by red dotted lines. Data accessed from https://tidesandcurrents.noaa.gov/sltrends/sltrends_station.shtml?id=8443970 and https://tidesandcurrents.noaa.gov/sltrends/sltrends_station. shtml?id=8418150, respectively. Wetland Science & Practice OCTOBER 2026 311
Figure 6. Photographs taken December 14, 2019, looking southwest from Furbish Road, Wells, Maine. Top image (a) shows embankment between marsh and upland woods. Bottom image (b) shows woods well flooded. (Photo: SC Adamowicz) 312 Wetland Science & Practice OCTOBER 2026
the 6th and 10th wettest in the past 27 years in 2018 and 2019, respectively. In this region, the mean annual rainfall is 127 cm with a range of 99–177 cm. Annual rainfall was at or above historic means with 146 cm in 2018 and 133 cm in 2019. It is possible the rains of 2018 and 2019 could have favored marsh production, while increased freshwater flooding in the tree-shrub ecotone, particularly if there were impediments to drainage (e.g., embankments), could have negatively impacted upland and brackish species. The landward transgression of salt marsh plant communities may have a direct impact on the ecosystem services provided by New England salt marshes. Protection from storm surge and flooding is perhaps the most important ecosystem service offered by salt marshes to coastal human communities. Wide, more contiguous and uninterrupted marshes with higher elevations are particularly effective at protecting inland areas (Leonardi et al. 2018). As coastal storms become increasingly frequent and powerful, however, a salt marsh’s resilience to these events may be hindered through shoreline erosion and increased depth and duration of inundation. Marsh migration into former uplands could be seen as offsetting some of these losses due to erosion on seaward margins. Compensating for salt marsh loss through marine transgression may be important for other services, including the role these ecosystems play in providing habitat for a variety of estuarine fish and wildlife. Loss of salt marsh habitat may exert bottom-up controls on these species, which can be devastating for those of economic and ecological importance. The manner in which salt marshes respond to climate change has direct implications for obligate tidal nesting birds, such as the at-risk/IUCN endangered saltmarsh sparrow (Ammospiza caudacuta). Saltmarsh sparrow nest on the high marsh platform and need dense vegetation cover, primarily S. patens and S. alterniflora for nest construction (Greenlaw et al. 2018; Gjerdrum et al. 2005). Saltmarsh sparrows are adapted to nest between peak tides; however, due to higher and longer-duration high tide flooding events, nests are often inundated and chicks drown (Field et al. 2017). Expanding potential habitat through marsh migration into higher elevation areas that has reduced risk of flooding could be an
important aspect of the species survival (Field et al. 2016; see also Field and Elphick 2020). In conclusion, our study documented changes in vegetation coverage aligned with marsh migration, although those changes varied in degree by site and region. Detecting any change was remarkable, given that the time step was only five years, indicating rapid change from push and pulse factors. Finally, salt marsh ecosystem services are vital to both human and wildlife communities, presenting a management challenge to the region. For tidal marsh obligate birds like the saltmarsh sparrow, their future is inextricably linked to the ability of the regional salt marshes to keep pace and/or migrate with future sea level rise.
Acknowledgments We wish to thank Rachel Carson National Wildlife Refuge, Great Bay National Wildlife Refuge, and Great Bay National Estuarine Research Reserve (GBNERR) for access to the study sites. Partial funding for this work was provided by the U.S. Fish and Wildlife Service (USFWS) and NOAA’s Office for Coastal Management to the National Estuarine Research Reserve System. The following individuals participated in this study: Paul Stacey (GBNERR), Briana Fischella (GBNERR), Nick Ernst and Kaytee Hojnacki, Ward Feurt, David Tibbetts, Sierra Kuun, Brittany Forslind, Megan Zopfi, Sam Rush, Toni Mikula, and Lauren Healey (USFWS), Adrienne Kovach (University of New Hampshire), Catherine Callahan (New Hampshire Fish and Game), Joanne Glode (The Nature Conservancy), and Tin Smith (Wells NERR). The manuscript was improved by helpful comments of two anonymous reviewers and the handling editor.
Declaration of Originality The results presented here have not been published before. Figures, tables, images, and quotations included in the article have been properly cited and permission has been granted for any that are not those of the author.
Required Disclaimer "The findings and conclusions in this article are those of the author(s) and do not necessarily represent the views of the U.S. Fish and Wildlife Service." Wetland Science & Practice OCTOBER 2026 313
References Adamowicz, S. C., G. Wilson, D. M. Burdick, W. Ferguson, and R. Hopping. 2020. Farmers in the marsh: lessons from history and case studies for the future. Wetland Science and Practice, 37(3): 182-195. -Burdick, D., C. Peter, B. Fischella, M. Tyrrell, J. Allen, J. Mora, K. Raposa, J. Goldstein, C. Feurt, and L. Crane. 2020. Synthesizing NERR Sentinel Site Data to Improve Coastal Wetland Management Across New England Data Report. NERRS Science Collaborative. Doyle, J. M., E. E. Kendal, and R. B. Atkinson. 2021. "An Analysis of Atlantic White Cedar (Chamaecyparis thyoides (L.) B.S.P.) Tree Rings as Indicators of Ghost Forest Development in a Globally Threatened Ecosystem" Forests 12, no. 8: 973. https://doi. org/10.3390/f12080973 Fagherazzi S., S. C. Anisfeld, L. K. Blum, E. V. Long, R. A. Feagin, A. Fernandes, W. S. Kearney, and K. Williams. 2019a. Sea level rise and the dynamics of the marsh – upland boundary. Frontiers in Ecology and the Environment 7: 25. doi: 10.3389/fenvs.2019.00025 Fagherazzi S., G. Nordio, K. Munz, D. Catucci, and W. S. Kearney. 2019b. Variations in persistence and regenerative zones in coastal forests triggered by sea level rise and storms. Remote Sensing 11:2019. doi: 10.3390/rs11172019 Field, C. R. and C. Elphick. 2020. Final Report to Atlantic Coast Joint Venture for: Modelling the potential for alternative management strategies to improve the conservation status of saltmarsh sparrow and other tidal marsh specialist birds. https://acjv.org/ documents/Field_Elphick_ACJV_final_report.pdf Field, C. R., C. Gjerdrum, and C. S. Elphick. 2016. Forest resistance to sea-level rise prevents landward migration of tidal marsh. Biological Conservation 201: 363-369. Field, C. R., T. S. Bayard, C. Gjerdrum, J. M. Hill, S. Meiman, and C. S. Elphick. 2017. High‐resolution tide projections reveal extinction threshold in response to sea‐level rise. Global Change Biology, 23(5), 20582070.
314 Wetland Science & Practice OCTOBER 2026
Gjerdrum, C., Elphick, C. S., & Rubega, M. 2005. Nest site selection and nesting success in saltmarsh breeding sparrows: The importance of nest habitat, timing, and study site differences. The Condor: Ornithological Applications, 107(4), 849–862. https://doi.org/10.1093/ condor/107.4.849 Gonneea, M. E., C. V. Maio, K. D. Kroeger, J. M. Hawkes, R. Sullivan, S. Madsen, R. M. Buzard, N. Cahill, and J.P. Donnelly. 2019. Salt marsh ecosystem restructuring enhances elevation resilience and carbon storage during accelerating relative sea-level rise. Estuaries, Coastal, and Shelf Science 217:56-68. Greenlaw, J. S., C. S. Elphick, W. Post, and J. D. Rising. 2018. Saltmarsh Sparrow (Ammospiza caudacuta), version 2.0. In The Birds of North America, edited by P. G. Rodewald. Cornell Lab of Ornithology. https://doi. org/10.2173/bna.sstspa.02 Leonardi, N., I. Carnacina, C. Donatalli, N. K. Ganju, A. J. Plater, M. Schuerch, and S. Temmerman. 2018. Dynamic interactions between coastal storms and salt marshes: A review. Geomorphology 301, 92-107. Lu, T.-Y., S.-C. Lee, Z. Nesic, R. Ketler, and S. H. Knox. 2025. From sink to source: Salinity and water level fluctuations between years drive large differences in CO2 exchange in a temperate salt marsh. Journal of Geophysical Research: Biogeosciences, 130, e2025JG009128. https://doi. org/10.1029/2025JG009128 McKown, J. G. and D. M. Burdick. 2024. Salt marsh migration into coastal uplands and application for conservation in New Hampshire. Prepared for Great Bay National Estuarine Research Reserve. Mikula, T., S. C. Adamowicz, K. O’Brien, B. Forsling, R. Stearns, and B. Benvenuti. 2024. Salt Marsh Integrity at Rachel Carson National Wildlife Refuge. National Wildlife Refuge System, A report to the US Fish and Wildlife Service Northeast Region. https://iris. fws.gov/APPS/ServCat/Reference/Profile/179578 Mora, J. W. and D. M. Burdick. 2013. Effects of man-made berms upon plant communities in New England salt marshes. Wetlands ecology and management, 21(2):131-145.
Niering, W. A. and R. S. Warren. 1980. Vegetation patterns and processes in New England salt marshes. Bioscience, 30(5): 301-307. NOAA National Estuarine Research Reserve System (NERRS). 2025. System-wide Monitoring Program. NOAA NERRS Centralized Data Management Office. http://www.nerrsdata.org NOAA Tides & Currents. n.d. Verified Hourly Heights for 8419317, Wells ME. NOAA Tides & Currents. https://tidesandcurrents.noaa.gov/waterlevels.html?id= 8419317&units=standard&bdate=20190601&edate=20 190629&timezone=GMT&datum=MLLW&interval=h &action= Payne, A.R., D. M. Burdick, and G. E. Moore. 2019. Potential effects of sea-level rise on salt marsh elevation dynamics in a New Hampshire estuary. Estuaries and Coasts, 42(6), 405-1418. Peter, C., R. Stevens, and J. Carter. 2022. Establishing a high-precision tide station in the Great Bay Estuary. National Estuarine Research Reserve System, NOAA’s office for coastal management.
and in situ isotope enrichment study. Limnology and Oceanography. 46: 1977–1989. U.S. Army Corps of Engineers. 2012. Regional Supplement to the Corps of Engineers Wetland Delineation Manual: Northcentral and Northeast Region. Version 2.0. U.S. Army Engineer Research and Development Center, Wetlands Regulatory Assistance Program. ERDC/EL TR-12-1. Wasson, K., A. Woolfolk, and C. Fresquez. 2013. Ecotones as Indicators of Changing Environmental Conditions: Rapid Migration of Salt Marsh–Upland Boundaries. Estuaries and Coasts 36: 654–664. https:// doi.org/10.1007/s12237-013-9601-8 Wolfe, R.J. 1996. Effects of open marsh water management on selected tidal marsh resources: a review. Journal of the American Mosquito Control Association 12(4): 701-712. https://www. biodiversitylibrary.org/content/part/JAMCA/JAMCA_ V12_N4_P701-712.pdf Vince, S. W. and A. A. Snow. 1984. Plant zonation in an Alaskan salt marsh. Journal of Ecology 72: 651-667.
Sacatelli, R., M. Kaplan, G. Carleton, and R. G. Lathrop. 2023. Forest dieback in the Northeast USA: Potential mechanisms and management responses. Sustainability 15: 6346. doi: 10.3390/su15086346 Tiner, R. W. 2009. Field Guide to Tidal Wetland Plants of Northeastern United States and Neighboring Canada: Vegetation of Beaches, Tidal Flats, Rocky Shores, Marshes, Swamps, and Coastal Ponds. University of Massachusetts Press. Tiner, R. W. 2013. Tidal Wetlands Primer: An Introduction to Their Ecology, Natural History, Status, and Conservation. University of Massachusetts Press. Tiner, R. W. and P. M. Veneman. 2014. An approach to monitoring coastal marsh migration in the Northeast. Wetland Science and Practice 31(3):10-13. Tobias, C. R., S. A. Macko, I. C. Anderson, E. A. Canuel, and J. W. Harvey. 2001. Tracking the fate of high concentration groundwater nitrate plume through a fringing marsh: A combined groundwater tracer
Wetland Science & Practice OCTOBER 2026 315
Evaluating NOAA’s National Water Model v3.0 Streamflow Data for Integration into the US Army Corps of Engineers’ Antecedent Precipitation Tool Kent Sparrow1, Stephen Brown2, Christopher French2
Abstract This study evaluates the performance of the National Water Model version 3.0 (NWM v3.0) in simulating streamflow conditions across the contiguous United States. Recognizing the critical need for accurate hydrologic data among federal agencies such as the National Weather Service, the U.S. Environmental Protection Agency, and the U.S. Army Corps of Engineers, we utilized a comprehensive dataset that includes both NWM v3.0 outputs and observed streamflow data from U.S. Geological Survey gages. Our analysis applied various statistical metrics, including percent accuracy, Nash-Sutcliffe Efficiency (NSE), R², and Kling-Gupta Efficiency, to assess model performance. The results indicate significant regional variability, with NWM v3.0 demonstrating greater accuracy and predictive skill in the eastern U.S. and parts of the Pacific Northwest, while performance is notably less accurate in arid and hydrologically complex regions, such as southwestern US basins. Although the updated model shows improvements in NSE and R² compared to its predecessor, NWM v2.1, the overall accuracy has slightly decreased, suggesting that enhancements in model physics and calibration have not uniformly translated into better performance across all reference gages. These findings have important implications for water resource management and regulatory compliance, as accurate hydrologic data is essential for informed decision-making. This research establishes a baseline for NWM v3.0’s accuracy and highlights the need for ongoing model refinement and collaboration among federal agencies and research institutions to enhance the utility of hydrologic models in managing the nation’s water resources.
1 USACE-ERDC Geospatial Research Laboratory, Alexandria, Virginia 2 USACE-ERDC Coastal and Hydraulics Laboratory, Vicksburg, Mississippi Correspondence Author Email: kent.h.sparrow@usace.army.mil
316 Wetland Science & Practice OCTOBER 2026
Introduction Background The scientific, regulatory, and resource management communities across the private sector and federal agencies, particularly the National Weather Service (NWS), the U.S. Environmental Protection Agency (EPA), and the U.S. Army Corps of Engineers (USACE), require detailed knowledge of the hydrologic and hydroclimatic behavior of rivers, wetlands, and other aquatic systems. These agencies rely on such information to support a wide range of applications, including but not limited to permitting and compliance decisions along streams and waterbodies, drought monitoring, flood event analysis, flood forecasting, and watershed condition assessments (Sparrow et al. 2024; Cosgrove et al. 2024). For example, USACE Regulatory practitioners often evaluate a waterbody’s response to hydroclimatic patterns and its hydrologic connections to inform jurisdictional determinations under the Clean Water Act. Identifying a stream’s flow duration classification typically involves assessing whether flow conditions on the observation date reflect normal hydrologic and climatic patterns for that site (Fritz et al. 2020). To support such determinations, the EPA and USACE frequently use hydrologic tools such as the Antecedent Precipitation Tool (APT; Figure 1) in combination with other useful tools like U.S. Geological Survey (USGS) gage records to assess longterm hydroclimatic conditions (Sparrow et al. 2024). Although the APT has proven useful for assessing precipitation conditions when evaluating wetlands (Vepraskas et al. 2019), its ability to report direct streamflow conditions was limited until recently (Sparrow et al. 2022, 2024). Streamflow observations and model-based streamflow estimates provided in the latest APT v3.0 release offer a more reliable measure than precipitation proxies in APT 2.1 (Sparrow et al.
Figure 1: An example of antecedent precipitation conditions compared to the 30-year normal range based on NOAA’s nClimGrid-Daily precipitation data. The blue line represents the 30-day rolling total precipitation, while the orange shaded area indicates the 30-year normal range (between the 30th and 70th percentiles). Daily precipitation totals are shown as gray bars. The table summarizes percentile-based statistics, Palmer Drought Severity Index (PDSI) drought index classification, and wetness condition scores generated by the APT. Overall, conditions during this period were assessed as drier than normal.
2024, 2025). To supplement antecedent precipitation data, APT v3.0 retrieves the streamflow observations from the USGS and model-derived estimates from the National Water Model (NWM). Sparrow et al. (2024) demonstrated the added value of this streamflow data by comparing National Water Model v2.1 (NWM v2.1) results against USGS gage data. The analysis, which used the APT Antecedent Precipitation Scores in a comparison to USGS and NWM flow data, showed that precipitation-based approaches had limited accuracy in classifying normal, above-normal, or below-normal flows. The use of antecedent precipitation normalcy as a proxy for streamflow normalcy did not produce high accuracy results when compared to a USGS reference gage evaluation in Sparrow et al. 2022. This study builds on previous work by Sparrow et al. (2022, 2024) and Gutenson et al. (2024, 2025), in which the researchers assessed the inclusion of NWM v2.1 data within the APT and validated its streamflow accuracy against USGS gages. Results from these studies largely support that hydrologic models provide
a more accurate representation of historic streamflow conditions than the APT precipitation analysis alone, particularly in the absence of stream gages. Building on these efforts, an updated evaluation is needed to establish the accuracy of NWM v3.0 for assessing hydrologic streamflow conditions. NOAA’s recent update to NWM v3.0 introduces contiguous United States (CONUS) wide enhancements to the modeling framework and expands coverage to outside (OCONUS) locations, including Alaska, Hawaii, Puerto Rico, and the U.S. Virgin Islands. NWM v3.0 also provides guidance for coastal regions, where freshwater discharge modeling is coupled with oceanic forcing models (NCEP; NOAA 2025). The NWM’s precipitation forcing data have been updated to incorporate the National Blend of Models within the CONUS and Alaska. Model physics improvements include updated hydrologic and landsurface parameters, enhanced reservoir modeling, and an improved precipitation dataset. Recent regional studies indicate that the predictive skill of the NWM has Wetland Science & Practice OCTOBER 2026 317
improved with respect to predictive accuracy, root mean squared error (RMSE), Kling-Gupta Efficiency (KGE), and Nash-Sutcliffe Efficiency (NSE) from version 2.1 to 3.0 (e.g., Timilsina and Passalacqua 2025). This study of NWM v3.0 data will establish a CONUSwide accuracy baseline for organizations that use NWM-derived water data and climate services, including NOAA’s National Water Center (NWC), the USGS, and the USACE. Ongoing efforts to integrate NWM-derived streamflow information into the APT are supported by collaboration among these organizations. Evaluating the accuracy of shared data products across agencies will help the hydrologic community make more consistent and scientifically informed decisions.
Methodology Overview Our approach utilizes the methodology outlined in Gutenson et al. (2025) and Sparrow et al. (2024), in which daily percentiles of NWM streamflow and categorical streamflow conditions were generated to evaluate how effectively the NWM captures streamflow normalcy. These modeled percentiles were compared against corresponding percentiles derived from daily USGS stream gage observations to calculate NWM accuracy. Our analysis contrasted the performance of NWM-derived streamflow with that of USGS stream gages to calculate R2, NSE, and KGE metrics, demonstrating when and where the NWM v3.0 provides a reliable representation of streamflow normalcy. We focused exclusively on evaluating NWM v3.0 performance against USGS stream gages within the CONUS.
Retrospective Data This work relies on the NWM v3.0, a continentalscale Weather Research and Forecast (WRF)-Hydro modeling framework designed for streamflow analysis (Gochis et al. 2020). The retrospective NWM v3.0 dataset offers hourly streamflow reanalysis for the CONUS, as well as portions of southern Canada and northern Mexico, spanning 44 years from February 1979 through January 2023. Another resource used in this study is the GAGES-II dataset, which contains roughly 9,322 active and historical USGS surfacewater gages (Falcone 2011). The dataset was developed 318 Wetland Science & Practice OCTOBER 2026
to support large-scale hydrologic assessments and statistical modeling of streamflow and water quality. For our analysis, we focused on NWM reaches associated with the reference gage subset of the GAGES-II data that provide complete daily historical records at 1,191 gage sites (Figure 2).
Normalcy Analysis In this study, we generated daily mean streamflow values and corresponding percentiles from NWM output and compared them to observed USGS gage data. To construct both the NWM and USGS percentile datasets, hourly streamflow estimates from each source were aggregated into daily averages for matching periods of record. These daily values were then divided into two groups: a training dataset (February 1979– December 2010) and a testing dataset (January 2011– December 2020). The selected time span corresponds to the NWM v3.0 and NWM v2.1 retrospective datasets, meaning that each gage included in the analysis required a continuous historical record covering February 1979 through December 2020. This constraint reduced the total number of reference gauges from 2,057 to 1,191. For the training period, percentile categories (minimum, 5th, 10th, 20th, 25th, 50th, 75th, 80th, 90th, 95th, and maximum) were calculated for each day of the year. These categories are consistent with those provided by the USGS National Water Information System (NWIS; Mayorga 2021). The 25th and 75th percentiles were used as thresholds to define below normal (dry), normal, and above normal (wet) hydrologic conditions. Daily streamflow values from the testing period were then evaluated relative to the training percentiles, classifying each observation as below normal, normal, or above normal. This process was repeated iteratively for each year of the testing period, updating the training dataset annually with the prior year’s values to generate flow-duration curves and updated percentile thresholds. In Sparrow et al. (2024), USGS daily streamflow and percentile information, computed from the full gage period of record, were obtained directly from the NWIS using the Python package Ulmo (v0.8.8; Mayorga 2021), eliminating the need to calculate percentiles manually. The USGS percentile categories used in that study aligned with those from prior analyses (Sparrow
Figure 2: Locations of USGS reference stream gages from the GAGES-II dataset distributed across the CONUS and grouped within HUC2 regions. Each green triangle represents a study location used in the analysis, and blue outlines indicate HUC2 regional boundaries.
et al. 2022, 2024; Gutenson et al. 2024). In contrast, this study employed matching periods of record for both the USGS and NWM v3.0 datasets when computing percentile values. The resulting testing dataset enabled direct comparison of NWM and USGS streamflow classifications over a 10-year overlap period, producing paired daily percentile time series for both the training and testing datasets.
NSE,
Four statistical metrics were used to assess NWM v3.0 performance:
where Obs is the observed USGS gage value, is the average of the NWM simulated values for the study period, and is the average of gage values for the study period (Nash & Sutcliffe, 1970).
Accuracy,
R2,
where model accuracy was assessed by determining whether the NWM percentile category matched that of the observed USGS category (below normal, normal, or above normal flows).
where Obs is the observed USGS gage value, Sim is the NWM modeled value, is the average of gage Wetland Science & Practice OCTOBER 2026 319
values for the study period, and is the average of the NWM simulated values for the study period. Kling-Gupta Efficiency (KGE),
where r is the linear correlation between the simulated NWM values and observed USGS gage values, a is the measure of flow variability error that is calculated by dividing the standard deviation of the NWM simulated data by the standard deviation of the USGS observed data, and B is the bias ratio calculation where the mean of the NWM simulated data is divided by the mean of the USGS observed data. Of these metrics, R² represents the strength of the linear relationship between modeled and observed values, while NSE quantifies how well the modeled streamflow variance aligns with observations. In real-world terms, NSE tells you whether the model is useful for forecasting river behavior. An NSE close to 1.0 means the model reproduces the timing and magnitude of flows very well. An NSE around 0 means the model is no better than just assuming the river always flows at its climatological average rate, while negative values mean the model performs worse than that simple assumption.
KGE is a composite statistic used to assess hydrologic model performance by incorporating correlation, bias, and variability between USGS streamflow observations and NWM simulations. A KGE value of 1.0 indicates that the model reproduces the overall behavior of the river well across these three dimensions. In practice, this means the model is not only getting the timing of events right but is also producing realistic flow magnitudes and variability. Thresholds of R² > 0.3, KGE > 0.0, and NSE > 0.0 were indicative of valuable predictive skill. Values approaching 1 for all three metrics reflect optimal model performance. Results from the NWM v3.0 analysis were aggregated by HUC2 regions (Figure 3) to evaluate regional variability in model skill (Table 1). To assess changes in model skill between NWM versions, we calculated the differences in accuracy, NSE, R², and KGE between NWM v2.1 and NWM v3.0. The outcomes of this analysis highlight difference in accuracy and overall performance relative to the dataset used in Sparrow et al. (2024).
Figure 3: HUC2 regions and boundaries across the conterminous United States. Each numbered region corresponds to a major drainage basin, with names listed in the accompanying table. These HUC2 regions represent large-scale hydrologic divisions used for regional water resource assessment and analysis. 320 Wetland Science & Practice OCTOBER 2026
Results National Water Model v3.0 Performance The accuracy, NSE, R2, and KGE metrics are displayed for each HUC2 region in the CONUS in Table 1 below. The number of gages used in each region varies widely, ranging from 16 in the Rio Grande Region to 165 in the Pacific Northwest. Overall, NWM performance exhibits regional variability, with accuracy values generally ranging from 0.51 to 0.67. Accuracy represents the proportion of days for which the USGS observations and NWM predictions fall within the same streamflow percentile category (below normal, normal, or above normal). For example, a value of 0.67 indicates that the NWM and USGS daily streamflow categories agree 67% of the time during the selected evaluation period within the HUC2 region. The highest accuracy values occur in the California (0.67) and Ohio (0.66) regions, HUC 2 HUC 2 Name
while the lowest appear in the Rio Grande (0.51) and Lower Colorado (0.52) regions. Flow NSE values are positive in most regions but notably negative in the Missouri (−12.35), Lower Colorado (−4.41), and California (−2.67) regions, indicating lower model skill in these areas. R² values are consistently moderate to strong, ranging from 0.30 to 0.70, with the highest values in the Lower Mississippi and Pacific Northwest regions. Flow KGE values also show similar spatial variability, with the highest performance observed in the Lower Mississippi (0.76) and Ohio Regions (0.75) and the lowest in the Rio Grande (−0.25) and Lower Colorado (−0.75) regions. These results indicate that NWM streamflow performance is generally stronger in the eastern U.S. and weaker in arid western basins, likely reflecting regional differences in hydrologic complexity, data availability, and model representation of runoff processes.
Gage Count
Accuracy
Flow NSE
Flow R2
Flow KGE
1
New England Region
63
0.63
0.48
0.59
0.67
2
Mid Atlantic Region
127
0.65
0.10
0.62
0.66
3
South Atlantic-Gulf Region
146
0.62
-0.45
0.65
0.52
4
Great Lakes Region
58
0.61
0.30
0.54
0.61
5
Ohio Region
84
0.66
0.61
0.66
0.75
6
Tennessee Region
30
0.64
0.61
0.69
0.53
7
Upper Mississippi Region
61
0.65
0.35
0.65
0.66
8
Lower Mississippi Region
21
0.61
0.67
0.70
0.76
9
Souris-Red-Rainy Region
16
0.57
0.30
0.37
0.43
10
Missouri Region
124
0.56
-12.35
0.49
0.05
11
Arkansas-White-Red Region
78
0.63
0.40
0.69
0.57
12
Texas-Gulf Region
60
0.53
0.35
0.49
0.22
13
Rio Grande Region
16
0.51
-1.68
0.30
-0.25
14
Upper Colorado Region
20
0.55
0.23
0.62
0.57
15
Lower Colorado Region
34
0.52
-4.41
0.31
-0.75
16
Great Basin Region
25
0.57
-0.63
0.58
0.11
17
Pacific Northwest Region
165
0.62
0.54
0.70
0.72
18
California Region
65
0.67
-2.67
0.63
0.50
Table 1: HUC2 results summary table displaying HUC2 Region with associated gage count, accuracy, NSE, R2, and KGE.
Wetland Science & Practice OCTOBER 2026 321
The analysis of the NWM v3.0 aggregated by HUC2 regions reveals distinct regional patterns in model performance across the CONUS. The spatial distribution of mean accuracy (Figure 4) indicates that the NWM performs best in the eastern US, Pacific Northwest, and parts of the western coastal regions, where mean accuracy values generally exceed 0.6. In contrast, lower accuracies are observed in the central and southwestern regions, particularly across the Great Plains and Upper Colorado basins, where mean accuracy falls to the 0.4-0.6 bin. The box plot analysis by HUC2 region (Figure 4) further highlights differences in the distribution and variability of model accuracy. Most regions exhibit median accuracies between 0.6 and 0.8, consistent with the spatial analysis. However, several regions, including HUC2’s 03, 04, 05, 09, and 15, display wider interquartile ranges and more outliers, indicating greater variability in model performance within these basins. In contrast, regions such as 01, 02, and 16 show higher and more consistent accuracy, as reflected by tighter interquartile ranges and elevated medians. A few regions, notably 07, 08, and 13, demonstrate lower median values and broader variability, suggesting more heterogeneous model performance. Overall, these results indicate that the NWM generally achieves strong predictive accuracy in most HUC2 regions, with the highest reliability in well-gaged basins and reduced
performance in regions characterized by complex terrain or limited hydrologic observations. R² was also aggregated by HUC2 regions and is displayed in Figure 5. Spatially, the mean R² values indicate that model performance varies considerably across the country. The highest skill (R² > 0.9) occurs at a limited number of gages, resulting in most regions exhibiting moderate to strong agreement between simulated and observed streamflow (R² = 0.5–0.7). These higher-performing regions are generally located in the eastern CONUS, the Midwest, and parts of the Pacific Coast and Rocky Mountain regions. In contrast, lower R² values (R² < 0.3) are found in portions of the south-central and northern Plains regions, suggesting reduced model accuracy in areas influenced by complex hydrology, snowmelt processes, or sparse USGS gages. The distribution of R² values within each HUC2 region (Figure 5) further highlights this spatial variability. Most regions demonstrate median R² values between 0.5 and 0.7, indicating overall satisfactory model performance. Regions 06, 07, 08, and 12 show the highest medians (≈ 0.7–0.8), reflecting strong model skill and consistency. Conversely, Regions 10, 13, 15, and 17 exhibit lower medians and greater spread, implying more variable performance across individual stream gages. Outliers with R² < 0.3 occur in several regions, underscoring localized model deficiencies. Collectively, these results suggest that the NWM
Figure 4: Spatial and regional distribution of the NWM’s mean accuracy across the CONUS. The map to the left displays the mean model accuracy by HUC2 hydrologic regions, with color gradations indicating average accuracy levels ranging from less than 0.2 (red) to greater than 0.8 (blue). Box plots of accuracy values for each HUC2 region are displayed on the right side of the figure, showing median, interquartile range, and variability within and across regions. 322 Wetland Science & Practice OCTOBER 2026
Figure 5: Spatial and regional distribution of the NWM’s mean R2 across the CONUS. The map to the left displays the mean R2 by HUC2 hydrologic regions, with color gradations indicating average R2 levels ranging from less than 0.3 (red) to greater than 0.9 (blue). Box plots of R2 values for each HUC2 region are displayed on the right side of the figure, showing median, interquartile range, and variability across regions
generally captures streamflow dynamics well at the national scale, though performance varies regionally. NSE was used to evaluate the performance of the NWM in simulating streamflow across the CONUS within HUC2 boundaries (Figure 6). Spatially, the mean NSE values reveal substantial regional variation in model skill. Overall, model performance is strongest in the eastern and central CONUS, particularly in regions along the Ohio, Tennessee, and Lower Mississippi basins, where NSE values typically range from 0.5 to 0.75, indicating good predictive capability. Moderate
performance (NSE = 0.25–0.5) is observed in the Pacific Northwest, New England, Great Lakes and Texas-Gulf Regions, while large areas of the western, southern, and northern Great Plains exhibit lower NSE values (NSE < 0.25), suggesting more limited agreement between modeled and observed streamflow. The bar chart on the right of Figure 6 provides a quantitative summary of NSE values across HUC2 regions. Most regions display mean NSE values below 0.5, underscoring the overall modest skill of the model at this spatial scale. The highest median NSE values
Figure 6: Spatial and regional distribution of the NWM’s mean NSE across the CONUS. The map to the left displays the mean NSE by HUC2 hydrologic regions, with color gradations indicating average NSE scores ranging from less than 0.0 (red) to greater than 0.75 (blue). Bar plots of NSE values for each HUC2 region are displayed on the right side of the figure. Wetland Science & Practice OCTOBER 2026 323
(≈0.6–0.7) occur in Regions 6–8, indicating relatively strong model performance in the lower Mississippi, Ohio, and Tennessee River basins. In contrast, Regions 3, 10, 13, 15, 16, and 18 show mean NSE values near or below zero, suggesting that the model performs worse than the mean of observed streamflow in these basins. A bar chart was used for the NSE analysis because the large spread in values on the box plot made the graph difficult to interpret clearly. Collectively, these results indicate that while the NWM demonstrates acceptable streamflow simulation capability in parts of the eastern and central U.S., its performance is considerably weaker in parts of the western and southern regions, emphasizing the possible need for regional model calibration and improved representation of local hydrologic conditions. The spatial distribution of mean KGE values (Figure 7) indicates that the NWM attains its highest performance in the eastern, Pacific Northwest, and parts of the northern CONUS, where mean KGE values generally exceed 0.4. In contrast, several central, southwestern, and Gulf Coast regions—including the Great Plains, Lower Colorado, and southwest basins—exhibit lower KGE values, with means frequently below 0.4 and, in some cases, below 0.0. These spatial trends align with the previous analyses that suggest that the NWM captures streamflow dynamics more effectively in less-
arid, data-rich regions, whereas performance declines in arid or semi-arid basins where hydrologic processes are more variable and observational data are limited. The box plot distributions by HUC2 region (Figure 7) provide further detail on the variability of KGE performance. Median KGE values across most regions range from approximately 0.5 to 0.8, indicating moderate to strong correlation between simulated and observed streamflow. However, HUC 09, 11, 12, 13, and 15 display large interquartile ranges and numerous low outliers, signifying inconsistent model performance and localized prediction challenges. Conversely, HUC2 regions such as 01, 02, 06, and 16 exhibit consistently high KGE values and narrow variability, suggesting more stable and accurate model behavior. Overall, the KGE analysis aligns with patterns observed in other performance metrics.
National Water Model v3.0 versus v2.1 While the update from NWM v2.1 to NWM v3.0 included improvements to model physics and calibration, as well as expanded domain to Outside the Contiguous United States (OCONUS) locations, NWM v3.0 performance does not appear to significantly improve at the reference gage locations where our analyses were performed. However, it is important to note that our accuracy analysis was a broad CONUSwide analysis and there could be major improvements
Figure 7: Spatial and regional distribution of the NWM’s mean KGE across the CONUS. The map to the left displays the mean model KGE by HUC2 hydrologic regions, with color gradations indicating average KGE ranging from less than -0.4 (red) to greater than 0.8 (blue). Box plots of KGE values for each HUC2 region are displayed on the right side of the figure, showing median, interquartile range, and variability within and across regions. 324 Wetland Science & Practice OCTOBER 2026
to regional locations smaller than the HUC2 regions used in this study. Table 2 displays the delta when the statistics from v2.1 are subtracted from v3.0. The table displays a decrease in NWM v3.0 accuracy by a mean value of -0.0136, while NSE and R2 show improvement. The mean NSE increased significantly by a mean of 0.8631, indicating a notable reduction in outliers. Figure 8 highlights the NSE differences in HUC2 regions, displaying difference values when v2.1 NSE values are subtracted from v3.0. The R2 mean increase is more modest at 0.0176. v3 – v2.1 Gages Statistic
Gage Accuracy Count
NSE
R2
KGE
Minimum
1,191
-0.6090 -59.8930
-0.4530
-9.2400
Median
1,191
-0.0090
0.0120
0.0060
0.0380
Mean
1,191
-0.0136
0.8631
0.0176
0.2121
Std Dev
1,191
0.0675
11.9307
0.1176
2.0550
Maximum
1,191
0.5210 242.2340
0.5830
42.9140
in areas where v2.1 already achieved high accuracy. The intercept of 0.13 further suggests a baseline improvement in v3.0 performance for regions that previously exhibited poor skill.
Table 2: Statistical difference between NWM v3 and v2.1 for individually analyzed gages for accuracy, R2, NSE, and KGE metrics. Figure 9: Plots of individual gage accuracies NWM v2.1 versus v3.0. The black dashed line is the 1:1 reference line. The blue dotted line is the best-fit linear regression line, which summarizes the overall relationship between the accuracies of APT v2.1 and APT v3.0 across all observations.
Conclusion
Figure 8: Accuracy difference of NWM V3-NWM V2.1
The scatter plot in Figure 9 describes the accuracy difference in NWM v2.1 and V3.0. Overall, NWM v3.0 accuracy is positively correlated with v2.1 (R² = 0.602), suggesting moderate agreement between versions. However, the regression line falls below the 1:1 line at higher accuracies and above it at lower accuracies, indicating that NWM v3.0 generally improves accuracy in lower-performing regions but slightly underperforms
Our findings indicate that NWM v3.0 demonstrates regional variability in performance, with higher accuracy and predictive skill observed in the eastern U.S. and parts of the Pacific Northwest. Specifically, HUC 3, 10, 16, and 18 box plots displayed median NWM performance that were within the highest accuracy range of 0.6–0.8. There were some obvious cases of outliers in the dataset that lowered the mean in corresponding regional maps. The model’s performance is notably limited in arid and hydrologically complex regions. This variability underscores the influence of local hydrologic conditions and data availability on model efficacy. Practitioners should exercise caution in these regions when utilizing the NWM in any decisionmaking processes and incorporate multiple sources of hydroclimatic evidence (e.g., USGS stream gages) where other sources are available. Wetland Science & Practice OCTOBER 2026 325
The comparison between NWM v3.0 and its predecessor, v2.1, reveals that while the updated model shows improvements in NSE and R², the overall accuracy displays a decrease of -0.014. This suggests that enhancements in model physics and calibration have not uniformly translated into better performance across all reference gages. While NSE and R² show a more precise statistical measurement at each gage, accuracy is calculated by:
However, NWM v3.0 performance did increase across low-performing stream reaches in the NWM v2.1 analysis. The implications of this study provide valuable insight for federal agencies, such as the USACE and the EPA, which rely on accurate hydrologic data for decision-making in water resource management, regulatory compliance, and environmental protection. By establishing a baseline for NWM v3.0’s accuracy, this research contributes to ongoing efforts to integrate advanced hydrologic modeling into practical applications, ultimately supporting more informed and consistent decision-making within the hydrologic, regulatory, and resource management communities. Future work should focus on refining model calibration, particularly in regions where performance is suboptimal, and exploring the integration of additional data sources to enhance the representation of complex hydrologic processes, such as regional snowmelt. Continued collaboration among research institutions will be essential to advance the capabilities of hydrologic models and improve their utility in managing the nation’s water resources.
Declaration of Originality This is an original work performed through the US Army Engineer Research and Development Center that has not been published before. Images, figures, and information included in the article have been properly cited or originally produced by the authors.
326 Wetland Science & Practice OCTOBER 2026
References Cosgrove, B., D. Gochis, T. Flowers, A. Dugger, F. Ogden, T. Graziano, E. Clark, R. Cabell, N. Casiday, Z. Cui, and K. Eicher. 2024. NOAA’s National Water Model: Advancing operational hydrology through continental-scale modeling. JAWRA Journal of the American Water Resources Association 60: 247-272. https://doi.org/10.1111/1752-1688.13184 Falcone, J. A. 2011. GAGES-II: Geospatial Attributes of Gages for Evaluating Streamflow, Dataset. https://doi. org/10.3133/70046617 Fritz, K. M., T. L. Nadeau, J. E. Kelso, W. S. Beck, R. D. Mazor, R. A. Harrington, and B. J. Topping. 2020. Classifying streamflow duration: The scientific basis and an operational framework for method development. Water 12: 2545. https://doi.org/10.3390/ w12092545 Gochis, D. J., M. Barlage, R. Cabell, M. Casali, A. Dugger, K. FitzGerald, M. McAllister, J. McCreight, A. RafieeiNasab, L. Read, K. Sampson, D. Yates, Y. Zhang. 2020. The WRF-Hydro® modeling system technical description, (Version 5.1.1). NCAR Technical Note. 1. https://ral.ucar.edu/sites/default/files/public/ projects/wrf_hydro/technical-description-user-guide/ wrf-hydro-v5.1.1-technical-description.pdf Gutenson, J. L., K. H. Sparrow, S. W. Brown, M. D. Wahl, and K. B. Gordon. 2024. Case study of continental-scale hydrologic modeling’s ability to predict daily streamflow percentiles for regulatory application. JAWRA Journal of the American Water Resources Association 60: 461-479. https://doi. org/10.1111/1752-1688.13189 Gutenson, J. L., M. L. Follum, K. A. Staebell, E. S. Ondich, and M. D. Wahl. 2025. Analyzing Synthetic Stage-Discharge Rating Curves and Riverine Flood Inundation Maps Derived From Global-Scale Hydrologic and Hydraulic Modeling. Journal of Flood Risk Management 18: e70135. https://doi.org/10.1111/ jfr3.70135 Mayorga, E. 2021. Ulmo: Clean, simple and fast access to public hydrology and climatology data. Journal of Open Source Software 6: 2874.
Nash, J. E. and J.V . Sutcliffe. 1970. River flow forecasting through conceptual models part I — A discussion of principles. Journal of Hydrology 10: 282290. https://doi.org/10.1016/0022-1694(70)90255-6 NOAA (National Oceanic and Atmospheric Administration). 2025. Changes to NCEP Models and Implementation Dates to NOAAPORT. Accessed August 7, 2025. https://www.nco.ncep.noaa.gov/pmb/changes/ Sparrow, K. H., J. L. Gutenson, M. D. Wahl, and K. A. Cotterman. 2022. Evaluation of Climatic and Hydroclimatic Resources to Support the US Army Corps of Engineers Regulatory Program. ERDC/GRL TR22-26. US Army Engineer Research and Development Center. https://dx.doi.org/10.21079/11681/45484 Sparrow, K. H., S. W. Brown, C. E. French, J. L. Gutenson, M. D. Wahl, and K. B. Gordon. 2024. Integrating NOAA’s National Water Model (NWM) Into the Antecedent Precipitation Tool (APT) to Support Clean Water Act Decision-making. US Army Engineer Research and Development Center, Geospatial Research Laboratory. https://dx.doi. org/10.21079/11681/49187 Sparrow, K. H., S. W. Brown, C. E. French, K. B. Gordon, J. L. Gutenson, C. O. Hamilton, and J. C. Deters. 2025. Antecedent Precipitation Tool (APT) Version 3.0: Technical and User Guide. ERDC/TN WRAP-25-9. US Army Engineer Research and Development Center. http://dx.doi. org/10.21079/11681/49835 Timilsina, S. and P. Passalacqua. 2025. A comparative analysis of national water model versions 2.1 and 3.0 reveals advances and challenges in streamflow predictions during storm events. Journal of Hydrology: Regional Studies 58: 102196. https://doi.org/10.1016/j. ejrh.2025.102196 Vepraskas, M. J., J. F. Berkowitz, and C. Arellano. 2019. Determining Normal Precipitation Ranges for Hydric Soil Assessments. Soil Science Society of America Journal 83: 503–510. https://doi.org/10.2136/ sssaj2018.09.0333
Wetland Science & Practice OCTOBER 2026 327
Development and Validation of a Wetland Rapid Assessment Method for Illinois, USA Suneeti K. Jog,1* Matthew M. Finzel2, Rohini Vembar2, and Jason T. Bried3
Abstract Wetland rapid assessment methods occupy an important space between remote geospatial analysis and intensive field surveys of wetland health. Many states have still not adopted or tailored the rapid method, including Illinois. We developed an Illinois wetland rapid assessment method (RAIL) intended for statewide application on all wetland types and for reproducibility by observers of varied experience levels. Surveying 63 wetlands from different community types across Illinois, we evaluated the RAIL for responsiveness against floristic quality metrics, representativeness across major wetland classes, and replicability by different assessors. The RAIL explained 37 percent–52 percent of the variation in floristic quality scores and appeared robust to observer experience levels. However, comparisons of RAIL scores from different wetland types should be made with caution or avoided entirely, consistent with wetland rapid assessment common practice. The proposed RAIL is open to refinement (e.g., limiting metric redundancy) and further validation (e.g., reference sites, other taxa) but already shows promise, and we recommend it for initial wetland quality screening and complementary assessments alongside other tools.
IDNR 1994). Assessing this quality has become urgent, especially with a large percentage of Illinois wetlands now precluded from federal protection (Peterson et al. 2025).
Probably the most common method of estimating wetland quality in Illinois is the floristic quality assessment (FQA) method (Matthews 2003), adopted and applied by environmental survey programs (e.g., Illinois Natural History Survey), consulting firms (e.g., Huff & Huff Inc.), and government agencies of the state (IEPA 2007; IRT 2008). The FQA method was introduced in the 1970s as a means of evaluating natural prairie remnants in the Chicago region (Swink and Wilhelm 1979; Taft et al. 1997) and has since been applied to different regions and ecosystems, especially wetlands (Miller and Wardrop 2006; DeBerry et al. 2015; Magee et al. 2019). The main FQA components are species richness and coefficients of conservatism (C) assigned based on native status, tolerance to contemporary human disturbance, and fidelity to high-quality natural areas (Taft et al. 1997; Spyreas 2019; Zinnen et al. 2025). Species assigned lowest C values tend to tolerate or even thrive with human disturbance while those assigned highest C values are environmentally sensitive and generally Key words: bioassessment, floristic quality, replicability, restricted to remnant natural areas (Zinnen et al. 2025). Floristic quality is commonly indexed using (mean responsiveness, wetland attributes conservatism) or (Floristic Quality Index, FQI) where N is the number of native species observed, Introduction with variants that incorporate non-native species and Approximately 7 million acres, or 90 percent, of abundance weightings (Miller and Wardrop 2006; wetland area in Illinois, USA, has been lost with rapid DeBerry et al. 2015; Kutcher and Forrester 2018; Bried population growth and agricultural intensification and Jog 2022). since the Industrial Revolution (Dahl 1990; Suloway Major challenges for FQA include sampling bias and Hubbell 1994). The quality of remaining Illinois especially related to richness (Matthews et al. 2005; wetlands, from extensive wet meadows and floodplain Miller and Wardrop 2006; DeBerry et al. 2015; forests to scarce high-quality bogs, fens, and seeps, Kutcher and Forrester 2018), potential inadequacy varies widely and is changing rapidly (White 1978; Department of Natural Resources & Environmental Sciences, University of Illinois Urbana-Champaign, Urbana, IL 61801, USA. ORCID (Jog): 0000-0002-5375-8240 Illinois Natural History Survey, Prairie Research Institute, University of Illinos Urbana-Champaign, Champaign, IL 61820, USA. ORCID (Finzel): 0009-0003-09683573 3 Department of Entomology, University of Illinois Urbana-Champaign, Urbana, IL 61801, USA. ORCID (Bried): 0000-0002-8659-9848 *Corresponding author: Suneeti K. Jog, Email: jog@illinois.edu 1 2
328 Wetland Science & Practice OCTOBER 2026
for constructed and managed wetlands (Landi and Chiarucci 2010; DeBerry and Perry 2015), and the need for accurate species identification (Spyreas 2019) at a time when field botany skills are dwindling (Ahrends et al. 2011; Crisci et al. 2020; but see Jog and Bried 2024). Less demanding wetland assessment methods could help with initial screening to avoid more costly investments or complement established tools like FQA. To that end, the so-called rapid assessment methods (RAM) stand out as field-based tools integrating readily observable structural and functional information linked, directly or indirectly, to overall wetland quality and degradation (Hruby et al. 1995; Carletti et al. 2004; Sutula et al. 2006; Fennessy et al. 2007). These methods offer a “middle ground” between coarse, remote landscape-level assessments (Brooks et al. 2004; Tiner 2018, 9–18) and multi-taxa, multimetric biotic assessments (USEPA 2002; Magee et al. 2019). By integrating basic, often qualitative indicators, these tools are relatively fast to implement and accessible to a wider range of skill levels (Carletti et al. 2004; Fennessy et al. 2007; Stein et al. 2009). The Illinois Environmental Protection Agency (IEPA) proposed development of a wetland rapid assessment protocol 20 years ago (IEPA 2007) but those plans never materialized. In this paper, we introduce a wetland RAM for Illinois (RAIL) complete with field form and guidance document for implementation. We used floristic quality metrics ( , FQI) as a benchmark to validate the proposed RAIL, in line with previous studies (e.g., Wardrop et al. 2007; Gallaway et al. 2019a). Specifically, we tested RAIL potential to (i) predict floristic quality, (ii) represent different wetland classes for statewide applicability, and (iii) accommodate end users with varying levels of wetland experience.
Methods Tool Development We reviewed existing RAMs focusing especially on those from Ohio (Mack 2001), Oklahoma (Gallaway et al. 2019a), and California (Stein et al. 2009; Sutula et al. 2006) to capture a variety of regional environmental contexts and methodological styles. From our collective knowledge and experience, and the issues identified
by Fennessy et al. (2007), we selected metrics and scoring weights relevant to major wetland conditions, stressors, and natural processes of Illinois. The exercise resulted in 14 metrics across landscape, substrate, hydrologic, and biotic attribute categories along with a field form and guidance document to support metric scoring (https://doi.org/10.5281/zenodo.21632144). Collectively, these metrics produce a RAIL score ranging from 0 to 100. We then solicited feedback on the draft RAIL and guidance document from wetland scientists and professionals in Illinois. We contacted 20 individuals from federal and state agencies, universities, and nonprofit organizations with expertise in hydrology, hydric soils, aquatic and wetland vegetation, or geospatial information. Of this group, 11 agreed to review the draft RAIL and guidance document for accuracy, efficiency, inclusivity, and simplicity. We asked participants to review all aspects of the tool, especially to confirm whether the RAIL may be understood and implemented by a range of user expertise. We received feedback from six of the participants and incorporated their comments into the final RAIL (Table 1) along with the field form and guidance document (https://doi.org/10.5281/ zenodo.21632144). Attribute Landscape
Substrate
Hydrology
Biotic
Metric (code) Natural Wetland Buffer (L1) Intensity of Surrounding Land Use (L2) Special Wetland Type (L3) Substrate Disturbance (S1) Organic Soils (S2) Microtopography (S3) Hydrological Connectivity (H1) Groundwater (H2) Hydrological Stressors (H3) Native Plant Diversity (B1) Invasive Species (B2) Listed Plant Species Habitat (B3) Horizontal Interspersion (B4) Aquatic Life (B5)
Max score 6 7 10 10 6 10 9 6 10 5 5 4 6 6
Table 1. Proposed wetland rapid assessment method for Illinois (RAIL), ranging up to 100 points total for highest quality sites.
Wetland Science & Practice OCTOBER 2026 329
(https://wetland.inhs.illinois.edu/; Bried and Jog 2022). We queried all wetlands from the database assessed We tested the RAIL against FQAs performed by since 2012 that had location, wetland community type, experienced field botanists with the Illinois Natural and FQA data, resulting in 1,546 potential field-testing History Survey Wetland Science Program. This program sites. Wetlands were classified based on dominant has performed wetland determinations for the Illinois vegetative communities and consolidated into four Department of Transportation since 1987 and maintains categories based on the Cowardin system (Cowardin a database of thousands of wetlands throughout the state et al. 1979; IDNR 1994): inundated wetlands (wetland
Field Validation
Figure 1. Study sites for validation of the Illinois wetland rapid assessment method, including common wetland types and rare (“special”) classes in Illinois. 330 Wetland Science & Practice OCTOBER 2026
ponds), emergent wetlands (marshes, wet meadows, sedge meadows), shrub wetlands (wet shrublands), and forested wetlands (wet floodplain forests, some seepage wetlands). We randomly selected 50 naturally occurring sites (not constructed) in proportion to the availability of these common wetland types and to ensure spatial and hydrologic independence, following Bried and Jog (2022). We added 15 sites from rare (herein, special) wetland classifications in Illinois, including seeps, fens, wet flatwoods, and shrub swamps randomly selected from the total 28 queried. Two sites, both representing common wetland types, were destroyed at the time of field surveys, leaving a total of 63 test sites (48 common, 15 special) scattered across Illinois (Figure 1). Surveys using the RAIL were completed over 11 days in June and July 2023. These were conducted once per site by a primary assessor (author RV, ~5 years of wetland academic training and professional field experience) and an alternate assessor. The alternate assessor rotated among three individuals with varying levels of wetland training and experience: low (< 1 year), intermediate (~5 years), and high (~15 years). Each RAIL survey lasted about 30 minutes on average. The assessment area overlapped the existing wetland delineation and FQA survey areas at each site. During each assessment survey, the primary and alternate assessors independently determined RAIL scores, which were averaged for analysis. To measure responsiveness, we fit simple linear models of and FQI over the RAIL scores for the 48 common sites and all 63 sites pooled (common and special). We additionally tested responsiveness for each of the 14 RAIL metrics individually using all sites. We analyzed representativeness by comparing RAIL, FQI, and score distributions among the common wetland types using box plots and multivariate analysis of variance; multivariate Shapiro-Wilk’s test and Box’s M-test suggested multivariate normality (W = 0.97, p = 0.104) and homogeneity of covariances (M = 17.5, p = 0.488). We analyzed replicability of RAIL scoring based on Spearman rank-association rs between the primary and alternate assessor, repeated for each alternate assessor individually and all three combined (averaged).
Results The individual RAIL metrics showed a wide range of mostly positive pairwise correlations (Figure 2), suggesting varying degrees of redundancy. The highest rank-correlation was found between special wetland type and groundwater (0.83), followed by special wetland type and organic soil (0.77).
B= Biotic communities, H=Hydrology, L=Landscape, S=Substrate
Figure 2. Correlation matrix (Spearman’s rho) relating the 14 wetland rapid assessment metrics, with codes defined in Table 1.
Variation in floristic quality was moderately explained by the RAIL score, suggesting overall responsiveness and predictive ability (Figure 3). The relationships improved slightly with the addition of “special” wetlands (Figure 3a-b) relative to the common wetlands alone (Figure 3c-d). The RAIL metrics that best predicted floristic quality were special wetland type (L3), presence/absence of organic soil (S2), degree of microtopography (S3), and native plant species diversity (B1) (Table 2). Distributions of RAIL scores were broadly similar to floristic quality score distributions across the major wetland types (Figure 4). Those patterns, however, appeared to vary by wetland type, including significant differences in the mean joint response (MANOVA, F9,122 = 3.97, p = 0.0002). This suggests RAIL may lack robustness against natural wetland variation and needs stratified sampling or analysis by wetland type. Wetland Science & Practice OCTOBER 2026 331
Figure 3. Linear model relationships between the Illinois rapid assessment index (RAIL) and floristic quality metrics using all study sites (a-b) and only the “common” subset (c-d).
Figure 4. Distributions of Illinois rapid assessment index (RAIL) and floristic quality scores in the four major wetland community classes. Box plots depict median, interquartile range, 1.5× the interquartile range (whiskers), and outliers (dots). 332 Wetland Science & Practice OCTOBER 2026
RAIL metric
Floristic Quality Index
Mean conservatism
R2
p
R2
p
Landscape1
0.094
0.008
0.136
0.002
Landscape2
0.003
0.279
0.016
0.164
Landscape3
0.201
<0.001
0.210
<0.001
Substrate1
0.066
0.0241
0.081
0.014
Substrate2
0.254
<0.001
0.246
<0.001
Substarte3
0.303
<0.001
0.311
<0.001
Hydrology1
0.128
0.002
0.074
0.017
Hydrology2
0.091
0.009
0.102
0.006
Hydrology3
0.083
0.013
0.050
0.043
Biotic1
0.464
<0.001
0.328
<0.001
Biotic2
0.022
0.128
0.001
0.306
Biotic3
-0.010
0.562
0.025
0.112
Biotic4
0.164
<0.001
0.128
0.002
Biotic5
0.113
0.004
0.081
0.013
Table 2. Linear relationships between each Illinois rapid assessment metric (RAIL, code names correspond to Table 1) and two floristic quality metrics across 63 study sites.
Rank correlation in RAIL scores was strong between the primary assessor and the alternate assessors with low (rs = 0.92, n = 31 sites) and intermediate (0.95, 21 sites) experience levels. Correlation was substantially weaker with the highly experienced alternate (0.64, 11 sites), although sample size was much smaller in this case.
Discussion After the recent Sackett v. EPA court ruling that precludes a large percentage of Illinois wetlands from protection under the Clean Water Act (Peterson et al. 2025), rapid assessments seem more urgent than ever. We developed a wetland RAM for Illinois (RAIL) featuring easily measured biotic and abiotic criteria, complete with supporting documentation (Supplement A1, A2). We evaluated RAIL performance based on its scoring similarity with floristic quality and replicability among assessors of varying skill levels. The RAIL could offer initial screening and could also complement
assessments that target wetland quality remotely or at coarser scales. We focused on RAMs for California (CRAM), Ohio (ORAM), and Oklahoma (OKRAM) since these were the most comprehensive, relevant, recent, or had the least technical issues detailed by Fenessy et al. (2007). The RAIL is most closely aligned with ORAM and CRAM; however, it differs from CRAM mainly in the metric weighting and validation processes. CRAM forces equal weighting across its metric categories by normalizing and then averaging the scores. In addition, CRAM used several different indices and taxa for validation. CRAM is much more field intensive, and takes more effort and time in the field. The RAIL is ORAM-derived but simplified, making it a faster tool, with Illinois-specific substitutions (organic soils, aquatic life, and Illinois specific special wetland type list reflecting the state’s natural divisions—flatwoods, cypress swamp, sand prairie remnants) replacing ORAM’s Ohio-specific narrative/regulatory apparatus and its more granular vegetation community matrix. The OKRAM is restricted to depressional wetlands and uses only nine scoring metrics across three categories. Therefore, the RAIL is easier to use, less field intensive, and not restricted by wetland class or community type. We found moderately strong linear relationships between RAIL and floristic quality, suggesting the RAIL may predict or reflect wetland biological conditions and degradation. Floristic quality is well documented and widely used for signaling wetland quality, in Illinois and beyond (DeBerry et al. 2015; Kutcher and Forrester 2018), making it a reliable benchmark for evaluating RAIL performance. The RAIL explained variation in floristic quality despite having few vegetation-based metrics. This fact combined with metrics capturing landscape, substrate, and hydrologic features suggests RAIL could provide a reliable and broad indicator of wetland environmental conditions across Illinois. Four RAIL metrics—special wetland type, organic soils, microtopography, and native plant diversity— were individually able to capture more than 20 percent of variation in floristic quality. We should note, however, the expected strong correlations observed between special wetland type versus organic soils, Wetland Science & Practice OCTOBER 2026 333
and microtopography versus native plant diversity, suggesting interchangeability. Native plant diversity, qualitatively categorized as “low” (natives absent or monoculture), “moderate,” or “high,” should loosely correlate to native species richness, a key element of the Floristic Quality Index (Taft et al. 1997). Organic soils often indicate peatlands (bogs, fens), a rare wetland class in Illinois generally occurring as high-quality remnants in protected areas and supporting plants with high conservatism values (Nieset 2022). Similarly, distinct microtopography such as the hummocks and tussocks of sedge meadows may facilitate colonization by drier-adapted wetland species (Ervin 2007) and support relatively high floristic quality (Matthews 2003). We did not find consistency in RAIL scoring across wetland types, suggesting that natural variation may influence the index. The pattern mirrored the FQA metrics, and studies have warned of making FQA comparisons among different wetland classes or vegetation communities that vary in natural hydrological regimes, structural complexity, soil chemistry, and other environmental contexts (Matthews 2003; Matthews et al. 2005; DeBerry et al. 2015; Gallaway et al. 2019b). The spread for emergent wetlands, for example, was consistently wide across scoring methods, perhaps reflecting broad natural environmental gradients and occurrences ranging from disturbed roadside ditches to functionally diverse settings that, in part, determine species richness, whereas the spread for other wetland classes appeared narrower. On average the inundated and forested wetlands showed higher quality (both in terms of RAIL and FQA) than the emergent and shrub wetlands, but whether this reflects inherent differences in wetland degradation or scorer biases that lead to under or overvaluation remains unclear (Spyreas 2019). Our analysis recommends comparing RAIL scores within wetland classes and not between classes, consistent with recommendations for other wetland RAMs (Fennessy et al. 2007; Gallaway et al. 2019a). Overall, the RAIL scoring appears robust to differing professional judgements and varying experience levels. The primary assessor’s intermediate-level experience seemed to align with the two alternates 334 Wetland Science & Practice OCTOBER 2026
who had similar or more limited experience. This may reflect shared ranges of knowledge and experience but also distinctive or obvious site features that may have predisposed opinions toward greater similarity, such as high-quality sites with diverse native species, organic soils, and conspicuous groundwater discharge. Correlation was weaker against the highly experienced alternate, suggesting more divergent opinions or thought processes, although we should note the smaller sample size and larger uncertainty in this case. We further acknowledge the uneven sample sizes and geographic coverage among the three alternates, and the absence of replication (i.e., multiple observers) at low, intermediate, and high experience levels. Yet from the combined analysis (Figure 4d) the RAIL appears replicable across different observers, and unlike FQA, which requires specialized expertise, the RAIL accommodates a much wider array of skill levels and contributors. The proposed RAIL is fluid and amenable to further refinement and evaluation, especially since it resulted primarily from the work and input of relatively few people from the same institution. For example, a few metrics appear redundant suggesting potential for removal, and validation testing could extend to functional metrics and to other wetland taxa besides plants (USEPA 2002; Stein et al. 2009). Furthermore, as our validation sample was biased toward disturbed roadway settings, future validations could aim to include more reference sites/settings (Bried et al. 2014; Herlihy et al. 2019) and broader representation of Illinois wetland diversity, such as found in the Illinois Natural Areas Inventory and the Critical Trends Assessment Program (IEPA 2007). Although further development, refinement, and validation of this tool is always encouraged, we hope for its adoption by diverse wetland professionals and programs.
Acknowledgements We are grateful to Raúl Guzmán for help with field surveys and Laura Sass for querying the wetlands database. We also thank the six wetland scientists who participated in the initial RAIL compilation. R. V. was partially supported by funding from the U.S. Geological Survey Midwest Climate Adaptation Science Center, awarded to S. K. J. and J. T. B. All authors were fully
or partially funded by the Illinois Department of Transportation. The contents of this document reflect the view of the authors who are responsible for the facts and the accuracy of the data presented herein. The contents do not necessarily reflect the official views or the policies of the Illinois Department of Transportation.
Declaration of Originality This is an original work that has not been published before. Images, figures, and quotations included in the article have been properly cited and permission has been granted for any that are not those of the author.
Funding Authors S. K. J. and J. T. B. received funding from the U.S. Geological Survey’s Midwest Climate Adaptation Science Center, which was used to support R. V. for one year as a graduate research assistant.
Competing Interests The authors have no relevant financial or non-financial interests to disclose.
Author Contributions All authors contributed to the study conception and design. R. V., M. M. F., and S. K. J. conducted fieldwork. R. V. and M. M. F analyzed the data and prepared the initial manuscript. J. T. B. and S. K. J. revised and rewrote the manuscript.
Data Availability The datasets generated and/or analyzed during the study as well as Supplements A1 and A2 are available from the corresponding author on reasonable request.
References Ahrends, A., C. Rahbek, M. T. Bulling, N. D. Burgess, P. J. Platts, J. C. Lovett, V. W. Kindemba, N. Owen, A. N. Sallu, A. R. Marshall, B. E. Mhoro, E. Fanning, and R. Marchant. 2011. Conservation and the botanist effect. Biological Conservation 144(1): 131–140. https://doi.org/10.1016/j.biocon.2010.08.008
Bried, J. T. and S. K. Jog. 2022. Nonnative Species Limitation of Floristic Quality Scores in Wetland Mitigation Performance and Multimetric Health assessment. Wetlands 42(1): 3. https://doi.org/10.1007/ s13157-021-01523-5 Bried, J. T., S. K. Jog, A. R. Dzialowski, and C. A. Davis. 2014. Potential Vegetation Criteria for Identifying Reference-Quality Wetlands in the SouthCentral United States. Wetlands 34(6): 1159–1169. https://doi.org/10.1007/s13157-014-0575-5 Brooks, R. P., D. H. Wardrop, and J. A. Bishop. 2004. Assessing Wetland Condition on a Watershed Basis in the Mid-Atlantic Region Using Synoptic Land-Cover Maps. Environmental Monitoring and Assessment 94(1): 9–22. https://doi.org/10.1023/ B:EMAS.0000016876.63062.3d Carletti, A., G. A. D. Leo, and I. Ferrari. 2004. A critical review of representative wetland rapid assessment methods in North America. Aquatic Conservation: Marine and Freshwater Ecosystems 14(S1): S103– S113. https://doi.org/10.1002/aqc.654 Cowardin, L. M., V. Carter, F. C. Golet, and E. T. LaRoe. 1979. Classification of Wetlands and Deepwater Habitats of the United States. FWS/OBS-79/31. U.S. Department of the Interior, Fish and Wildlife Service, Washington, DC. FWS/OBS-79/31 Crisci, J. V., L. Katinas, M. J. Apodaca, and P. C. Hoch. 2020. The End of Botany. Trends in Plant Science 25(12): 1173–1176. https://doi.org/10.1016/j. tplants.2020.09.012 Dahl, T. E. 1990. Wetlands Losses in the United States, 1780’s to 1980’s. U.S. Department of the Interior, Fish and Wildlife Service. DeBerry, D. A. and J. E. Perry. 2015. Using the floristic quality concept to assess created and natural wetlands: Ecological and management implications. Ecological Indicators 53: 247–257. https://doi.org/10.1016/j. ecolind.2015.02.003 DeBerry, D. A., S. J. Chamberlain, and J. W. Matthews. 2015. Trends in Floristic Quality Assessment for wetland evaluation. Wetland Science & Practice 32(2): 12–22. https://doi.org/10.1672/UCRT083-281 Wetland Science & Practice OCTOBER 2026 335
Ervin, G. N. 2007. An experimental study on the facilitative effects of tussock structure among wetland plants. Wetlands 27: 620–630. https://doi. org/10.1672/0277-5212(2007)27[620:AESOTF]2.0. CO;2 Fennessy, M. S., A. D. Jacobs, and M. E. Kentula. 2007. An evaluation of rapid methods for assessing the ecological condition of wetlands. Wetlands 27: 543–560. https://doi.org/10.1672/02775212(2007)27[543:AEORMF]2.0.CO;2 Gallaway, S., C. Davis, D. Dvorett, and B. Tramell. 2019a. Validation of the Oklahoma Rapid Assessment Method (OKRAM) in Depressional Wetlands Using EPA’s Three-Tiered Framework. Wetlands 40(5): 925–937. https://doi.org/10.1007/s13157-019-01238-8 Gallaway, S., C. Davis, D. Dvorett, and B. Tramell. 2019b. Evaluating the effectiveness of Floristic Quality Assessment as a tool for determining the condition of depressional wetlands across ecoregions. Ecological Indicators 102: 488–496. https://doi.org/10.1016/j. ecolind.2019.02.021 Herlihy, A. T., M. E. Kentula, T. K. Magee, G. A. Lomnicky, A. M. Nahlik, and G. Serenbetz. 2019. Striving for consistency in the National Wetland Condition Assessment: developing a reference condition approach for assessing wetlands at a continental scale. Environmental Monitoring and Assessment 191(1): 327. https://doi.org/10.1007/s10661-019-7325-3 Hruby, T., W. E. Cesanek, and K. E. Miller. 1995. Estimating relative wetland values for regional planning. Wetlands 15(2): 93–107. https://doi. org/10.1007/BF03160663 IDNR (Illinois Department of Natural Resources). 1994. The Changing Illinois Environment: Critical Trends. Technical Report of the Critical Trends Assessment Project, Volume 3: Ecological Resources. IEPA (Illinois Environmental Protection Agency). 2007. Wetland Monitoring and Assessment Program for the State of Illinois. ILEPA/BOW/07-020. Illinois Environmental Protection Agency, Bureau of Water, Surface Water Section and Watershed Management Section. ILEPA/BOW/07-020. 336 Wetland Science & Practice OCTOBER 2026
IRT (Interagency Review Team). 2008. Interagency Coordination Agreement on Mitigation Banking Within the Regulatory Boundaries of Chicago District. Chicago District of the U.S. Army Corps of Engineers, U.S. Environmental Protection Agency, and U.S. Fish and Wildlife Service. Jog, S. K. and J. T. Bried. 2024. The “full species list” fallacy in Floristic Quality Assessment. Ecosphere 15(11): e70062. https://doi.org/10.1002/ecs2.70062 Kutcher, T. E., and G. E. Forrester. 2018. Evaluating how variants of floristic quality assessment indicate wetland condition. Journal of Environmental Management 217: 231–239. https://doi.org/10.1016/j. jenvman.2018.03.093 Landi, S. and A. Chiarucci. 2010. Is floristic quality assessment reliable in human-managed ecosystems? Systematics and Biodiversity 8(2): 269–280. https://doi. org/10.1080/14772001003770307 Mack, J. J. 2001. Ohio Rapid Assessment Method for Wetlands v. 5.0, User’s Manual and Scoring Forms. Ohio EPA Technical Report WET/2001-1. Ohio Environmental Protection Agency, Division of Surface Water, 401/Wetland Ecology Unit. Magee, T. K., K. A. Blocksom, and M. S. Fennessy. 2019. A national-scale vegetation multimetric index (VMMI) as an indicator of wetland condition across the conterminous United States. Environmental Monitoring and Assessment 191(Suppl 1): 322. https://doi. org/10.1007/s10661-019-7324-4 Matthews, J. W. 2003. Assessment of the Floristic Quality Index for use in Illinois, USA, wetlands. Natural Areas Journal 23(1): 53–60. Matthews, J. W., P. A. Tessene, S. M. Wiesbrook, and B. W. Zercher. 2005. Effect of area and isolation on species richness and indices of Floristic Quality in Illinois, USA wetlands. Wetlands 25(3): 607–615. https://doi. org/10.1672/0277-5212(2005)025[0607:EOAAIO]2.0. CO;2 Miller, S. J. and D. H. Wardrop. 2006. Adapting the floristic quality assessment index to indicate anthropogenic disturbance in central Pennsylvania
wetlands. Ecological Indicators 6(2): 313–326. https:// doi.org/10.1016/j.ecolind.2005.03.012
Tiner, and P. Adamus. Academic Press. https://doi. org/10.1016/B978-0-12-805091-0.00016-5
Nieset, J. E. 2022. Volo Bog State Natural Area (Ingleside, Illinois, United States) – exemplar of bog succession. Wetland Science & Practice 40(2): 157– 161.
USEPA (United States Environmental Protection Agency). 2002. Methods for Evaluating Wetland Condition: Developing Metrics and Indexes of Biological Integrity. EPA-822-R-02-016. Office of Water, U.S. Environmental Protection Agency, Washington, DC.
Peterson, C. M., J. E. Nieset, J. L. Monson, G. E. Pociask, B. W. Wilm, P. B. Marcum, and J. W. Matthews. 2025. A national policy with local consequences: Quantifying the downstream effects of Sackett on Illinois wetlands and communities. Journal of Environmental Management 392: 126931. https://doi. org/10.1016/j.jenvman.2025.126931 Spyreas, G. 2019. Floristic Quality Assessment: a critique, a defense, and a primer. Ecosphere 10(8): e02825. https://doi.org/10.1002/ecs2.2825 Stein, E. D., A. E. Fetscher, R. P. Clark, A. Wiskind, J. L. Grenier, M. Sutula, J. N. Collins, and C. Grosso. 2009. Validation of a wetland Rapid Assessment Method: Use of EPA’s level 1-2-3 framework for method testing and refinement. Wetlands 29(2): 648– 665. https://doi.org/10.1672/07-239.1
Wardrop, D. H., M. E. Kentula, D. L. Stevens, S. F. Jensen, and R. P. Brooks. 2007. Assessment of wetland condition: An example from the Upper Juniata watershed in Pennsylvania, USA. Wetlands 27(3): 416–431. https://doi.org/10.1672/02775212(2007)27[416:AOWCAE]2.0.CO;2 White, J. 1978. Illinois Natural Areas Inventory Technical Report. Vol. I: Survey Methods and Results. Illinois Natural Areas Inventory. Zinnen, J., G. Spyreas, S. K. Jog, J. T. Bried, and J. W. Matthews. 2025. What is ecological conservatism? A template analysis of its definitions. Natural Areas Journal 45(2): 96–104. https://doi.org/10.3375/21624399-45.2.5
Suloway, L. B. and M. E. Hubbell. 1994. Wetland resources of Illinois: an analysis and atlas. Illinois Natural History Survey Special Publication No. 15. https://hdl.handle.net/2142/111680 Sutula, M. A., E. D. Stein, J. N. Collins, A. E. Fetscher, and R. Clark. 2006. A practical guide for the development of a wetland assessment method: The California experience. Journal of the American Water Resources Association 42(1): 157–175. https://doi. org/10.1111/j.1752-1688.2006.tb03831.x Swink, F. and G. Wilhelm. 1979. Plants of the Chicago Region. 3rd ed. The Morton Arboretum, Lisle, IL. Taft, J. B., G. S. Wilhelm, D. M. Ladd, and L. A. Masters. 1997. Floristic quality assessment for vegetation in Illinois: A method for assessing vegetation integrity. Erigenia 15: 1–24. Tiner, R. W. 2018. Introduction to landscape-level wetland assessment. In Wetland and Stream Rapid Assessments, edited by J. Dorney, R. Savage, R. W. Wetland Science & Practice OCTOBER 2026 337
Opinion Paper: Reassessing Artificial Floating Wetlands: Overemphasis on Bioremediation with an Understudied Potential for Biodiversity and Habitat Enhancement Ashwin Rajesh Gupta1
Summary 1. Nutrient bioremediation potential of artificial floating wetlands (AFW) is frequently overstated with significant nutrient reduction requiring very high AFW area relative to the waterbody (e.g., >48% AFW coverage for N), which can become ecologically disruptive and logistically impractical. 2. However, AFWs, even at small scales (1-30m2), provide high-value nursery, feeding, and breeding habitats as well as ecological connectivity that outweigh their negligible impact on nutrient bioremediation in situ. 3. Design recommendations for future AFWs should utilize varied plant species, morphologies, and properties to maximize niche availability. This is in contrast to AFWs traditionally employing a few species only, mostly from the order Poales.
Introduction Artificial floating wetlands (AFWs) are constructed floating rafts or platforms planted with vegetation and deployed on waterbodies. The plants’ roots remain submerged in the water while their shoots grow above the surface. In literature, AFWs are also known as artificial floating islands, floating treatment wetlands, and other terms (Bi et al. 2019; Yeh et al. 2015). They are primarily constructed as a nature-based solution for bioremediation of waterbodies, targeting a wide range of pollutants and nutrients. The bioremediation of water occurs through direct nutrient uptake by plants (phytoremediation), but also through associated microbial biofilms on the plant’s roots or submerged parts of the AFW, i.e., substrate immobilizing and degrading pollutants and nutrients (microbial
bioremediation). In fact, microbial action typically accounts for a significantly greater proportion of bioremediation compared to the plants (Wu et al. 2006). Their ecosystem services extend well beyond bioremediation. AFWs also deliver significant biodiversity and habitat enhancement benefits (Karstens et al. 2022). The vegetation attracts a wide range of fauna, including birds, amphibians, mollusks, and fish, to the shoots and roots for feeding, shelter, and breeding. Moreover, the structures increase habitat heterogeneity in the waterbody, further supporting biodiversity. AFWs can also function as "stepping stones" for wildlife, such as fish, thereby improving habitat connectivity (Calheiros et al. 2020, 2023; Huang et al. 2017; Karstens et al. 2021, 2022). They are particularly advantageous because they require no additional land; they operate in situ directly on the water surface. This makes them especially valuable in densely populated urban megacities, where available land is scarce.
Research Trends and Imbalance The use of AFWs has grown steadily in recent years, as evidenced by an upward trend in publications between 2006 and 2019 (Colares et al. 2020). However, the majority of studies focus heavily on bioremediation while largely overlooking biodiversity benefits. Many publications also tend to overstate the realistic in situ bioremediation potential of AFWs, particularly for nutrient removal. Most designs continue to prioritize water quality improvement, treating other ecosystem services as secondary. Thus, this paper presents three key perspectives:
1 Department of Earth and Environmental Sciences, The Chinese University of Hong Kong, Shatin, Hong Kong SAR, China. Correspondence: ashwinrgupta@ cuhk.edu.hk, ashwinrgupta10@gmail.com, https://orcid.org/0009-0009-5713-5487.
338 Wetland Science & Practice OCTOBER 2026
a) Although bioremediation and biodiversity benefits are not directly comparable, there is a clear overemphasis on phytoremediation in AFW studies and reviews, with wildlife and habitat enhancement often being an afterthought. b) The contribution of bioremediation in situ is frequently overstated, especially for nutrients. c) AFWs should be designed primarily to enhance biodiversity and habitat value rather than maximize bioremediation. This overemphasis is evident in literature. A search in the Web of Science Core Collection for review articles on AFWs using search operators ("artificial floating wetland*" OR "artificial floating island*" OR "floating treatment wetland*" OR "floating wetland*" OR "floating constructed wetland*") initially returned 45 results. After excluding papers unrelated to floating systems, only 19 relevant reviews remained. In nearly all of them, biodiversity was mentioned only briefly, if at all usually in one or two sentences, and only two papers dedicated a small section to the topic. Targeted keyword searches further illustrated the imbalance: in the Web of Science Core Collection (no date restriction, limited to all document types), through smart search with two parallel queries: 1) A phyto/bioremediation query ("artificial floating wetlands" OR "floating treatment wetlands" OR "artificial floating islands") AND ("nutrient removal" OR phytoremediation OR bioremediation OR "pollutant removal" OR "water quality" OR eutrophication), and a 2) biodiversity/habitat-focused query: ("artificial floating wetlands" OR "floating treatment wetlands" OR "artificial floating islands") AND (biodiversity OR habitat OR wildlife OR fauna OR "ecological services" OR "species richness" OR "stepping stones" OR connectivity). This yielded 316 and 47 hits, respectively. Although these figures represent raw search results without full paper screening, the roughly seven-fold difference highlights how heavily research has focused on bioremediation at the expense of biodiversity and habitat enhancement. This discrepancy may partly arise from terminology. The terms AFWs and "floating treatment wetlands" originated in the bioremediation literature. In contrast,
studies focusing on biodiversity often use terminology such as "floating rafts," "nest platforms," or "floating islands," which largely return research on bird nesting (Brenner and Mondok 1979; Burgess & Hirons 1992; Desorbo et al. 2007; Manikowska–Ślepowrońska et al. 2022). However, they are both distinct from one another, as AFWs have the presence of plants with roots growing into the water column. This is what, in the view of the author, defines an AFW and sets it apart from basic floating structures used for biodiversity support.
Limitations of Bioremediation The true value of AFWs lies more in biodiversity enhancement than in bioremediation, especially at small scales. In a field study by Karstens et al. (2021) in the Darss-Zingst Bodden Chain (surface area 197 square kilometers, mean depth ~2 meters [m] [Schumann et al. 2006]), two AFWs with a combined area of 7 m2 were installed. After three months of growth, the harvested aboveground biomass averaged ~0.25 kilograms dry weight m-2, yielding maximum nutrient removal via plant uptake of approximately 0.25 grams (g) phosphorous (P) m-2 and 5.08 g nitrogen (N) m-2 (highest in Lythrum salicaria and Iris pseudacorus, respectively; Table 3 in Karstens et al. 2021). For the entire 7 m2 installation, this equates to a total of roughly 1.75 g P and 35.56 g N removed through biomass harvest, in a period of five months (April installation, September harvest, but peak vegetation growth is JuneJuly). Such low removal rates by phytoremediation alone are typical even in mesocosm studies (e.g., Tanner & Headley 2011). Besides phytoremediation nutrient removal, the periphyton and root associated biofilm also remove significantly higher N, up to 2-20 times more (Butler-Viruet et al. 2025). The study found that 29 g N and 37 g N were removed via denitrification while 15 g N and 1.7 g N, respectively, were removed through plant N assimilation during the summer 2019 and spring 2021. Putting this information into perspective for the Karstens et al. (2021) study, microbial processes could remove 71.12 g N - 711.2 g N. Yet the overall contribution to nutrient reduction remains negligible relative to the scale of the ~394 million m3 lagoon. To achieve meaningful nutrient reduction, a significant portion of the waterbody would have to be covered, Wetland Science & Practice OCTOBER 2026 339
e.g., ~18% coverage for P, >48% coverage for N (Abi Hanna et al. 2024; Winston et al. 2013). Impracticality, and cost aside, it would still be very ecologically disruptive, as many species, including water birds such as great cormorants (Phalacrocorax carbo) and ducks (Anatidae), as well as light-dependent aquatic plants, rely on unobstructed open water.
Biodiversity and Habitat Benefits Nevertheless, even at a small scale, there are strong local biodiversity benefits. In the Karstens et al. (2021) study, the 7 m2 installations attracted a diverse assemblage of species, including grey herons (Ardea cinerea), juvenile European eels (Anguilla anguilla, a critically endangered species recorded at densities of ~2.1 individuals m-2), frogs, and various invertebrates. Complementary studies support evidence for habitat functions: Huang et al. (2017) reported three-fold higher nekton abundance around AFWs compared with controls, highlighting their value as fish-aggregating devices, especially for juvenile fish taking refuge in the roots. AFWs also commonly serve as spawning and nursery habitat, with eggs and/or larvae of frogs, snails, and other aquatic invertebrates frequently observed on or beneath the structures (Calheiros et al. 2023). Floating platforms have likewise been used successfully as breeding sites for various waterbirds, such as black terns (Chlidonias niger), common loons (Gavia immer), and several terns and gulls (Laridae) (Babcock and Booth 2020; Desorbo et al. 2007; Van der Winden et al. 1996).
Design Recommendations When designing AFWs, priority should be given to maximizing biodiversity rather than selecting plants solely for their phytoremediation performance. Many studies rely on a narrow range of fast-growing species, such as Cyperus, Juncus, Phragmites, Lolium, and Typha, all belonging to the order Poales (Kilian & Pawęska 2025). Instead, a more diverse mix of plants with varied morphologies, growth forms, and with zoophilous flowers should be used. Differences in plant height, leaf shape, and structure are known to create a wider variety of niches, thereby supporting greater biodiversity.
340 Wetland Science & Practice OCTOBER 2026
In addition, species with complementary functional traits should be included—for example, plants with staggered flowering times to support pollinators throughout the season, grain-producing species to attract granivorous birds, and varying levels of palatability that can sustain different insect communities. In our own work, a combination of Bacopa monnieri (low-growing, sprawling, flowering), Schoenoplectus subulatus (tall growing), Colocasia esculenta (taro, broad-leaved, flowering, and attractive to caterpillars), and Oryza sativa (rice, grain-producing) successfully generated greater structural heterogeneity. Further possibilities can be to incorporate plant species that differ from the dominant vegetation surrounding the waterbody, yet are still native. For example, many coastal wetlands in places such as the Darss-ZingstBodden-Chain are dominated by dense monocultures of Phragmites australis. Using a set of plants on the AFW that are morphologically different can increase the heterogeneity and species richness of the local area. Further simple structural enhancements, such as adding brushwood piles, can also boost complexity by providing perching sites, shelter, and additional food sources for insects and birds.
Conclusion While AFWs can contribute to nutrient mitigation, their bioremediation potential is frequently overstated and remains limited when done in situ. The scales required for significant nutrient bioremediation would be unrealistic and hamper other ecosystem services. The real benefits are the enhancement of biodiversity and habitat complexity which AFWs can offer even at small scales. This paper suggests that AFW research and design should shift from a primary focus on phytoremediation to one centered on biodiversity and habitat enhancement.
Acknowledgements I thank Professor Alex Tat-Shing Chow for all his advice, help and corrections during the writing of this paper. This work was supported by the Environment and Conservation Fund (grant number ECF 2023-151).
Declaration of Originality This is an original work that has not been published before. Inclusion of results from previously published studies are appropriately credited.
Funding This work was supported by the Environment and Conservation Fund (grant number ECF 2023-151); Project Title: Environment and Conservation Fund Designing Smart Floating Wetlands to Optimize Ecosystem Services for Hong Kong Urban Environment. Any opinions, findings, conclusions or recommendations expressed in this material do not necessarily reflect the views of the Government of the Hong Kong Special Administrative Region and the Environment and Conservation Fund. The project funding was awarded to Professor Alex Tat-Shing Chow, team leader of the ATOM Research Group.
Competing Interests The author has no relevant financial or non-financial interests to disclose.
Author Contributions The study conception and design, opinions, information gathering, interpretation and drafts were written by ARG.
Data Availability No new datasets were generated during the current study.
References Abi Hanna, R., K. E. Borne, Y. Andrès, and C. Gerente. 2024. Effect of floating treatment wetland coverage ratio and operating parameters on nitrogen removal: Toward design optimization. Water Science and Technology 89(6), 1466–1481. https://doi.org/10.2166/ wst.2024.064 Babcock, M. and V. Booth. 2020. Tern Conservation Best Practice. Habitat Creation and Restoration. Bi, R., C. Zhou, Y. Jia, S. Wang, P. Li, E. S. Reichwaldt, and W. Liu. 2019. Giving waterbodies the treatment
they need: A critical review of the application of constructed floating wetlands. Journal of Environmental Management 238, 484–498. https://doi.org/10.1016/j. jenvman.2019.02.064 Brenner, F. J., and J. J. Mondok. 1979. Waterfowl Nesting Rafts Designed for Fluctuating Water Levels. The Journal of Wildlife Management, 43(4), 979–982. https://doi.org/10.2307/3808287 Burgess, N. D., and G. J. M. Hirons. 1992. Creation and management of artificial nesting sites for wetland birds. Journal of Environmental Management, 34(4), 285– 295. https://doi.org/10.1016/S0301-4797(11)80004-6 Butler-Viruet, I. C., J. M. Testa, and L. A. Harris. 2025. Floating Wetlands beyond Retention Ponds: Estimating Nitrogen Cycling and Removal in Tidal Waters. Journal of Ecological Engineering Design 2(1). https://doi. org/10.70793/jeed.14 Calheiros, C. S. C., J. Carecho, M. P. Tomasino, C. M. R. Almeida., and A. P. Mucha. 2020. Floating Wetland Islands Implementation and Biodiversity Assessment in a Port Marina. Water 12(11), Article 11. https://doi. org/10.3390/w12113273 Calheiros, C. S. C., M. Ilarri, and S. I. A. Pereira. 2023. Biodiversity Associated to Floating Wetland Islands. In Proceedings of the 5th International Symposium on Water Resource and Environmental Management, edited by H. Xu. Springer Nature Switzerland. https:// doi.org/10.1007/978-3-031-31289-2_13 Colares, G. S., N. Dell’Osbel, P. G. Wiesel, G. A. Oliveira, P. H. Z. Lemos, F. P. da Silva, C. A. Lutterbeck, L. T. Kist, and Ê. L. Machado. 2020. Floating treatment wetlands: A review and bibliometric analysis. Science of The Total Environment 714, 136776. https://doi.org/10.1016/j.scitotenv.2020.136776 Desorbo, C. R., K. M. Taylor, D. E. Kramar, J. Fair, John H. Cooley, Jr., D.C. Evers, W. Hanson, H. S. Vogel, and J. L. Atwood. 2007. Reproductive Advantages for Common Loons Using Rafts. The Journal of Wildlife Management 71(4), 1206–1213. Huang, X., F. Zhao, C. Song, Y. Gao, Z. Geng, and P. Zhuang. 2017. Effects of stereoscopic artificial floating wetlands on nekton abundance and biomass in the Wetland Science & Practice OCTOBER 2026 341
Yangtze Estuary. Chemosphere 183, 510–518. https:// doi.org/10.1016/j.chemosphere.2017.05.091 Karstens, S., M. Dorow, R. Bochert, N. Stybel, G. Schernewski, and M. Mühl. 2022. Stepping Stones Along Urban Coastlines—Improving Habitat Connectivity for Aquatic Fauna with Constructed Floating Wetlands. Wetlands 42(7), 76. https://doi. org/10.1007/s13157-022-01598-8 Karstens, S., M. Langer, H. Nyunoya, I. Čaraitė, N. Stybel, A. Razinkovas-Baziukas, and R. Bochert. 2021. Constructed floating wetlands made of natural materials as habitats in eutrophicated coastal lagoons in the Southern Baltic Sea. Journal of Coastal Conservation 25(4), 44. https://doi.org/10.1007/s11852-021-00826-3 Kilian, S., and K. Pawęska. 2025. Floating Treatment Wetlands: A Review of Design, Performance, and Application for Sustainable Water and Wastewater Management. SUSTAINABILITY 17(24). https://doi. org/10.3390/su172411327 Manikowska–Ślepowrońska, B., K. Ślepowroński, and D. Jakubas. 2022. The use of artificial floating nest platforms as conservation measure for the common tern Sterna hirundo: A case study in the RAMSAR site Druzno Lake in Northern Poland. The European Zoological Journal 89(1), 229–240. https://doi.org/10.1 080/24750263.2022.2038709 Schumann, R., H. Baudler, Ä. Glass, K. Dümcke, and U. Karsten. 2006. Long-term observations on salinity dynamics in a tideless shallow coastal lagoon of the Southern Baltic Sea coast and their biological relevance. Journal of Marine Systems 60(3), 330–344. https://doi. org/10.1016/j.jmarsys.2006.02.007 Tanner, C. C., and T. R. Headley. 2011. Components of floating emergent macrophyte treatment wetlands influencing removal of stormwater pollutants. Ecological Engineering 37(3), 474–486. https://doi. org/10.1016/j.ecoleng.2010.12.012 Van der Winden, J., W. Hagemeijer, and R. Terlouw. 1996. Heeft de Zwarte Stern Chlidonias niger een toekomst als broedvogel in Nederland? Limosa 69(4), 149–164.
342 Wetland Science & Practice OCTOBER 2026
Winston, R. J., W. F. Hunt, S. G. Kennedy, L. S. Merriman, J. Chandler, and D. Brown. 2013. Evaluation of floating treatment wetlands as retrofits to existing stormwater retention ponds. Ecological Engineering 54, 254–265. https://doi.org/10.1016/j.ecoleng.2013.01.023 Wu, Q.-T., T. Gao, S. Zeng, and H. Chua. 2006. Plantbiofilm oxidation ditch for in situ treatment of polluted waters. Ecological Engineering, 28, 124–130. https:// doi.org/10.1016/j.ecoleng.2006.05.006 Yeh, G., P. Yeh, and Y.-H. Chang. 2015. Artificial floating islands for environmental improvement. Renewable and Sustainable Energy Reviews, 47. https:// doi.org/10.1016/j.rser.2015.03.090
NOTES FROM THE FIELD In this issue, we visit the Green Swamp (cover photo). Located in southeastern North Carolina (Brunswick County), much of the swamp consists of pine flatwoods that receive water and nutrients from precipitation. The sandy soils and low nutrient inputs create an infertile wetland that is home to many insectivorous plants including pitcher plants, sundews, and the out-of-this world Venus flytrap. The Green Swamp also is home to many flowering plants, including rare orchids and lilies. The swamp is a Nature Conservancy Preserve and I highly recommend a visit to it. Enjoy the scenery. (Photos: Chris Craft, except Anna Craft where noted)
Yellow pitcher plant (Sarracenia flava)
Purple pitcher plant (S. purpurea)
Wetland Science & Practice OCTOBER 2026 343
Sundews (Drosera rotundifolia)
Yellow fringed orchid (Platanthera ciliaris) (Photo: Anna Craft) 344 Wetland Science & Practice OCTOBER 2026
Barbara’s button (Marshallia graminifolia) (Photo: Anna Craft)
Venus flytrap (Dionea muscipula)
And the flower
Orange milkwort (Polygala lutea) Wetland Science & Practice OCTOBER 2026 345
Meadow beauty (Rhexia virginica)
Until next time... 346 Wetland Science & Practice OCTOBER 2026
WETLANDS IN THE NEWS Listed below are some links to news articles that may be of interest. Links from past issues can be accessed on the SWS website news page (Wetlands in the News - Society of Wetland Scientists). This section includes links to mostly newspaper, magazine, and news articles. Members are encouraged to send links to articles about wetlands in their local area. Please send the links to the WSP Editor at chrstphrcrft@gmail.com and reference “Wetlands in the News” in the subject box. Thanks for your support. • It’s larger than New York State and contains more than 30 billion tonnes of carbon – equivalent to 3 years of global fossil fuel emissions | Discover Wildlife • Between LA And San Diego Is California’s Underrated Nature Preserve With Wetland Trails And Birdwatching Islands • Scientists discover new frog in the Amazon’s flooded forests | Discover Wildlife • Migratory bird species increasingly at risk, report finds, but there is still hope - Mongabay News • Florida’s wetlands are quietly losing native species to an air-breathing, mud-burrowing invader most residents have never heard of and that can walk on land to reach new waters - The Pulse • In North Carolina, a race is on to restore critical peatland before it dries up or is destroyed - MyNorthwest.com • Singkil peat swamp: The embattled orangutan capital of the world - Mongabay News • Peatland Fires Darken Skies in Indonesia - NASA • For 70 years, Texas’ Bahia Grande was dry; then 2006 brought the tides back to 10,000 acres and wildlife returned in numbers | World News - The Times of India • More than 10 million dead trees are standing like tombstones along America’s Atlantic coast — scientists mapped vast “ghost forests” where seawater is creeping inland and turning living woodland into salt marsh Science Blog • Mangroves fringing Mexico’s Gulf of California yield about $15,200 an acre each year in fish and crab landings alone, and the government valued the same ground at $410 - The Pulse Powered by Ecoportal • ‘Fifty years of work’: Hawaiian stilt brought back from the brink - Oceanographic • Groups press DENR to suspend mangrove earth-balling Inquirer.net • Teal Flat wetland provides a glimpse of a carp-free future for Australia’s waterways - ABC News • Construction Underway on Elk River Estuary Restoration Project, Kickstarting a Big Wetlands Fix - Lost Coast Outpost • A Sumatran villager lost ground to the sea. So he planted mangroves - Mongabay News • Louisiana’s Scenic Wetlands Gem Between Lafayette And The Texas Border Has Nature Walks, Boating, And Wildlife - Islands • Near Rockford Is Illinois’ Nature Preserve With Scenic Wetlands, A Peaceful Trail, And Wildlife - Islands
• Central California wetland dried out after staffing cuts, sending winter birds elsewhere - Yahoo • Two years of drought leave Everglades parched, taking toll on wildlife and tourism - CBS Miami • The Invasive Plants Taking Over US Lakes - WorldAtlas • The ecosystems that store more carbon than you think Predirections • Lithuania to Dig Trenches and Restore Wetlands Along Borders With Russia and Belarus- Militarnyi • Restoring the Western Lake Erie Basin | Audubon • On fragile Sumatran peatland, a farmer fights to bring back lost mangroves - Mongabay News • How Tulare Lake Came Back From The Dead In 2023 WorldAtlas • Resilient seagrass offers hope for restoring damaged ecosystems - Oceanographic • Drained by humans, rewetted by beavers – opposing forces shape boreal wetlands | University of Eastern Finland • The world’s mangrove forests are bouncing back. That’s good news for our coasts and climate - The Conversation • In 2023, a helicopter flew 90 miniature forest islands into a Washington swamp, testing whether 450 living plants could defeat invasive grass - The Times of India • South Kingstown pond to be treated for invasive plant wpri.com • A fertile landscape at the crossroads of ecology and development [Commentary] • USDA Ends Swampbuster Confusion, USDA Settles Decades of Uncertainty Over Swampbuster Wetland Determinations - dtnpf.com • A small New Hampshire city is building tunnels just for salamanders. They›re already saving lives GoodGoodGood.co • An ancient 130-acre California salt marsh was filled, drained and turned into an airfield; a century later, crews removed 230,000 cubic yards of soil to let the tides return | World News - The Times of India • How planet’s ‘blue forests’, mangroves, protect coastlines, support wildlife and store up to four times more carbon than tropical rainforests | The Times of India • Boggy beauty: White-fringed bog-orchid - Adirondack Almanack • A Blueprint for Saving Salt Marshes | Audubon • Diamondback terrapins cause halt on Route 6 bridge construction | Wareham Wetland Science & Practice OCTOBER 2026 347
• Visitors witness unusual bird feeding frenzy at Pea Island | Island Free Press • Industrial development is fragmenting Canada’s boreal forest. Governments should think carefully about future approvals • Big Trouble from Little Wetlands - EOS.org • Tourism and infrastructure threaten habitat of India›s Himalayan salamanders • Faster: Mediterranean seagrass survives in dim seabed light by expanding its photosynthetic antenna and trapping energy faster, a discovery that may help improve future crops - The Times of India
348 Wetland Science & Practice OCTOBER 2026
• Beavers flourish in tidal habitats in the Pacific Northwest, study finds • International Mangrove Day 2026 - X • A Tide-Fueled Trove of Biodiversity in Guinea-Bissau NASA Science • Japan’s abandoned rice fields are being restored into yearround wetlands to replenish groundwater and bring back frogs, dragonflies and endangered aquatic wildlife - The Times of India
WETLANDS BOOKSHELF Please help us add new books and government wetland reports to this listing. If your agency, organization, or institution has published new publications on wetlands, please send the information to the Editor of Wetland Science & Practice. Your cooperation is appreciated. BOOKS • The Atchafalaya River Basin: History and Ecology of an American Wetland • Bayou D’Arbonne Swamp: A Naturalist’s Memoir of Place • Bayou-Diversity: Nature and People in the Louisiana Bayou Country • Black Swan Lake – Life of a Wetland • Coastal Wetlands of the World: Geology, Ecology, Distribution and Applications • Constructed Wetlands and Sustainable Development • Creating and Restoring Wetlands: From Theory to Practice • Eager: The Surprising Secret Life of Beavers and Why They Matter • Fenland Nature • Florida’s Wetlands • The Ghosts of Iraqi Marshes, A Conflict of History, Tragedy and Restoration • History of Wetland Science: A Perspective from Wetland Leaders • An Introduction to the Aquatic Insects of North America (5th Edition) • Mid-Atlantic Freshwater Wetlands: Science, Management, Policy, and Practice
• Remote Sensing of Wetlands: Applications and Advances • Salt Marsh Secrets. Who uncovered them and how? • Sedges of Maine • Sedges and Rushes of Minnesota • Tidal Wetlands Primer: An Introduction to their Ecology, Natural History, Status and Conservation • Tussock Sedge: A Wetland Superplant • Wading Right In: Discovering the Nature of Wetlands • Waubesa Wetlands: New Look at an Old Gem • Wetland Indicators – A Guide to Wetland Formation, Identification, Delineation, Classification, and Mapping • Wetland Landscape Characterization: Practical Tools, Methods, and Approaches for Landscape Ecology • Wetlands (6th Edition) • Wetland Restoration: A Handbook for New Zealand Freshwater Systems • Wetland Soils: Genesis, Hydrology, Landscapes, and Classification • Wetland & Stream Rapid Assessments: Development, Validation, and Application • Wetland Techniques (3 volumes) • Wildflowers and Other Plants of Iowa Wetlands
Wetland Science & Practice OCTOBER 2026 349
WSP XXXXXXXXXXXXXXX SUBMISSION GUIDELINES
ABOUT WETLAND SCIENCE AND PRACTICE (WSP)
Wetland Science and Practice (WSP) is the quarterly electronic publication aimed at providing information on select SWS activities (technical committee summaries, chapter workshop overviews/abstracts, and SWS student activities), articles of ongoing or recently completed wetland research, restoration, or management projects, freelance articles on the ecology and natural history of wetlands, and highlights of current events. The July issue typically is dedicated to publishing the proceedings of our annual conference. WSP also serves as an outlet for commentaries, perspectives, and opinions on important developments in wetland science, theory, management, and policy. Both invited and unsolicited manuscripts are reviewed by the WSP editor for suitability for publication. When deemed necessary or upon request, some articles are subject to scientific peer review. We welcome submission of student papers, including research in progress. Please see publication guidelines below. Electronic access to all WSP issues is included in your SWS membership. All issues published, except the most recent issue, are available to the public on the SWS website. The most recent issue is available 30 days (1 month) after publication. WSP is an excellent choice to convey the results of your projects or interest in wetlands to others. Also note the WSP will publish advertisements. Check the page after the President’s message of any issue for instructions.
How You Can Help If you read something you like in WSP, or that you think someone else would find interesting, be sure to share. Share links to your Facebook, X, Instagram, and LinkedIn accounts. Make sure that all of your SWS colleagues are checking out our most recent issues, and help spread the work about SWS to nonmembers! Questions? Contact editor Christopher Craft (chrstphrcrft@gmail.com).
WETLAND SCIENCE & PRACTICE MANUSCRIPT – GENERAL GUIDELINES FOR AUTHOR AND ARTICLES Author Ethics and Declaration:
The work is original and has not been published elsewhere. Data reported in submission must be author’s own and/or data that the author has permission to use. Inclusion of results from previously published studies must be appropriately credited. It is vital that all contributing authors review the initial submission and subsequent versions. Upon submission of the final manuscript, the lead author must submit a declaration stating that all contributing authors have reviewed and approve the final manuscript. Failure to do this will lead to rejection of the manuscript. Also please include a statement of originality in the article after the Acknowledgements and before the References section. Such statement should be something like this: Declaration of Originality This is an original work that has not been published before. Images, figures, and quotations included in the article have been properly cited and permission has been granted for any that are not those of the author.
350 Wetland Science & Practice OCTOBER 2026
Length:
Approximately 5,000 words; can be longer if necessary.
Style:
See existing articles from 2014 to more recent years available online at: https://sws.org/page/wsp-archives. Standard format/ outline for articles: Title, authors (include affiliations and correspondence author email in footnotes), followed by Abstract, then Text (e.g., Introduction, Methods, Results, Discussion, and Conclusion), and ending with References. All articles must have an abstract. Keywords are optional.
Text:
Word document, 12 font, Times New Roman, single-spaced. For reference citations in text, use this format: (Smith 2016; Jones and Whithead 2014; Peterson et al. 2010). Do not perform formatting (e.g., capitalization of headings and subheadings). For example, do not indent paragraphs…just separate paragraphs by lines.
Figures:
Please include color images and photos of subject wetland(s) as WSP is a full-color e-publication. Image size should be less than 1MB; 500KB may work best for this e-publication. Figures should be original (not published elsewhere) or in the public domain. If the figure was published elsewhere (copyrighted), it is the responsibility of the author to secure permission for use. Be sure to provide proper credit in the caption.
Reference Citation Examples: • Clements, F. E. 1916. Plant Succession: An Analysis of the Development of Vegetation. Carnegie Institution of Washington. Publication 242. • Colburn, E. A. 2004. Vernal Pools: Natural History and Conservation. McDonald & Woodward Publishing Company. • Cole, C. A. and R. P. Brooks. 2000. Patterns of wetland hydrology in the Ridge and Valley Province, Pennsylvania, USA. Wetlands 20: 438-447. https://doi.org/10.1672/02775212(2000)020<0438:POWHIT>2.0.CO;2 • Cook, E. R., R. Seager, M. A. Cane, and D. W. Stahle. 2007. North American drought: reconstructions, causes, and consequences. Earth-Science Reviews 81: 93-134. https:// doi.org/10.1016/j.earscirev.2006.12.002Get rights and content • Cooper, D. J . and D. M. Merritt. 2012. Assessing the water needs of riparian and wetland vegetation in the western United States. U.S.D.A., Forest Service, Rocky Mountain Research Station, Ft. Collins, CO. Gen. Tech. Rep. RMRSGTR-282. • van der Valk, A. 2023. The beginnings of wetland science in Britain: Agnes Arber and William H. Pearsall. Wetland Science and Practice 41(1): 10-18. https://doi.org/10.1672/ ucrt083-01 Please be sure to add the doi link to citations where possible. If you have questions, please contact the editor, Christopher Craft, at chrstphrcrft@gmail.com.
Wetland Science & Practice OCTOBER 2026 350