
27 minute read
Benefits Model


B e n e f i t s Mo d e l
> T a b l e o f C o n t e n t s

Benefits Model
Purpose
• The objective of the benefits model is to support the realization of SNOMED International’s vision that “By 2025 clinical terminologies will be used globally, which will result in better health and improved patient outcomes, supported by one language of health”.
• The benefits model will produce potential benefits estimates for a current SNOMED CT license holder or a prospective license holder.
The model will be:
• Limited to clinical information systems1 and interoperability solutions2 but will not include health data & analytics platforms. • Evidence based, using over 50 studies (see Appendix 4 here) that demonstrate both qualitative and quantitative patient service outcome and patient health outcome benefits from using SNOMED CT within a specific healthcare entity (e.g. healthcare network, healthcare organization) or at a national level. • Generalizable, so that it provides directional estimates of select benefits supported by SNOMED CT. • Flexible, and will generate potential benefit estimates for a given country or a sub-national entity, and • Structured, so some benefits will be measured in financial terms (e.g. dollars/euros saved) and other benefits will be measured in non-financial terms (e.g. deaths avoided).
Benefits Model
Data on the Impacts of Interoperable, Clinical Information Systems
• Data Required for Developing a Benefits Model • In order to develop an analytical benefits model, quantitative data linking SNOMED CT to patient service outcome and/or patient health outcome benefits is required.
• Limitations in Data Quantifying the Benefits of SNOMED CT • There are several studies available that describe the benefits of SNOMED CT in qualitative or descriptive terms. • However, rigorous3 studies that quantified SNOMED CT’s direct contribution to patient outcomes were not available.
• Data Availability • In contrast, several studies were identified that attempt to estimate both the patient service outcome and patient health outcome benefits from clinical information system and interoperability solution adoption for either a healthcare entity or a country. • Most studies that report quantified benefits linked to clinical information systems and interoperability solutions are not comprehensive. They most often focus on benefits that would accrue within specific care settings. (e.g. oncology, primary care, radiology, etc.). • However, there are a few reports that provide a (near) robust, quantification of the benefits of clinical information system and interoperability solution adoption.
Benefits Model
The Modelling Approach
• The modelling approach uses quantifiable patient outcome benefits through the adoption of clinical information systems and interoperability solutions; benefits that SNOMED CT contributes to but is not exclusively responsible for producing.
• The rationale for using clinical information system and interoperability solution benefits is: • The research did not identify any studies that quantified the patient outcomes benefits directly caused by, or explicitly linked to SNOMED CT. In contrast, quantitative data is available on the broad benefits of clinical information systems and interoperability solutions (e.g. RAND Corporation).
• Clinical information system and interoperability solution benefits can be used to assess the SNOMED CT benefits since: a) SNOMED CT (and/or other clinical terminologies) must be embedded in clinical information systems and interoperability solutions for these systems to be effective4 , a) Clinical information systems and interoperability solutions provide significant quantifiable patient outcome benefits.
• SNOMED CT is embedded in approximately 72%5 of the clinical information systems deployments globally
• SNOMED CT is an important enabler to achieving a broad set of benefits that lead health organizations to invest heavily in clinical information systems and interoperability solutions.
4. SNOMED CT plays an essential role in healthcare ‘transactions’: facilitating the capture, use and sharing of clinical information to providers at the point of care. SNOMED CT also enables effective clinical information management to support analytics and research. 5. "U.S. Hospital EMR Market Share 2020" report by KLAS Research for 5,457 US acute care hospitals and Source: "Global Non-U.S. Acute Care EMR Market Share 2020 report" by KLAS Research for 6,798 Global hospital customer base, April 2020.
Using the Most Comprehensive Data Sources Benefits Model
• For the SNOMED CT benefits model, “Can Electronic Medical Record Systems Transform Health Care? Potential Health Benefits, Savings, and Costs”6 from the RAND Corporation has been leveraged as the anchor study.
• The RAND model and data are in the public domain, including a detailed data and modelling methodology available for general analysis and use.
• RAND provides a relatively comprehensive and robust estimation of potential patient service outcomes in the form of productivity gains from clinical information systems and interoperability solutions. RAND also provides patient health outcomes impacts, in the form of lower morbidity and mortality for select diseases and from improved patient safety.
• The RAND analysis is limited to the United States for an country-wide clinical information system and interoperability solution adoption based on the 2005 U.S health care spend of $2.024 trillion (i.e. 16% of the 2005 GDP).
• The data assembled by RAND7 and the modelling framework has been adapted so that our model can provide directional or indicative benefit estimates for certain types of benefit streams at a national or sub-national health entity, and for any level of clinical information system and interoperability solution adoption.
6. Girosi et al, “Extrapolating Evidence of Health Information Technology Savings and Costs”, RAND Corp. 2005. (See Extrapolating Evidence of Health Information Technology Savings and Costs | RAND). Also see associated companion studies, from RAND Corporation. 7. The majority of evidence was collected from the peer-reviewed literature. The primary search of the peer-reviewed literature was limited to articles published in the years 1995 through 2004. In total, 1,418 articles were screened using the short form, and 202 articles were coded according to taxonomies, yielding 581 preliminary findings, of which 42 were ultimately included in the models.
Limitations of the RAND Study Benefits Model
• The RAND study has certain limitations that were considered and addressed:
1. The study was not intended to be an estimate of savings measured against the total rates of adoption, but rather against the level of adoption relative to a 2004 baseline.
2. It measures the potential impact of widespread adoption of health IT assuming the occurrence of “appropriate changes in health care” rather than the likely impact. This limitation deliberately does not consider present-day payment incentives that would constrain the effective utilization of health IT, even if the technology was widely adopted.
3. In several specific parts of the RAND analysis, the savings that would accrue from the widespread adoption of health IT appear to be overstated8 .
• Each of RAND’s9 model framework/methodology was modified and enhanced.
• The clinical information system benefits estimation study developed by McKinsey and Company was leveraged to pressure test the reasonability of the patient outcomes benefits generated by our adapted, enhanced and refreshed Model 1.
8. The U.S. Congressional Budget Office indicated that the RAND analysis was based on empirical studies from the literature that found positive effects for the implementation of health IT systems; it excluded the studies, even those published in peer reviewed journals, that failed to find favorable results. This biases the estimate of the actual impact of health IT on spending. 9. The majority of evidence was collected from the peer-reviewed literature. The primary search of the peer-reviewed literature was limited to articles published in the years 1995 through 2004. In total, 1,418 articles were screened using the short form, and 202 articles were coded according to taxonomies, yielding 581 preliminary findings, of which 42 were ultimately included in the models.
Research
Management Analytics Data Entry and Integration
SNOMED CT –embedded Clinical Information Systems, Health Data & Analytics Platforms and Interoperability Solutions
Population Analytics
Clinical Information Sharing
Point-of-Care Analytics The red-shaded domains represent the RAND-modelled healthcare ‘transaction’ capabilities enabled by clinical information systems and interoperability solutions, used in in-patient and out-patient care settings.
The RAND Model consists of three sub-models:
1. Productivity Gains -the patient service outcome benefits from efficiency gains associated with the adoption of clinical information systems in both inpatient and outpatient settings.
2. Disease Prevention Benefits -the patient service outcome and patient health outcome benefits from disease prevention improvements resulting from select vaccination and screening protocols.
3. Quality of Care Benefits -select patient service outcome and patient health outcome benefits from the decision support capabilities in a clinical information system that improves patient safety.
The Structure of the SNOMED CT Benefits Model Benefits Model
• The three SNOMED CT benefits sub-models (i.e. productivity gains, disease prevention benefits and quality of care benefits) are each structured as follows: 1. The Model Purpose – Identification of the type of patient service and health benefits estimated by the model.
2. The Model Inputs – Country or health entity specific information required to generate the above-mentioned benefits.
3. The Model Calculation Engine – Outline of the approach, data manipulation, and assumptions made to estimate the benefits.
4. The Model Outputs – Summary of financial savings, beneficial patient service and health outcomes, and corresponding GNI benefits to a country’s economy.
• Further information about the calculation methodology, assumptions and approaches used in the Benefits Model is detailed in a separate 46 page Technical Document.
Benefits Model
1. Model 1 Purpose:
• The model enables a user to estimate the potential multi-year total patient service outcomes benefits associated with deploying a SNOMED CTembedded, integrated, clinical information system.
• SNOMED CT is an important enabler of the integrated, clinical information system benefits.
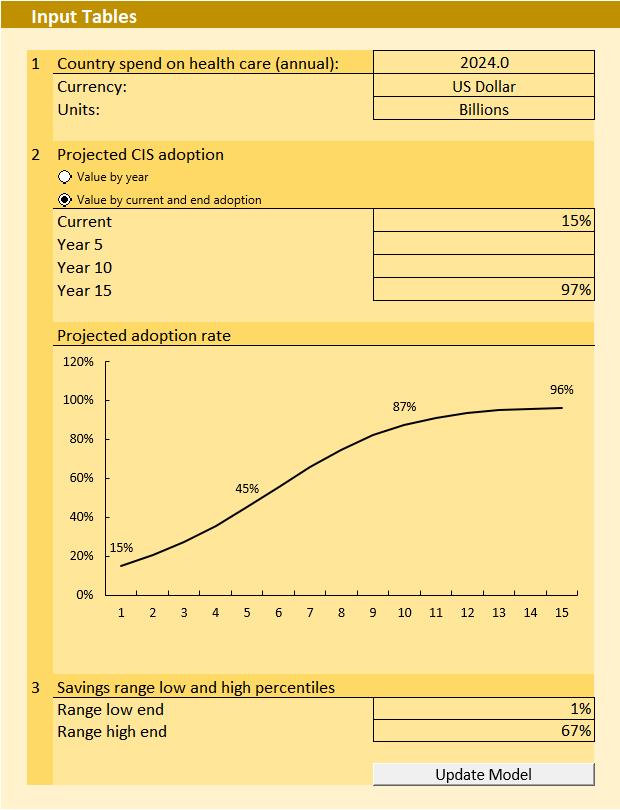
2. Model 1 Inputs:
• A User inputs the subject country’s or health entity’s current annual healthcare system spend in the local currency, plus the expected level of clinical information system adoption over time (5, 10 and 15 years).
Benefits Model
3. Model 1 Calculation Engine:
• Leverages RAND data and a modified analytical framework to create a multi-year clinical information system adoption curve and the estimated potential patient service outcome benefits that could accrue to a country or a health entity over time.
• Converts the RAND estimated patient service outcome benefits from subject activities into a series of independent factors eliminating the need for a user to normalize for currency, GDP, population, per capita income, or other unique national characteristics.
Benefits Model
4. Model 1 Outputs:
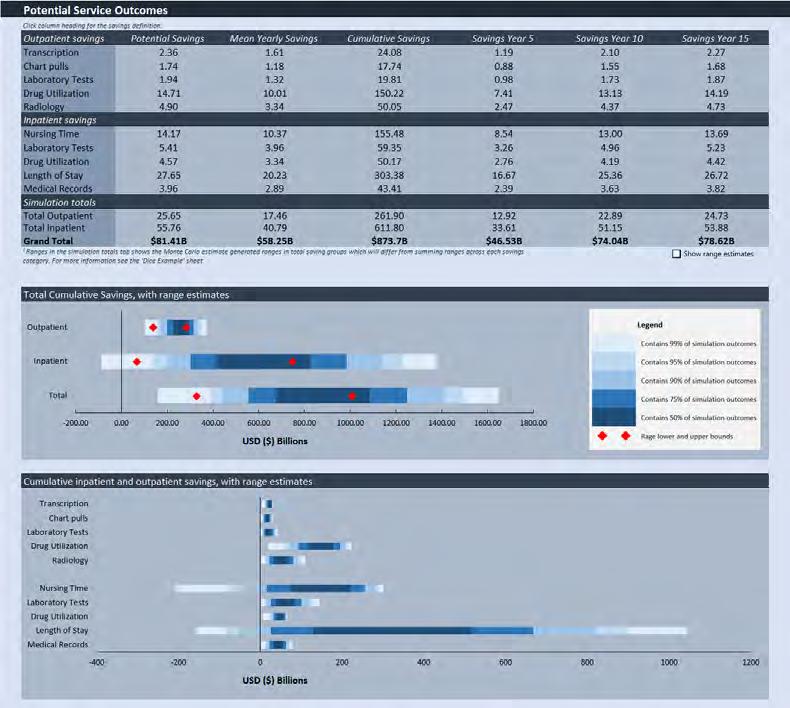
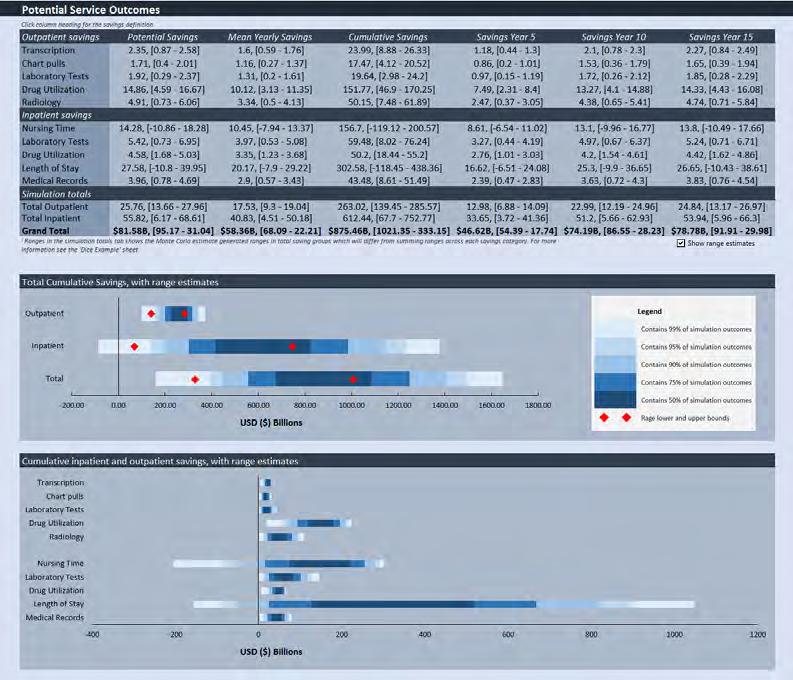
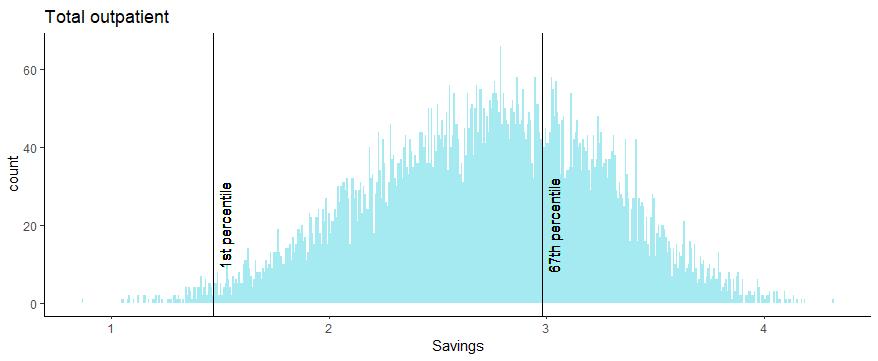
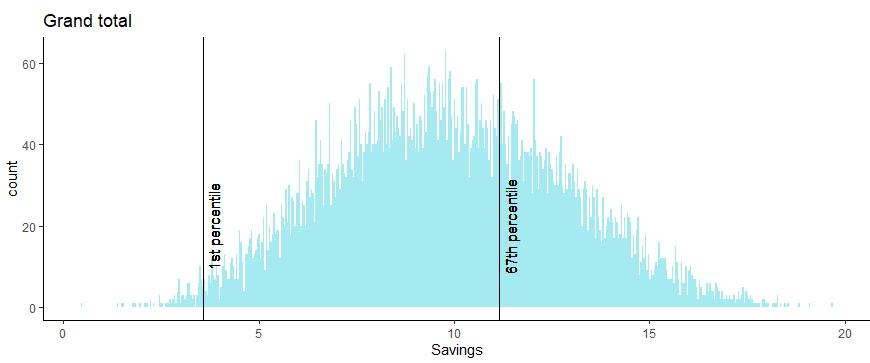
• Provides a range of both the estimated potential annual mean and potential cumulative patient service outcome benefits in the country’s local currency.
• The distribution of benefits are estimated for the reduction in administrative and other health system costs for both Inpatient (i.e. nurse shortage, lab tests, drug utilization, length of stay and medical records savings) and Outpatient services (i.e. transcription, chart pulls, lab and radiology tests, and drug utilization savings).
• Results are expected to be generalizable (e.g. across nations).
• Results should be considered directional/indicative of potential benefits.
Benefits Model
Model 1: Addressing Key Limitations of the RAND Study
• The RAND study has certain limitations that we have addressed in our modelling approach to enhance the reliability of the benefits estimates generated by our models. Key limitations and their proposed solutions are as follows:
• Limitation 1 – The RAND model was not intended to be an estimate of benefits measured against the total rates of adoption, but rather against the level of adoption relative to a 2004 baseline. • Solution 1 – Our Model 1 has been modified to provides the total gross annual benefits of the adoption rate at 5-, 10- and 15-years.
• Limitation 2 – The RAND model was based solely on empirical studies from the literature that found positive effects for the implementation of clinical information systems and interoperability solutions; it excluded studies, even those published in peerreviewed journals, that failed to find favorable results.
• Solution 2 – We have addressed this bias by: • Introducing estimates/data from other studies (ignored or unavailable to RAND) that show lower, zero or negative benefits, and by allowing the possibility that our estimates will have zero and negative benefits. • Leveraging Monte Carlo simulations to generate a range of patient benefits outcomes (from the 1st to 67th percentile) retaining low probability downside scenarios and discarding the top third of the upside scenarios.
Benefits Model
Model 1: Validate the Reasonability of the Benefits Estimates
▪ We used the clinical information system benefit estimation study developed by McKinsey and Company for Canada Health Infoway, in 2015, to test the outputs of our Model 1.
▪ The RAND study defines clinical information systems as: 1. Electronic Medical Record (EMR) including current and historical patient information.
2. Central Data Repository (CDR), which stores the EMR information.
3. Information technology–enabled functions such as Computerized Provider Order Entry (CPOE), which facilitates orders tied to patient information and treatment pathways.
4. Clinical Decision Support (CDS), which provides reminders and best-practice guidance for treatment.
▪ The McKinsey study defines clinical information systems as:
1. EMR, EHR, inpatient CPOE (i.e. hCPOE), and
2. Digital health solutions (e.g. e-visits, e-booking, e-views, e-referral, e-ICU, RFID, bar-coding etc.).
Benefits Model
Model 1: McKinsey’s Study Methodology and Benefits
1. Solutions were defined based predominantly on literature review.
2. Specific modes of action (a function of the technology, or the mechanism of how it impacts the provision of healthcare: e.g. CPOE helps to reduce test spend) were attributed to each solution based on literature review.
3. Modes of action were mapped to health care settings based on literature review and available quantifiable and reliable evidence.
4. Three different care settings were defined for the model: Hospital and
Mental Healthcare; Primary Care & Community and Social Care.
5. An evidence scan was completed for each solution through a literature review and research process.
6. For every benefit, a baseline reference of the Canadian healthcare costs was used to determine spending.
7. The benefit ranges were applied to the Canadian healthcare costs to determine total gross annual benefits for all technologies.
Savings from Computerized Information Systems for Canada’s National Healthcare System at Target Adoption & Maturity Levels per McKinsey Study1
Empowered Patients Annual Gross Savings Range ($B) Target Adoption & Maturity
e-Visits e-Booking e-Views Remote patient care Virtual video calls
Chromic disease management
Sub Total Seamless Services
e-Referral EMR EHR e-Prescribing hCPOE eICU Teleophthalmology Telepathology
Sub Total Informed Care
Patient Flow Management
Transparency of clinician performance
Sub Total Economic Prosperity
Bar-coding RFID
Vaccine Inventory Management
Sub Total Total
1.26 1.44
0.10 0.10
0.40 0.90 0.40 1.18
0.19
2.85
0.33
3.45
0.35 0.26 0.74 0.61 0.69 0.26 0.01 0.04
2.96
0.36 0.59 1.09 1.34 0.78 0.45 0.01 0.04
4.66
0.67
0.56
1.23
0.47 0.13
0.02 1.17
0.72
1.89
0.87 0.26
0.03 80% 90% 80% 90%
90%
75% 100% 100% 95% 100% 60% 75% 90%
90%
90%
90% 90%
90%
Model 1: Mapping Between RAND and McKinsey Benefits Model
RAND Categories Annual Gross Savings Range ($B) (2) McKinsey Categories Annual Gross Savings Range ($B)(3)
Outpatient - Transcription
0.10 - 0.21 - 0.26 EMR and EHR Outpatient - Chart pulls 0.09 - 0.21 - 0.26 EMR and EHR Outpatient - Laboratory tests 0.09 - 0.25 - 0.34 EMR and EHR Outpatient - Drug utilization 0.73 - 1.57 - 1.95 e-Prescribing Outpatient - Radiology
Outpatient - Subtotal
Inpatient - Nurse time 0.15 - 0.52 - 0.76 EHR
1.16 - 2.76 - 3.57
(1.05) - 0.84 - 1.75 EMR and EHR
Inpatient - Laboratory tests 0.19 - 0.63 - 0.93 EMR and EHR
Inpatient - Drug utilization
Inpatient - Reduction in Length of Stay 0.26 - 0.49 - 0.57 hCPOE, vaccine inventory management, bar-coding 0.49 - 4.73 - 7.25 Chronic disease management, patient flow management, transparency of clinician performance 1.00 - 1.68
0.61 - 1.34
1.18 - 1.68
1.43 - 2.22
Inpatient - Medical records
Inpatient - Subtotal Total Total Inpatient Total Outpatient Grand Total
0.16 - 0.42 - 0.56 EMR and EHR
0.05 - 7.11 - 11.06 1.21 - 9.87 - 14.63 1.82 - 2.76 - 3.20 2.42 - 7.10 - 9.80 5.05 - 9.87 - 12.59 4.22 - 6.92
▪ Benefits excluded in mapping $3.5 -4.2B.
▪ Functionalities and corresponding benefits that do not map from the
McKinsey to the RAND study are: • e-visits ($1.26 –1.44B), • e-booking ($0.10B), • e-views ($0.40B), • remote patient care ($0.90 -1.18B), • e-referral ($0.35 -0.36B), • e-ICU ($0.26 –0.45B) • teleophthalmology ($0.01B), • telepathology ($0.04B), • RFID ($0.13-0.26B).
Model 1: Mapping the Benefits to the McKinsey Study Benefits Model
▪ The RAND study had minimal line of sight into the new generation of digital health solutions (e.g. e-visits, e-booking, e-views, e-referral, e-ICU, RFID, bar-coding etc.) in 2005.
▪ The savings from these capabilities were not incorporated into the RAND study and are therefore not captured in our
Model 1.
▪ Given that the McKinsey study took place in 2015, it was able to estimate savings from the new generation of digital health solutions (e.g. e-visits, e-booking, e-views, e-referral, e-ICU, RFID, bar-coding etc.).
Placeholder for bridging slide
Benefits Model
Model 1: Comparison of Model 1 and McKinsey Results
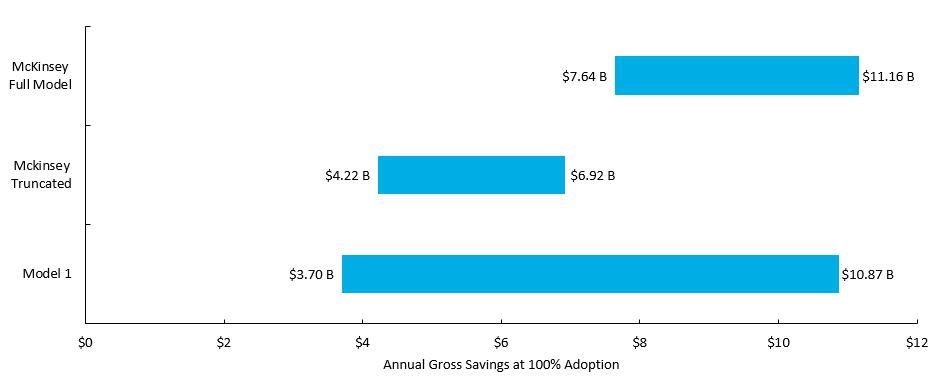
▪ When Model 1 is run with the same parameters as the McKinsey model (i.e. 2015 Canadian national healthcare expenditure of $214B)the results are generally consistent.
▪ The greater dispersion of Model 1 is by design to allow for a broader range of outcomes across nations and healthcare entities.
Model 1: Benefit Estimates with ACI5 Benefits Model
• Each model run generates 10k simulations of the benefits for annual inpatient, outpatient and total savings at 100% adoption.
• An asymmetric confidence interval of the 1st to 67th percentiles was selected from the Monte Carlo simulations in order to retain low probability downside scenarios and discard the top third of the lower probability upside scenarios.

Benefits Model
1. Model 2 Purpose:
• The model enables a user to estimate the potential patient service outcomes and patient health outcome benefits from five disease prevention opportunities associated with deploying an integrated clinical information system, specifically vaccination and screening protocols.
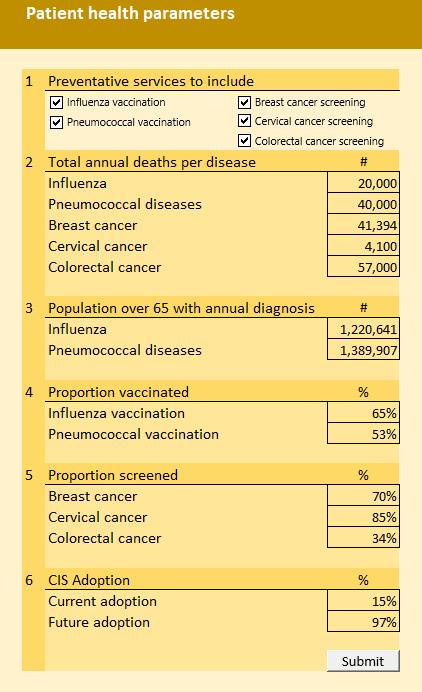
2. Model 2 Inputs:
• The User inputs the non-compliant subject population across five preventive health services protocols, including: 1. influenza vaccination, 2. pneumococcal vaccination, 3. screening for breast cancer, 4. screening for cervical cancer, 5. screening for colorectal cancer.
Note: the RAND study also included benefit estimates for a number of chronic diseases (e.g. diabetes, COPD and Congestive Heart Failure), however their calculation method is not easily generalizable across multiple countries, so was not included in this study
Benefits Model
3. Model 2 Calculation Engine:
• The model estimates the potential patient outcome benefits of moving from noncompliance to compliance for the target population (e.g. in the case of the influenza vaccination the non-compliant population age 65+).
• The potential patient service outcome and patient health outcome benefits of increased compliance are calculated based on the RAND methodology.
• Increased use of clinical information systems and interoperability solutions is modelled as the driver for increased compliance with the disease prevention protocols.
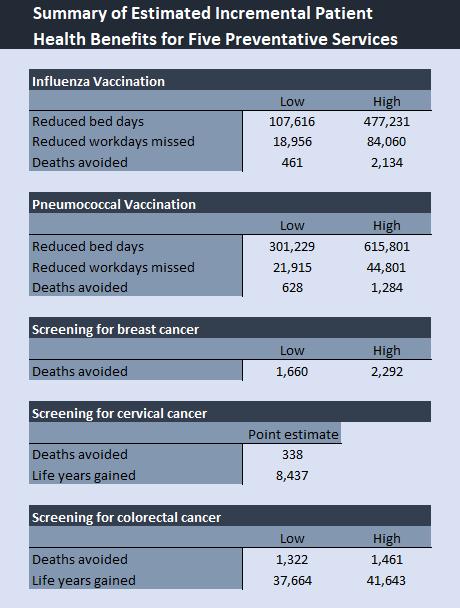
4. Model 2 Outputs:
• Provides potential patient service outcome benefits (i.e. reduction in workdays missed and reduction in bed days) and patient health outcome benefits (i.e. deaths avoided, and life-years gained) from improving compliance to the protocols across five diseases.
• Results are expected to be generalizable (e.g. across nations).
Benefits Model
Model 2: Addressing Key Limitations1 of the RAND Study
• The RAND study has certain limitations that we have addressed in our modelling approach to enhance the reliability of the benefits estimates generated by our models. Key limitations and their proposed solutions are as follows:
• Limitation 1 - The RAND study assumes 100% compliance by the affected groups to clinical information system supported reminders for influenza and pneumococcal vaccination as well as breast, cervical and colorectal cancer screening. This is not a sensible or realistic assumption as there are several reasons why patients would not take the vaccination or get screened despite automated electronic reminders (e.g. anti-vaxxers, travel cost from remote locations, apathy etc.)
• Solution 1 – Our Model 2 assumes a 25.3% increase in the screening and vaccination compliance from the start rate, in response to clinical information system supported reminders. The model also includes a ceiling on the upper end of the vaccination and screening compliance at 95%. We arrived at a 25.3% growth rate by using a meta-analysis which averaged over 42 studies.
• Limitation 2 – The RAND report calculates the efficacy of screening and vaccinations using data from 2005 and prior.
• Solution 2 – We’ve refreshed these estimates with recent sources where possible and used the recent sources to generate statistical ranges at a 95% confidence interval. This refresh of data sources resulted in more conservative efficacy rates than the ones used by RAND.
Benefits Model
1. Model 3 Purpose:
• The model enables a user to estimate the potential patient service outcome and patient health outcome benefits from the deployment and adoption of integrated and
Computerized Provider Order Entry (CPOE) functionality in both inpatient and outpatient settings.
• Increased safety results largely from the alerts and reminders generated by CPOE systems for medications. Such systems provide immediate information to physicians (e.g. warning about a potential adverse reaction with the patient’s other drugs).
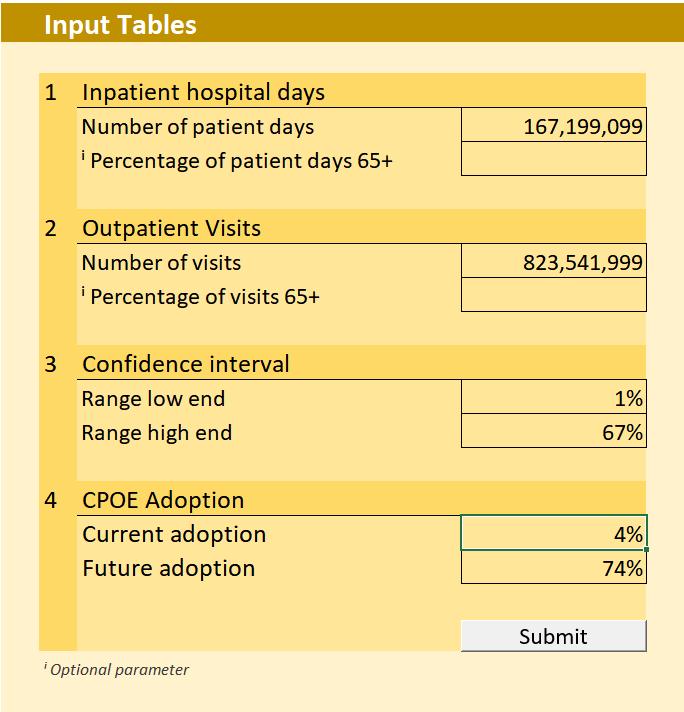
2. Model 3 Inputs:
• The User inputs the total annual number of national or entity inpatient patient days, outpatient patient visits, the desired confidence interval, and the CPOE adoption levels.
Benefits Model
3. Model 3 Calculation Engine:
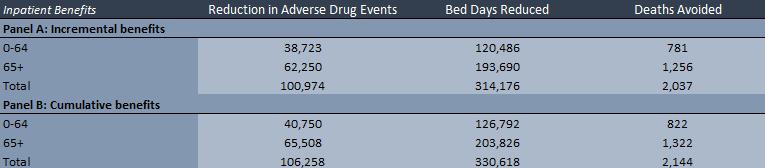
• The model estimates the potential patient service outcome and patient health outcome benefits of deploying CPOE across a nation or an entity (e.g. hospital or health authority) thereby reducing the number of adverse drug events (ADEs) in both inpatient and outpatient settings.
• The inpatient component of the model takes the total number of inpatient hospital days for a nation or entity and then converts them into susceptible patient days.
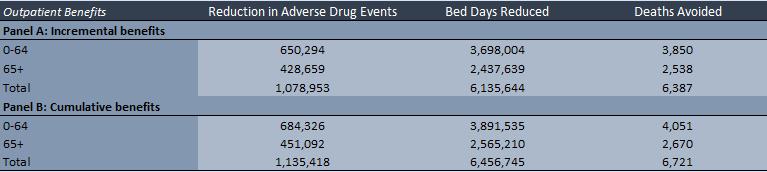
• The outpatient component of the model takes the number of total annual outpatient visits and estimates the number of susceptible visits that present a risk of an ADE.
• The model then estimates the number of preventable ADEs with current and future CPOE adoption. The model uses the difference in preventable ADEs to estimate reduced bed days and deaths avoided.
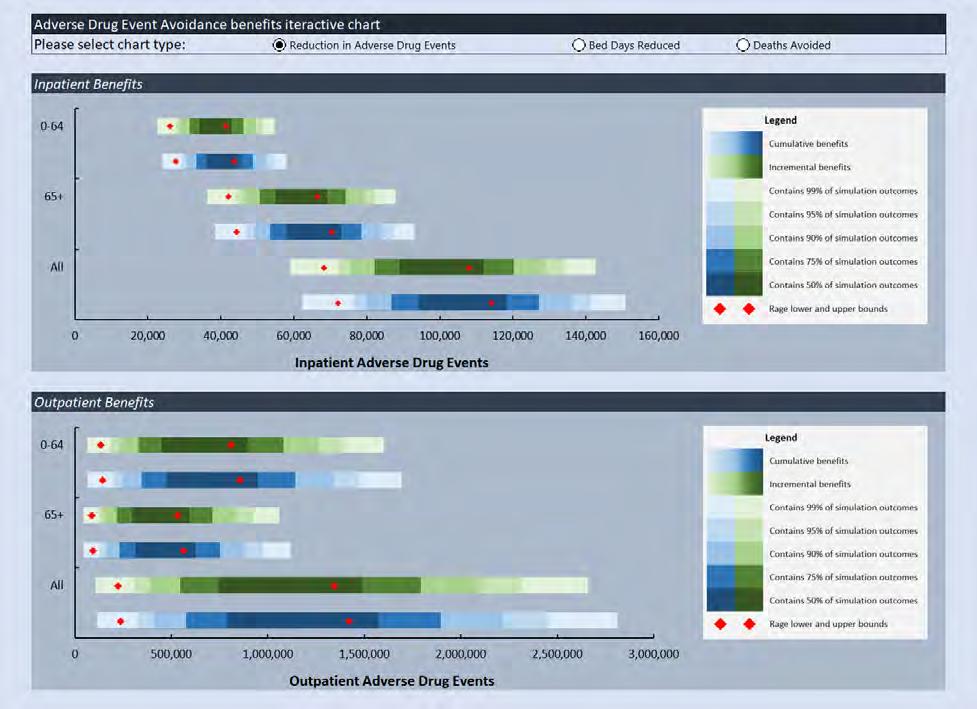
• Monte Carlo simulations are used to generate range estimates of reduced ADEs, reduced bed days and deaths avoided in response to increased CPOE adoption.
Benefits Model
4. Model 3 Outputs:
• Provides potential patient service outcome and patient health outcome benefits (i.e. deaths avoided, as well as reduced ADEs, reduced bed days). • There could also be significant reduction in litigation and punitive damages as a result of the reduction in ADEs.
However, we could not identify any studies that we could leverage to quantify the financial benefits. • Results are expected to be generalizable (e.g. across nations). • Results should be considered directional/indicative of potential benefits.
Benefits Model
• Limitation 1 – The RAND report calculated the reduction in inpatient preventable ADEs, patient bed days, and deaths avoided based on data prior to 2005. Also, the RAND model provided only point estimates for these benefits.
• Solution 1 – Model 3 leverages data from more recent studies to estimate inpatient preventable ADEs, reduction in inpatient preventable ADEs from the deployment of CPOE, patient bed days reduced, and deaths avoided. It also leverages Monte Carlo simulations to generate ranges of patient benefits outcomes at varying confidence level intervals.
• Limitation 2: In estimating the number of preventable ADEs, the RAND study first estimated the number of serious medical errors (SMEs) per 1000 susceptible patient days. It then assumes that half of the SMEs lead to preventable ADEs.
• Solution 2: Model 3 leverages recent data points for inpatient preventable ADEs per 1000 from our literature search. These recent data points are estimated directly by analyzing patient records. Therefore, the inpatient preventable ADEs data used by Model 3 is derived in a more direct way then the indirect approach used by RAND to calculate inpatient preventable ADEs.
Benefits Model
• Limitation 3 – The RAND report implicitly uses 100% CPOE adoption. The report also uses point estimates for the fraction of ADEs that are preventable and the reduction in preventable ADEs with CPOE.
• Solution 3 – The outpatient section of Model 3 uses client input parameters on CPOE adoption making the estimates more realistic. Also, the model uses data from more recent studies, a number of which were not available to RAND, to estimate outpatient preventable ADEs, reduction in outpatient preventable ADEs from the deployment of CPOE, patient bed days reduced, and deaths avoided. Lastly, the model uses Monte Carlo simulations to generate a range of potential benefits outcomes at varying confidence interval levels.
Benefits Model
• Six studies provided sufficient granularity of both the benefits and costs of clinical information system implementations to conduct both
Benefits to Costs Multiple and Internal Rate of Return analysis. 1. Girosi et al, “Extrapolating Evidence of Health Information Technology Savings and Costs”, RAND Corp. 2005. The anchor study for most of our
analysis. (See Extrapolating Evidence of Health Information Technology Savings and Costs | RAND) 2. Booz Allen Hamilton, “Canada Health Infoway’s 10-Year Investment Strategy – Pan Canadian Electronic Health Record” Canada Health
Infoway, March 2005. No longer available online. 3. Walker et al, “The Value Of Health Care Information Exchange And Interoperability”. Health Affairs, Vol 24., No. Suppl 1: Web Exclusives, 2005. (See The Value Of Health Care Information Exchange And Interoperability | Health Affairs). 4. Sprivulis et al., “The Economic Benefits of Health Information Exchange Interoperability for Australia” Australian Health Review, 31(4):531-9
Dec. 2007. (see (PDF) The Economic Benefits of Health Information Exchange Interoperability for Australia (researchgate.net). 5. Sentara Healthcare, “Nicholas E. Davies Award, 2010 Program, Organizational Healthcare Full Application”, May 2010. No longer available online. 6. McKinsey and Company, “Methodology to Assess the Economic Impact and Potential of Digital Health Solutions on the Canadian Healthcare
System” Canada Health Infoway, October 2015. (See https://www.infoway-inforoute.ca/en/component/edocman/3258-methodology-to-assess-theeconomic-impact-and-potential-of-digital-health-solutions-on-the-canadian-health-care-system/view-document?Itemid=101).
1. Benefits to Costs Multiple (BCM) BCM is a simple multiple of gross benefits to costs (total benefits/total costs, both OPEX and CAPEX) there is no discounting of benefits or costs to the present. 2. IRR is the internal rate of return on an investment or project. It is the "annualized effective compounded return rate" or rate of return that sets the net present value of all cash flows (both positive and negative) from the investment equal to zero. The term internal refers to the fact that the calculation excludes external factors, such as the risk-free rate, inflation, the cost of capital, or financial risk. The method may be applied either ex-post or exante. Applied ex-ante, the IRR is an estimate of a future annual rate of return. Applied ex-post, it measures the actual achieved investment return of an historical investment.
• Limitations to the approach to calculating BCM and IRR estimates for each study • The studies leveraged for the BCM and IRR analysis were conducted at different periods and each study had a somewhat different methodology and analysis timeline to estimate the clinical information system benefits and costs. Therefore, some simplifying assumptions were made to ensure the cross comparability of BCM and IRR estimated factors generated. • Some studies provided benefit/cost estimates for multiple scenarios, while others provided information to calculate just the “Most Likely Scenario”.
• Simplifying assumptions made: 1. The timeline of all studies was normalized to 20 years. Annual benefits, OPEX costs and CAPEX were assumed to be for a clinical information system and interoperability solution deployment. Study specific normalizations were made, as necessary. 2. None (0%) of the annual benefits were recognized in year 1 as the implementation team would be focused on planning, and earlystage implementation activities in year 1. 33% were recognized in year 2, 66% in year 3 and 100% in year 4. 3. 33% of OPEX (costs) were recognized in year 1 as there would be some OPEX incurred during the planning, and early-stage implementation phases. The OPEX was increased to 66% in year 2 and then to 100% by year 3. 4. Total implementation CAPEX was spread evenly over years 1 to 3 at the rate of 33% per year.
Range Calculation Methodology
• A 1-67% confidence interval1 (CI) of the BCM and IRR factors was constructed.
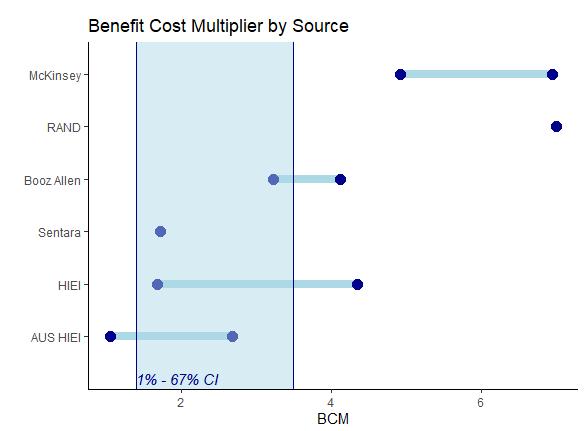
1-67% Confidence Interval: 1.4 –3.5 1-67% Confidence Interval: 10% -42%

Benefits Model
BCM & IRR Estimates by Study for Clinical Information System Deployments
Study
1. RAND - Extrapolating Evidence of HEALTH Information Technology Savings and Costs.
BCM
Most Likely Scenario – 7.0
2. Booz Allen - Canada Health Infoway’s 10-Year Investment Strategy – Pan Canadian EHR. Low Scenario – 3.2 High Scenario – 4.1
3. The Value Of Health Care Information Exchange And Interoperability. Low Scenario – 1.7 Most Likely Scenario – 3.4 High Scenario – 4.4
4. The Economic Benefits of Health Information Exchange Interoperability for Australia.
5. Sentara Healthcare eCare System Business Case.
6. McKinsey - Canada Health Infoway - Methodology to assess the economic impact and potential of digital health solutions on the Canadian healthcare system.
Range at a 1-67% Confidence Interval (CI) for not normal distributed small sample
1.4 – 3.5 10% - 42%
Low Scenario (1) – 1.1 Low scenario (2) – 1.3 Most Likely Scenario – 2.0 High Scenario (1) – 2.6 High Scenario (2) – 2.7 Low Scenario (1) – 2% Low scenario (2) – 8% Most Likely Scenario – 20% High Scenario (1) – 29% High Scenario (2) – 33%
Most Likely Scenario – 1.7
Low Scenario – 4.9 High Scenario – 6.9
IRR
Most Likely Scenario – 64%
Low Scenario – 35% High Scenario – 47%
Low Scenario – 13% Most Likely Scenario – 37% High Scenario – 50%
Most Likely Scenario – 24%
Low Scenario – 77% High Scenario – 114%
Benefits Model
Breakeven Analysis Model
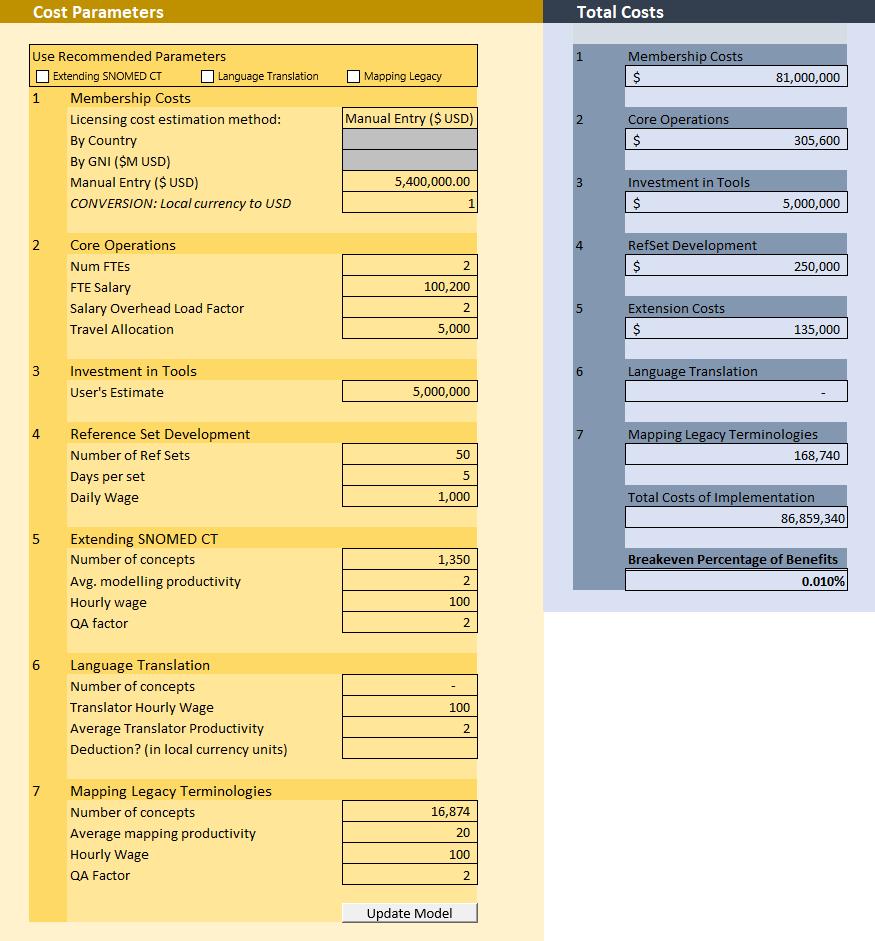
• The breakeven analysis model is a tool designed to compute the percentage of cumulative productivity benefits that must be realized in order to break even on the license and implementation costs of a SNOMED CT.
• The model user can estimate seven different cost estimates associated with a
SNOMED CT license1: 1. Membership costs 1. Core operations 2. Investment in tools 3. Reference set development 4. Extension costs 5. Language translation 6. Mapping legacy terminologies
• Costs are estimated in local currency units.
• In this example, we estimate the costs of implementing a SNOMED CT license in the US to be $87M USD, and our Model 1 cumulative benefits to be $875.8B USD giving us a breakeven percentage of 0.01%.


