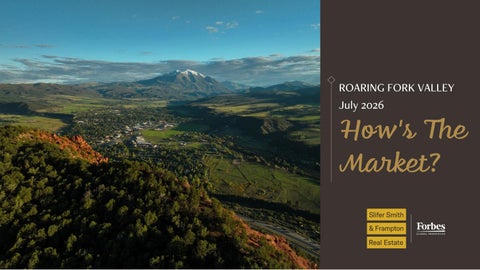
ROARING FORK VALLEY July 2026
How's The Market?
ROARKING FORK VALLEY MARKET STATS Residential Only (MLS) | 2025 vs 2026 (Month of July)
-12.5%
16.1%
Closed Transactions
Sold Dollar Volume
2025 :: 80
2025 :: $202M
2026 :: 70
2026 :: $234M
32.7%
-4.7%
Average Sold Price
Average Sold Price Per Sq.Ft.
2025 :: $2.5M
2025 :: $1,110
2026 :: $3.3M
2026 :: $1,058
0%
Sale/List Price 2025 :: 96% 2026 :: 96%
25.0% Average Days On Market
*Stats pulled from MLS for Aspen, Basalt, Brush Creek Village, Carbondale, Glenwood, Missouri Heights, New Castle, Old Snowmass, Redstone/Crystal Valley, Snowmass Village, and Woody Creek Source of all data in this report is from the Aspen Board of Realtors MLS. Statistical information is deemed reliable but not guaranteed
2025 :: 112 2026 :: 140
ROARKING FORK VALLEY MARKET STATS Residential Only (MLS) | 2025 vs 2026 (YTD - 1/1 through 7/31)
-12.5%
Closed Transactions
-25.1%
0%
Sold Dollar Volume
2025 :: 546
2025 :: $2.17B
2026 :: 477
2026 :: $1.62B
-14.3%
-10.2%
Average Sold Price
Average Sold Price Per Sq.Ft.
2025 :: $4.0M
2025 :: $1,398
2026 :: $3.4M
2026 :: $1,255
Sale/List Price 2025 :: 96% 2026 :: 96%
Average Days On Market
*Stats pulled from MLS for Aspen, Basalt, Brush Creek Village, Carbondale, Glenwood, Missouri Heights, New Castle, Old Snowmass, Redstone/Crystal Valley, Snowmass Village, and Woody Creek Source of all data in this report is from the Aspen Board of Realtors MLS. Statistical information is deemed reliable but not guaranteed
17.5% 2025 :: 126 2026 :: 148
RFV TOTAL ACTIVE INVENTORY Residential & Land (MLS) | On August 1st of each year
5-Year Comparison 1,000 900 800 700 600 500 400 300 200 100 0
693
538 2022
155
692
507
185
813
2023
610
203
911
2024 Total
Residential
748
163
853
2025 Land
*Stats pulled from MLS for Aspen, Basalt, Brush Creek Village, Carbondale, Glenwood, Missouri Heights, New Castle, Old Snowmass, Redstone/Crystal Valley, Snowmass Village, and Woody Creek Source of all data in this report is from the Aspen Board of Realtors MLS. Statistical information is deemed reliable but not guaranteed
737 2026
116
-1.5% 2025<2026 Residential Only
RFV NEW LISTINGS VS PENDING SALES Residential & Land (MLS) 260 240 220 200 180 160 140 120 100 80 60 July 25
Aug 25
Sept 25
Oct 25
Nov 25
Dec 25
Jan 26
New Listing
Feb 26
Mar 26
Apr 26
Pending
*Stats pulled from MLS for Aspen, Basalt, Brush Creek Village, Carbondale, Glenwood, Missouri Heights, New Castle, Old Snowmass, Redstone/Crystal Valley, Snowmass Village, and Woody Creek Source of all data in this report is from the Aspen Board of Realtors MLS. Statistical information is deemed reliable but not guaranteed
May 26
June 26
July 26