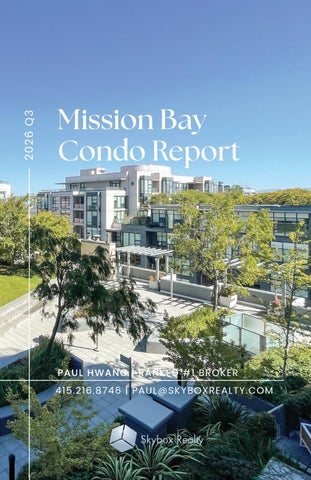
2026 Q3
Mission Bay Condo Report
PAUL HWANG | RANKED #1 BROKER 415.216.8746 | PAUL@SKYBOXREALTY.COM
Skybox Realty 2026 Q3 Report
Dear Neighbors, An AI-driven economic transformation is underway, with San Francisco at its epicenter, reshaping the local real estate market. Talent and capital from around the world continue to concentrate in the city, creating a noticeable increase in energy, activity, and demand throughout the local market. In Mission Bay, year-over-year sales activity increased a dramatic 50%, while the average sales price increased 19% and the average price per square foot rose 15%. These gains point to stronger demand among buyers in the local market. At the same time, average days on market fell to 13 days—a 76% decline year over year. The rental market has also strengthened, with rents increasing as much as 30% for certain units, surpassing prepandemic highs. With major AI companies such as Anthropic and OpenAI potentially entering the public markets, we believe the continued growth of the AI sector could support housing demand in San Francisco through 2027 and beyond. If you are considering selling, now is an excellent time to begin developing your strategy. We would be pleased to provide a professional assessment of your property and discuss the opportunities we see in today’s market. We look forward to being of service to you. Best Regards, Paul Hwang, Ranked #1 Broker | 415.216.8746 This document has been prepared by Skybox Realty for advertising and general information only. Skybox Realty makes no guarantees, representations or warranties of any kind, expressed or implied, regarding the information including, but not limited to, warranties of content, accuracy and reliability. Any interested party should undertake their own inquiries as to the accuracy of the information. Skybox Realty excludes unequivocally all inferred or implied terms, conditions and warranties arising out of this document and excludes all liability for loss and damages arising there from.
All Data From SFARMLS
Paul Hwang | 415.216.8746 | paul@skyboxrealty.com
Table of Contents
Mission Bay 2026 Q3 Snapshot
5
235 Berry
6-9
255 Berry
10 - 13
Arterra
14 - 17
Park Terrace
18 - 21
The Beacon
22 - 25
Madrone
26 - 29
Radiance
30 - 33
Arden
34 - 37
One Mission Bay
38 - 41
Q3 Sales
42 - 45
Who You Work With Matters
46 - 47
© Skybox Realty Inc, 2026
3
Oracle Park E N TH CO A BE
Ch in a Ba sin Pa rk
Caltrain BE
R
ST
RY
5 23 RRY BE
ONE BAY MISSION
5 25 RRY BE
0 30 RRY BE
N
K
AN
LVD
BL VD NO RT H
IS B
M IS SI O N BA Y
ST
NCO
CH IN A BA SI N
FRA
G
DIANCE
MADRONE RA
ST
BR ID GE VI EW W
N
ID
E
3R D ST
EN
D
AR
LO
G
BR
N
RY A
CH
ST
EL
TER
I
O
EE
4T H ST
5 32 RRY BE
M
I SS
CR
AY
MISSION BAY SO UT H ST O W EN S ST
UCSF Mission Bay
The Chase Center
I 280
16 TH ST
TE NN ES S
M ISS ISS IP PI ST
M ar ip os a Pa rk M AR IP O SA ST
ILL IN OI S ST
UCSF Medical Center
Paul Hwang | 415.216.8746 | paul@skyboxrealty.com
Mission Bay 2026 Q3 # of Transactions
27
50% YOY /
16% QOQ
Average Sales Price
$1,345,730 19% YOY /
4.2% QOQ
* Median Price $1,467,000
Average Price per Square Foot
$1,197 15% YOY /
4.8% QOQ
Average Days on the Market
13
76% YOY /
48% QOQ
© Skybox Realty Inc, 2026
5
235 Berry
607 | $1,800,000 (2BR) $1314/sf
115 | $1,975,000 (3BR) $1034/sf
All Data From SFARMLS
OFF MAR KET
SOL D
ACTI V E
IN CONTRACT
314 | $1,575,000 (2BR) $1092/sf
© Skybox Realty Inc, 2026
7
235 Berry
# of Transactions
3
200% YOY /
200% QOQ
Average Sales Price
$1,775,000 53% YOY /
.73% QOQ
* Median Price $1,800,000
Price Per SF Q3
$1,146/SF
Q2
$1,094/SF
A VG $/ S F
MED I A N $/S F
Q1 Q4
$1,122/SF $900
$1000
$1100
$1200
All Data From SFARMLS
235 Berry
Average Days on Market
Average $/SF
20
$1,146 22% YOY /
4.7% QOQ
84% YOY /
Buyer Demographic
CASH
122% QOQ
LO A N
UN K N O WN
N o Sa les in 2 0 2 6 Q1
2 0 2 6 Q1
2026 Q 2
© Skybox Realty Inc, 2026
2026 Q 3
9
255 Berry
507 | $940,000 (1BR) $1077/sf 320 | $1,300,000 (2BR) $1238/sf
All Data From SFARMLS
OFF MAR KET
SOL D
© Skybox Realty Inc, 2026
ACTI V E
IN CONTRACT
11
255 Berry
# of Transactions
2
100% YOY / ---- QOQ
Average Sales Price
$1,062,500 29% YOY /
19% QOQ
* Median Price $1,062,500
Price Per SF Q3
$1,157/SF
Q2
$1,003/SF
A VG $/ S F
MED I A N $/S F
Q1 Q4 $900
$1000
$1100
$1200
All Data From SFARMLS
255 Berry
Average Days on Market
Average $/SF
11
$1,157 6.1% YOY /
15% QOQ
58% YOY /
Buyer Demographic
CASH
70% QOQ
LO A N
UN K N O WN
N o Sa les in 2 0 2 6 Q1
2 0 2 6 Q1
2026 Q 2
© Skybox Realty Inc, 2026
2026 Q 3
13
Arterra
709 | $695,000 (1BR) $1164/sf
All Data From SFARMLS
OFF MAR KET
SOL D
ACTI V E
IN CONTRACT
1610 | $1,495,000 (2BR) $1479/sf
1204 | $875,000 (1BR) $1028/sf
554 | $1,500,000 (3BR) $1175/sf
118 | $830,888 (1BR) $936/sf
© Skybox Realty Inc, 2026
15
Arterra
# of Transactions
2
100% YOY /
50% QOQ
Average Sales Price
$1,165,444 100% YOY /
51% QOQ
* Median Price $1,165,444
Price Per SF Q3
$1,055/SF
Q2
$1,016/SF
Q1
$1,169/SF
Q4
$1,043/SF $500
A VG $/ S F
$700
MED I A N $/S F
$9 00
$1100
All Data From SFARMLS
300 Berry
Average Days on Market
Average $/SF
11
$1,055 100% YOY /
3.8% QOQ
100% YOY /
Buyer Demographic
2 0 2 6 Q1
CASH
2026 Q 2
© Skybox Realty Inc, 2026
45% QOQ
LO A N
UN K N O WN
2026 Q 3
17
Park Terrace
306 | $895,000 (1BR) $998/sf 107 | $1,485,000 (2BR) $911/sf
All Data From SFARMLS
OFF MAR KET
SOL D
ACTI V E
IN CONTRACT
712 | $960,000 (1BR) $1135/sf 527 | $1,799,000 (2BR) $----/sf
114 | $1,798,000 (2BR) $1217/sf
© Skybox Realty Inc, 2026
19
Park Terrace
# of Transactions
3
100% YOY /
50% QOQ
Average Sales Price
$1,113,333 100% YOY /
27% QOQ
* Median Price $960,000
Price Per SF Q3
$1,015/SF
Q2
$1,072/SF
A VG $/ S F
MED I A N $/S F
Q1 Q4
$979/SF $800
$900
$1000
$1100
All Data From SFARMLS
325 Berry
Average Days on Market
Average $/SF
1
$1,015 100% YOY /
5.4% QOQ
100% YOY /
Buyer Demographic
CASH
98% QOQ
LO A N
UN K N O WN
N o Sa les in 2 0 2 6 Q1
2 0 2 6 Q1
2026 Q 2
© Skybox Realty Inc, 2026
2026 Q 3
21
The Beacon
572 | $1,039,000 (2BR) $908/sf
All Data From SFARMLS
OFF MAR KET
SOL D
ACTI V E
IN CONTRACT
1005 | $1,558,000 (2BR) $1047/sf
679 | $1,020,000 (2BR) $1024/sf 555 | $739,000 (1BR) $995/sf
1602 | $1,599,000 (2BR) $1083/sf 1512 | $915,000 (1BR) $985/sf 1210 | $799,000 (1BR) $972/sf 1112 | $839,000 (1BR) $932/sf 1004 | $499,000 (1BR) $850/sf 958 | $1,348,000 (2BR) $1109/sf 722 | $1,210,000 (2BR) $1075/sf 500 | $1,350,000 (2BR) $1107/sf
© Skybox Realty Inc, 2026
23
The Beacon
# of Transactions
5
17% YOY /
37% QOQ
Average Sales Price
$1,135,600 79% YOY /
21% QOQ
* Median Price $1,210,000
Price Per SF Q3
$1,028/SF
Q2
$891/SF
Q1
$864/SF
Q4
$833/SF $700
A VG $/ S F
$800
MED I A N $/S F
$9 00
$1000
All Data From SFARMLS
250 / 260 King
Average Days on Market
Average $/SF
26
$1,028 25% YOY /
15% QOQ
73% YOY /
Buyer Demographic
2 0 2 6 Q1
CASH
2026 Q 2
© Skybox Realty Inc, 2026
30% QOQ
LO A N
UN K N O WN
2026 Q 3
25
Madrone
511 | $1,795,000 (2BR) $1298/sf 411 | $1,750,000 (2BR) $1265/sf 316 | $1,467,000 (1BR) $1616/sf 120 | $899,000 (1BR) $969/sf
All Data From SFARMLS
OFF MAR KET
SOL D
ACTI V E
IN CONTRACT
917 | $1,495,000 (1BR) $1151/sf
529 | $1,495,000 (2BR) $----/sf 406 | $1,125,000 (1BR) $1190/sf 336 | $1,560,000 (2BR) $1252/sf 341 | $1,798,000 (2BR) $1258/sf
© Skybox Realty Inc, 2026
27
Madrone
# of Transactions
3
25% YOY / ---- QOQ
Average Sales Price
$1,384,000 3.8% YOY /
4.8% QOQ
* Median Price $1,467,000
Price Per SF Q3
$1,353/SF
Q2
$1,244/SF
Q1
$1,385/SF
A VG $/ S F
MED I A N $/S F
Q4 $1100
$1200
$1300
$1400
All Data From SFARMLS
420 / 480 Mission Bay, 435 China Basin
Average Days on Market
Average $/SF
23
$1,353 23% YOY /
8.8% QOQ
28% YOY /
Buyer Demographic
2 0 2 6 Q1
CASH
2026 Q 2
© Skybox Realty Inc, 2026
109% QOQ
LO A N
UN K N O WN
2026 Q 3
29
Radiance
509 | $1,225,000 (1BR) $1258/sf 402 | $1,083,000 (1BR) $1122/sf
All Data From SFARMLS
OFF MAR KET
SOL D
ACTI V E
IN CONTRACT
805 | $998,000 (1BR) $1113/sf
© Skybox Realty Inc, 2026
31
Radiance
# of Transactions
1
100% YOY / ---- QOQ
Average Sales Price
$1,098,000 100% YOY /
47% QOQ
* Median Price $1,098,000
Price Per SF Q3
$1,122/SF
Q2
$1,272/SF
A VG $/ S F
MED I A N $/S F
Q1 Q4
$1,016/SF $900
$1000
$1100
$1200
All Data From SFARMLS
330 Mission Bay, 325 China Basin
Average Days on Market
Average $/SF
46
$1,122 100% YOY /
12% QOQ
100% YOY /
Buyer Demographic
CASH
282% QOQ
LO A N
UN K N O WN
N o Sa les in 2 0 2 6 Q1
2 0 2 6 Q1
2026 Q 2
© Skybox Realty Inc, 2026
2026 Q 3
33
Arden
611 | $1,777,000 (2BR) $1460/sf 506 | $1,748,000 (2BR) $1292/sf
All Data From SFARMLS
OFF MAR KET
SOL D
ACTI V E
IN CONTRACT
908 | $1,650,000 (2BR) $1460/sf
214 | $1,700,000 (2BR) $1237/sf
© Skybox Realty Inc, 2026
35
Arden
# of Transactions
3
50% YOY /
40% QOQ
Average Sales Price
$1,648,667 5.3% YOY /
24% QOQ
* Median Price $1,700,000
Price Per SF Q3
$1,344/SF
Q2
$1,471/SF
Q1
$1,447/SF
Q4
$1,248/SF $900
A VG $/ S F
$1100
MED I A N $/S F
$1300
$1500
All Data From SFARMLS
708 / 718 Long Bridge
Average Days on Market
Average $/SF
14
$1,344 1.5% YOY /
8.7% QOQ
61% YOY /
Buyer Demographic
2 0 2 6 Q1
CASH
2026 Q 2
© Skybox Realty Inc, 2026
23% QOQ
LO A N
UN K N O WN
2026 Q 3
37
One Mission Bay
1305 | $1,680,000 (2BR) $1379/sf 1204 | $1,650,000 (2BR) $----/sf
812 | $1,728,812 (2BR) $1355/sf
811 | 2,250,000 (3
417 | $998,000 (1BR) $1384/sf 327 | $1,100,000 (1BR) $1240/sf 208 | $699,000 (0BR) $1384/sf
320 | $1,498,000 (
All Data From SFARMLS
OFF MAR KET
SOL D
ACTI V E
IN CONTRACT
1005 | $1,199,000 (1BR) $1364/sf
3BR) $1543/sf
807 | $1,450,000 (1BR) $1489/sf
(2BR) $1266/sf
430 | $725,000 (0BR) $1348/sf 312 | $700,000 (0BR) $1378/sf
© Skybox Realty Inc, 2026
39
One Mission Bay
# of Transactions
6
50% YOY / ---- QOQ
Average Sales Price
$1,359,469 16% YOY /
5.4% QOQ
* Median Price $1,474,000
Price Per SF Q3
$1,351/SF
Q2
$1,291/SF
Q1
$1,172/SF
Q4
$1,168/SF $1100
A VG $/ S F
$1200
MED I A N $/S F
$1300
$1400
All Data From SFARMLS
1000 3rd, 110 Channel
Average Days on Market
Average $/SF
27
$1,351 11% YOY /
4.6% QOQ
36% YOY /
Buyer Demographic
2 0 2 6 Q1
CASH
2026 Q 2
© Skybox Realty Inc, 2026
13% QOQ
LO A N
UN K N O WN
2026 Q 3
41
Skybox Realty 2026 Q3 Report
2026 Q3 Sales Address
BR / BA
SQFT
250 King 1004 110 Channel 312 300 Berry 118 325 Berry 306 255 Berry 507 325 Berry 712 260 King 679 330 Mission Bay 402 110 Channel 327 420 Mission Bay 406 250 King 722 255 Berry 320 250 King 500 1000 3rd 807 480 Mission Bay 316 325 Berry 107 110 Channel 320 300 Berry 554 235 Berry 314 435 China Basin 336 250 King 1602
1/1 0/1 1 / 1.5 1/1 1/1 1/1 2/2 1 / 1.5 1/2 1/1 2/2 2/2 2/2 1 / 1.5 1/1 2 / 2.5 2/2 3/2 2/2 2/2 2/2
587 508 888 882 873 846 996 965 887 945 1,126 1,050 1,219 974 908 1,630 1,183 1,277 1,420 1,246 1,476
All Data From SFARMLS
Paul Hwang | 415.216.8746 | paul@skyboxrealty.com
* Only showing sold homes in buildings featured in this book. Does not include new construction or bmrs.
Sale Price
$/SF
% Sale/List
$499,000 $700,000 $830,888 $880,000 $940,000 $960,000 $1,020,000 $1,083,000 $1,100,000 $1,125,000 $1,210,000 $1,300,000 $1,350,000 $1,450,000 $1,467,000 $1,485,000 $1,498,000 $1,500,000 $1,550,000 $1,560,000 $1,599,000
$850 $1,378 $936 $998 $1,077 $1,135 $1,024 $1,122 $1,240 $1,190 $1,075 $1,238 $1,107 $1,489 $1,616 $911 $1,266 $1,175 $1,092 $1,252 $1,083
100% 108% 104% 98% 111% 107% 113% 99% 100% 102% 97% 102% 108% 112% 134% 99% 100% 111% 98% 104% 100%
© Skybox Realty Inc, 2026
43
Skybox Realty 2026 Q3 Report
2026 Q3 Sales cont... Address
BR / BA
SQFT
708 Long Bridge 908 1000 3rd 1305 718 Long Bridge 214 1000 3rd 812 708 Long Bridge 611 235 Berry 607 235 Berry 115
2/2 2/2 2/2 2/2 2/2 2/2 3/3
1,237 1,218 1,374 1,276 1,217 1,370 1,910
All Data From SFARMLS
Paul Hwang | 415.216.8746 | paul@skyboxrealty.com
* Only showing sold homes in buildings featured in this book. Does not include new construction or bmrs.
Sale Price
$/SF
% Sale/List
$1,650,000 $1,680,000 $1,700,000 $1,728,812 $1,777,000 $1,800,000 $1,975,000
$1,334 $1,379 $1,237 $1,355 $1,460 $1,314 $1,034
100% 99% 100% 102% 111% 106% 101%
© Skybox Realty Inc, 2026
45
Skybox Realty 2026 Q3 Report
Paul Hwang
Paul Hwang Activity (2021-2026 Sales) # of Transactions
156+ Sold Volume
$265,619,650+ All Data From SFARMLS
Paul Hwang | 415.216.8746 | paul@skyboxrealty.com
*
Call me to find out how we can feature your off market listing to all of our prospective buyers in our Quarterly Reports!
Paul Hwang Leasing Activity 2025 # Leased
61+
2026 Leased to Date
56+
© Skybox Realty Inc, 2026
47
Click here to subscribe to our digital monthly market updates and quarterly reports.
RANKED #1 BROKER
Paul Hwang 415.216.8746 | DRE 01371169 PAUL@SKYBOXREALTY.COM
流利國語