





Rents are at historical highs and may be tapering off, fueled by high-income hiring from local AI companies. While sales have increased, they haven’t yet kept pace with rental growth.
Q2 year-over-year data for South Beach shows: - Sales increased by 34%. - Average days on market declined by 39%. - Average price per square foot increased 3.8%.
Low inventory and high rents are currently pushing sales higher. I expect sales to accelerate into 2027, running in parallel with AI equities. The high-end market is currently outperforming both entry-level and mid-level properties. If you have a use for the capital it is a great time to sell. If you do not have any plans for the money from a sale then reassess the market in 2027, as we may be at the beginning of a new up cycle for San Francisco. We offer a full line of services (selling, buying, leasing, property management) for your real estate needs and are staffed 7 days a week at our office at 333 1st Street. We look forward to serving you and seeing you in the neighborhood.
Regards,
This document has been prepared by Skybox Realty for advertising and general information only. Skybox Realty makes no guarantees, representations or warranties of any kind, expressed or implied, regarding the information including, but not limited to, warranties of content, accuracy and reliability. Any interested party should undertake their own inquiries as to the accuracy of the information. Skybox Realty excludes unequivocally all inferred or implied terms, conditions and warranties arising out of this document and excludes all liability for loss and damages arising there from.
# of Transactions 78
QOQ
Average Sales Price
$1,386,692
Does not include new construction. * Median Price $1,201,500
Average Price per Square Foot
$1,165
Average Days on the Market
28
# of Transactions 25
Average Sales Price $1,274,772
Median Price $1,125,000
Average Price per Square Foot
$1,026
Average Days on the Market 65
* Includes new construction marketed on MLS.
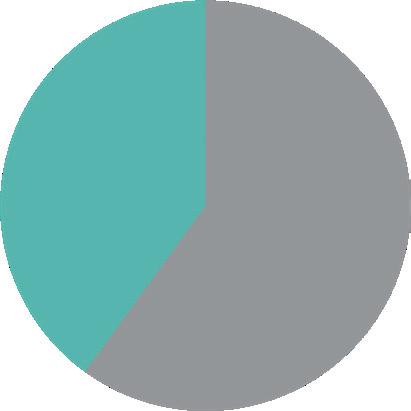
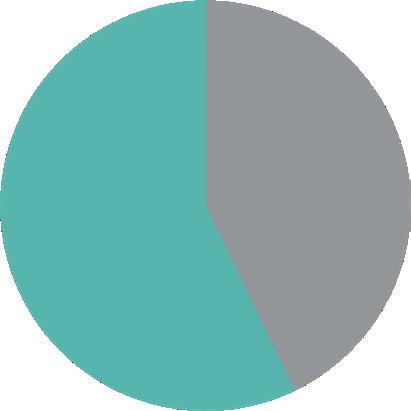
# of Transactions
301 / 333 Main, 318 / 338 Spear
Average $/SF
Average Days on Market
Buyer Demographic
D25C | $2,725,000 (2BR) $1942/sf
D18B | $1,900,000 (1BR) $1613/sf
D16A | $1,870,000 (2BR) $1356/sf
D8E | $1,685,000 (2BR) $1219/sf
D8H | $935,000 (1BR) $1095/sf
C8I | 1,185,000 (1BR) $1199/sf
C7F | 800,000 (1BR) $870/sf
| $1,205,000 (1BR) $1082/sf
D4E | $1,730,000 (2BR) $1252/sf
D3G | $1,995,000 (2BR) $1424/sf
| $850,000 (1BR) $924/sf
|
| $2,225,000 (2BR)
|
| $1,010,000 (1BR) $1187/sf A5D | $1,088,000 (1BR) $986/sf
| $2,650,000 (3BR) 1339/sf
|
| $1,799,000 (2BR) $1282/sf
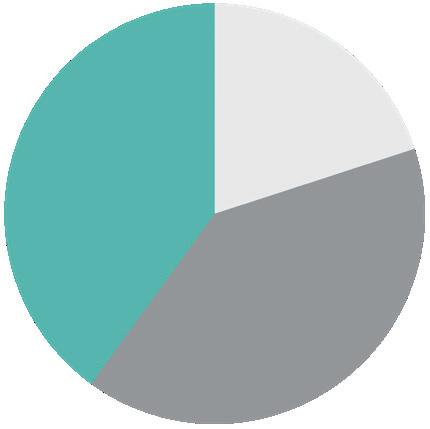
of Transactions
318 / 338 Main, 333 Beale, 201 Folsom
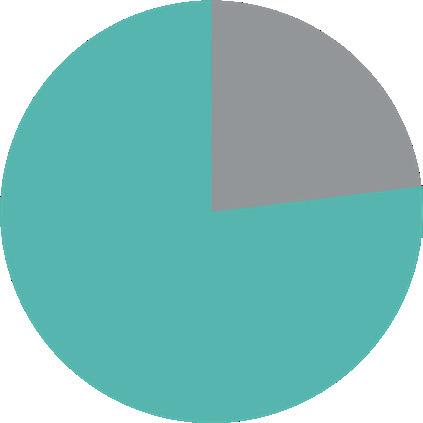
Average $/SF $1,257
Buyer Demographic
Average Days on Market 24
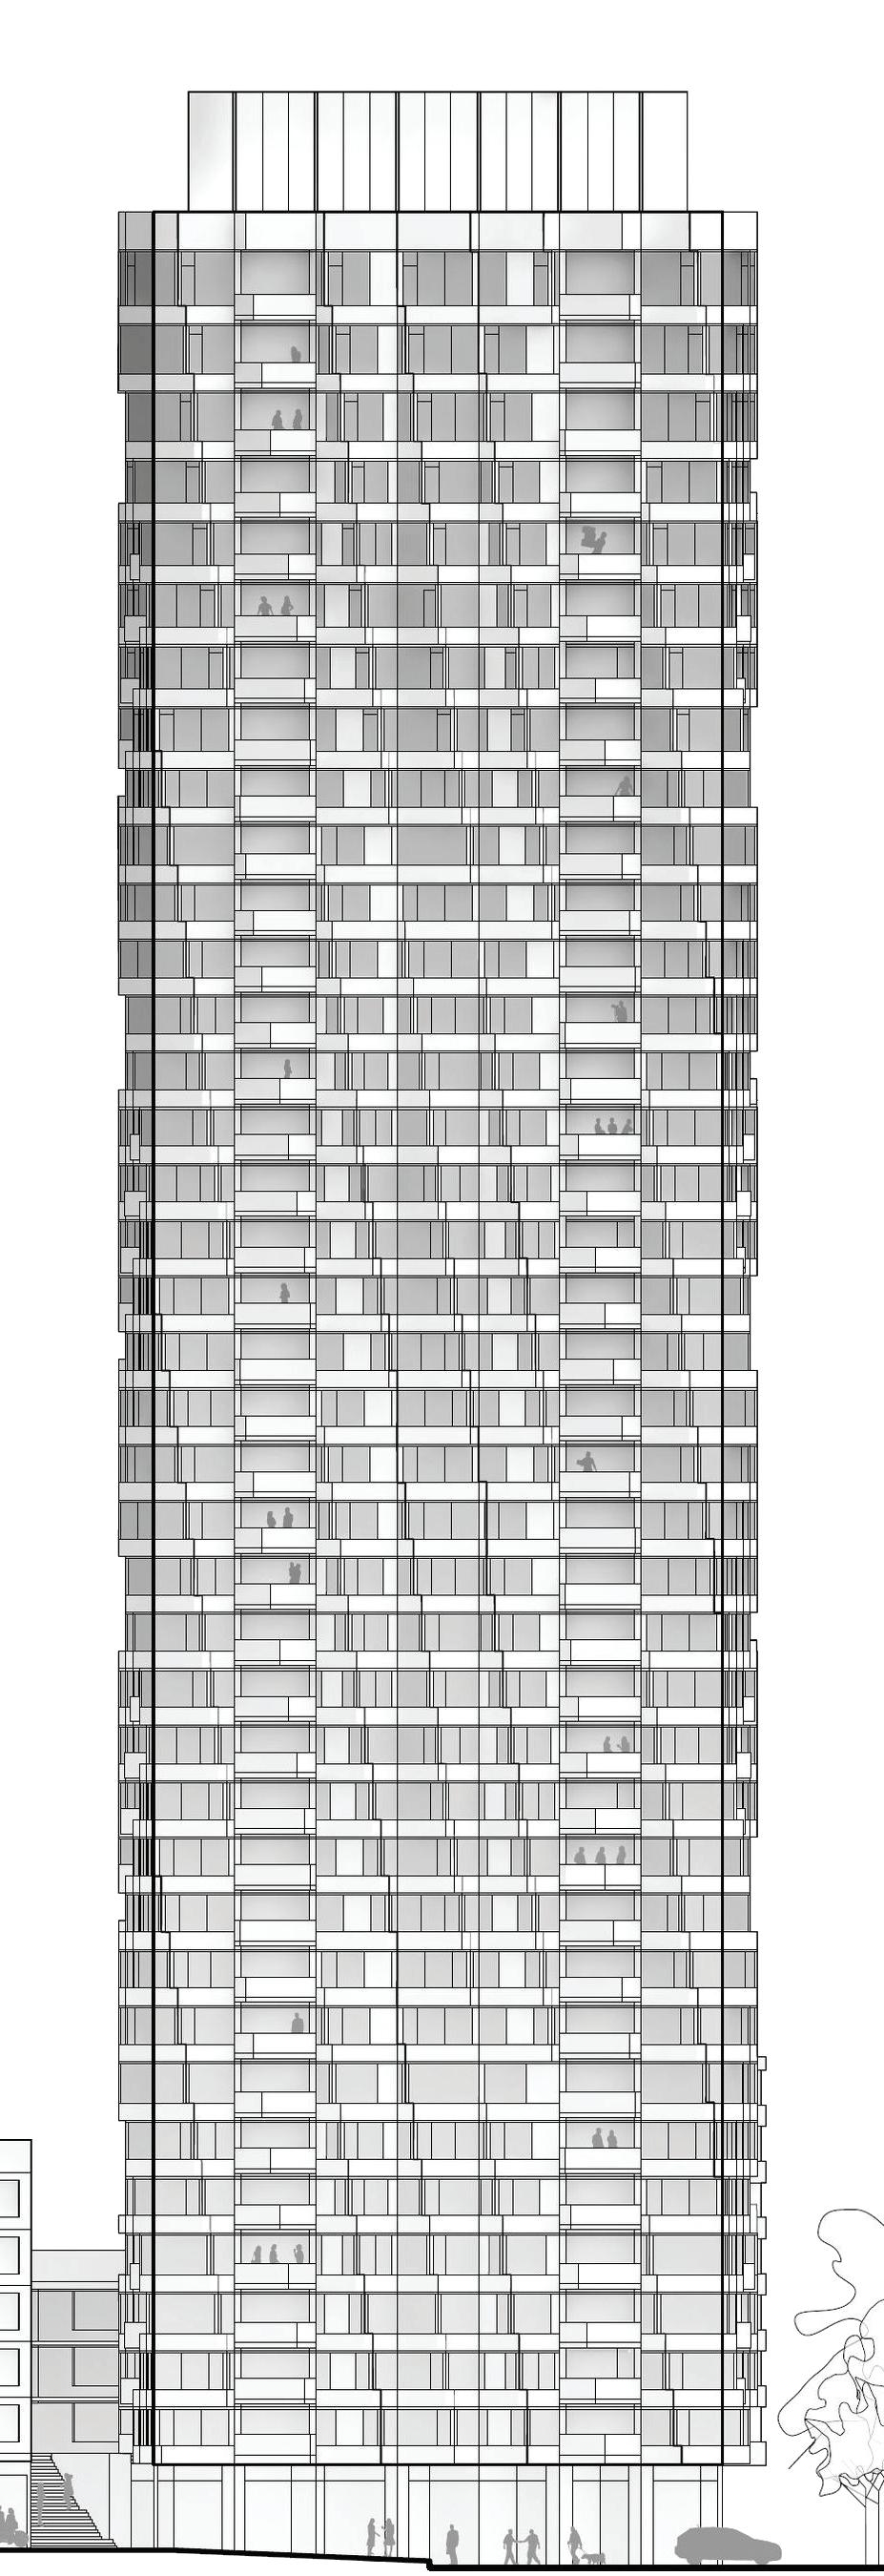
24F | $1,450,000 (1BR) $1842/sf
17E | $2,100,000 (2BR) $1620/sf
8J | $1,800,000 (2BR) $1327/sf
3K | $799,000 (1BR) $1268/sf 10D | $1,388,000 (2BR) $1344/sf 7D | $1,795,000 (2BR) $1379/sf 4M | $1,099,000 (2BR) $1208/sf
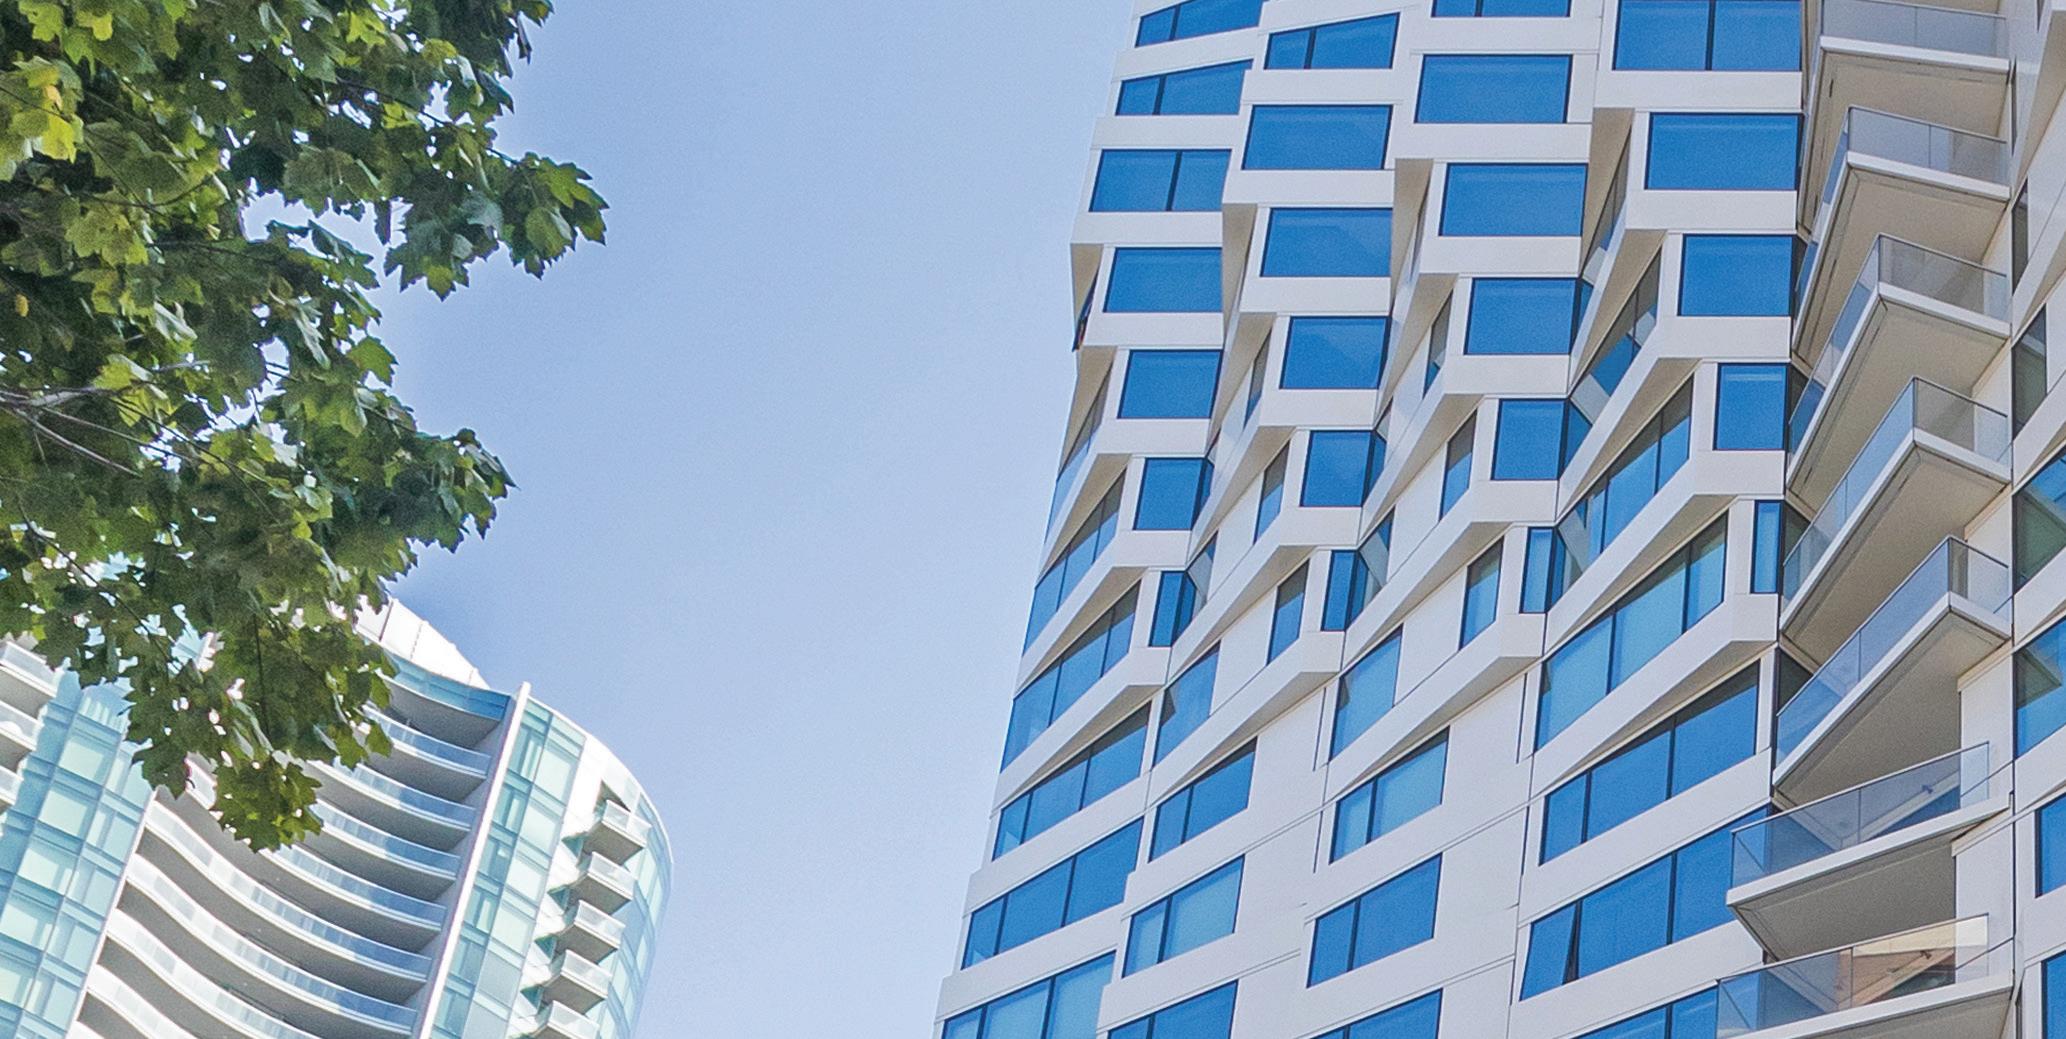
# of Transactions
Average Sales Price $1,566,333 12% YOY / 23% QOQ * Median Price $1,800,000 Q2 Q1 Q4 Q3
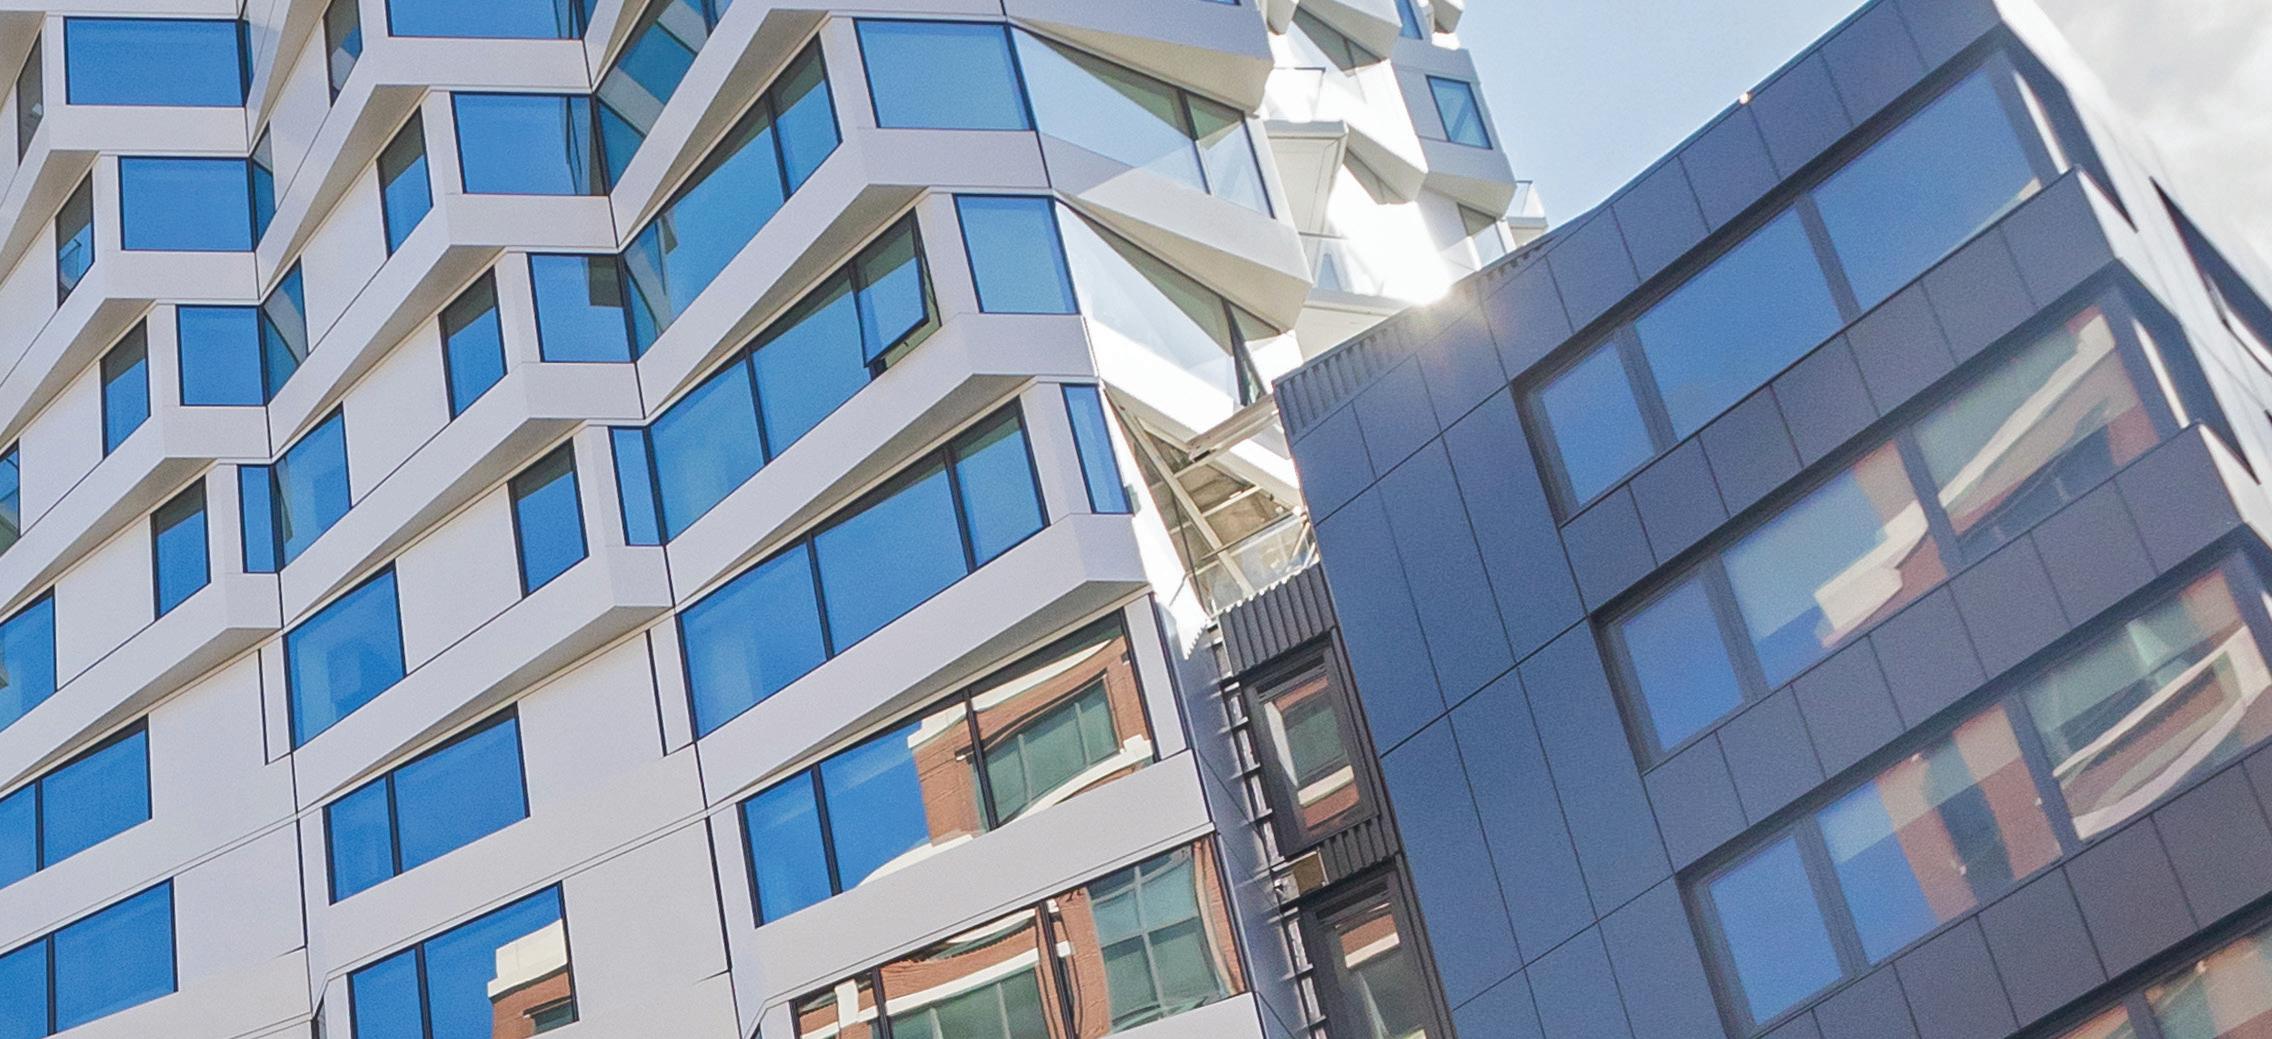
Average $/SF $1,405
Buyer Demographic
Average Days on Market 2
# of Transactions
Average $/SF $1,169
Buyer Demographic
Average Days on Market 23
3703 | $1,799,000 (2BR) $1408/sf
2003 | $1,739,000 (2BR) $1361/sf


# of Transactions
YOY / 53% QOQ
425 1st, 489 Harrison
Average $/SF $1,375
Buyer Demographic
Average Days on Market 33
# of Transactions
YOY / 9.6% QOQ
Median Price $1,178,250
333 / 355 1st
Average $/SF $1,143
Buyer Demographic
Average Days on Market 21
| $1,475,000 (2BR) $1252/sf
BMRs not included in data below
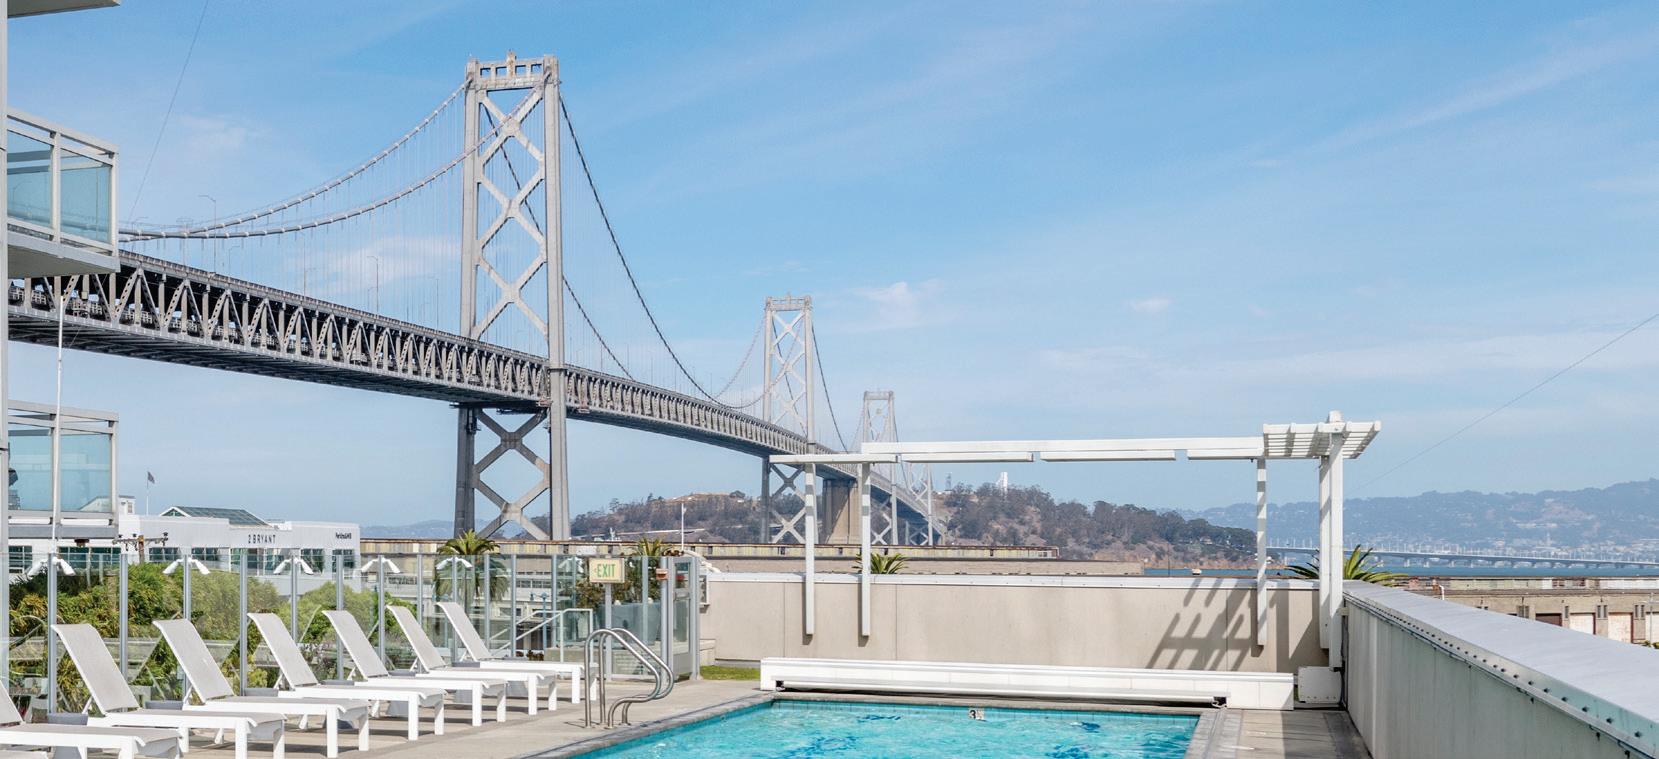
Buyer Demographic
| $1,990,000 (2BR) $1626/sf
| $835,,000 (1BR) $1155/sf 14A | $2,450,000 (3BR) $1481/sf 15A | $1,200,000 (1BR) $1485/sf
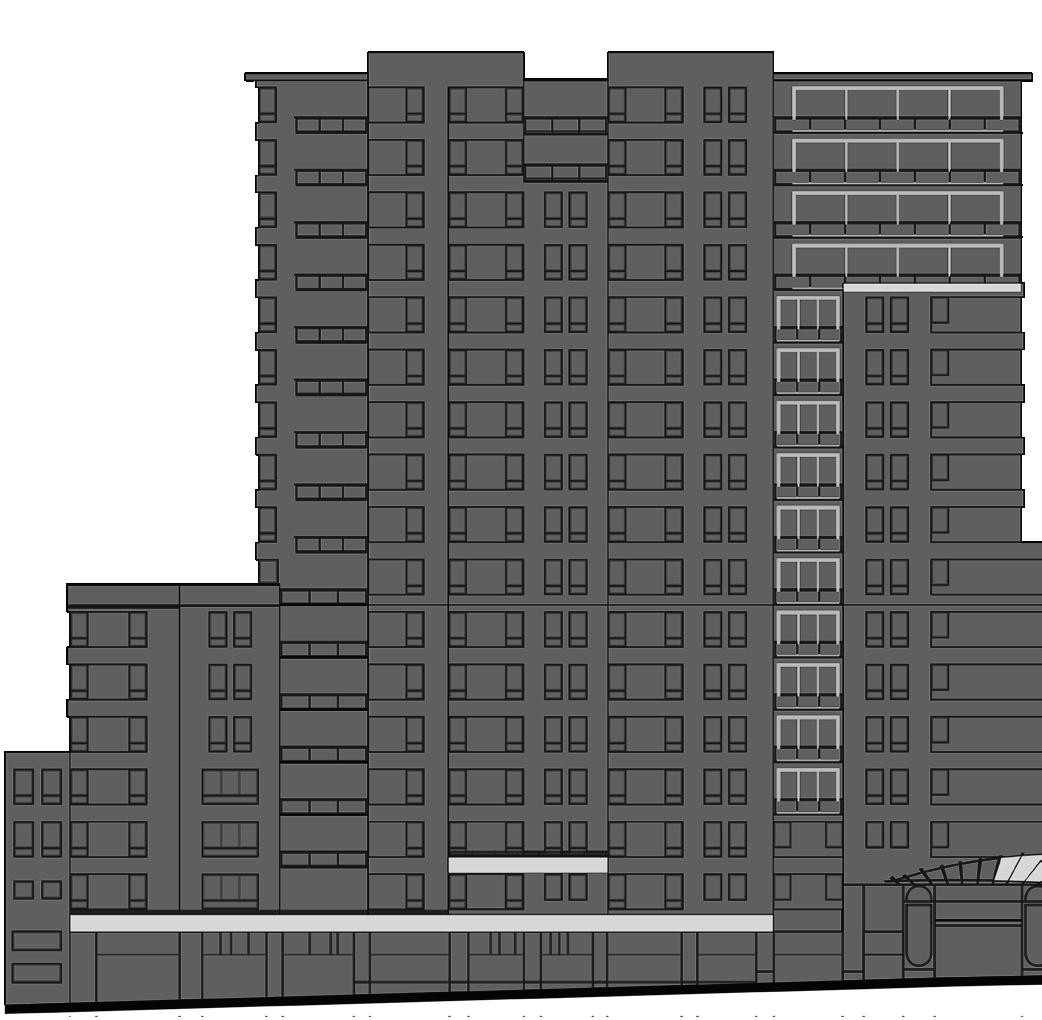
| $1,900,000 (3BR) $1122/sf
16E | $1,700,000 (2BR) $1607/sf
3H | $1,199,000 (2BR) $994/sf 2F | $1,545,000 (2BR) $1169/sf 2C | $979,000 (1BR) $935/sf 3E | $1,800,000 (2BR) $1741/sf 5G | $1,950,000 (2BR) $1490/sf
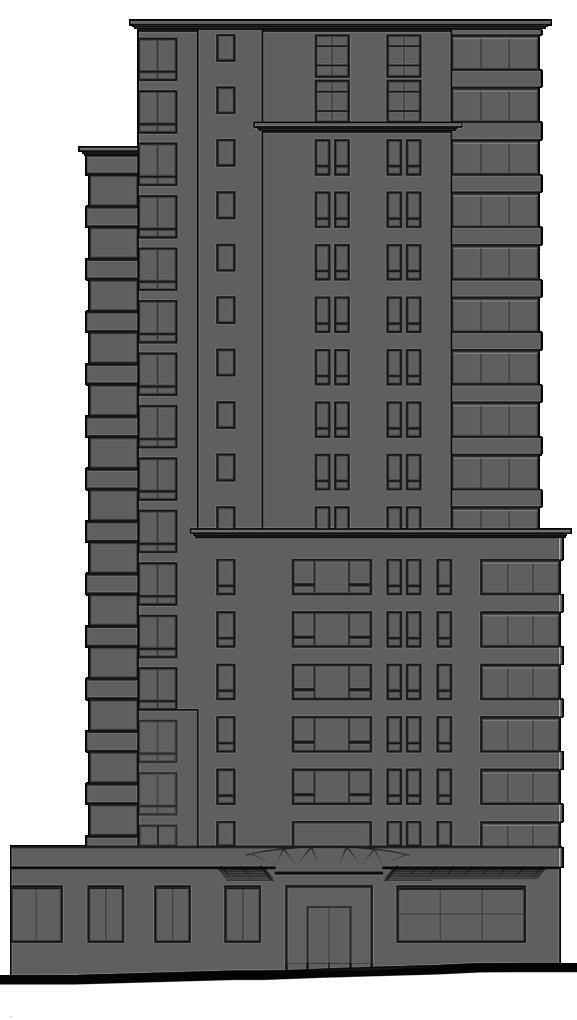
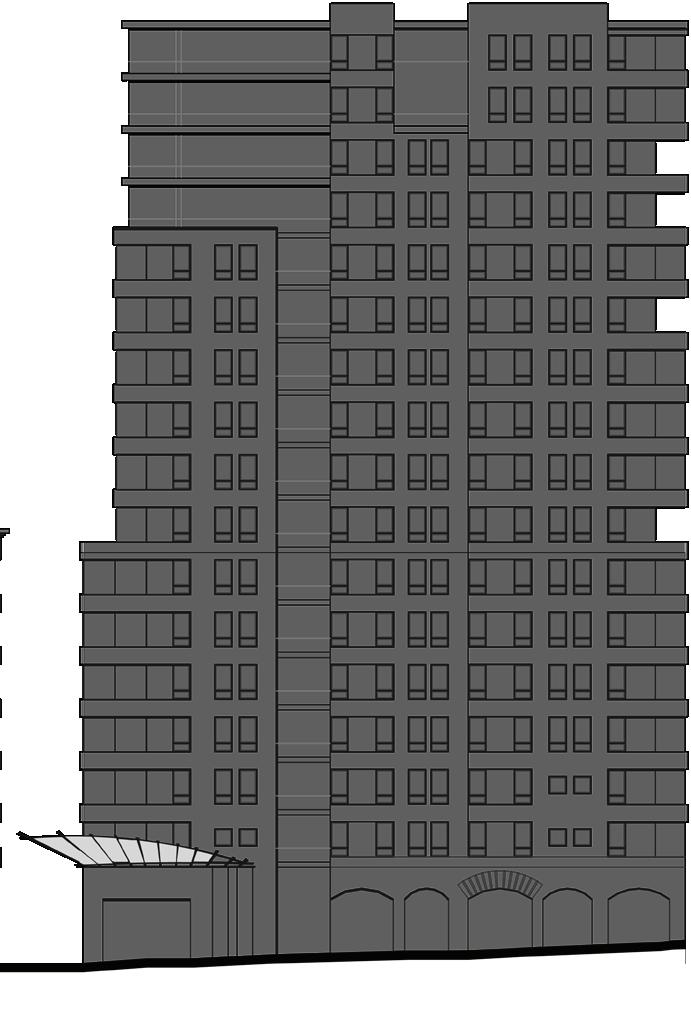
Transactions
219 / 229 / 239 Brannan
Average $/SF $1,349
Buyer Demographic
Average Days on Market 82
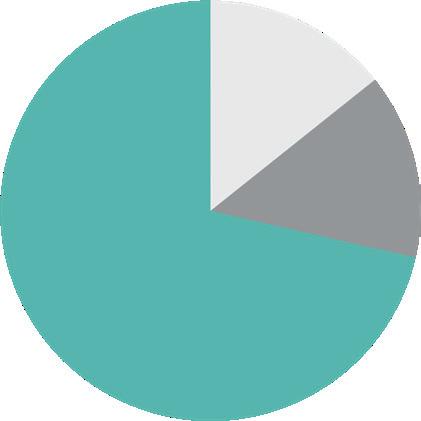
Transactions
Buyer Demographic

52D | $2,695,000 (2BR) $1209/sf
50A | $3,495,000 (3BR) $1292/sf
49B | $6,000,000 (3BR) $1810/sf
46E | $1,900,000 (2BR) $1131/sf
43D | $2,995,000 (2BR) $1534/sf
35C | 2,150,000 (2BR) $991/sf
35E | $1,690,000 (2BR) $986/sf
31F | $1,500,000 (3BR) $937/sf
29D | $2,250,000 (2BR) $1153/sf
28A | $1,289,000 (2BR) $850/sf
27C | $2,275,000 (2BR) $1222/sf
25E | $1,200,000 (2BR) $1056/sf
23H | $688,000 (1BR) $890/sf
7C | $695,000 (1BR) $834/sf
Transactions
Buyer Demographic
# of Transactions
Average Sales Price
$2,435,000 100% YOY / 135% QOQ * Median Price $2,435,000 Q2 Q1 Q4 Q3
Average $/SF $1,517
Fremont Buyer Demographic
Average Days on Market
# of Transactions
Average Sales Price $1,220,500
Median Price $1,220,500
Average $/SF $1,208 Average Days on Market 37 Buyer Demographic
# of Transactions
403 Main, 38 Bryant
Average $/SF $1,002
Buyer Demographic
Average Days on Market 22
BMRs not included in data below
Buyer Demographic
# of Transactions
Q1 Q4 Q3
Average $/SF
$1,065
Buyer Demographic
Average Days on Market
101
# of Transactions
50% YOY / 50% QOQ
$1,430,000 20% YOY / 2.5% QOQ * Median Price $1,240,000
Average $/SF $1,112
Buyer Demographic


Average Days on Market 14
# of Transactions
$1,185,667
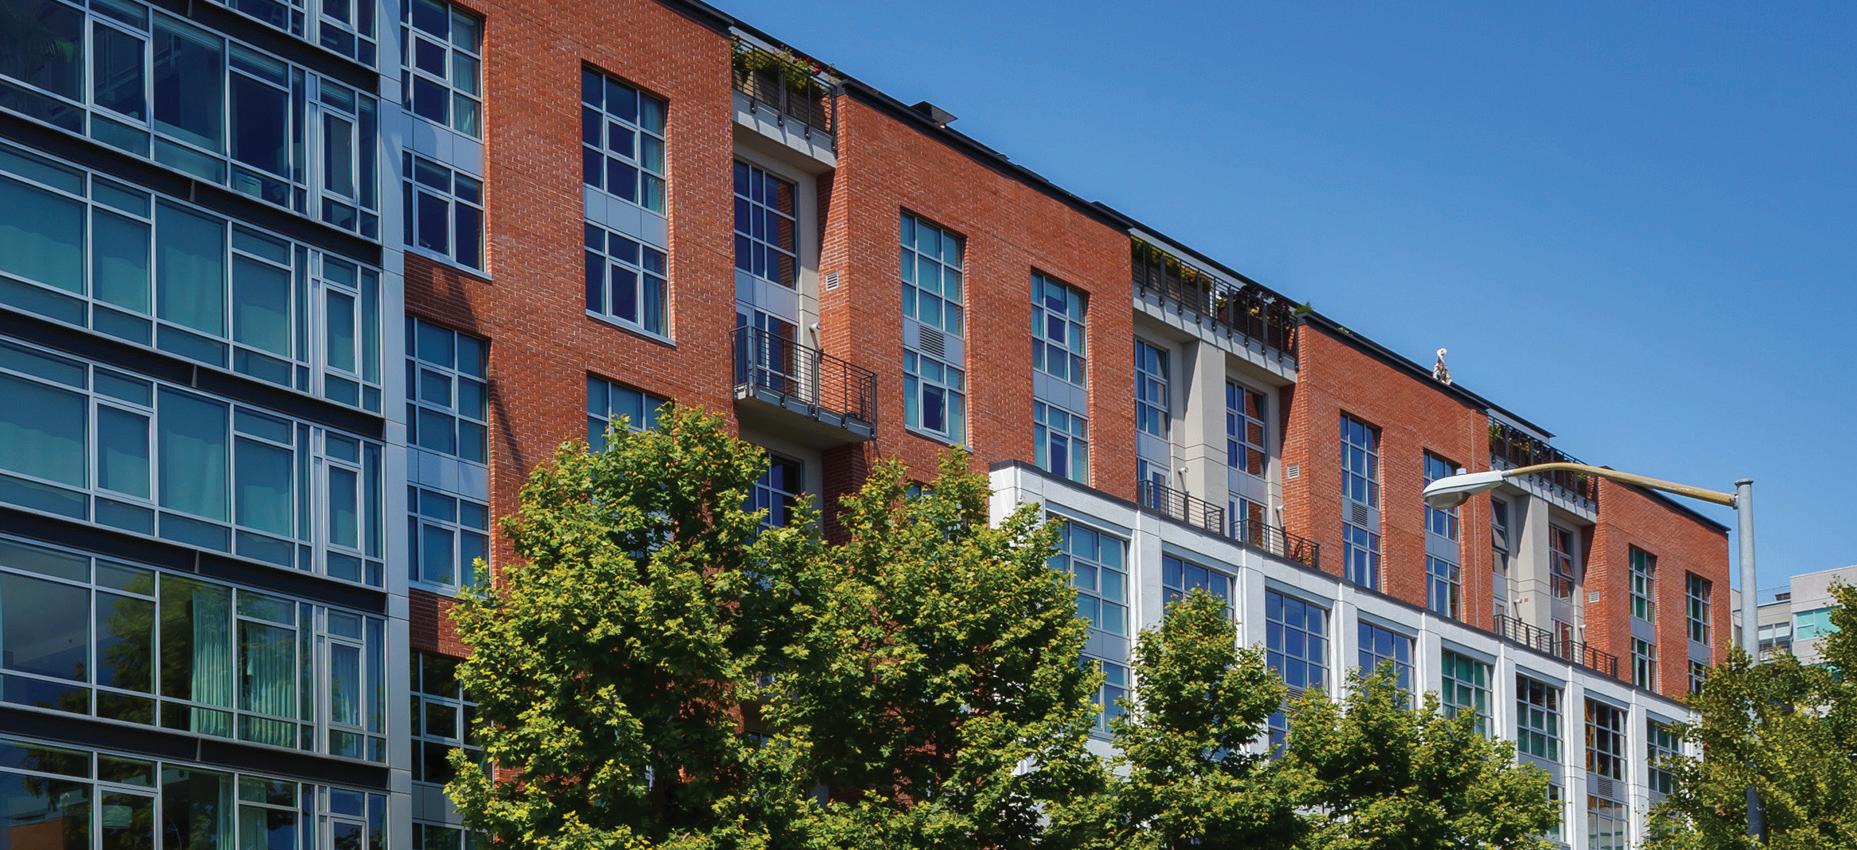
Average $/SF $926
Buyer Demographic
Average Days on Market 6
355 1st S208
501 Beale 4D
355 1st S410
401 Harrison 10D
425 1st 3604
355 1st S710
333 Beale 7F
219 Brannan 11B
333 Beale 4F
318 Spear 4K
425 1st 1208
338 Main 8H
338 Main 4D
301 Main 18G
201 Folsom 14H
401 Harrison 19A
318 Main 5D
425 1st 1907
333 Beale 8I
425 1st 4407
333 Beale 6I
338 Spear 3A
401 Harrison 5F
* Only showing sold homes in buildings featured in this book. D oes not include new construction or bmrs.
Sale Price
$450,000
$680,000
$725,000
$765,000
$775,000
$789,000
$800,000
$835,000
$850,000
$880,000
$903,000
$935,000
$938,000
$950,000
$1,010,000
$1,040,000
$1,088,000
$1,149,000
$1,185,000
$1,198,000
$1,205,000
$1,218,000
$1,225,000 $/SF
$1,041.67
$895.92 $961.54
$1,260.30
$1,280.99
$1,168.89 $869.57
$1,154.91
$923.91
$1,057.69
$1,196.03
$1,094.85 $1,132.85
$1,178.66
$1,186.84
$1,238.10
$985.51
$1,402.93 $1,199.39 $1,462.76
$1,081.69 $1,043.70 $986.31
338 Spear 6A
425 1st 1406
425 1st 3706
219 Brannan 2F
401 Harrison 13B
355 1st S1702
355 1st 1907
355 1st 2205
229 Brannan 16E
338 Main 4E
201 Folsom 21B
301 Main 12B
338 Spear 14B
338 Main 16A
219 Brannan 3G
338 Main 8B
219 Brannan 5G
239 Brannan 18J
229 Brannan 14A
318 Main 4F
338 Main 25C
425 1st 5901
403 Main 208N
400 Beale 1208
201 Harrison 904
SQFT 1,167 1,238 1,238 1,322 1,312 1,330 1,300 1,300 1,058 1,382 1,189 1,317 1,323 1,379 1,694 1,178 1,309 1,393 1,654 1,979 1,403 1,639 539 694 657
* Only showing sold homes in buildings featured in this book. D oes not include new construction or bmrs.
Sale Price
$1,250,000
$1,350,000
$1,457,000
$1,545,000
$1,565,000
$1,567,500
$1,580,000
$1,680,000
$1,700,000
$1,730,000
$1,780,000
$1,785,225
$1,791,000
$1,870,000
$1,900,000
$1,900,000
$1,950,000
$1,979,250
$2,450,000
$2,650,000
$2,725,000
$3,300,000
$540,000
$670,000
$700,000
$/SF
$1,071.12
$1,090.47
$1,176.90
$1,168.68
$1,192.84
$1,178.57
$1,215.38
$1,292.31
$1,606.81
$1,251.81
$1,497.06
$1,355.52
$1,353.74
$1,356.06
$1,121.61
$1,612.90
$1,489.69
$1,420.85 $1,481.26
$1,339.06
$1,942.27
$2,013.42
$1,001.86
$965.42 $1,065.45
1 Hawthorne 4E
200 Brannan 315
1 Hawthorne 23D
72 Townsend 501
301 Mission 303
400 Beale 208N
400 Beale 1208
201 Harrison 904
1 Hawthorne 4E
200 Brannan 315
1 Hawthorne 23D
72 Townsend 501
301 Mission 303
88 King 412
301 Mission 25E
88 King 616
200 Brannan 309
200 Brannan 212
72 Townsend 506
1 Hawthorne 17F
301 Mission 35E
88 King 1205
301 Mission 35C
301 Mission 29D
181 Fremont 56C
809 796 845 815 1,395 539 694 657 809 796 845 815 1,395 1,191 1,136 1,240 1,520 1,517 1,176 1,381 1,714 1,380 2,170 1,952 1,605
* Only showing sold homes in buildings featured in this book. D oes not include new construction or bmrs.
Sale Price
$719,000
$729,000
$797,004
$901,000
$1,000,000
$540,000
$670,000
$700,000
$719,000
$729,000
$797,004
$901,000
$1,000,000
$1,100,000
$1,200,000
$1,240,000
$1,400,000
$1,428,000
$1,540,000
$1,651,800
$1,690,000
$1,950,000
$2,150,000
$2,350,000
$943.20
$1,105.52
$716.85
$1,001.86
$965.42
$1,065.45
$888.75
$915.83
$943.20
$1,105.52
$716.85
$923.59
$1,056.34
$1,000.00
$921.05
$941.33
$1,309.52
$1,196.09
$986.00
$2,435,000 $/SF $888.75 $915.83
$1,413.04 $990.78
$1,152.66 $1.517.13
# in Contract / Sold 90+
# of Units 118 Monthly Absorption
.9 Units
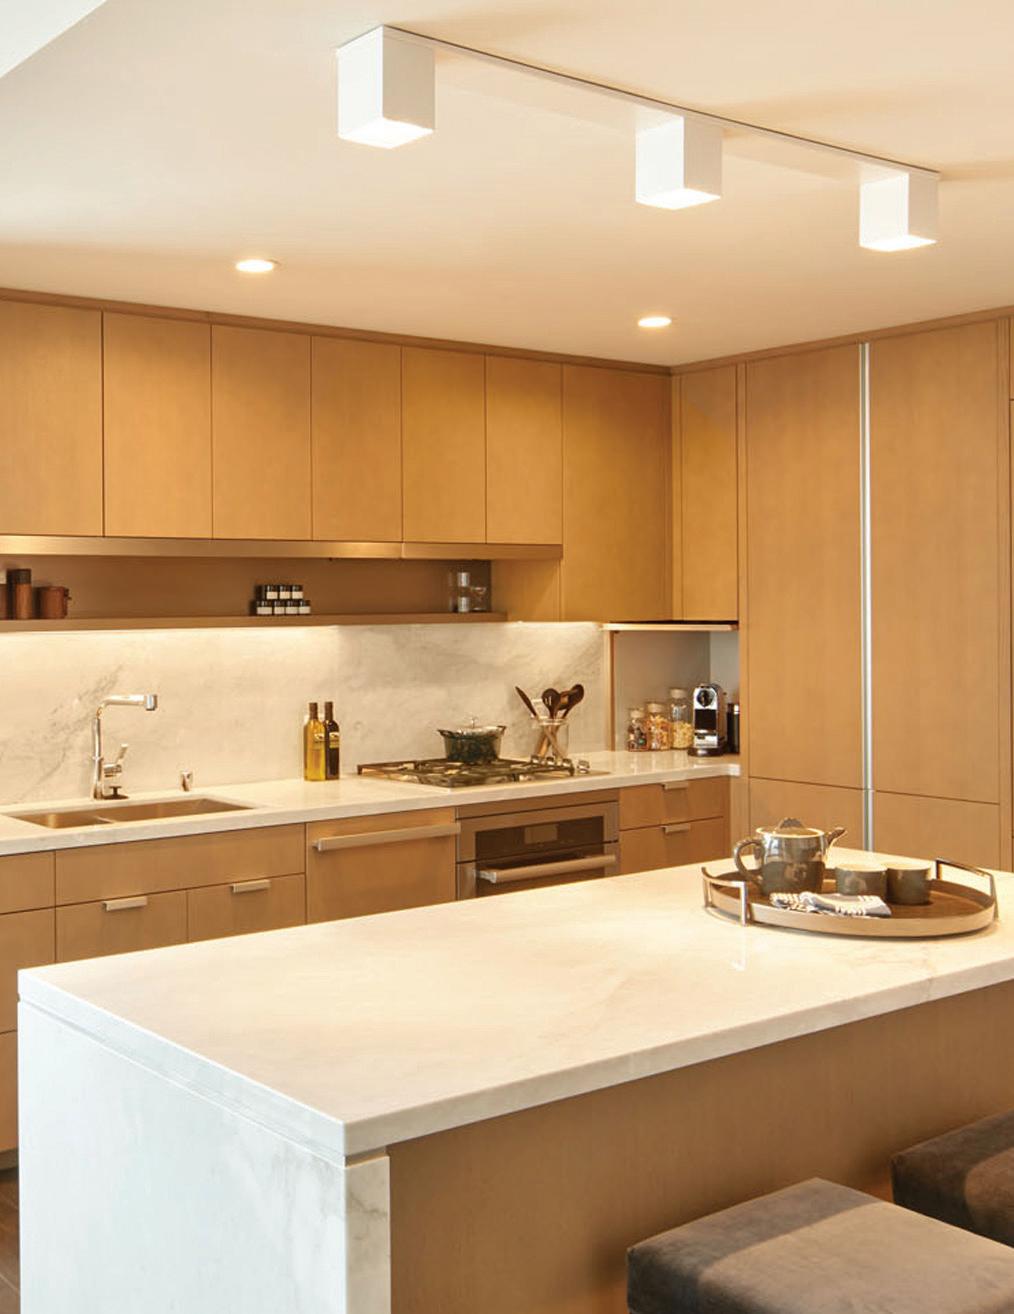
# of Units
# in Contract / Sold
43+
146 Monthly Absorption
1.1 Units
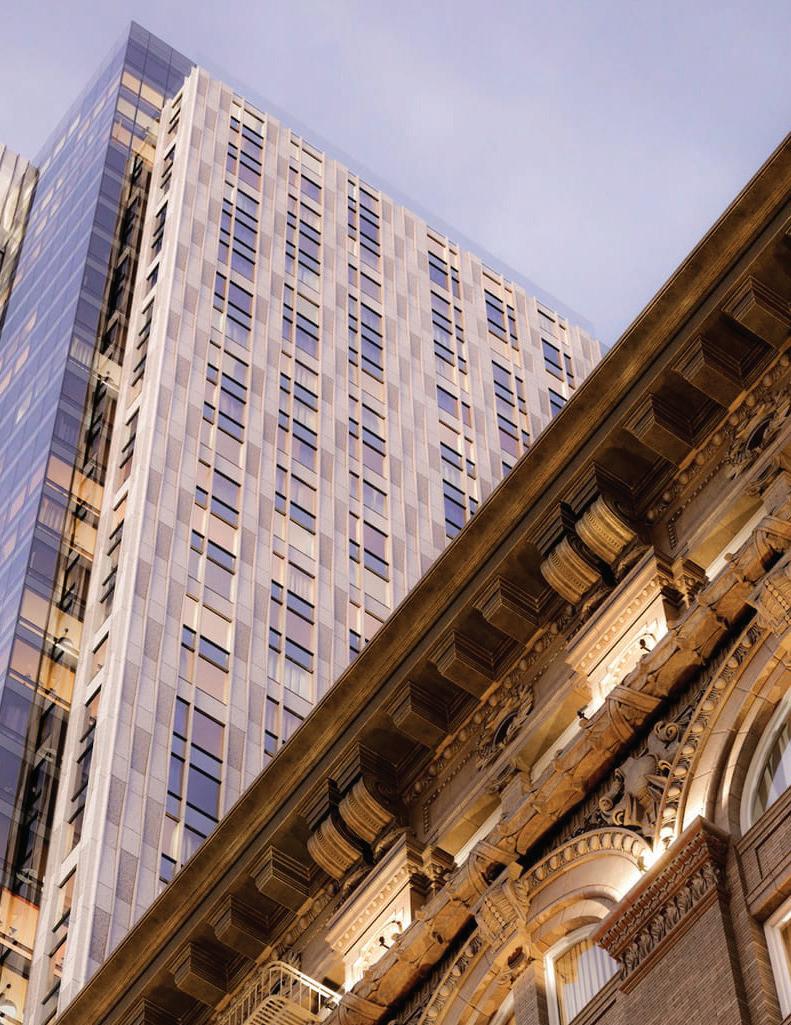
# of Units
# of Stories 20
# Sold
65+
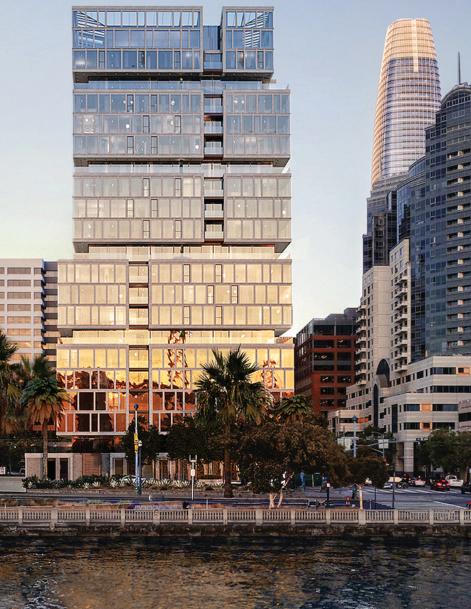
Paul Hwang Activity (2021-2026 Sales)
# of Transactions
150+
Sold Volume
$258,207,650+
Paul Hwang | 415.216.8746 | paul@skyboxrealty.com
Call me to find out how we can feature your off market listing to all of our prospective buyers in our Quarterly Reports!
Paul Hwang Leasing Activity