Dear Neighbors, Q1 closed with historically high rents and recovering home prices, alongside persistently low inventory across both sales and rentals.
As employees returned to city offices, many appeared to be settling in for long hours ahead of anticipated IPOs from local neighborhood companies like OpenAI, Anthropic, and Stripe. Bankers are also filling up office spaces. The expected June IPO of SpaceX could serve as a key bellwether for investor appetite in the IPO market—and, by extension, for housing demand.
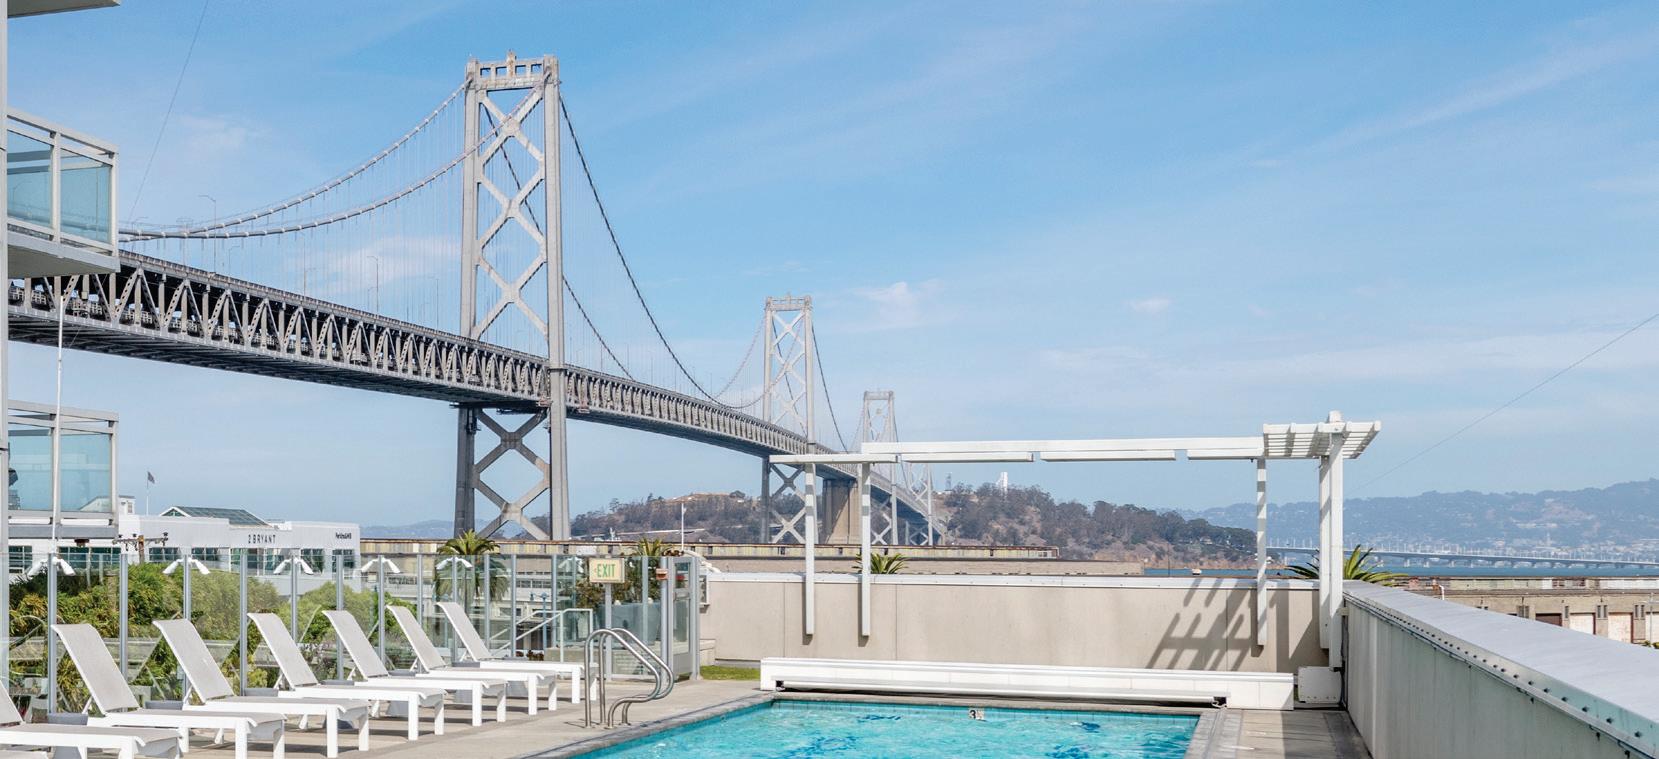
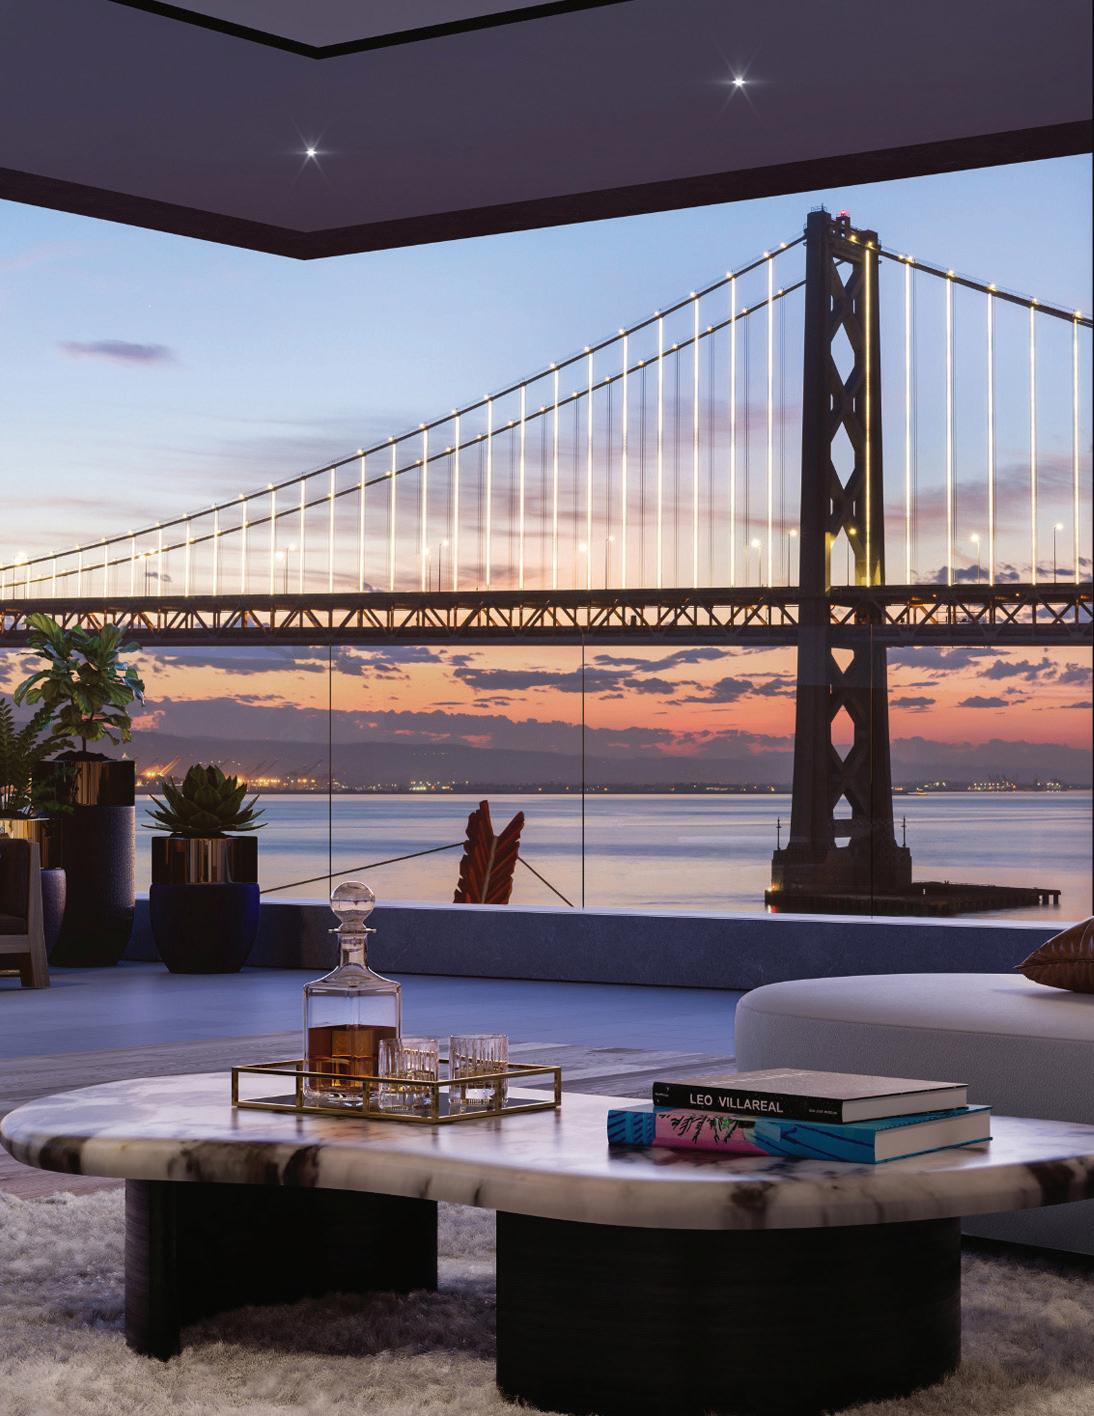
Overall, San Francisco is trending toward a safer, more vibrant, and increasingly work-focused environment. The Bay Lights are back, San Francisco stole the spotlight for the Super Bowl, and many more conventions, concerts and events filled the days.
We recommend holding for 9-12 months and reassessing (unless you could use the capital for some Pre-IPO equity!). Please contact me to discuss any of your real estate goals or needs.
Best Regards,
Paul Hwang
This document has been prepared by Skybox Realty for advertising and general information only. Skybox Realty makes no guarantees, representations or warranties of any kind, expressed or implied, regarding the information including, but not limited to, warranties of content, accuracy and reliability. Any interested party should undertake their own inquiries as to the accuracy of the information. Skybox Realty excludes unequivocally all inferred or implied terms, conditions and warranties arising out of this document and excludes all liability for loss and damages arising there from.
South Beach & Yerba Buena Q1 Snapshot
South Beach 2026 Q1 # of Transactions
52
Average Sales Price
$1,283,980
Median Price $1,134,044
Average Price per Square Foot
$1,092
Average Days on the Market
Yerba Buena 2026 Q1 # of Transactions 12
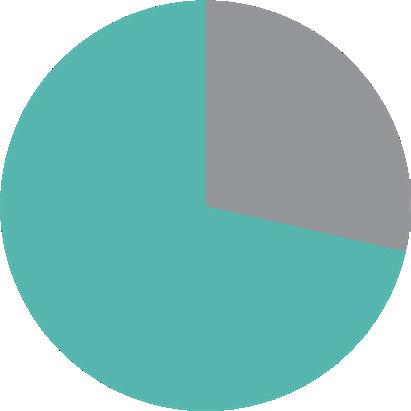
29% YOY / 25% QOQ
Average Sales Price
$1,587,208
Median Price $1,106,250
Average Price per Square Foot
$1,120
Average Days on the Market
46
Historical Data * Includes new construction marketed on MLS.
SOUTH BEACH YERBA BUENA
The Infinity D3A | $1,258,000 (2BR) $1078/sf
A4H | $940,000 (1BR) $1124/sf
A4K | $950,000 (1BR) $1142/sf
D9E | $1,289,000 (2BR) $1124/sf
D14B | $1,895,000 (2BR) $1432/sf
| $949,000 (1BR) $1139/sf
B37B | $8,395,000 (3BR) $2482/sf
| $3,000,000 (3BR) $1859/sf
B30A | $2,060,000 (2BR) $1625/sf
B24B | $2,000,000 (2BR) $1519/sf
B18G | $1,038,888 (1BR) $1289/sf
| $1,700,000 (2BR) $1291/sf
B12B | $1,600,000 (2BR) $1215/sf
| $1,599,000 (2BR) $1223/sf
| $1,389,000 (2BR) $1058/sf
C4G
B5G
B16H
B34B
B10F
# of Transactions
301 / 333 Main, 318 / 338 Spear
Average $/SF
$1,391
Buyer Demographic
Average Days on Market
Lumina | $1,200,000 (1BR) $1246/sf
| $2,699,000 (2BR) $1924/sf
D28D
C4F | $879,000 (1BR) $955/sf
D25C
| $1,175,000 (1BR) $1331/sf
| $2,068,000 (2BR) $1476/sf
| $1,850,000 (2BR) $1556/sf
| $1,888,000 (2BR) $1382/sf
| $999,000 (1BR) $1174/sf
B20E
A8C
B22G
B21B
B14H
318 / 338 Main, 333 Beale, 201 Folsom
Average $/SF $1,368
Average Days on Market 53
Buyer Demographic
31A | $2,200,000 (2BR) $1478/sf 31C | $1,850,000 (2BR) $1457/sf
24F | $1,450,000 (1BR) $1842/sf
17E | $1,995,000 (2BR) $1539/sf
8J | $1,875,000 (2BR) $1383/sf
1B | $780,000 (2BR) $818/sf
# of Transactions
Average Sales Price $2,025,000 16% YOY / 100% QOQ * Median Price $2,025,000
Average $/SF $1,467
Buyer Demographic
Average Days on Market 8
The Harrison 23A | $1,098,000 (1BR) $1307/sf
19A | $1,100,000 (1BR) $1310/sf 18B | $1,875,000 (2BR) $1430/sf
14A | $995,000 (1BR) $1185/sf 10D | $765,000 (1BR) $1260/sf
13B | $1,580,000 (2BR) $1204/sf
7G | $883,000 (1BR) $1078/sf
6C | $1,380,000 (2BR) $1071/sf
5F | $1,199,000 (2BR) $965/sf
# of Transactions
Average $/SF $1,074
Buyer Demographic Average Days on Market 77
One Rincon Hill 3703 | $1,799,000 (2BR) $1408/sf
One Rincon Hill 425 1st, 489 Harrison
Average $/SF $1,154
Average Days on Market 22
Buyer Demographic
# of Transactions
---- YOY / ---- QOQ
$1,250,833 191% YOY / .5% QOQ * Median Price $1,190,000 Q1 Q4 Q3 Q2
333 / 355 1st
Average $/SF $1,182
Buyer Demographic
Average Days on Market 72
Watermark # of Transactions
* BMRs not included in data below
Average $/SF
$1,057
Buyer Demographic
Average Days on Market
160
The Brannan 16K | $2,080,000 (2BR) $1699/sf
12B | $827,000 (1BR) $1144/sf
5G | $1,999,000 (2BR) $1527/sf
3G | $2,099,000 (3BR) $1239/sf
3H | $1,248,000 (2BR) $1035/sf
2F | $1,699,999 (2BR) $1286/sf
16E | $1,795,000 (2BR) $1697/sf
15A | $2,350,000 (3BR) $1416/sf
3E | $1,800,000 (2BR) $1741/sf
2C | $930,000 (1BR) $888/sf
14A | $2,395,000 (3BR) $1456/sf
of Transactions
Average $/SF $1,149
Buyer Demographic
Average Days on Market 20
One Hawthorne 23D | $925,000 (1BR) $1095/sf
17F | $1,650,000 (2BR) $1195/sf
One Buyer Demographic
Millennium Tower Transactions
$2,810,000
Average $/SF $1,440
Buyer Demographic
Average Days on Market 224
181 Fremont 58A | $4,100,000 (2BR) $2129/sf
56C | $2,595,000 (2BR) $1617/sf
54J | $1,185,000 (1BR) $1785/sf
54M | $1,037,500 (1BR) $1558/sf
181 Fremont Resales # of Transactions
Average Sales Price
$1,037,500 100% YOY / 78% QOQ * Median Price $1,037,500 Q1 Q4 Q3 Q2
Average $/SF $1,558
Buyer Demographic
Average Days on Market
72 Townsend 501 | $899,000 (1BR) $1103/sf
806 | $895,000 (1BR) $984/sf
| $549,000 (1BR) $1019/sf
403 Main, 38 Bryant Buyer Demographic
Bridgeview BMRs not included in data below
Buyer Demographic
Baycrest Transactions
Average $/SF
$1,033
Buyer Demographic
Average Days on Market 29
The Towers # of Transactions
Average $/SF $1,197
Average Days on Market 43
Buyer Demographic
200 Brannan # of Transactions
Buyer Demographic
2026 Q1 Sales Address 501 Beale 10E
333 1st 1105
219 Brannan 12B
401 Harrison 7G
229 Brannan 2C
318 Spear 4H
425 1st 1107
333 1st 901
338 Main 28D
501 Beale 8B
401 Harrison 6C
301 Main 5G
301 Main 16H
501 Beale 20A
355 1st S2503
280 Spear 31C
301 Main 30A
229 Brannan 15A
301 Main 34B
/
759 709 723 819 1,047 836 819 1,032 963 1,019 1,289 1,313 1,317 1,469 1,480 1,270 1,268 1,660 1,614
* Only showing sold homes in buildings featured in this book. Does not include new construction or bmrs.
Sale Price
$590,000
$812,500
$827,000
$883,000
$930,000
$940,000
$945,000
$1,190,000
$1,200,000
$1,250,000
$1,380,000
$1,389,000
$1,700,000
$1,715,000
$1,750,000
$1,850,000
$2,060,000
$2,350,000
$3,000,000
$1,124.40 $1,153.85
$1,153.10
$1,246.11
$1,226.69
$1,070.60
$1,057.88
$1,290.81 $1,167.46 $1,182.43 $1,456.69
$1,624.61 $1,415.66 $1,858.74
2026 Q1 Sales Cont... Address 400 Beale 1102
400 Beale 1109
201 Harrison 731
400 Beale 801
400 Beale 2006
88 King 807
88 King 907
301 Mission 40D
/ 1.5 2 / 2 2 / 2 2 / 3 SQFT 675 725 736 1,223 1,215 1,165 1,165 1,952
/
* Only showing sold homes in buildings featured in this book. Does not include new construction or bmrs. Sale Price
$665,000
$690,000
$760,000
$850,000
$1,078,088
$1,310,000
$1,480,000
$2,810,000
# of Units
# in Contract / Sold
Monthly Absorption
.8 Units
Four Seasons Residences # of Units
# in Contract / Sold
42+
146 Monthly Absorption
1.1 Units
One Steuart Lane # of Units
# of Stories 20
# Sold 60+
Paul Hwang Paul Hwang Activity (2021-2026 Sales)
# of Transactions
146+
Sold Volume
$250,608,650+
Paul Hwang | 415.216.8746 | paul@skyboxrealty.com
Call me to find out how we can feature your off market listing to all of our prospective buyers in our Quarterly Reports!
Paul Hwang Leasing Activity