Dear Neighbors,
Rents in MIssion Bay are at historical highs and may be tapering off, fueled by high-income hiring from local AI companies. While sales have increased, they haven’t yet kept pace with rental growth.
Q2 year-over-year data for Mission Bay shows: - Sales increased by 39%.
- Average days on market declined by 24%.
- Average price per square foot increased by 4.5%.
Low inventory and high rents are currently pushing sales higher. I expect sales to accelerate into 2027, running in parallel with AI equities. The high-end market is currently outperforming both entry-level and mid-level properties. If you have a use for the capital it is a great time to sell. If you do not have any plans for the money from a sale then reassess the market in 2027, as we may be at the beginning of a new up cycle for San Francisco. We offer a full line of services (selling, buying, leasing, property management) for your real estate needs and are staffed 7 days a week. We look forward to serving you and seeing you in the neighborhood..
Best
Regards, Paul Hwang
This document has been prepared by Skybox Realty for advertising and general information only. Skybox Realty makes no guarantees, representations or warranties of any kind, expressed or implied, regarding the information including, but not limited to, warranties of content, accuracy and reliability. Any interested party should undertake their own inquiries as to the accuracy of the information. Skybox Realty excludes unequivocally all inferred or implied terms, conditions and warranties arising out of this document and excludes all liability for loss and damages arising there from.


BLVD
Mariposa

Mission Bay 2026 Q2
# of Transactions 32
Average Sales Price $1,291,594
Average Price per Square Foot
$1,142
Average Days on the Market 25
516 | $1,762,000 (3BR) $1094/sf
# of Transactions
Average Sales Price $1,762,000
Average $/SF $1,094
Buyer Demographic
Average Days on Market 9
512 | $1,299,000 (2BR)
320 | $1,275,000 (2BR) $1214/sf
# of Transactions
Average $/SF $1,003
Buyer Demographic
Average Days on Market 37
Arterra
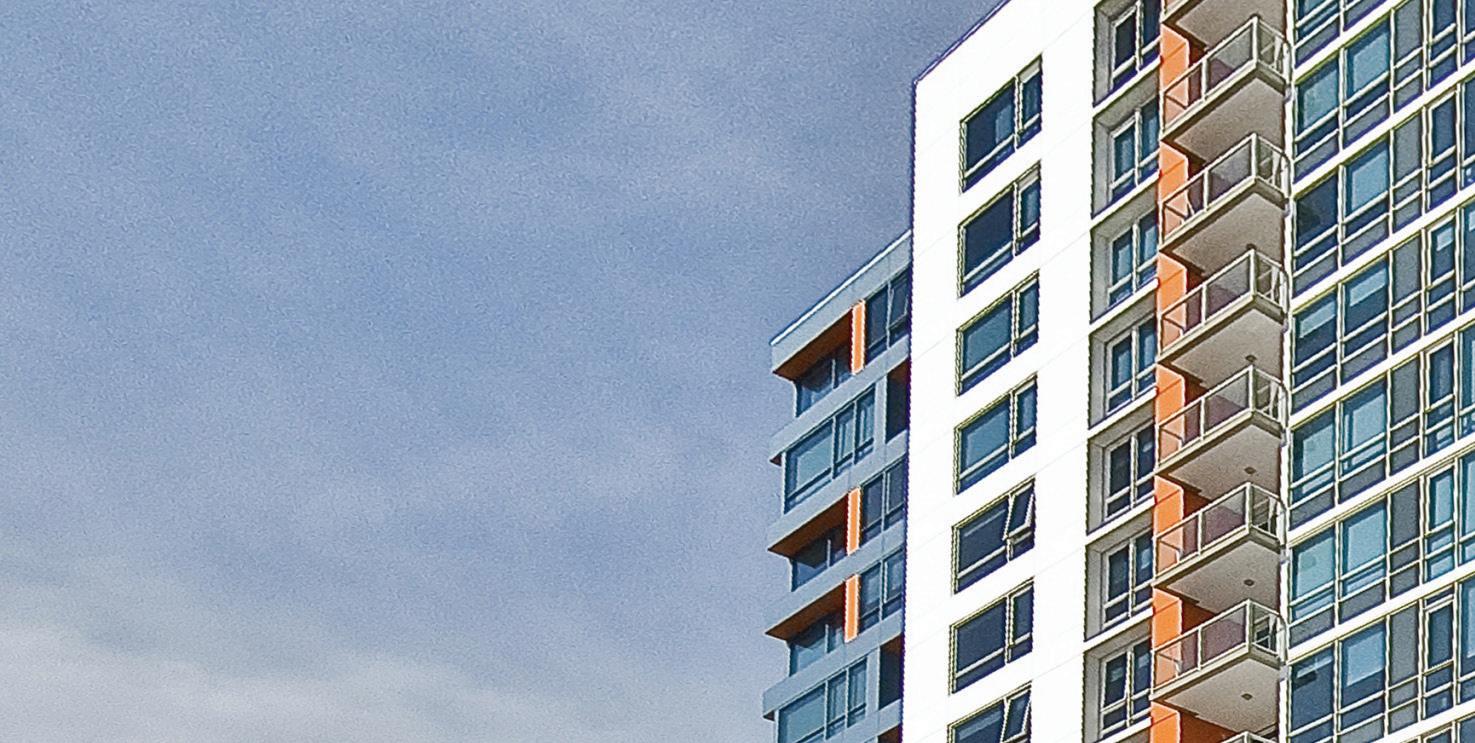
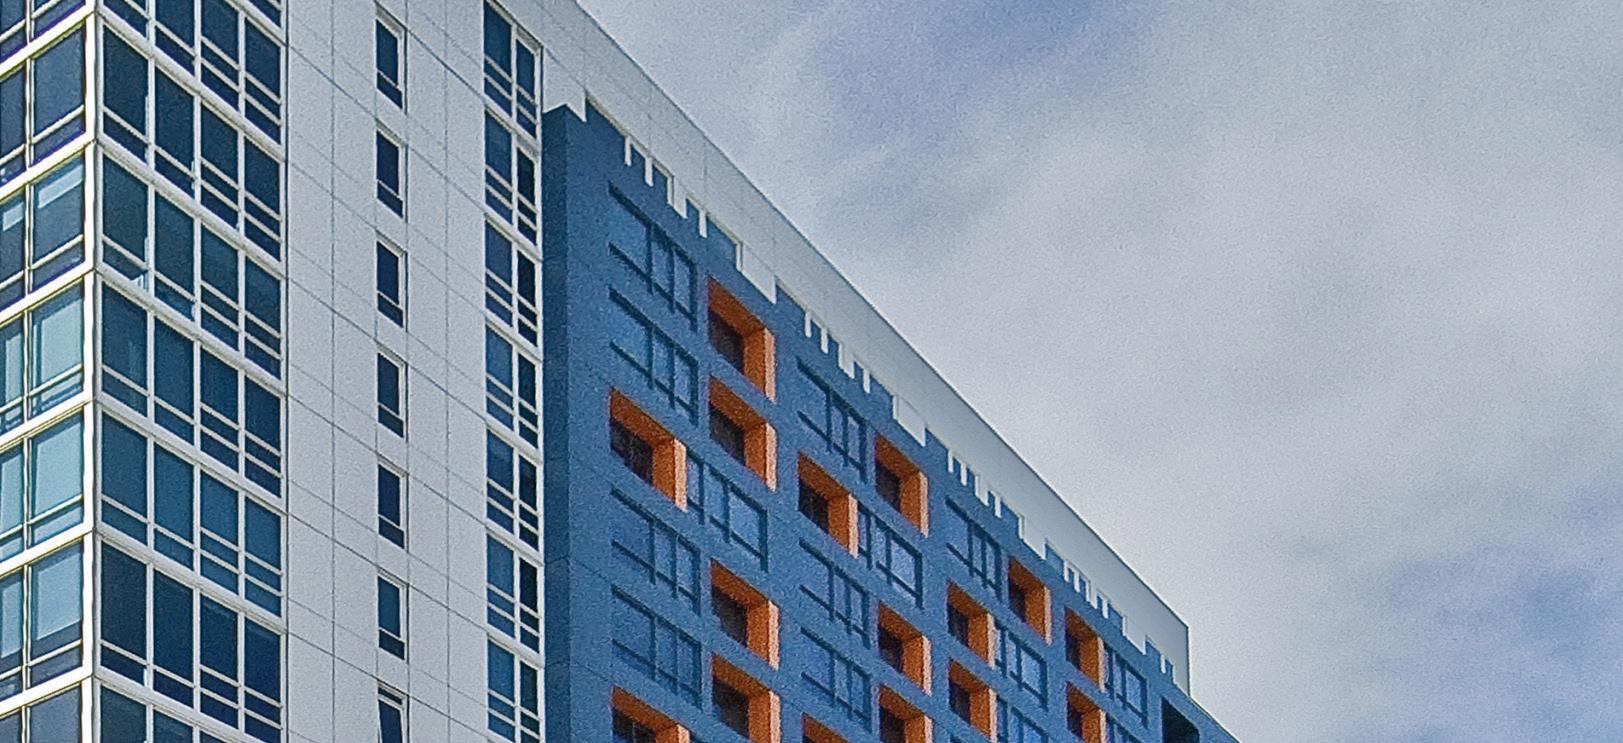
Average $/SF $1,016 Average Days on Market 20
Buyer Demographic
Park Terrace
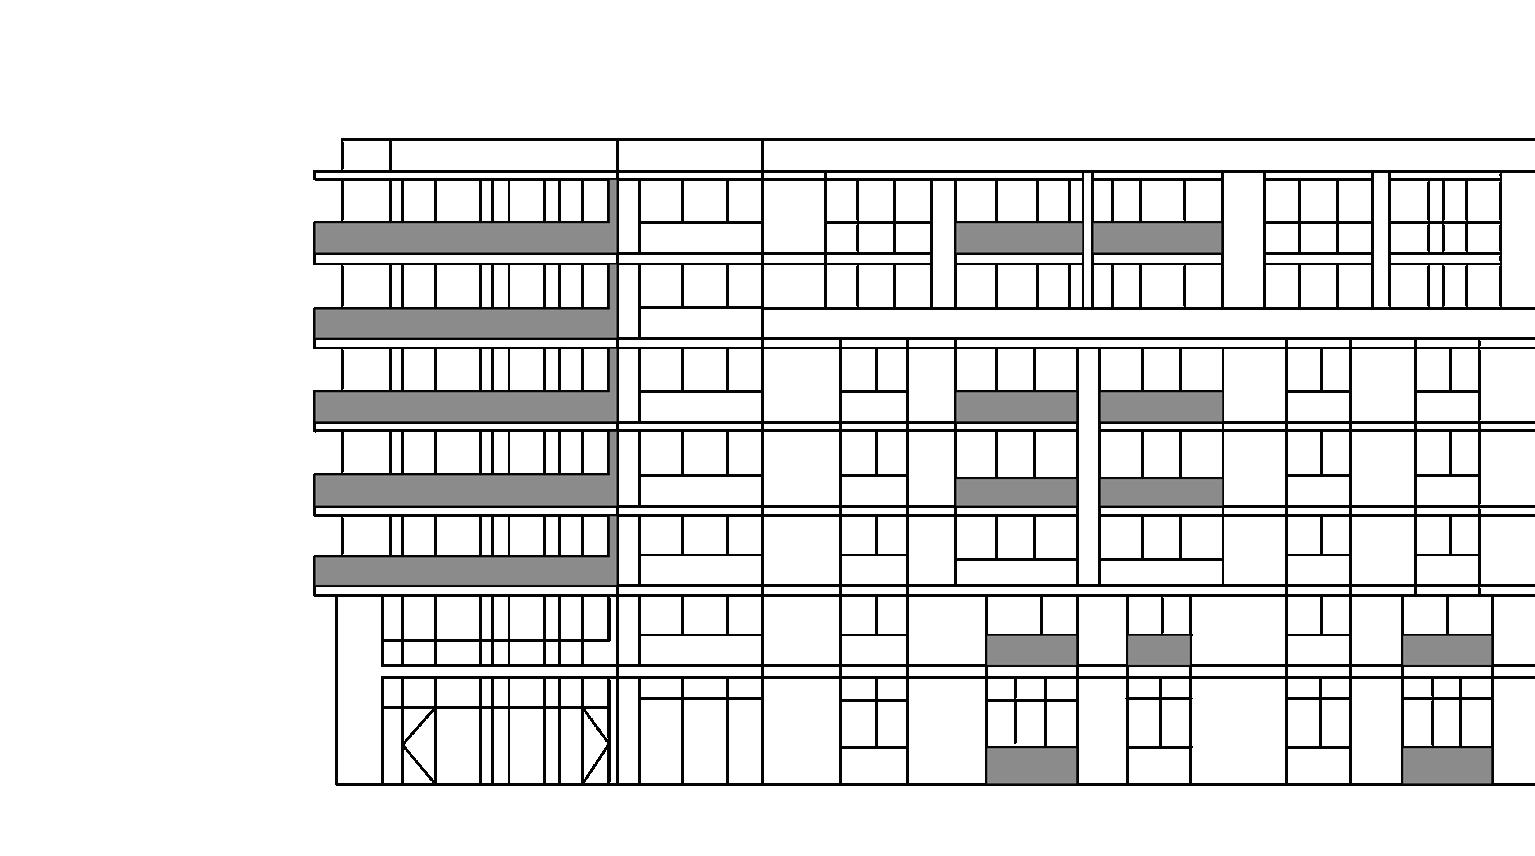
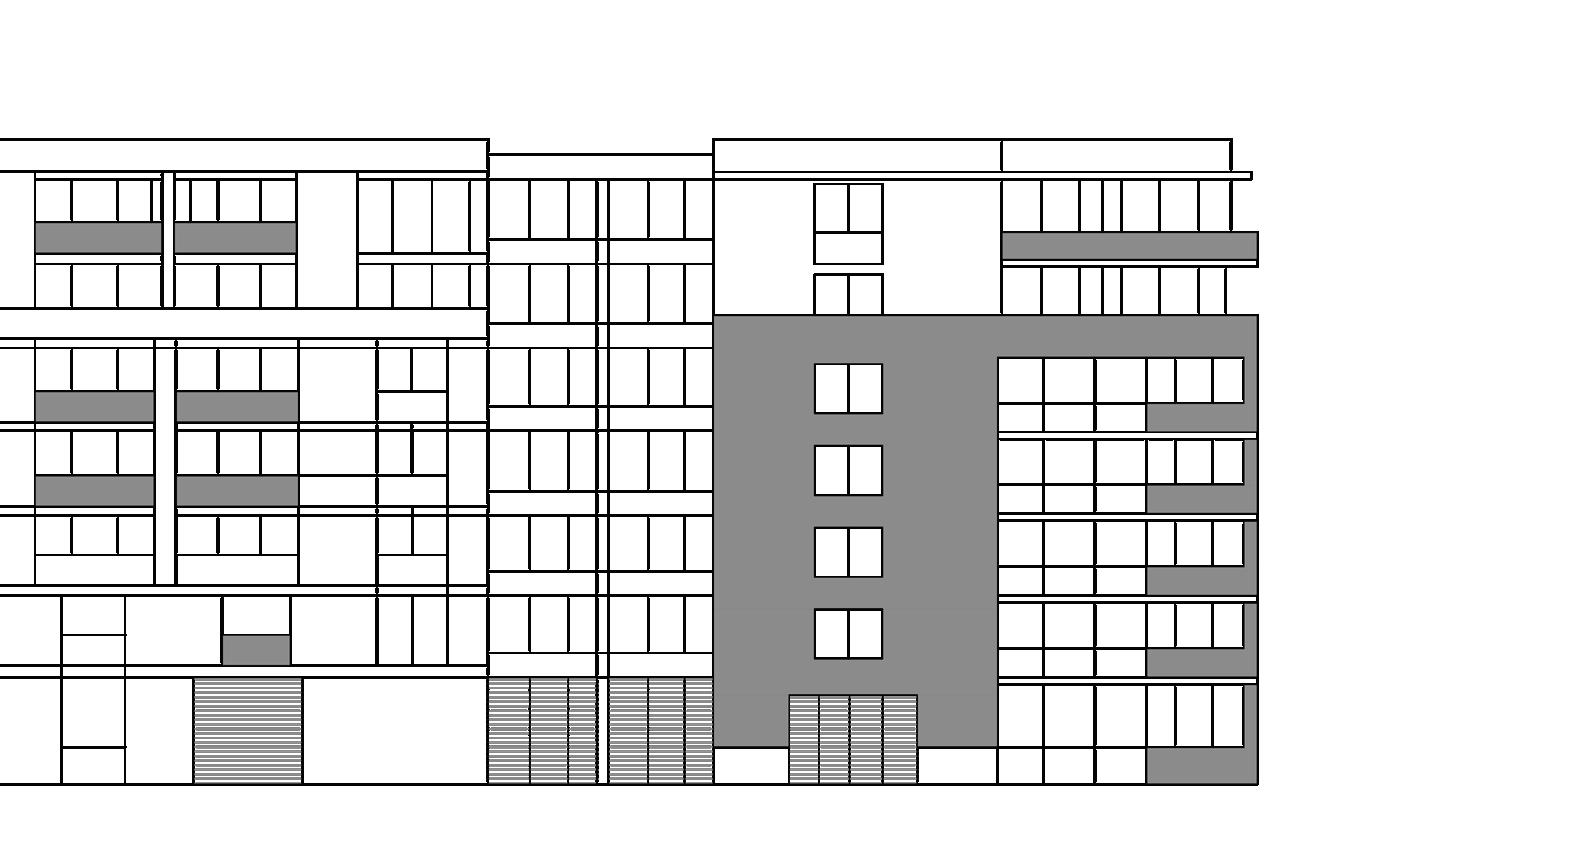
717 | $859,000 (1BR) $1159/sf
Average $/SF
$1,072
Buyer Demographic
Average Days on Market 45
250 / 260 King Average $/SF
Average Days on Market
Buyer Demographic
401 | $1,250,000 (1BR) $1189/sf
| $960,000 (1BR) $1139/sf
| $1,500,000 (2BR) $1204/sf
Transactions
$1,320,000 23% YOY / 24% QOQ * Median Price $1,250,000 Q2 Q1 Q4 Q3
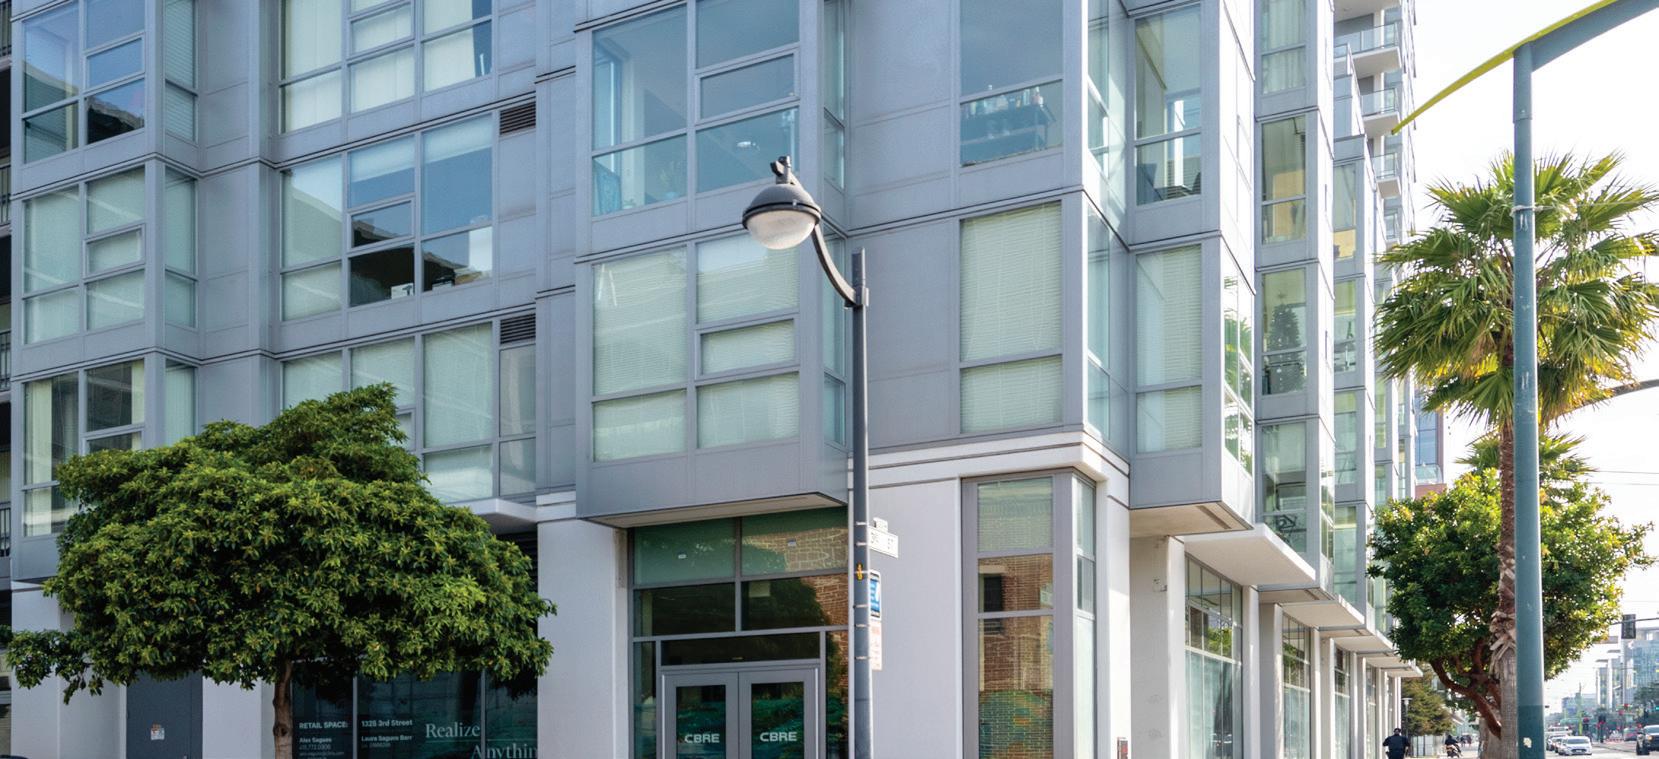
420 / 480 Mission Bay, 435 China Basin
Average $/SF $1,244
Buyer Demographic
Average Days on Market 11
Radiance
509 | $1,195,000 (1BR) $----/sf
802 | $2,060,000 (2BR) $1272/sf
Radiance
# of Transactions
$2,060,000
330 Mission Bay, 325 China Basin
Average $/SF $1,272
Buyer Demographic
Average Days on Market 12
| $2,090,000 (2BR) $1339/sf
| $1,820,000 (2BR) $1383/sf 714 | $1,580,000 (2BR) $1443/sf
1303 | $3,550,000 (3BR) $1813/sf
205 | $1,820,000 (2BR) $1267/sf
212 | $1,810,000 (2BR) $1380/sf
# of Transactions
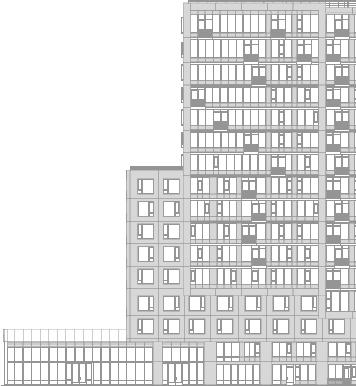
708 / 718 Long Bridge
Average $/SF $1,471 Average Days on Market 18
Buyer Demographic
One Mission Bay
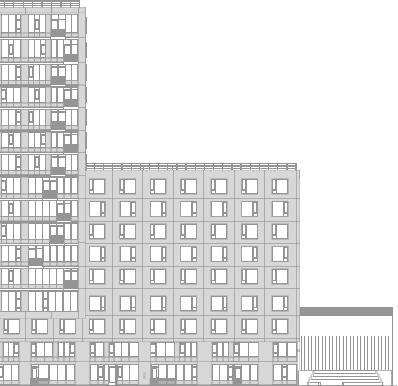
One Mission Bay
of Transactions
1000 3rd, 110 Channel
Average $/SF $1,291 Average Days on Market 24
Buyer Demographic
2026 Q2 Sales
Address
260 King 373
300 Berry 1307
260 King 915
300 Berry 902
260 King 1009
250 King 1206
300 Berry 907
300 Berry 604
325 Berry 717
325 Berry 326
260 King 671
435 China Basin 210
1000 3rd 720
110 Channel 628
110 Channel 526
250 King 544
420 Mission Bay 401
260 King 959
255 Berry 512
250 King 602
255 Berry 103
110 Channel 606
814 732 903 728 823 982 732 851 741 907 987 843 804 833 835 1,112 1,051 1,290 1,277 1,475 1,324 1,070
* Only showing sold homes in buildings featured in this book. D oes not include new construction or bmrs.
Sale Price
$680,000
$699,000
$730,000
$763,000
$790,000
$795,000
$800,000 825,000
$845,000
$910,000
$915,000
$960,000
$970,000
$980,000
$998,000
$1,000,000
$1,250,000
$1,299,000
$1,299,000
$1,299,000
$1,310,000
$1,563,000
$835.38 $954.92 $808.42 $1,048.08 $959.90 $809.57
$1,092.90 $969.45
$1,140.35
$1,003.31
$927.05 $1,138.79
$1,206.47 $1,176.47 $1,195.21 $899.28 $1,189.34 $1,006.98
$1,017.23 $880.68 $989.43 $1,460.75
2026 Q2 Sales cont...
Address
708 Long Bridge 714
1000 3rd 505
100 3rd 1206
435 China Basin 330
235 Berry 516
708 Long Bridge 212
708 Long Bridge 210
330 Mission Bay 802
718 Long Bridge 805
718 Long Bridge 1303
1,095 1,123 1,267 1,361 1,610 1,312 1,316 1,620 1,561 1,958
* Only showing sold homes in buildings featured in this book. D oes not include new construction or bmrs.
$1,599,000
$1,580,000
$1,649,000
$1,750,000
$1,762,000
$1,810,000
$1,820,000
$2,060,000
$2,090,000
$3,550,000
$1,301.50 $1,404.49 $1,094.41
$1,379.57
$1,382.98
$1,271.60
$1,338.89
$1,813.07
Paul Hwang
Paul Hwang Activity (2021-2026 Sales)
# of Transactions
150+
Sold Volume
$258,207,650+
Paul Hwang | 415.216.8746 | paul@skyboxrealty.com
Call me to find out how we can feature your off market listing to all of our prospective buyers in our Quarterly Reports!
Paul Hwang Leasing Activity